Pay vs Performance Disclosure - USD ($)
Mar. 28, 2026
Mar. 29, 2025
Mar. 30, 2024
Apr. 01, 2023
Apr. 02, 2022
Pay versus Performance
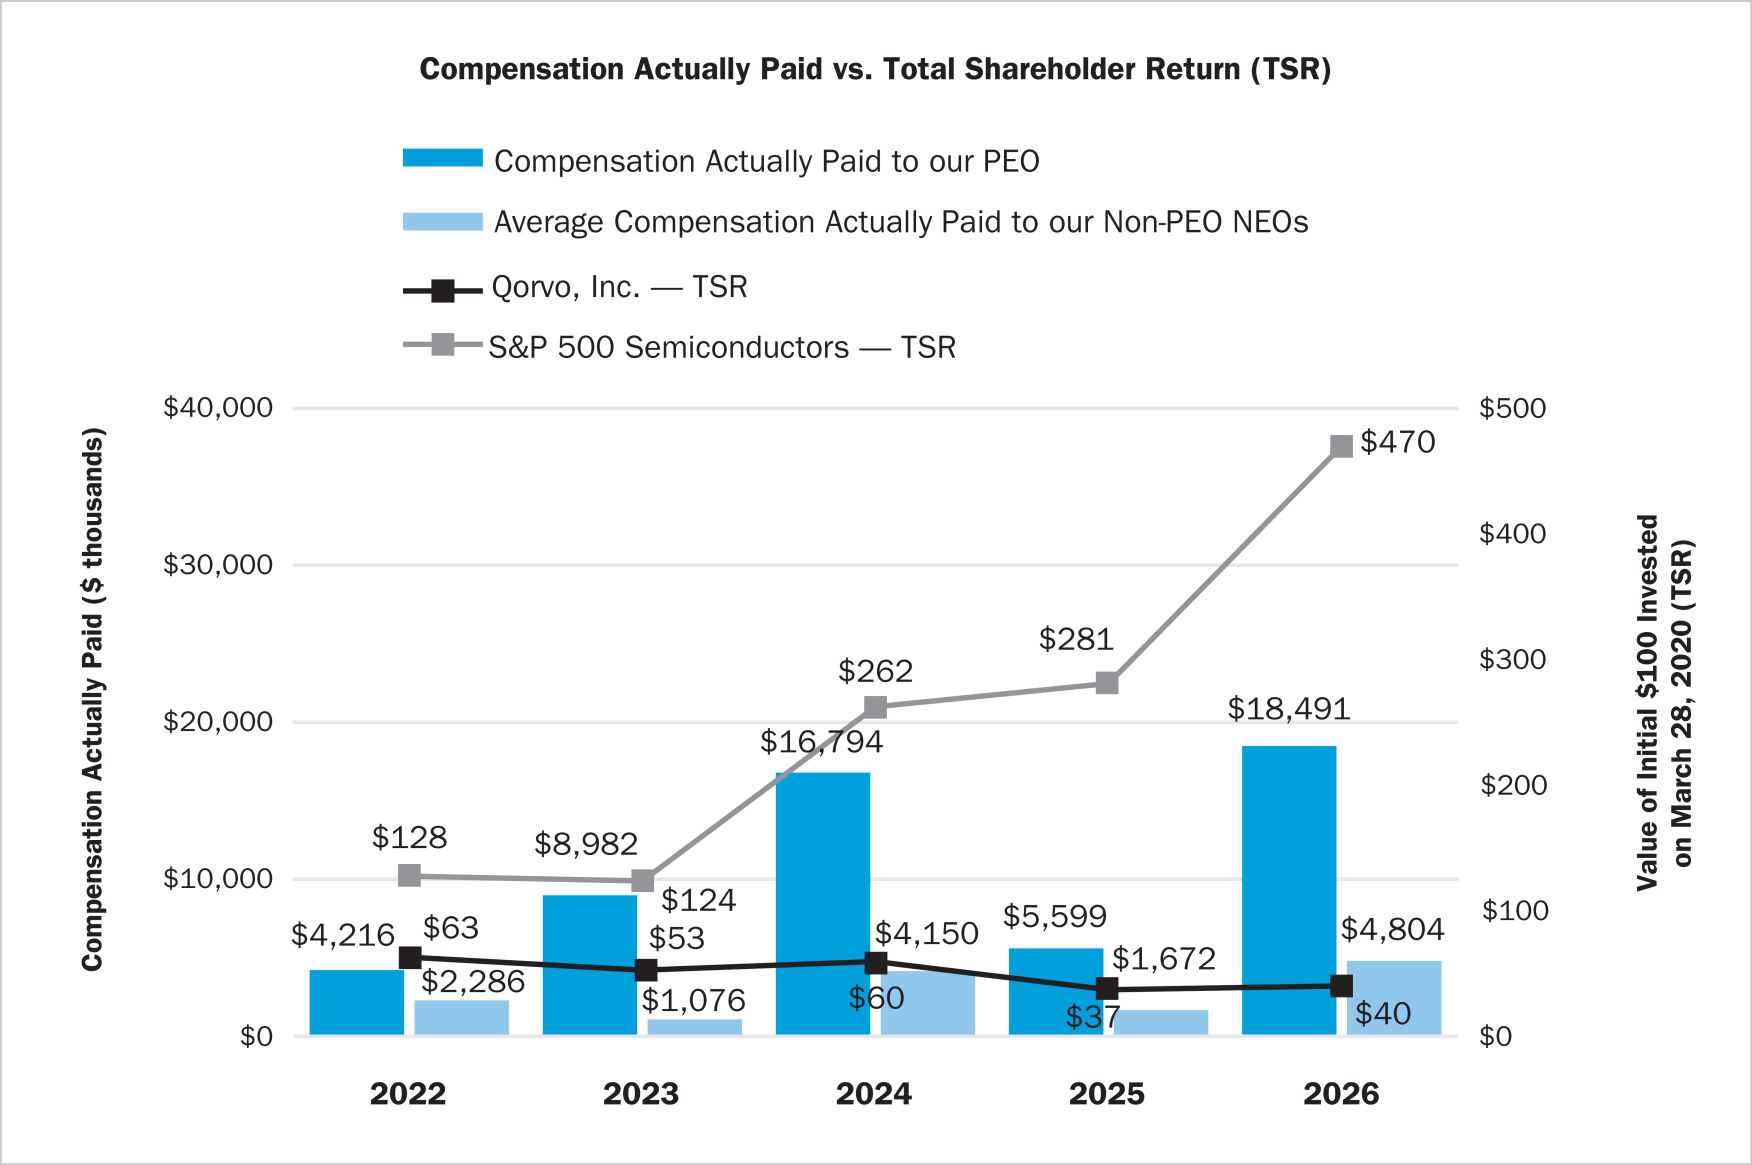
As required by SEC rules, we are providing the following disclosure regarding executive “compensation actually paid” and certain Company performance measures for the fiscal years listed below. As indicated below, calculation of the “compensation actually paid” differs significantly from the calculation of total compensation as presented in the Summary Compensation Table. Please refer to the Compensation Discussion and Analysis and related tables and narrative disclosures for more information regarding
the
Company’s executive compensation philosophy and programs
and the Compensation Committee’s decision-making process related to executive compensation matters. Pay vs Performance Table
Year |
Summary Compensation Table Total for PEO 1 |
Compensation Actually Paid to PEO 1,2 |
Average Summary Compensation Table Total for Non-PEO NEOs 1 |
Average Compensation Actually Paid to Non-PEO NEOs 1,2 |
Value of Initial Fixed $100 Investment Based On: |
Net Income ($ millions) 5 |
Non-GAAP Operating Income (CSM) ($ millions) 6 |
|||||||||||||||||||||||||
TSR 3 |
Peer Group TSR 4 |
|||||||||||||||||||||||||||||||
2026 |
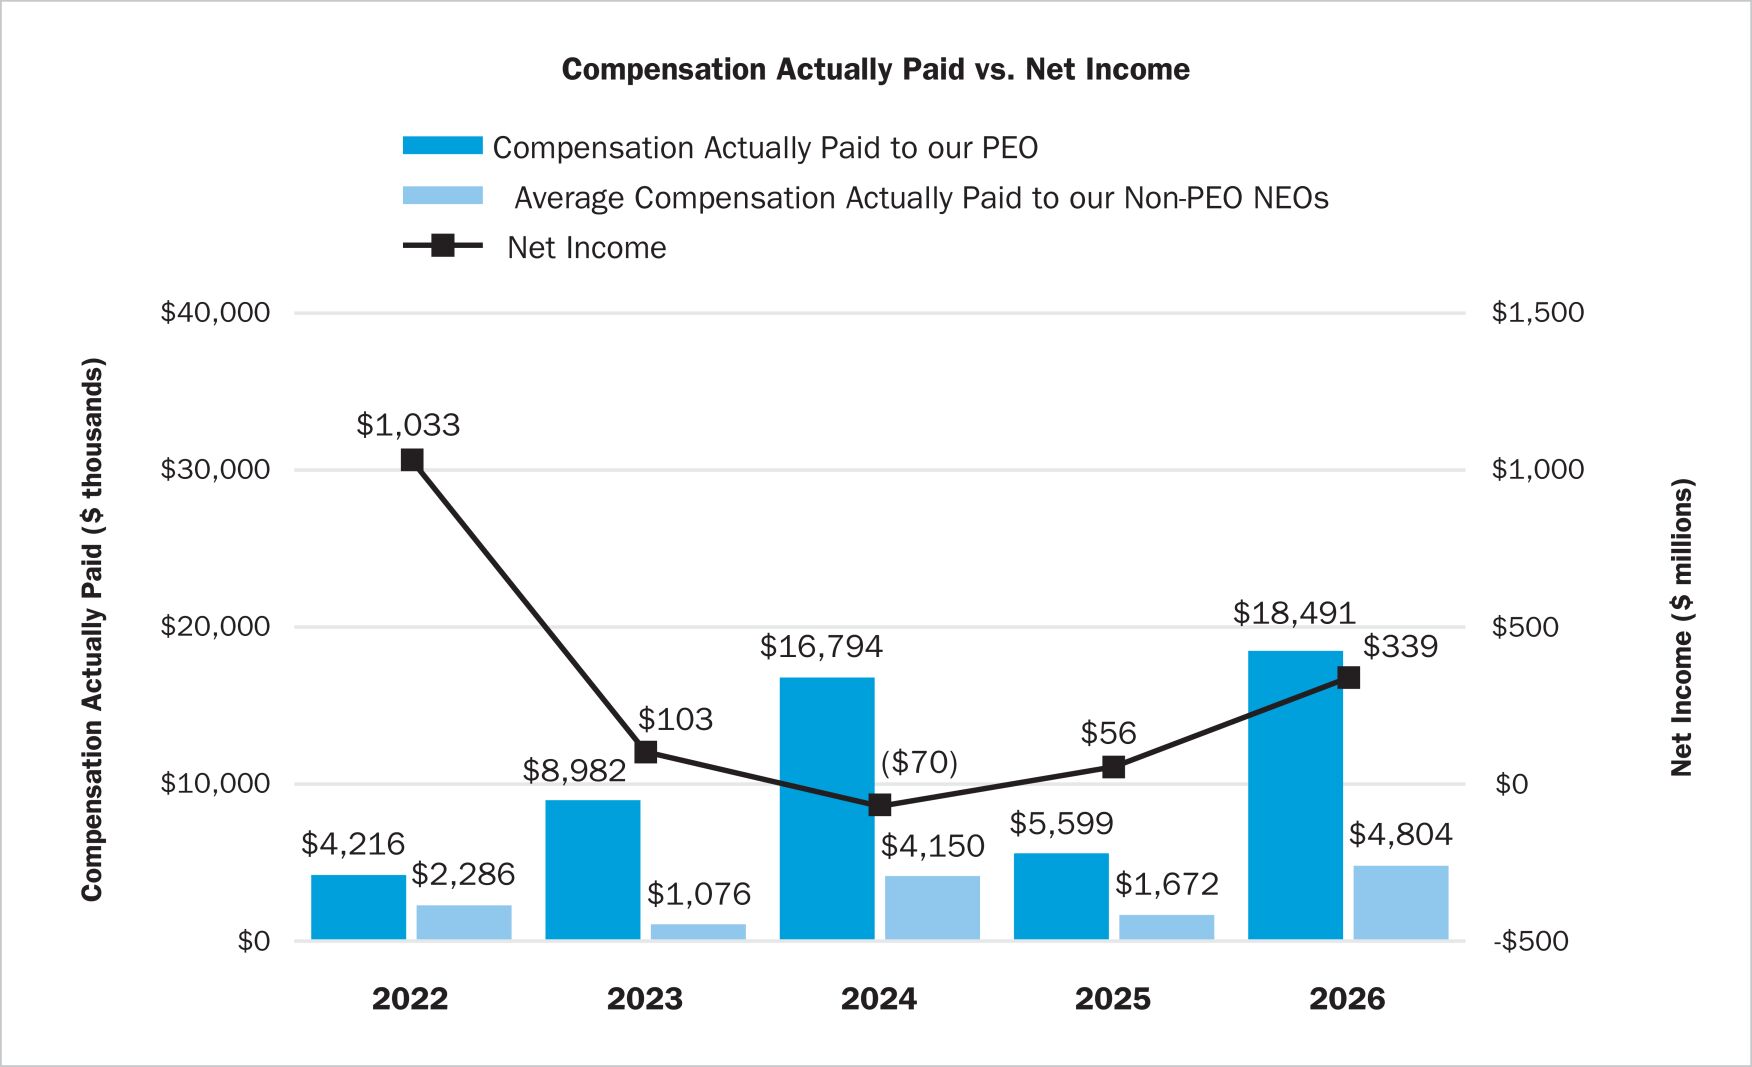
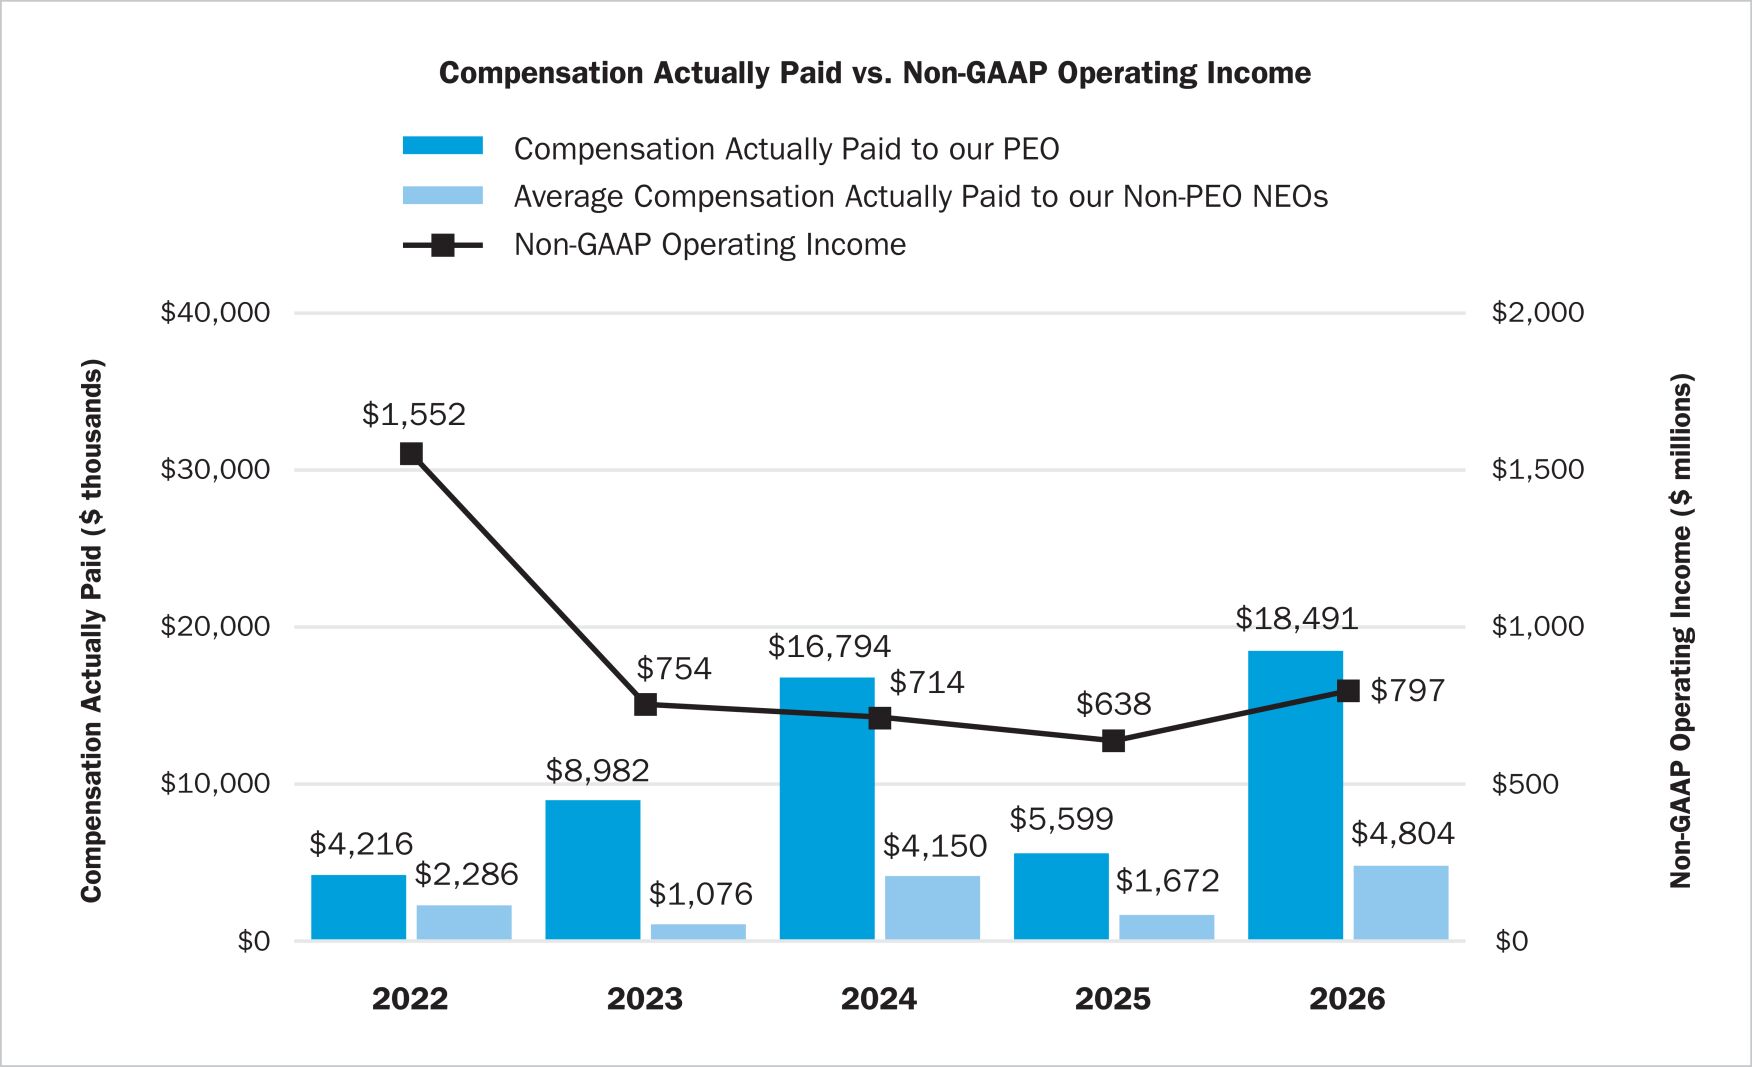
$ | 13,551,627 | $ | 18,491,062 | $ | 3,654,958 | $ | 4,804,212 | $ | 40.10 | $ | 470.02 | $ | 339.0 | $ | 797.0 | ||||||||||||||||
2025 |
$ | 13,106,962 | $ | 5,599,243 | $ | 3,419,297 | $ | 1,672,197 | $ | 37.07 | $ | 280.97 | $ | 55.6 | $ | 637.9 | ||||||||||||||||
2024 |
$ | 12,816,409 | $ | 16,793,614 | $ | 3,357,342 | $ | 4,150,475 | $ | 59.53 | $ | 262.39 | $ | (70.3 | ) | $ | 713.5 | |||||||||||||||
2023 |
$ | 11,693,756 | $ | 8,982,429 | $ | 2,399,493 | $ | 1,075,592 | $ | 52.65 | $ | 123.69 | $ | 103.2 | $ | 753.7 | ||||||||||||||||
2022 |
$ | 10,072,684 | $ | 4,215,605 | $ | 3,484,705 | $ | 2,286,139 | $ | 62.99 | $ | 127.50 | $ | 1,033.3 | $ | 1,551.7 | ||||||||||||||||
| (1) | The principal executive officer (“PEO”) in each covered year is Mr. Bruggeworth. The non-PEO NEOs for whom the average compensation is presented in this table are, for fiscal 2026, 2025 and 2024, Messrs. Brown, Chesley, Creviston and Fego; for fiscal 2023, Messrs. Brown, Chesley, Creviston, Fego, and Mark Murphy; and for fiscal 2022, Messrs. Chesley, Creviston, Fego and Murphy. |
| (2) | The dollar amounts reported in this column represent the amount of “compensation actually paid” to our PEO and our non-PEO NEOs in the respective fiscal year indicated, and reflect adjustments from total compensation reported in the Summary Compensation Table as computed in accordance with Item 402(v) of Regulation S-K. The dollar amounts do not reflect the actual amount of compensation earned by or paid during the applicable year. In accordance with the requirements of Item 402(v) of Regulation S-K, the adjustments made to total compensation reported in the Summary Compensation Table include the following: |
2026 | ||||||||||
Adjustments to Reported Summary Compensation Table Total for PEO and Non-PEO Named Executive Officers |
PEO |
Non-PEO Named Executive Officers (Average) | ||||||||
Summary Compensation Table Total |
$ |
13,551,627 |
$ |
3,654,958 |
||||||
Subtract the amounts reported for fiscal 2025 under the Stock Awards and Option Awards columns in the Summary Compensation Table |
$ |
(10,799,961 |
) |
$ |
(2,525,012 |
) | ||||
Add year-end fair value of equity awards granted during fiscal 2025 that are unvested as of fiscal year end |
$ |
10,453,699 |
$ |
2,444,037 |
||||||
Add (subtract) year-over-year change in fair value of equity awards granted prior to fiscal 2025 that are unvested as of year-end |
$ |
2,689,730 |
$ |
603,651 |
||||||
Add (subtract) year-over-year change in fair value of equity awards granted prior to fiscal 2025 that vested during fiscal 2025 (from prior year-end to vesting date) |
$ |
2,595,967 |
$ |
626,578 |
||||||
Add, for incremental cost associated with modification of outstanding vested stock options in fiscal 2025 |
$ |
– |
$ |
– |
||||||
Total Adjustments |
$ |
4,939,435 |
$ |
1,149,254 |
||||||
Compensation Actually Paid |
$ |
18,491,062 |
$ |
4,804,212 |
||||||
| (3) | Total Shareholder Return, or “TSR”, is calculated by dividing the difference between the Company’s share price at the end of the measurement period by the Company’s share price at the beginning of the measurement period, assuming that $100 was invested beginning April 3, 2021. |
| (4) | Represents the weighted peer group TSR, weighted according to the respective companies’ stock market capitalization at the beginning of each period for which a return is indicated, assuming that $100 was invested beginning April 3, 2021. The peer group used for this purpose is the S&P 500 Semiconductors Index. |
| (5) | The dollar amounts reported represent the amount of net income reflected in the Company’s audited consolidated and combined financial statements for the applicable year. |
| (6) | Please see Annex A for a reconciliation of the Company-Selected Measure (“CSM”), non-GAAP operating income. |
For equity values included in the above tables, the valuation
assumptions
used to calculate fair values did not materially differ from those disclosed at the time of the grant. | (1) | The principal executive officer (“PEO”) in each covered year is Mr. Bruggeworth. The non-PEO NEOs for whom the average compensation is presented in this table are, for fiscal 2026, 2025 and 2024, Messrs. Brown, Chesley, Creviston and Fego; for fiscal 2023, Messrs. Brown, Chesley, Creviston, Fego, and Mark Murphy; and for fiscal 2022, Messrs. Chesley, Creviston, Fego and Murphy. |
| (4) | Represents the weighted peer group TSR, weighted according to the respective companies’ stock market capitalization at the beginning of each period for which a return is indicated, assuming that $100 was invested beginning April 3, 2021. The peer group used for this purpose is the S&P 500 Semiconductors Index. |
| (2) | The dollar amounts reported in this column represent the amount of “compensation actually paid” to our PEO and our non-PEO NEOs in the respective fiscal year indicated, and reflect adjustments from total compensation reported in the Summary Compensation Table as computed in accordance with Item 402(v) of Regulation S-K. The dollar amounts do not reflect the actual amount of compensation earned by or paid during the applicable year. In accordance with the requirements of Item 402(v) of Regulation S-K, the adjustments made to total compensation reported in the Summary Compensation Table include the following: |
2026 | ||||||||||
Adjustments to Reported Summary Compensation Table Total for PEO and Non-PEO Named Executive Officers |
PEO |
Non-PEO Named Executive Officers (Average) | ||||||||
Summary Compensation Table Total |
$ |
13,551,627 |
$ |
3,654,958 |
||||||
Subtract the amounts reported for fiscal 2025 under the Stock Awards and Option Awards columns in the Summary Compensation Table |
$ |
(10,799,961 |
) |
$ |
(2,525,012 |
) | ||||
Add year-end fair value of equity awards granted during fiscal 2025 that are unvested as of fiscal year end |
$ |
10,453,699 |
$ |
2,444,037 |
||||||
Add (subtract) year-over-year change in fair value of equity awards granted prior to fiscal 2025 that are unvested as of year-end |
$ |
2,689,730 |
$ |
603,651 |
||||||
Add (subtract) year-over-year change in fair value of equity awards granted prior to fiscal 2025 that vested during fiscal 2025 (from prior year-end to vesting date) |
$ |
2,595,967 |
$ |
626,578 |
||||||
Add, for incremental cost associated with modification of outstanding vested stock options in fiscal 2025 |
$ |
– |
$ |
– |
||||||
Total Adjustments |
$ |
4,939,435 |
$ |
1,149,254 |
||||||
Compensation Actually Paid |
$ |
18,491,062 |
$ |
4,804,212 |
||||||
In accordance with SEC rules, the three “most important” financial performance measures identified by the Company to link “compensation actually paid” to the Company’s NEOs for the most recently completed
fiscal
year, to the Company’s performance are: ● |
Revenue |
● |
Non-GAAP Operating Income |
● |
Non-GAAP Gross Margin |
| (6) | Please see Annex A for a reconciliation of the Company-Selected Measure (“CSM”), non-GAAP operating income. |