Shareholder Report
|
6 Months Ended |
|
Apr. 30, 2026
USD ($)
Holding
|
|---|
| Shareholder Report [Line Items] |
|
|
| Document Type |
N-CSRS
|
|
| Amendment Flag |
false
|
|
| Registrant Name |
The Glenmede Fund, Inc.
|
|
| Entity Central Index Key |
0000835663
|
|
| Entity Investment Company Type |
N-1A
|
|
| Document Period End Date |
Apr. 30, 2026
|
|
| Shareholder Report Annual or Semi-Annual |
Semi-Annual Shareholder Report
|
|
| C000017533 |
|
|
| Shareholder Report [Line Items] |
|
|
| Fund Name |
Glenmede Disciplined International Equity Portfolio
|
|
| Class Name |
Advisor Class
|
|
| Trading Symbol |
GTCIX
|
|
| Annual or Semi-Annual Statement [Text Block] |
This semi-annual shareholder report contains important information about the Glenmede Disciplined International Equity Portfolio - Advisor Class (GTCIX) (the "Portfolio") for the period of November 1, 2025 to April 30, 2026.
|
|
| Additional Information [Text Block] |
You can find additional information about the Portfolio at www.glenmedeim.com/funds/fund-documents/. You can also request this information by contacting us at 1-215-419-6662.
|
|
| Additional Information Phone Number |
1-215-419-6662
|
|
| Additional Information Website |
www.glenmedeim.com/funds/fund-documents/
|
|
| Expenses [Text Block] |
What were the Portfolio costs for the period? Portfolio Operating Expenses (based on a hypothetical $10,000 investment) Table SummaryTicker | Costs of a hypothetical $10,000 investmentFootnote Reference* | Costs paid as a percentage of a $10,000 investmentFootnote Reference* |
|---|
GTCIX | $46 | 0.86%Footnote Reference(a) |
|---|
| Footnote | Description | Footnote(a) | Annualized | Footnote* | Reflects fee waivers and/or expense reimbursements, without which expenses would be higher. |
|
|
| Expenses Paid, Amount |
$ 46
|
|
| Expense Ratio, Percent |
0.86%
|
[1] |
| AssetsNet |
$ 101,970,940
|
|
| Holdings Count | Holding |
112
|
|
| InvestmentCompanyPortfolioTurnover |
39.00%
|
|
| Additional Fund Statistics [Text Block] |
Key Portfolio Statistics (as of 4/30/2026)- Total Net Assets ("TNA")$101,970,940
- # of Portfolio Holdings112
- Portfolio Turnover Rate39%
|
|
| Holdings [Text Block] |
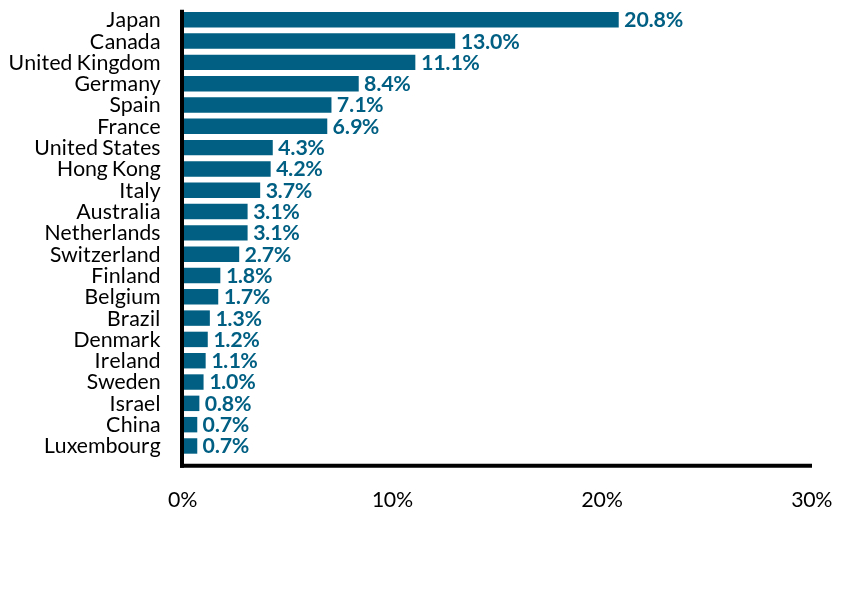
Country Composition (% of TNA as of 4/30/2026)*Table SummaryValue | Value |
|---|
Luxembourg | 0.7% | China | 0.7% | Israel | 0.8% | Sweden | 1.0% | Ireland | 1.1% | Denmark | 1.2% | Brazil | 1.3% | Belgium | 1.7% | Finland | 1.8% | Switzerland | 2.7% | Netherlands | 3.1% | Australia | 3.1% | Italy | 3.7% | Hong Kong | 4.2% | United States | 4.3% | France | 6.9% | Spain | 7.1% | Germany | 8.4% | United Kingdom | 11.1% | Canada | 13.0% | Japan | 20.8% | |
|
| Largest Holdings [Text Block] |
Top 10 Holdings (% of TNA as of 4/30/2026)Footnote Reference*Table SummaryLasertec Corp. | 1.8% |
|---|
Siemens Energy AG | 1.7% |
|---|
SBI Holdings, Inc. | 1.5% |
|---|
Toronto-Dominion Bank | 1.5% |
|---|
CaixaBank SA | 1.5% |
|---|
Ipsen SA | 1.5% |
|---|
Sanofi SA | 1.5% |
|---|
BNP Paribas SA | 1.5% |
|---|
Asahi Kasei Corp. | 1.5% |
|---|
Allianz SE | 1.5% |
|---|
| Footnote | Description | Footnote* | Excludes short-term investment holdings. |
|
|
| Material Fund Change [Text Block] |
|
|
| C000260453 |
|
|
| Shareholder Report [Line Items] |
|
|
| Fund Name |
Glenmede Disciplined International Equity Portfolio
|
|
| Class Name |
Institutional Class
|
|
| Trading Symbol |
GTCLX
|
|
| Annual or Semi-Annual Statement [Text Block] |
This semi-annual shareholder report contains important information about the Glenmede Disciplined International Equity Portfolio - Institutional Class (GTCLX) (the "Portfolio") for the period of November 1, 2025 to April 30, 2026.
|
|
| Additional Information [Text Block] |
You can find additional information about the Portfolio at www.glenmedeim.com/funds/fund-documents/. You can also request this information by contacting us at 1-215-419-6662.
|
|
| Additional Information Phone Number |
1-215-419-6662
|
|
| Additional Information Website |
www.glenmedeim.com/funds/fund-documents/
|
|
| Expenses [Text Block] |
What were the Portfolio costs for the period? Portfolio Operating Expenses (based on a hypothetical $10,000 investment) Table SummaryTicker | Costs of a hypothetical $10,000 investmentFootnote Reference* | Costs paid as a percentage of a $10,000 investmentFootnote Reference* |
|---|
GTCLX | $35 | 0.66%Footnote Reference(a) |
|---|
| Footnote | Description | Footnote(a) | Annualized | Footnote* | Reflects fee waivers and/or expense reimbursements, without which expenses would be higher. |
|
|
| Expenses Paid, Amount |
$ 35
|
|
| Expense Ratio, Percent |
0.66%
|
[2] |
| AssetsNet |
$ 101,970,940
|
|
| Holdings Count | Holding |
112
|
|
| InvestmentCompanyPortfolioTurnover |
39.00%
|
|
| Additional Fund Statistics [Text Block] |
Key Portfolio Statistics (as of 4/30/2026)- Total Net Assets ("TNA")$101,970,940
- # of Portfolio Holdings112
- Portfolio Turnover Rate39%
|
|
| Holdings [Text Block] |
Country Composition (% of TNA as of 4/30/2026)*Table SummaryValue | Value |
|---|
Luxembourg | 0.7% | China | 0.7% | Israel | 0.8% | Sweden | 1.0% | Ireland | 1.1% | Denmark | 1.2% | Brazil | 1.3% | Belgium | 1.7% | Finland | 1.8% | Switzerland | 2.7% | Netherlands | 3.1% | Australia | 3.1% | Italy | 3.7% | Hong Kong | 4.2% | United States | 4.3% | France | 6.9% | Spain | 7.1% | Germany | 8.4% | United Kingdom | 11.1% | Canada | 13.0% | Japan | 20.8% | |
|
| Largest Holdings [Text Block] |
Top 10 Holdings (% of TNA as of 4/30/2026)Footnote Reference*Table SummaryLasertec Corp. | 1.8% |
|---|
Siemens Energy AG | 1.7% |
|---|
SBI Holdings, Inc. | 1.5% |
|---|
Toronto-Dominion Bank | 1.5% |
|---|
CaixaBank SA | 1.5% |
|---|
Ipsen SA | 1.5% |
|---|
Sanofi SA | 1.5% |
|---|
BNP Paribas SA | 1.5% |
|---|
Asahi Kasei Corp. | 1.5% |
|---|
Allianz SE | 1.5% |
|---|
| Footnote | Description | Footnote* | Excludes short-term investment holdings. |
|
|
| Material Fund Change [Text Block] |
|
|
| C000017534 |
|
|
| Shareholder Report [Line Items] |
|
|
| Fund Name |
Glenmede Disciplined U.S. Equity Portfolio
|
|
| Class Name |
Advisor Class
|
|
| Trading Symbol |
GTLOX
|
|
| Annual or Semi-Annual Statement [Text Block] |
This semi-annual shareholder report contains important information about the Glenmede Disciplined U.S. Equity Portfolio - Advisor Class (GTLOX) (the "Portfolio") for the period of November 1, 2025 to April 30, 2026.
|
|
| Additional Information [Text Block] |
You can find additional information about the Portfolio at www.glenmedeim.com/funds/fund-documents/. You can also request this information by contacting us at 1-215-419-6662.
|
|
| Additional Information Phone Number |
1-215-419-6662
|
|
| Additional Information Website |
www.glenmedeim.com/funds/fund-documents/
|
|
| Expenses [Text Block] |
What were the Portfolio costs for the period? Portfolio Operating Expenses (based on a hypothetical $10,000 investment) Table SummaryTicker | Costs of a hypothetical $10,000 investment | Costs paid as a percentage of a $10,000 investment |
|---|
GTLOX | $48 | 0.89%Footnote Reference(a) |
|---|
| Footnote | Description | Footnote(a) | Annualized |
|
|
| Expenses Paid, Amount |
$ 48
|
|
| Expense Ratio, Percent |
0.89%
|
[3] |
| AssetsNet |
$ 403,216,865
|
|
| Holdings Count | Holding |
93
|
|
| InvestmentCompanyPortfolioTurnover |
29.00%
|
|
| Additional Fund Statistics [Text Block] |
Key Portfolio Statistics (as of 4/30/2026)- Total Net Assets ("TNA")$403,216,865
- # of Portfolio Holdings93
- Portfolio Turnover Rate29%
|
|
| Holdings [Text Block] |
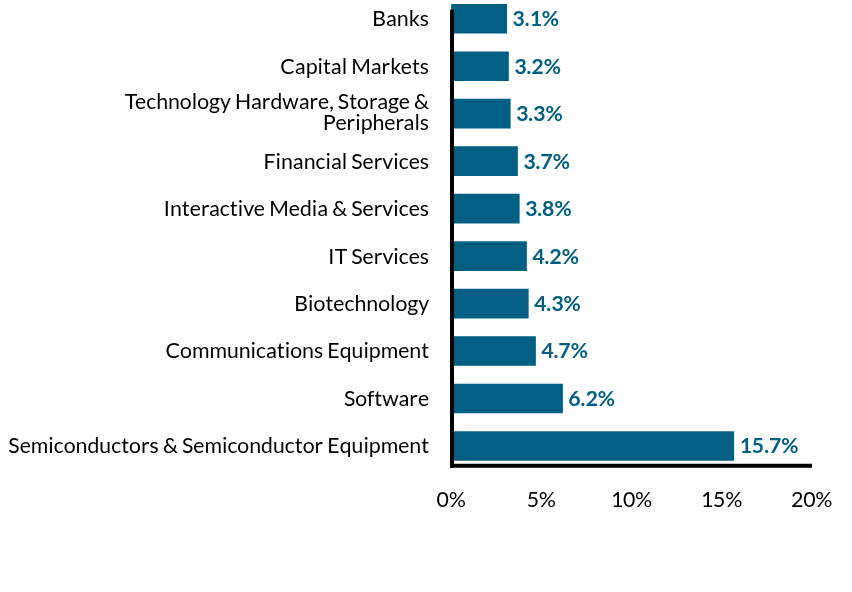
Top 10 Industries (% of TNA as of 4/30/2026)*Table SummaryValue | Value |
|---|
Semiconductors & Semiconductor Equipment | 15.7% | Software | 6.2% | Communications Equipment | 4.7% | Biotechnology | 4.3% | IT Services | 4.2% | Interactive Media & Services | 3.8% | Financial Services | 3.7% | Technology Hardware, Storage & Peripherals | 3.3% | Capital Markets | 3.2% | Banks | 3.1% | |
|
| Largest Holdings [Text Block] |
Top 10 Holdings (% of TNA as of 4/30/2026)Footnote Reference*Table SummaryIntel Corp. | 3.5% |
|---|
ON Semiconductor Corp. | 2.5% |
|---|
Arista Networks, Inc. | 2.4% |
|---|
Alphabet, Inc., Class A | 2.3% |
|---|
Hewlett Packard Enterprise Co. | 2.2% |
|---|
Micron Technology, Inc. | 2.2% |
|---|
Lam Research Corp. | 2.2% |
|---|
Zoom Communications, Inc. | 2.1% |
|---|
Applied Materials, Inc. | 2.1% |
|---|
Twilio, Inc., Class A | 2.0% |
|---|
| Footnote | Description | Footnote* | Excludes short-term investment holdings. |
|
|
| Material Fund Change [Text Block] |
|
|
| C000158301 |
|
|
| Shareholder Report [Line Items] |
|
|
| Fund Name |
Glenmede Disciplined U.S. Equity Portfolio
|
|
| Class Name |
Institutional Class
|
|
| Trading Symbol |
GTLIX
|
|
| Annual or Semi-Annual Statement [Text Block] |
This semi-annual shareholder report contains important information about the Glenmede Disciplined U.S. Equity Portfolio - Institutional Class (GTLIX) (the "Portfolio") for the period of November 1, 2025 to April 30, 2026.
|
|
| Additional Information [Text Block] |
You can find additional information about the Portfolio at www.glenmedeim.com/funds/fund-documents/. You can also request this information by contacting us at 1-215-419-6662.
|
|
| Additional Information Phone Number |
1-215-419-6662
|
|
| Additional Information Website |
www.glenmedeim.com/funds/fund-documents/
|
|
| Expenses [Text Block] |
What were the Portfolio costs for the period? Portfolio Operating Expenses (based on a hypothetical $10,000 investment) Table SummaryTicker | Costs of a hypothetical $10,000 investment | Costs paid as a percentage of a $10,000 investment |
|---|
GTLIX | $37 | 0.69%Footnote Reference(a) |
|---|
| Footnote | Description | Footnote(a) | Annualized |
|
|
| Expenses Paid, Amount |
$ 37
|
|
| Expense Ratio, Percent |
0.69%
|
[4] |
| AssetsNet |
$ 403,216,865
|
|
| Holdings Count | Holding |
93
|
|
| InvestmentCompanyPortfolioTurnover |
29.00%
|
|
| Additional Fund Statistics [Text Block] |
Key Portfolio Statistics (as of 4/30/2026)- Total Net Assets ("TNA")$403,216,865
- # of Portfolio Holdings93
- Portfolio Turnover Rate29%
|
|
| Holdings [Text Block] |
Top 10 Industries (% of TNA as of 4/30/2026)*Table SummaryValue | Value |
|---|
Semiconductors & Semiconductor Equipment | 15.7% | Software | 6.2% | Communications Equipment | 4.7% | Biotechnology | 4.3% | IT Services | 4.2% | Interactive Media & Services | 3.8% | Financial Services | 3.7% | Technology Hardware, Storage & Peripherals | 3.3% | Capital Markets | 3.2% | Banks | 3.1% | |
|
| Largest Holdings [Text Block] |
Top 10 Holdings (% of TNA as of 4/30/2026)Footnote Reference*Table SummaryIntel Corp. | 3.5% |
|---|
ON Semiconductor Corp. | 2.5% |
|---|
Arista Networks, Inc. | 2.4% |
|---|
Alphabet, Inc., Class A | 2.3% |
|---|
Hewlett Packard Enterprise Co. | 2.2% |
|---|
Micron Technology, Inc. | 2.2% |
|---|
Lam Research Corp. | 2.2% |
|---|
Zoom Communications, Inc. | 2.1% |
|---|
Applied Materials, Inc. | 2.1% |
|---|
Twilio, Inc., Class A | 2.0% |
|---|
| Footnote | Description | Footnote* | Excludes short-term investment holdings. |
|
|
| Material Fund Change [Text Block] |
|
|
| C000017535 |
|
|
| Shareholder Report [Line Items] |
|
|
| Fund Name |
Glenmede Disciplined U.S. Growth Equity Portfolio
|
|
| Class Name |
Advisor Class
|
|
| Trading Symbol |
GTLLX
|
|
| Annual or Semi-Annual Statement [Text Block] |
This semi-annual shareholder report contains important information about the Glenmede Disciplined U.S. Growth Equity Portfolio - Advisor Class (GTLLX) (the "Portfolio") for the period of November 1, 2025 to April 30, 2026.
|
|
| Additional Information [Text Block] |
You can find additional information about the Portfolio at www.glenmedeim.com/funds/fund-documents/. You can also request this information by contacting us at 1-215-419-6662.
|
|
| Additional Information Phone Number |
1-215-419-6662
|
|
| Additional Information Website |
www.glenmedeim.com/funds/fund-documents/
|
|
| Expenses [Text Block] |
What were the Portfolio costs for the period? Portfolio Operating Expenses (based on a hypothetical $10,000 investment) Table SummaryTicker | Costs of a hypothetical $10,000 investment | Costs paid as a percentage of a $10,000 investment |
|---|
GTLLX | $44 | 0.87%Footnote Reference(a) |
|---|
| Footnote | Description | Footnote(a) | Annualized |
|
|
| Expenses Paid, Amount |
$ 44
|
|
| Expense Ratio, Percent |
0.87%
|
[5] |
| AssetsNet |
$ 1,178,289,858
|
|
| Holdings Count | Holding |
61
|
|
| InvestmentCompanyPortfolioTurnover |
30.00%
|
|
| Additional Fund Statistics [Text Block] |
Key Portfolio Statistics (as of 4/30/2026)- Total Net Assets ("TNA")$1,178,289,858
- # of Portfolio Holdings61
- Portfolio Turnover Rate30%
|
|
| Holdings [Text Block] |
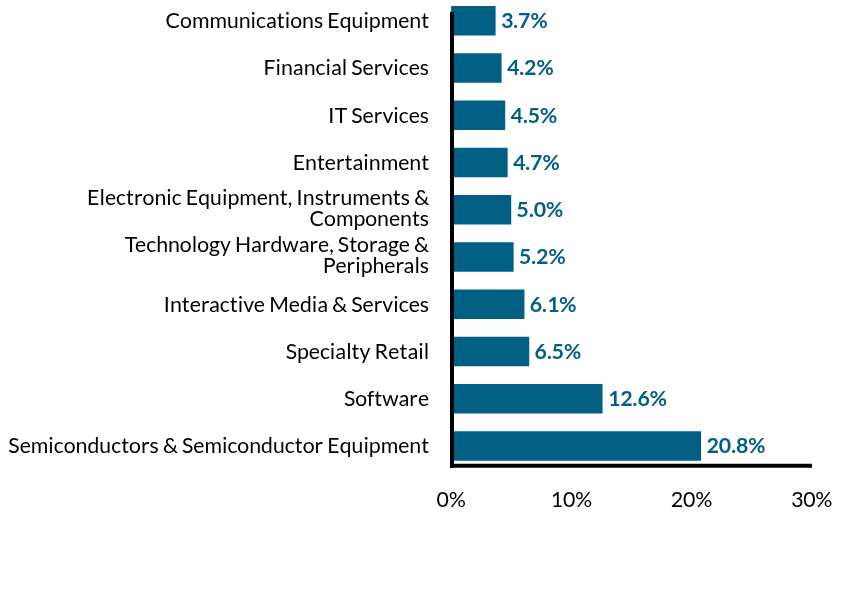
Top 10 Industries (% of TNA as of 4/30/2026)*Table SummaryValue | Value |
|---|
Semiconductors & Semiconductor Equipment | 20.8% | Software | 12.6% | Specialty Retail | 6.5% | Interactive Media & Services | 6.1% | Technology Hardware, Storage & Peripherals | 5.2% | Electronic Equipment, Instruments & Components | 5.0% | Entertainment | 4.7% | IT Services | 4.5% | Financial Services | 4.2% | Communications Equipment | 3.7% | |
|
| Largest Holdings [Text Block] |
Top 10 Holdings (% of TNA as of 4/30/2026)Footnote Reference*Table SummaryMarvell Technology, Inc. | 4.1% |
|---|
Arista Networks, Inc. | 3.7% |
|---|
Alphabet, Inc., Class A | 3.5% |
|---|
Lam Research Corp. | 3.2% |
|---|
Twilio, Inc., Class A | 3.1% |
|---|
NVIDIA Corp. | 3.1% |
|---|
Amphenol Corp., Class A | 3.1% |
|---|
Applied Materials, Inc. | 3.0% |
|---|
Teradyne, Inc. | 3.0% |
|---|
KLA Corp. | 2.8% |
|---|
| Footnote | Description | Footnote* | Excludes short-term investment holdings. |
|
|
| Material Fund Change [Text Block] |
|
|
| C000158302 |
|
|
| Shareholder Report [Line Items] |
|
|
| Fund Name |
Glenmede Disciplined U.S. Growth Equity Portfolio
|
|
| Class Name |
Institutional Class
|
|
| Trading Symbol |
GTILX
|
|
| Annual or Semi-Annual Statement [Text Block] |
This semi-annual shareholder report contains important information about the Glenmede Disciplined U.S. Growth Equity Portfolio - Institutional Class (GTILX) (the "Portfolio") for the period of November 1, 2025 to April 30, 2026.
|
|
| Additional Information [Text Block] |
You can find additional information about the Portfolio at www.glenmedeim.com/funds/fund-documents/. You can also request this information by contacting us at 1-215-419-6662.
|
|
| Additional Information Phone Number |
1-215-419-6662
|
|
| Additional Information Website |
www.glenmedeim.com/funds/fund-documents/
|
|
| Expenses [Text Block] |
What were the Portfolio costs for the period? Portfolio Operating Expenses (based on a hypothetical $10,000 investment) Table SummaryTicker | Costs of a hypothetical $10,000 investment | Costs paid as a percentage of a $10,000 investment |
|---|
GTILX | $34 | 0.67%Footnote Reference(a) |
|---|
| Footnote | Description | Footnote(a) | Annualized |
|
|
| Expenses Paid, Amount |
$ 34
|
|
| Expense Ratio, Percent |
0.67%
|
[6] |
| AssetsNet |
$ 1,178,289,858
|
|
| Holdings Count | Holding |
61
|
|
| InvestmentCompanyPortfolioTurnover |
30.00%
|
|
| Additional Fund Statistics [Text Block] |
Key Portfolio Statistics (as of 4/30/2026)- Total Net Assets ("TNA")$1,178,289,858
- # of Portfolio Holdings61
- Portfolio Turnover Rate30%
|
|
| Holdings [Text Block] |
Top 10 Industries (% of TNA as of 4/30/2026)*Table SummaryValue | Value |
|---|
Semiconductors & Semiconductor Equipment | 20.8% | Software | 12.6% | Specialty Retail | 6.5% | Interactive Media & Services | 6.1% | Technology Hardware, Storage & Peripherals | 5.2% | Electronic Equipment, Instruments & Components | 5.0% | Entertainment | 4.7% | IT Services | 4.5% | Financial Services | 4.2% | Communications Equipment | 3.7% | |
|
| Largest Holdings [Text Block] |
Top 10 Holdings (% of TNA as of 4/30/2026)Footnote Reference*Table SummaryMarvell Technology, Inc. | 4.1% |
|---|
Arista Networks, Inc. | 3.7% |
|---|
Alphabet, Inc., Class A | 3.5% |
|---|
Lam Research Corp. | 3.2% |
|---|
Twilio, Inc., Class A | 3.1% |
|---|
NVIDIA Corp. | 3.1% |
|---|
Amphenol Corp., Class A | 3.1% |
|---|
Applied Materials, Inc. | 3.0% |
|---|
Teradyne, Inc. | 3.0% |
|---|
KLA Corp. | 2.8% |
|---|
| Footnote | Description | Footnote* | Excludes short-term investment holdings. |
|
|
| Material Fund Change [Text Block] |
|
|
| C000195216 |
|
|
| Shareholder Report [Line Items] |
|
|
| Fund Name |
Glenmede Disciplined U.S. Small Cap Equity Portfolio
|
|
| Class Name |
Advisor Class
|
|
| Trading Symbol |
GQSCX
|
|
| Annual or Semi-Annual Statement [Text Block] |
This semi-annual shareholder report contains important information about the Glenmede Disciplined U.S. Small Cap Equity Portfolio - Advisor Class (GQSCX) (the "Portfolio") for the period of November 1, 2025 to April 30, 2026.
|
|
| Additional Information [Text Block] |
You can find additional information about the Portfolio at www.glenmedeim.com/funds/fund-documents/. You can also request this information by contacting us at 1-215-419-6662.
|
|
| Additional Information Phone Number |
1-215-419-6662
|
|
| Additional Information Website |
www.glenmedeim.com/funds/fund-documents/
|
|
| Expenses [Text Block] |
What were the Portfolio costs for the period? Portfolio Operating Expenses (based on a hypothetical $10,000 investment) Table SummaryTicker | Costs of a hypothetical $10,000 investmentFootnote Reference* | Costs paid as a percentage of a $10,000 investmentFootnote Reference* |
|---|
GQSCX | $47 | 0.85%Footnote Reference(a) |
|---|
| Footnote | Description | Footnote(a) | Annualized | Footnote* | Reflects fee waivers and/or expense reimbursements, without which expenses would be higher. |
|
|
| Expenses Paid, Amount |
$ 47
|
|
| Expense Ratio, Percent |
0.85%
|
[7] |
| AssetsNet |
$ 3,183,535
|
|
| Holdings Count | Holding |
146
|
|
| InvestmentCompanyPortfolioTurnover |
45.00%
|
|
| Additional Fund Statistics [Text Block] |
Key Portfolio Statistics (as of 4/30/2026)- Total Net Assets ("TNA")$3,183,535
- # of Portfolio Holdings146
- Portfolio Turnover Rate45%
|
|
| Holdings [Text Block] |
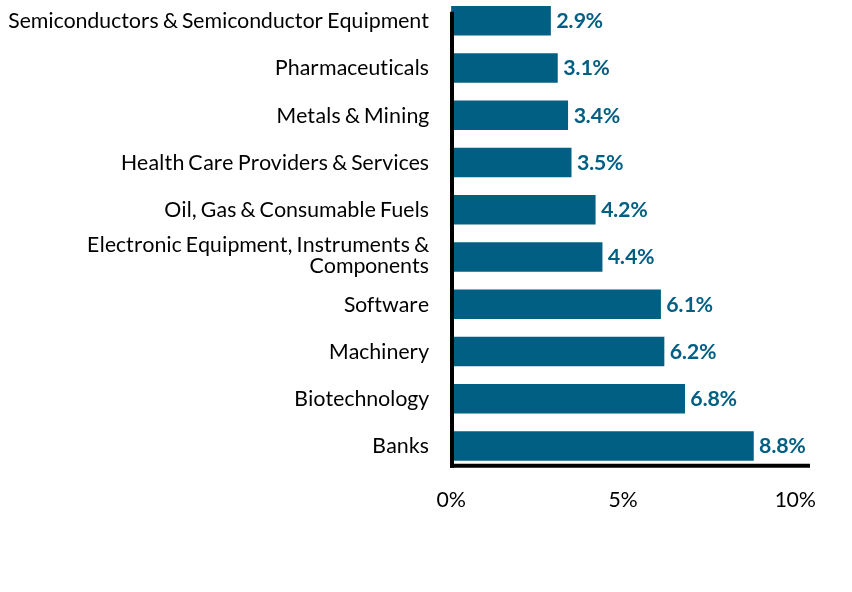
Top 10 Industries (% of TNA as of 4/30/2026)*Table SummaryValue | Value |
|---|
Banks | 8.8% | Biotechnology | 6.8% | Machinery | 6.2% | Software | 6.1% | Electronic Equipment, Instruments & Components | 4.4% | Oil, Gas & Consumable Fuels | 4.2% | Health Care Providers & Services | 3.5% | Metals & Mining | 3.4% | Pharmaceuticals | 3.1% | Semiconductors & Semiconductor Equipment | 2.9% | |
|
| Largest Holdings [Text Block] |
Top 10 Holdings (% of TNA as of 4/30/2026)Footnote Reference*Table SummaryEZCORP, Inc., Class A | 1.8% |
|---|
Constellium SE | 1.8% |
|---|
Allient, Inc. | 1.3% |
|---|
Benchmark Electronics, Inc. | 1.3% |
|---|
Hamilton Insurance Group Ltd., Class B | 1.2% |
|---|
Resideo Technologies, Inc. | 1.2% |
|---|
Photronics, Inc. | 1.2% |
|---|
Par Pacific Holdings, Inc. | 1.1% |
|---|
Green Plains, Inc. | 1.1% |
|---|
EnerSys | 1.1% |
|---|
| Footnote | Description | Footnote* | Excludes short-term investment holdings. |
|
|
| Material Fund Change [Text Block] |
|
|
| C000260455 |
|
|
| Shareholder Report [Line Items] |
|
|
| Fund Name |
Glenmede Disciplined U.S. Small Cap Equity Portfolio
|
|
| Class Name |
Institutional Class
|
|
| Trading Symbol |
GQSIX
|
|
| Annual or Semi-Annual Statement [Text Block] |
This semi-annual shareholder report contains important information about the Glenmede Disciplined U.S. Small Cap Equity Portfolio - Institutional Class (GQSIX) (the "Portfolio") for the period of November 1, 2025 to April 30, 2026.
|
|
| Additional Information [Text Block] |
You can find additional information about the Portfolio at www.glenmedeim.com/funds/fund-documents/. You can also request this information by contacting us at 1-215-419-6662.
|
|
| Additional Information Phone Number |
1-215-419-6662
|
|
| Additional Information Website |
www.glenmedeim.com/funds/fund-documents/
|
|
| Expenses [Text Block] |
What were the Portfolio costs for the period? Portfolio Operating Expenses (based on a hypothetical $10,000 investment) Table SummaryTicker | Costs of a hypothetical $10,000 investmentFootnote Reference* | Costs paid as a percentage of a $10,000 investmentFootnote Reference* |
|---|
GQSIX | $36 | 0.65%Footnote Reference(a) |
|---|
| Footnote | Description | Footnote(a) | Annualized | Footnote* | Reflects fee waivers and/or expense reimbursements, without which expenses would be higher. |
|
|
| Expenses Paid, Amount |
$ 36
|
|
| Expense Ratio, Percent |
0.65%
|
[8] |
| AssetsNet |
$ 3,183,535
|
|
| Holdings Count | Holding |
146
|
|
| InvestmentCompanyPortfolioTurnover |
45.00%
|
|
| Additional Fund Statistics [Text Block] |
Key Portfolio Statistics (as of 4/30/2026)- Total Net Assets ("TNA")$3,183,535
- # of Portfolio Holdings146
- Portfolio Turnover Rate45%
|
|
| Holdings [Text Block] |
Top 10 Industries (% of TNA as of 4/30/2026)*Table SummaryValue | Value |
|---|
Banks | 8.8% | Biotechnology | 6.8% | Machinery | 6.2% | Software | 6.1% | Electronic Equipment, Instruments & Components | 4.4% | Oil, Gas & Consumable Fuels | 4.2% | Health Care Providers & Services | 3.5% | Metals & Mining | 3.4% | Pharmaceuticals | 3.1% | Semiconductors & Semiconductor Equipment | 2.9% | |
|
| Largest Holdings [Text Block] |
Top 10 Holdings (% of TNA as of 4/30/2026)Footnote Reference*Table SummaryEZCORP, Inc., Class A | 1.8% |
|---|
Constellium SE | 1.8% |
|---|
Allient, Inc. | 1.3% |
|---|
Benchmark Electronics, Inc. | 1.3% |
|---|
Hamilton Insurance Group Ltd., Class B | 1.2% |
|---|
Resideo Technologies, Inc. | 1.2% |
|---|
Photronics, Inc. | 1.2% |
|---|
Par Pacific Holdings, Inc. | 1.1% |
|---|
Green Plains, Inc. | 1.1% |
|---|
EnerSys | 1.1% |
|---|
| Footnote | Description | Footnote* | Excludes short-term investment holdings. |
|
|
| Material Fund Change [Text Block] |
|
|
| C000195215 |
|
|
| Shareholder Report [Line Items] |
|
|
| Fund Name |
Glenmede Disciplined U.S. Value Equity Portfolio
|
|
| Class Name |
Advisor Class
|
|
| Trading Symbol |
GQLVX
|
|
| Annual or Semi-Annual Statement [Text Block] |
This semi-annual shareholder report contains important information about the Glenmede Disciplined U.S. Value Equity Portfolio - Advisor Class (GQLVX) (the "Portfolio") for the period of November 1, 2025 to April 30, 2026.
|
|
| Additional Information [Text Block] |
You can find additional information about the Portfolio at www.glenmedeim.com/funds/fund-documents/. You can also request this information by contacting us at 1-215-419-6662.
|
|
| Additional Information Phone Number |
1-215-419-6662
|
|
| Additional Information Website |
www.glenmedeim.com/funds/fund-documents/
|
|
| Expenses [Text Block] |
What were the Portfolio costs for the period? Portfolio Operating Expenses (based on a hypothetical $10,000 investment) Table SummaryTicker | Costs of a hypothetical $10,000 investmentFootnote Reference* | Costs paid as a percentage of a $10,000 investmentFootnote Reference* |
|---|
GQLVX | $45 | 0.85%Footnote Reference(a) |
|---|
| Footnote | Description | Footnote(a) | Annualized | Footnote* | Reflects fee waivers and/or expense reimbursements, without which expenses would be higher. |
|
|
| Expenses Paid, Amount |
$ 45
|
|
| Expense Ratio, Percent |
0.85%
|
[9] |
| AssetsNet |
$ 2,585,726
|
|
| Holdings Count | Holding |
82
|
|
| InvestmentCompanyPortfolioTurnover |
39.00%
|
|
| Additional Fund Statistics [Text Block] |
Key Portfolio Statistics (as of 4/30/2026)- Total Net Assets ("TNA")$2,585,726
- # of Portfolio Holdings82
- Portfolio Turnover Rate39%
|
|
| Holdings [Text Block] |
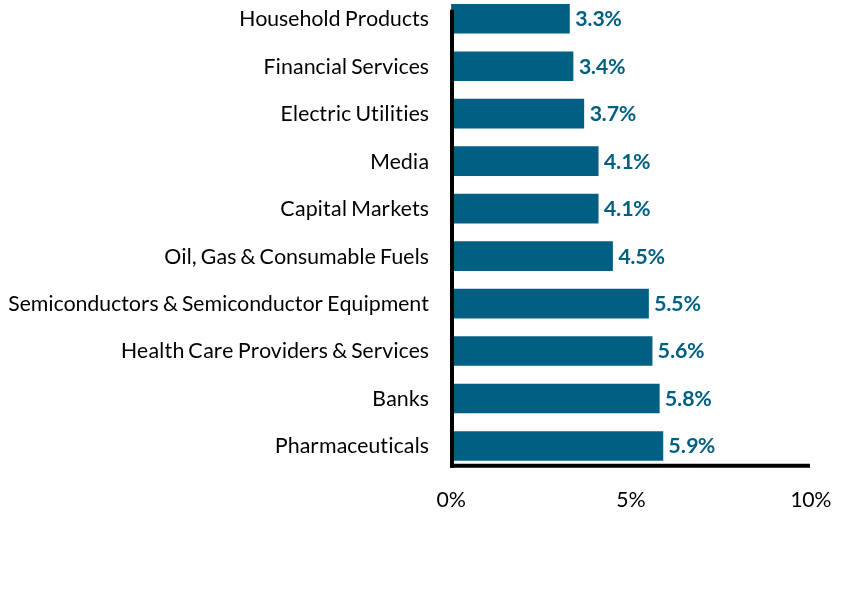
Top 10 Industries (% of TNA as of 4/30/2026)*Table SummaryValue | Value |
|---|
Pharmaceuticals | 5.9% | Banks | 5.8% | Health Care Providers & Services | 5.6% | Semiconductors & Semiconductor Equipment | 5.5% | Oil, Gas & Consumable Fuels | 4.5% | Capital Markets | 4.1% | Media | 4.1% | Electric Utilities | 3.7% | Financial Services | 3.4% | Household Products | 3.3% | |
|
| Largest Holdings [Text Block] |
Top 10 Holdings (% of TNA as of 4/30/2026)Footnote Reference*Table SummaryIntel Corp. | 3.6% |
|---|
TechnipFMC PLC | 3.0% |
|---|
Hewlett Packard Enterprise Co. | 2.5% |
|---|
Bristol-Myers Squibb Co. | 2.4% |
|---|
Johnson Controls International PLC | 2.4% |
|---|
U.S. Bancorp | 2.3% |
|---|
eBay, Inc. | 2.3% |
|---|
CME Group, Inc. | 2.3% |
|---|
Cisco Systems, Inc. | 2.2% |
|---|
Omnicom Group, Inc. | 2.1% |
|---|
| Footnote | Description | Footnote* | Excludes short-term investment holdings. |
|
|
| Material Fund Change [Text Block] |
|
|
| C000164151 |
|
|
| Shareholder Report [Line Items] |
|
|
| Fund Name |
Glenmede Energy Resilience Portfolio
|
|
| Class Name |
Advisor Class
|
|
| Trading Symbol |
RESGX
|
|
| Annual or Semi-Annual Statement [Text Block] |
This semi-annual shareholder report contains important information about the Glenmede Energy Resilience Portfolio - Advisor Class (RESGX) (the "Portfolio") for the period of November 1, 2025 to April 30, 2026.
|
|
| Additional Information [Text Block] |
You can find additional information about the Portfolio at www.glenmedeim.com/funds/fund-documents/. You can also request this information by contacting us at 1-215-419-6662.
|
|
| Additional Information Phone Number |
1-215-419-6662
|
|
| Additional Information Website |
www.glenmedeim.com/funds/fund-documents/
|
|
| Expenses [Text Block] |
What were the Portfolio costs for the period? Portfolio Operating Expenses (based on a hypothetical $10,000 investment) Table SummaryTicker | Costs of a hypothetical $10,000 investmentFootnote Reference* | Costs paid as a percentage of a $10,000 investmentFootnote Reference* |
|---|
RESGX | $46 | 0.85%Footnote Reference(a) |
|---|
| Footnote | Description | Footnote(a) | Annualized | Footnote* | Reflects fee waivers and/or expense reimbursements, without which expenses would be higher. |
|
|
| Expenses Paid, Amount |
$ 46
|
|
| Expense Ratio, Percent |
0.85%
|
[10] |
| AssetsNet |
$ 14,057,701
|
|
| Holdings Count | Holding |
51
|
|
| InvestmentCompanyPortfolioTurnover |
130.00%
|
|
| Additional Fund Statistics [Text Block] |
Key Portfolio Statistics (as of 4/30/2026)- Total Net Assets ("TNA")$14,057,701
- # of Portfolio Holdings51
- Portfolio Turnover Rate130%
|
|
| Holdings [Text Block] |
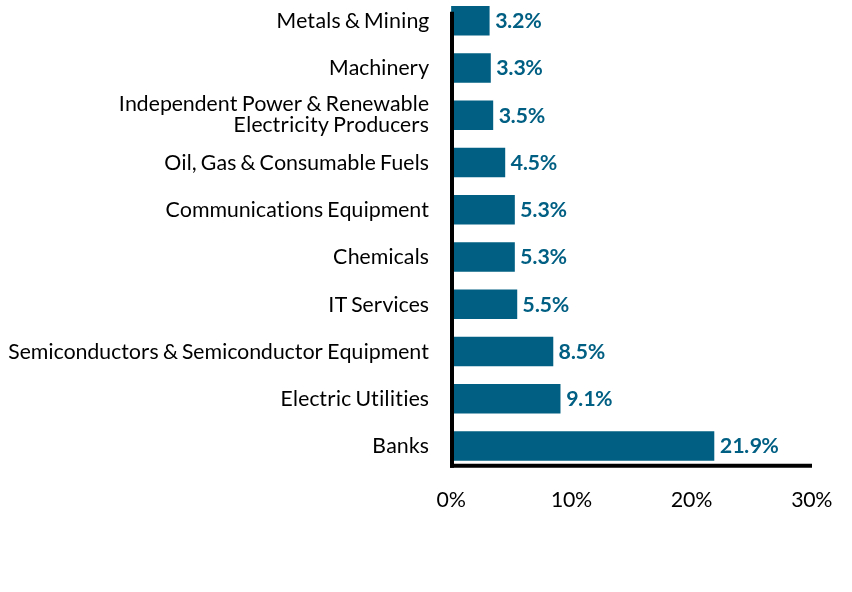
Top 10 Industries (% of TNA as of 4/30/2026)*Table SummaryValue | Value |
|---|
Banks | 21.9% | Electric Utilities | 9.1% | Semiconductors & Semiconductor Equipment | 8.5% | IT Services | 5.5% | Chemicals | 5.3% | Communications Equipment | 5.3% | Oil, Gas & Consumable Fuels | 4.5% | Independent Power & Renewable Electricity Producers | 3.5% | Machinery | 3.3% | Metals & Mining | 3.2% | |
|
| Largest Holdings [Text Block] |
Top 10 Holdings (% of TNA as of 4/30/2026)Footnote Reference*Table SummaryIntel Corp. | 5.6% |
|---|
Dow, Inc. | 3.8% |
|---|
Alcoa Corp. | 3.2% |
|---|
Hewlett Packard Enterprise Co. | 3.1% |
|---|
Flex Ltd. | 3.0% |
|---|
Cirrus Logic, Inc. | 2.9% |
|---|
F5, Inc. | 2.7% |
|---|
Cisco Systems, Inc. | 2.6% |
|---|
Akamai Technologies, Inc. | 2.5% |
|---|
Valero Energy Corp. | 2.4% |
|---|
| Footnote | Description | Footnote* | Excludes short-term investment holdings. |
|
|
| Material Fund Change [Text Block] |
|
|
| C000176162 |
|
|
| Shareholder Report [Line Items] |
|
|
| Fund Name |
Glenmede Equity Income Portfolio
|
|
| Class Name |
Advisor Class
|
|
| Trading Symbol |
GEQIX
|
|
| Annual or Semi-Annual Statement [Text Block] |
This semi-annual shareholder report contains important information about the Glenmede Equity Income Portfolio - Advisor Class (GEQIX) (the "Portfolio") for the period of November 1, 2025 to April 30, 2026.
|
|
| Additional Information [Text Block] |
You can find additional information about the Portfolio at www.glenmedeim.com/funds/fund-documents/. You can also request this information by contacting us at 1-215-419-6662.
|
|
| Additional Information Phone Number |
1-215-419-6662
|
|
| Additional Information Website |
www.glenmedeim.com/funds/fund-documents/
|
|
| Expenses [Text Block] |
What were the Portfolio costs for the period? Portfolio Operating Expenses (based on a hypothetical $10,000 investment) Table SummaryTicker | Costs of a hypothetical $10,000 investmentFootnote Reference* | Costs paid as a percentage of a $10,000 investmentFootnote Reference* |
|---|
GEQIX | $44 | 0.85%Footnote Reference(a) |
|---|
| Footnote | Description | Footnote(a) | Annualized | Footnote* | Reflects fee waivers and/or expense reimbursements, without which expenses would be higher. |
|
|
| Expenses Paid, Amount |
$ 44
|
|
| Expense Ratio, Percent |
0.85%
|
[11] |
| AssetsNet |
$ 13,067,078
|
|
| Holdings Count | Holding |
45
|
|
| InvestmentCompanyPortfolioTurnover |
6.00%
|
|
| Additional Fund Statistics [Text Block] |
Key Portfolio Statistics (as of 4/30/2026)- Total Net Assets ("TNA")$13,067,078
- # of Portfolio Holdings45
- Portfolio Turnover Rate6%
|
|
| Holdings [Text Block] |
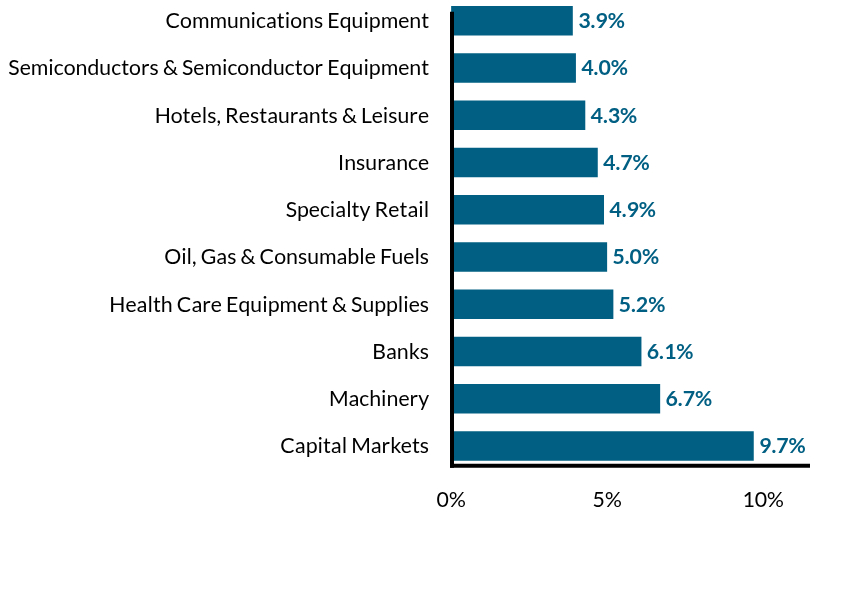
Top 10 Industries (% of TNA as of 4/30/2026)*Table SummaryValue | Value |
|---|
Capital Markets | 9.7% | Machinery | 6.7% | Banks | 6.1% | Health Care Equipment & Supplies | 5.2% | Oil, Gas & Consumable Fuels | 5.0% | Specialty Retail | 4.9% | Insurance | 4.7% | Hotels, Restaurants & Leisure | 4.3% | Semiconductors & Semiconductor Equipment | 4.0% | Communications Equipment | 3.9% | |
|
| Largest Holdings [Text Block] |
Top 10 Holdings (% of TNA as of 4/30/2026)Footnote Reference*Table SummaryTexas Instruments, Inc. | 4.0% |
|---|
Cisco Systems, Inc. | 3.9% |
|---|
JPMorgan Chase & Co. | 3.9% |
|---|
Morgan Stanley | 3.5% |
|---|
TE Connectivity PLC | 3.2% |
|---|
Ross Stores, Inc. | 3.2% |
|---|
RTX Corp. | 3.1% |
|---|
Allstate Corp. | 3.1% |
|---|
DTE Energy Co. | 2.8% |
|---|
Ferguson Enterprises, Inc. | 2.8% |
|---|
| Footnote | Description | Footnote* | Excludes short-term investment holdings. |
|
|
| Material Fund Change [Text Block] |
|
|
| C000118430 |
|
|
| Shareholder Report [Line Items] |
|
|
| Fund Name |
Glenmede Global Secured Options Portfolio
|
|
| Class Name |
Advisor Class
|
|
| Trading Symbol |
NOVIX
|
|
| Annual or Semi-Annual Statement [Text Block] |
This semi-annual shareholder report contains important information about the Glenmede Global Secured Options Portfolio - Advisor Class (NOVIX) (the "Portfolio") for the period of November 1, 2025 to April 30, 2026.
|
|
| Additional Information [Text Block] |
You can find additional information about the Portfolio at www.glenmedeim.com/funds/fund-documents/. You can also request this information by contacting us at 1-215-419-6662.
|
|
| Additional Information Phone Number |
1-215-419-6662
|
|
| Additional Information Website |
www.glenmedeim.com/funds/fund-documents/
|
|
| Expenses [Text Block] |
What were the Portfolio costs for the period? Portfolio Operating Expenses (based on a hypothetical $10,000 investment) Table SummaryTicker | Costs of a hypothetical $10,000 investmentFootnote Reference* | Costs paid as a percentage of a $10,000 investmentFootnote Reference* |
|---|
NOVIX | $45 | 0.85%Footnote Reference(a) |
|---|
| Footnote | Description | Footnote(a) | Annualized | Footnote* | Reflects fee waivers and/or expense reimbursements, without which expenses would be higher. |
|
|
| Expenses Paid, Amount |
$ 45
|
|
| Expense Ratio, Percent |
0.85%
|
[12] |
| AssetsNet |
$ 18,214,192
|
|
| Holdings Count | Holding |
13
|
|
| InvestmentCompanyPortfolioTurnover |
13.00%
|
|
| Additional Fund Statistics [Text Block] |
Key Portfolio Statistics (as of 4/30/2026)- Total Net Assets ("TNA")$18,214,192
- # of Portfolio Holdings13
- Portfolio Turnover Rate13%
|
|
| Holdings [Text Block] |
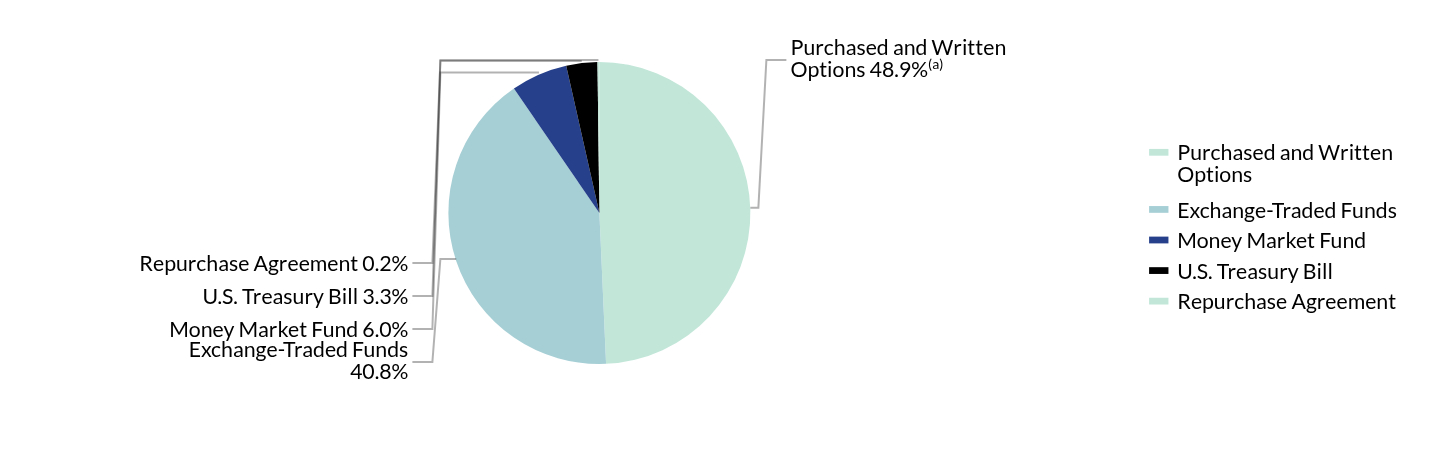
Sector Diversification (% of TNA as of 4/30/2026) Table SummaryValue | Value |
|---|
Purchased and Written Options | 48.9%Footnote Reference(a) | Exchange-Traded Funds | 40.8% | Money Market Fund | 6.0% | U.S. Treasury Bill | 3.3% | Repurchase Agreement | 0.2% | | Footnote | Description | Footnote(a) | The total percentage of net assets of purchased options and written options were 65.7% and -16.8%, respectively, as of April 30, 2026. |
|
|
| Material Fund Change [Text Block] |
|
|
| C000260454 |
|
|
| Shareholder Report [Line Items] |
|
|
| Fund Name |
Glenmede Global Secured Options Portfolio
|
|
| Class Name |
Institutional Class
|
|
| Trading Symbol |
NOVLX
|
|
| Annual or Semi-Annual Statement [Text Block] |
This semi-annual shareholder report contains important information about the Glenmede Global Secured Options Portfolio - Institutional Class (NOVLX) (the "Portfolio") for the period of November 1, 2025 to April 30, 2026.
|
|
| Additional Information [Text Block] |
You can find additional information about the Portfolio at www.glenmedeim.com/funds/fund-documents/. You can also request this information by contacting us at 1-215-419-6662.
|
|
| Additional Information Phone Number |
1-215-419-6662
|
|
| Additional Information Website |
www.glenmedeim.com/funds/fund-documents/
|
|
| Expenses [Text Block] |
What were the Portfolio costs for the period? Portfolio Operating Expenses (based on a hypothetical $10,000 investment) Table SummaryTicker | Costs of a hypothetical $10,000 investmentFootnote Reference* | Costs paid as a percentage of a $10,000 investmentFootnote Reference* |
|---|
NOVLX | $34 | 0.65%Footnote Reference(a) |
|---|
| Footnote | Description | Footnote(a) | Annualized | Footnote* | Reflects fee waivers and/or expense reimbursements, without which expenses would be higher. |
|
|
| Expenses Paid, Amount |
$ 34
|
|
| Expense Ratio, Percent |
0.65%
|
[13] |
| AssetsNet |
$ 18,214,192
|
|
| Holdings Count | Holding |
13
|
|
| InvestmentCompanyPortfolioTurnover |
13.00%
|
|
| Additional Fund Statistics [Text Block] |
Key Portfolio Statistics (as of 4/30/2026)- Total Net Assets ("TNA")$18,214,192
- # of Portfolio Holdings13
- Portfolio Turnover Rate13%
|
|
| Holdings [Text Block] |
Sector Diversification (% of TNA as of 4/30/2026) Table SummaryValue | Value |
|---|
Purchased and Written Options | 48.9%Footnote Reference(a) | Exchange-Traded Funds | 40.8% | Money Market Fund | 6.0% | U.S. Treasury Bill | 3.3% | Repurchase Agreement | 0.2% | | Footnote | Description | Footnote(a) | The total percentage of net assets of purchased options and written options were 65.7% and -16.8%, respectively, as of April 30, 2026. |
|
|
| Material Fund Change [Text Block] |
|
|
| C000035926 |
|
|
| Shareholder Report [Line Items] |
|
|
| Fund Name |
Glenmede Long/Short Equity Portfolio
|
|
| Class Name |
Advisor Class
|
|
| Trading Symbol |
GTAPX
|
|
| Annual or Semi-Annual Statement [Text Block] |
This semi-annual shareholder report contains important information about the Glenmede Long/Short Equity Portfolio - Advisor Class (GTAPX) (the "Portfolio") for the period of November 1, 2025 to April 30, 2026.
|
|
| Additional Information [Text Block] |
You can find additional information about the Portfolio at www.glenmedeim.com/funds/fund-documents/. You can also request this information by contacting us at 1-215-419-6662.
|
|
| Additional Information Phone Number |
1-215-419-6662
|
|
| Additional Information Website |
www.glenmedeim.com/funds/fund-documents/
|
|
| Expenses [Text Block] |
What were the Portfolio costs for the period? Portfolio Operating Expenses (based on a hypothetical $10,000 investment) Table SummaryTicker | Costs of a hypothetical $10,000 investmentFootnote Reference* | Costs paid as a percentage of a $10,000 investmentFootnote Reference* |
|---|
GTAPX | $118 | 2.28%Footnote Reference(a) |
|---|
| Footnote | Description | Footnote(a) | Annualized | Footnote* | Reflects fee waivers and/or expense reimbursements, without which expenses would be higher. |
|
|
| Expenses Paid, Amount |
$ 118
|
|
| Expense Ratio, Percent |
2.28%
|
[14] |
| AssetsNet |
$ 41,630,450
|
|
| Holdings Count | Holding |
177
|
|
| InvestmentCompanyPortfolioTurnover |
50.00%
|
|
| Additional Fund Statistics [Text Block] |
Key Portfolio Statistics (as of 4/30/2026)- Total Net Assets ("TNA")$41,630,450
- # of Portfolio Holdings177
- Portfolio Turnover Rate50%
|
|
| Holdings [Text Block] |
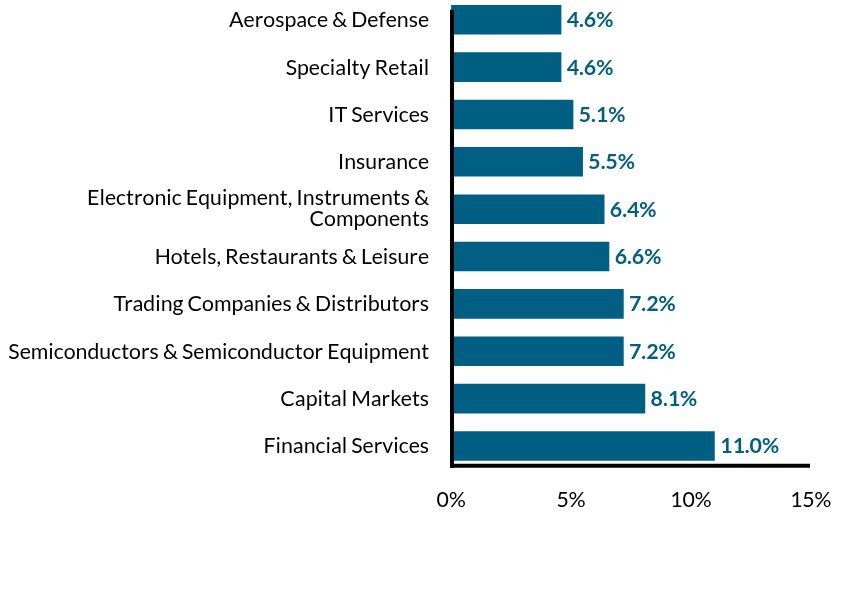
Top 10 Industries (% of TNA as of 4/30/2026)*Table SummaryValue | Value |
|---|
Financial Services | 11.0% | Capital Markets | 8.1% | Semiconductors & Semiconductor Equipment | 7.2% | Trading Companies & Distributors | 7.2% | Hotels, Restaurants & Leisure | 6.6% | Electronic Equipment, Instruments & Components | 6.4% | Insurance | 5.5% | IT Services | 5.1% | Specialty Retail | 4.6% | Aerospace & Defense | 4.6% | |
|
| Largest Holdings [Text Block] |
Top 10 Holdings (% of TNA as of 4/30/2026)Footnote Reference*Table SummarySanmina Corp. | 2.3% |
|---|
WESCO International, Inc. | 2.2% |
|---|
Baker Hughes Co. | 2.1% |
|---|
eBay, Inc. | 2.1% |
|---|
Applied Materials, Inc. | 2.0% |
|---|
Amphenol Corp., Class A | 1.9% |
|---|
Rush Enterprises, Inc., Class A | 1.9% |
|---|
Lam Research Corp. | 1.9% |
|---|
Gates Industrial Corp. PLC | 1.8% |
|---|
Union Pacific Corp. | 1.8%Footnote Reference(a) |
|---|
| Footnote | Description | Footnote(a) | Reflects the absolute value market value percentage for this security sold short. | Footnote* | Excludes short-term investment holdings. |
|
|
| Material Fund Change [Text Block] |
|
|
| C000211480 |
|
|
| Shareholder Report [Line Items] |
|
|
| Fund Name |
Glenmede Long/Short Equity Portfolio
|
|
| Class Name |
Institutional Class
|
|
| Trading Symbol |
GTLSX
|
|
| Annual or Semi-Annual Statement [Text Block] |
This semi-annual shareholder report contains important information about the Glenmede Long/Short Equity Portfolio - Institutional Class (GTLSX) (the "Portfolio") for the period of November 1, 2025 to April 30, 2026.
|
|
| Additional Information [Text Block] |
You can find additional information about the Portfolio at www.glenmedeim.com/funds/fund-documents/. You can also request this information by contacting us at 1-215-419-6662.
|
|
| Additional Information Phone Number |
1-215-419-6662
|
|
| Additional Information Website |
www.glenmedeim.com/funds/fund-documents/
|
|
| Expenses [Text Block] |
What were the Portfolio costs for the period? Portfolio Operating Expenses (based on a hypothetical $10,000 investment) Table SummaryTicker | Costs of a hypothetical $10,000 investmentFootnote Reference* | Costs paid as a percentage of a $10,000 investmentFootnote Reference* |
|---|
GTLSX | $106 | 2.05%Footnote Reference(a) |
|---|
| Footnote | Description | Footnote(a) | Annualized | Footnote* | Reflects fee waivers and/or expense reimbursements, without which expenses would be higher. |
|
|
| Expenses Paid, Amount |
$ 106
|
|
| Expense Ratio, Percent |
2.05%
|
[15] |
| AssetsNet |
$ 41,630,450
|
|
| Holdings Count | Holding |
177
|
|
| InvestmentCompanyPortfolioTurnover |
50.00%
|
|
| Additional Fund Statistics [Text Block] |
Key Portfolio Statistics (as of 4/30/2026)- Total Net Assets ("TNA")$41,630,450
- # of Portfolio Holdings177
- Portfolio Turnover Rate50%
|
|
| Holdings [Text Block] |
Top 10 Industries (% of TNA as of 4/30/2026)*Table SummaryValue | Value |
|---|
Financial Services | 11.0% | Capital Markets | 8.1% | Semiconductors & Semiconductor Equipment | 7.2% | Trading Companies & Distributors | 7.2% | Hotels, Restaurants & Leisure | 6.6% | Electronic Equipment, Instruments & Components | 6.4% | Insurance | 5.5% | IT Services | 5.1% | Specialty Retail | 4.6% | Aerospace & Defense | 4.6% | |
|
| Largest Holdings [Text Block] |
Top 10 Holdings (% of TNA as of 4/30/2026)Footnote Reference*Table SummarySanmina Corp. | 2.3% |
|---|
WESCO International, Inc. | 2.2% |
|---|
Baker Hughes Co. | 2.1% |
|---|
eBay, Inc. | 2.1% |
|---|
Applied Materials, Inc. | 2.0% |
|---|
Amphenol Corp., Class A | 1.9% |
|---|
Rush Enterprises, Inc., Class A | 1.9% |
|---|
Lam Research Corp. | 1.9% |
|---|
Gates Industrial Corp. PLC | 1.8% |
|---|
Union Pacific Corp. | 1.8%Footnote Reference(a) |
|---|
| Footnote | Description | Footnote(a) | Reflects the absolute value market value percentage for this security sold short. | Footnote* | Excludes short-term investment holdings. |
|
|
| Material Fund Change [Text Block] |
|
|
| C000090298 |
|
|
| Shareholder Report [Line Items] |
|
|
| Fund Name |
Glenmede Secured Options Portfolio
|
|
| Class Name |
Advisor Class
|
|
| Trading Symbol |
GTSOX
|
|
| Annual or Semi-Annual Statement [Text Block] |
This semi-annual shareholder report contains important information about the Glenmede Secured Options Portfolio - Advisor Class (GTSOX) (the "Portfolio") for the period of November 1, 2025 to April 30, 2026.
|
|
| Additional Information [Text Block] |
You can find additional information about the Portfolio at www.glenmedeim.com/funds/fund-documents/. You can also request this information by contacting us at 1-215-419-6662.
|
|
| Additional Information Phone Number |
1-215-419-6662
|
|
| Additional Information Website |
www.glenmedeim.com/funds/fund-documents/
|
|
| Expenses [Text Block] |
What were the Portfolio costs for the period? Portfolio Operating Expenses (based on a hypothetical $10,000 investment) Table SummaryTicker | Costs of a hypothetical $10,000 investment | Costs paid as a percentage of a $10,000 investment |
|---|
GTSOX | $45 | 0.89%Footnote Reference(a) |
|---|
| Footnote | Description | Footnote(a) | Annualized |
|
|
| Expenses Paid, Amount |
$ 45
|
|
| Expense Ratio, Percent |
0.89%
|
[16] |
| AssetsNet |
$ 363,140,380
|
|
| Holdings Count | Holding |
12
|
|
| InvestmentCompanyPortfolioTurnover |
0.00%
|
|
| Additional Fund Statistics [Text Block] |
Key Portfolio Statistics (as of 4/30/2026)- Total Net Assets ("TNA")$363,140,380
- # of Portfolio Holdings12
- Portfolio Turnover Rate0%
|
|
| Holdings [Text Block] |
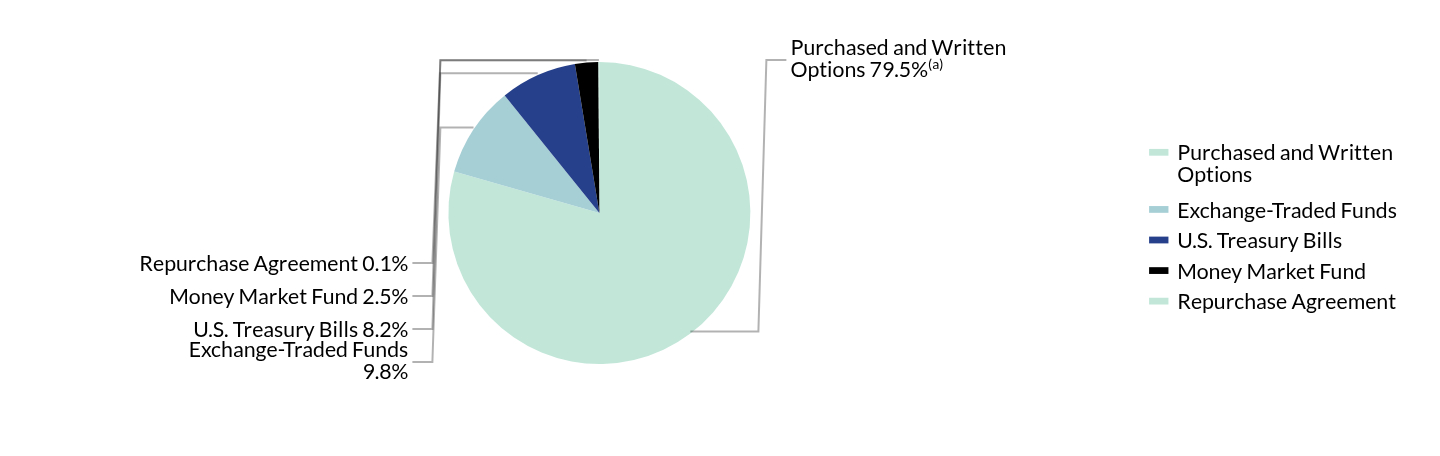
Sector Diversification (% of TNA as of 4/30/2026) Table SummaryValue | Value |
|---|
Purchased and Written Options | 79.5%Footnote Reference(a) | Exchange-Traded Funds | 9.8% | U.S. Treasury Bills | 8.2% | Money Market Fund | 2.5% | Repurchase Agreement | 0.1% | | Footnote | Description | Footnote(a) | The total percentage of net assets of purchased options and written options were 106.6% and -27.1%, respectively, as of April 30, 2026. |
|
|
| Material Fund Change [Text Block] |
|
|
| C000173616 |
|
|
| Shareholder Report [Line Items] |
|
|
| Fund Name |
Glenmede Secured Options Portfolio
|
|
| Class Name |
Institutional Class
|
|
| Trading Symbol |
GLSOX
|
|
| Annual or Semi-Annual Statement [Text Block] |
This semi-annual shareholder report contains important information about the Glenmede Secured Options Portfolio - Institutional Class (GLSOX) (the "Portfolio") for the period of November 1, 2025 to April 30, 2026.
|
|
| Additional Information [Text Block] |
You can find additional information about the Portfolio at www.glenmedeim.com/funds/fund-documents/. You can also request this information by contacting us at 1-215-419-6662.
|
|
| Additional Information Phone Number |
1-215-419-6662
|
|
| Additional Information Website |
www.glenmedeim.com/funds/fund-documents/
|
|
| Expenses [Text Block] |
What were the Portfolio costs for the period? Portfolio Operating Expenses (based on a hypothetical $10,000 investment) Table SummaryTicker | Costs of a hypothetical $10,000 investment | Costs paid as a percentage of a $10,000 investment |
|---|
GLSOX | $35 | 0.69%Footnote Reference(a) |
|---|
| Footnote | Description | Footnote(a) | Annualized |
|
|
| Expenses Paid, Amount |
$ 35
|
|
| Expense Ratio, Percent |
0.69%
|
[17] |
| AssetsNet |
$ 363,140,380
|
|
| Holdings Count | Holding |
12
|
|
| InvestmentCompanyPortfolioTurnover |
0.00%
|
|
| Additional Fund Statistics [Text Block] |
Key Portfolio Statistics (as of 4/30/2026)- Total Net Assets ("TNA")$363,140,380
- # of Portfolio Holdings12
- Portfolio Turnover Rate0%
|
|
| Holdings [Text Block] |
Sector Diversification (% of TNA as of 4/30/2026) Table SummaryValue | Value |
|---|
Purchased and Written Options | 79.5%Footnote Reference(a) | Exchange-Traded Funds | 9.8% | U.S. Treasury Bills | 8.2% | Money Market Fund | 2.5% | Repurchase Agreement | 0.1% | | Footnote | Description | Footnote(a) | The total percentage of net assets of purchased options and written options were 106.6% and -27.1%, respectively, as of April 30, 2026. |
|
|
| Material Fund Change [Text Block] |
|
|
| C000017538 |
|
|
| Shareholder Report [Line Items] |
|
|
| Fund Name |
Glenmede Small Cap Equity Portfolio
|
|
| Class Name |
Advisor Class
|
|
| Trading Symbol |
GTCSX
|
|
| Annual or Semi-Annual Statement [Text Block] |
This semi-annual shareholder report contains important information about the Glenmede Small Cap Equity Portfolio - Advisor Class (GTCSX) (the "Portfolio") for the period of November 1, 2025 to April 30, 2026.
|
|
| Additional Information [Text Block] |
You can find additional information about the Portfolio at www.glenmedeim.com/funds/fund-documents/. You can also request this information by contacting us at 1-215-419-6662.
|
|
| Additional Information Phone Number |
1-215-419-6662
|
|
| Additional Information Website |
www.glenmedeim.com/funds/fund-documents/
|
|
| Expenses [Text Block] |
What were the Portfolio costs for the period? Portfolio Operating Expenses (based on a hypothetical $10,000 investment) Table SummaryTicker | Costs of a hypothetical $10,000 investment | Costs paid as a percentage of a $10,000 investment |
|---|
GTCSX | $50 | 0.96%Footnote Reference(a) |
|---|
| Footnote | Description | Footnote(a) | Annualized |
|
|
| Expenses Paid, Amount |
$ 50
|
|
| Expense Ratio, Percent |
0.96%
|
[18] |
| AssetsNet |
$ 983,860,977
|
|
| Holdings Count | Holding |
87
|
|
| InvestmentCompanyPortfolioTurnover |
17.00%
|
|
| Additional Fund Statistics [Text Block] |
Key Portfolio Statistics (as of 4/30/2026)- Total Net Assets ("TNA")$983,860,977
- # of Portfolio Holdings87
- Portfolio Turnover Rate17%
|
|
| Holdings [Text Block] |
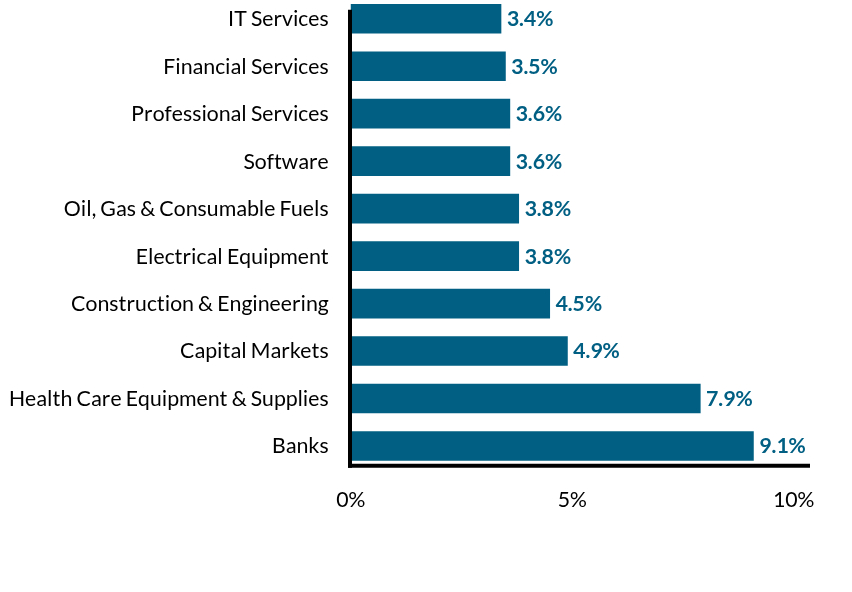
Top 10 Industries (% of TNA as of 4/30/2026)*Table SummaryValue | Value |
|---|
Banks | 9.1% | Health Care Equipment & Supplies | 7.9% | Capital Markets | 4.9% | Construction & Engineering | 4.5% | Electrical Equipment | 3.8% | Oil, Gas & Consumable Fuels | 3.8% | Software | 3.6% | Professional Services | 3.6% | Financial Services | 3.5% | IT Services | 3.4% | |
|
| Largest Holdings [Text Block] |
Top 10 Holdings (% of TNA as of 4/30/2026)Footnote Reference*Table SummaryEnerSys | 2.4% |
|---|
TTM Technologies, Inc. | 2.0% |
|---|
WESCO International, Inc. | 1.9% |
|---|
Diodes, Inc. | 1.8% |
|---|
Stifel Financial Corp. | 1.8% |
|---|
Arcosa, Inc. | 1.7% |
|---|
CACI International, Inc., Class A | 1.7% |
|---|
Dycom Industries, Inc. | 1.7% |
|---|
FNB Corp. | 1.7% |
|---|
Frontdoor, Inc. | 1.7% |
|---|
| Footnote | Description | Footnote* | Excludes short-term investment holdings. |
|
|
| Material Fund Change [Text Block] |
|
|
| C000017539 |
|
|
| Shareholder Report [Line Items] |
|
|
| Fund Name |
Glenmede Small Cap Equity Portfolio
|
|
| Class Name |
Institutional Class
|
|
| Trading Symbol |
GTSCX
|
|
| Annual or Semi-Annual Statement [Text Block] |
This semi-annual shareholder report contains important information about the Glenmede Small Cap Equity Portfolio - Institutional Class (GTSCX) (the "Portfolio") for the period of November 1, 2025 to April 30, 2026.
|
|
| Additional Information [Text Block] |
You can find additional information about the Portfolio at www.glenmedeim.com/funds/fund-documents/. You can also request this information by contacting us at 1-215-419-6662.
|
|
| Additional Information Phone Number |
1-215-419-6662
|
|
| Additional Information Website |
www.glenmedeim.com/funds/fund-documents/
|
|
| Expenses [Text Block] |
What were the Portfolio costs for the period? Portfolio Operating Expenses (based on a hypothetical $10,000 investment) Table SummaryTicker | Costs of a hypothetical $10,000 investment | Costs paid as a percentage of a $10,000 investment |
|---|
GTSCX | $40 | 0.76%Footnote Reference(a) |
|---|
| Footnote | Description | Footnote(a) | Annualized |
|
|
| Expenses Paid, Amount |
$ 40
|
|
| Expense Ratio, Percent |
0.76%
|
[19] |
| AssetsNet |
$ 983,860,977
|
|
| Holdings Count | Holding |
87
|
|
| InvestmentCompanyPortfolioTurnover |
17.00%
|
|
| Additional Fund Statistics [Text Block] |
Key Portfolio Statistics (as of 4/30/2026)- Total Net Assets ("TNA")$983,860,977
- # of Portfolio Holdings87
- Portfolio Turnover Rate17%
|
|
| Holdings [Text Block] |
Top 10 Industries (% of TNA as of 4/30/2026)*Table SummaryValue | Value |
|---|
Banks | 9.1% | Health Care Equipment & Supplies | 7.9% | Capital Markets | 4.9% | Construction & Engineering | 4.5% | Electrical Equipment | 3.8% | Oil, Gas & Consumable Fuels | 3.8% | Software | 3.6% | Professional Services | 3.6% | Financial Services | 3.5% | IT Services | 3.4% | |
|
| Largest Holdings [Text Block] |
Top 10 Holdings (% of TNA as of 4/30/2026)Footnote Reference*Table SummaryEnerSys | 2.4% |
|---|
TTM Technologies, Inc. | 2.0% |
|---|
WESCO International, Inc. | 1.9% |
|---|
Diodes, Inc. | 1.8% |
|---|
Stifel Financial Corp. | 1.8% |
|---|
Arcosa, Inc. | 1.7% |
|---|
CACI International, Inc., Class A | 1.7% |
|---|
Dycom Industries, Inc. | 1.7% |
|---|
FNB Corp. | 1.7% |
|---|
Frontdoor, Inc. | 1.7% |
|---|
| Footnote | Description | Footnote* | Excludes short-term investment holdings. |
|
|
| Material Fund Change [Text Block] |
|
|
| C000164152 |
|
|
| Shareholder Report [Line Items] |
|
|
| Fund Name |
Glenmede SMID Core Equity Portfolio
|
|
| Class Name |
Advisor Class
|
|
| Trading Symbol |
GWILX
|
|
| Annual or Semi-Annual Statement [Text Block] |
This semi-annual shareholder report contains important information about the Glenmede SMID Core Equity Portfolio - Advisor Class (GWILX) (the "Portfolio") for the period of November 1, 2025 to April 30, 2026.
|
|
| Additional Information [Text Block] |
You can find additional information about the Portfolio at www.glenmedeim.com/funds/fund-documents/. You can also request this information by contacting us at 1-215-419-6662.
|
|
| Additional Information Phone Number |
1-215-419-6662
|
|
| Additional Information Website |
www.glenmedeim.com/funds/fund-documents/
|
|
| Expenses [Text Block] |
What were the Portfolio costs for the period? Portfolio Operating Expenses (based on a hypothetical $10,000 investment) Table SummaryTicker | Costs of a hypothetical $10,000 investmentFootnote Reference* | Costs paid as a percentage of a $10,000 investmentFootnote Reference* |
|---|
GWILX | $42 | 0.85%Footnote Reference(a) |
|---|
| Footnote | Description | Footnote(a) | Annualized | Footnote* | Reflects fee waivers and/or expense reimbursements, without which expenses would be higher. |
|
|
| Expenses Paid, Amount |
$ 42
|
|
| Expense Ratio, Percent |
0.85%
|
[20] |
| AssetsNet |
$ 3,685,221
|
|
| Holdings Count | Holding |
25
|
|
| InvestmentCompanyPortfolioTurnover |
30.00%
|
|
| Additional Fund Statistics [Text Block] |
Key Portfolio Statistics (as of 4/30/2026)- Total Net Assets ("TNA")$3,685,221
- # of Portfolio Holdings25
- Portfolio Turnover Rate30%
|
|
| Holdings [Text Block] |
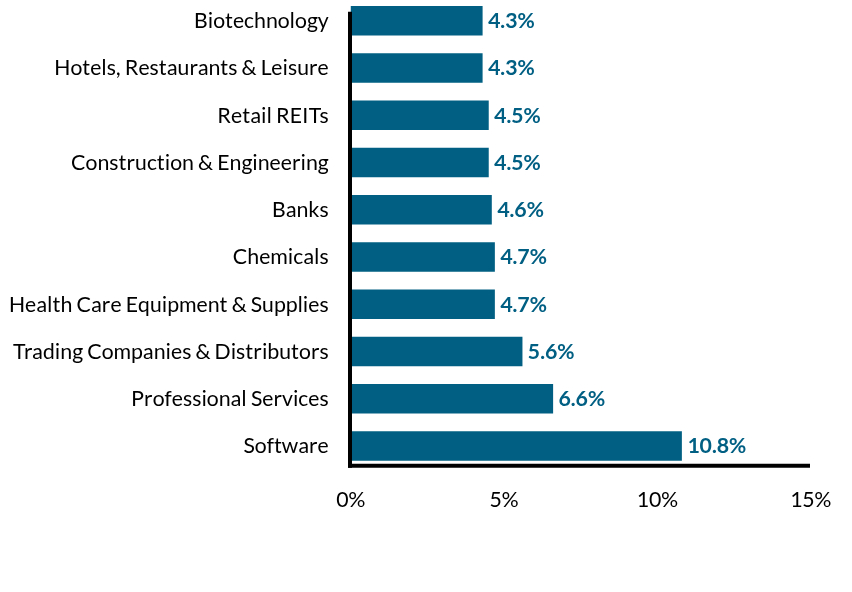
Top 10 Industries (% of TNA as of 4/30/2026)*Table SummaryValue | Value |
|---|
Software | 10.8% | Professional Services | 6.6% | Trading Companies & Distributors | 5.6% | Health Care Equipment & Supplies | 4.7% | Chemicals | 4.7% | Banks | 4.6% | Construction & Engineering | 4.5% | Retail REITs | 4.5% | Hotels, Restaurants & Leisure | 4.3% | Biotechnology | 4.3% | |
|
| Largest Holdings [Text Block] |
Top 10 Holdings (% of TNA as of 4/30/2026)Footnote Reference*Table SummaryWESCO International, Inc. | 5.6% |
|---|
Globus Medical, Inc., Class A | 4.7% |
|---|
Minerals Technologies, Inc. | 4.7% |
|---|
Truist Financial Corp. | 4.6% |
|---|
EMCOR Group, Inc. | 4.5% |
|---|
Zoom Communications, Inc. | 4.5% |
|---|
InvenTrust Properties Corp. | 4.5% |
|---|
MGM Resorts International | 4.3% |
|---|
Catalyst Pharmaceuticals, Inc. | 4.3% |
|---|
World Kinect Corp. | 4.1% |
|---|
| Footnote | Description | Footnote* | Excludes short-term investment holdings. |
|
|
| Material Fund Change [Text Block] |
|
|
| C000017540 |
|
|
| Shareholder Report [Line Items] |
|
|
| Fund Name |
Glenmede Strategic Equity Portfolio
|
|
| Class Name |
Advisor Class
|
|
| Trading Symbol |
GTCEX
|
|
| Annual or Semi-Annual Statement [Text Block] |
This semi-annual shareholder report contains important information about the Glenmede Strategic Equity Portfolio - Advisor Class (GTCEX) (the "Portfolio") for the period of November 1, 2025 to April 30, 2026.
|
|
| Additional Information [Text Block] |
You can find additional information about the Portfolio at www.glenmedeim.com/funds/fund-documents/. You can also request this information by contacting us at 1-215-419-6662.
|
|
| Additional Information Phone Number |
1-215-419-6662
|
|
| Additional Information Website |
www.glenmedeim.com/funds/fund-documents/
|
|
| Expenses [Text Block] |
What were the Portfolio costs for the period? Portfolio Operating Expenses (based on a hypothetical $10,000 investment) Table SummaryTicker | Costs of a hypothetical $10,000 investment | Costs paid as a percentage of a $10,000 investment |
|---|
GTCEX | $45 | 0.90%Footnote Reference(a) |
|---|
| Footnote | Description | Footnote(a) | Annualized |
|
|
| Expenses Paid, Amount |
$ 45
|
|
| Expense Ratio, Percent |
0.90%
|
[21] |
| AssetsNet |
$ 108,799,330
|
|
| Holdings Count | Holding |
42
|
|
| InvestmentCompanyPortfolioTurnover |
8.00%
|
|
| Additional Fund Statistics [Text Block] |
Key Portfolio Statistics (as of 4/30/2026)- Total Net Assets ("TNA")$108,799,330
- # of Portfolio Holdings42
- Portfolio Turnover Rate8%
|
|
| Holdings [Text Block] |
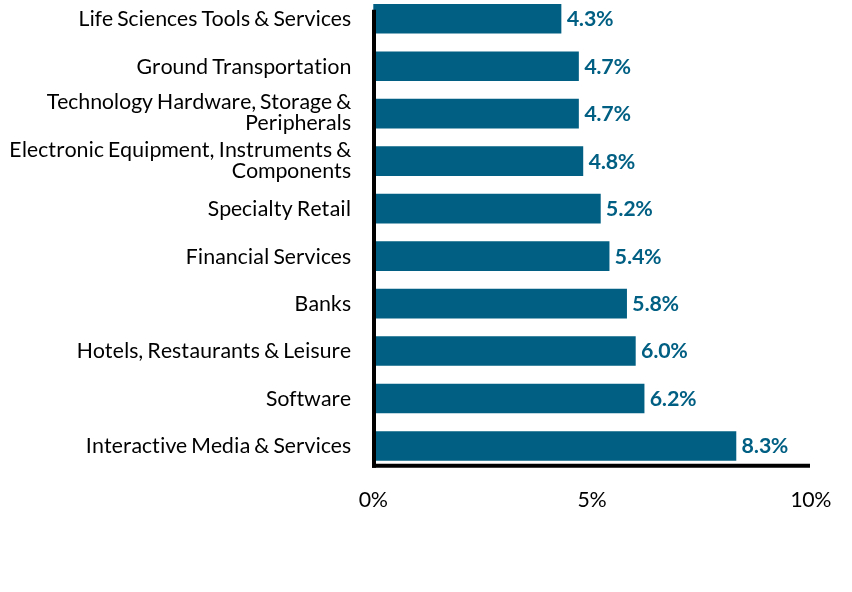
Top 10 Industries (% of TNA as of 4/30/2026)*Table SummaryValue | Value |
|---|
Interactive Media & Services | 8.3% | Software | 6.2% | Hotels, Restaurants & Leisure | 6.0% | Banks | 5.8% | Financial Services | 5.4% | Specialty Retail | 5.2% | Electronic Equipment, Instruments & Components | 4.8% | Technology Hardware, Storage & Peripherals | 4.7% | Ground Transportation | 4.7% | Life Sciences Tools & Services | 4.3% | |
|
| Largest Holdings [Text Block] |
Top 10 Holdings (% of TNA as of 4/30/2026)Footnote Reference*Table SummaryAlphabet, Inc., Class C | 8.3% |
|---|
Amphenol Corp., Class A | 4.8% |
|---|
Microsoft Corp. | 4.8% |
|---|
Apple, Inc. | 4.7% |
|---|
Mastercard, Inc., Class A | 4.2% |
|---|
Booking Holdings, Inc. | 3.7% |
|---|
Cisco Systems, Inc. | 3.5% |
|---|
JPMorgan Chase & Co. | 3.4% |
|---|
Amazon.com, Inc. | 3.0% |
|---|
Parker-Hannifin Corp. | 2.9% |
|---|
| Footnote | Description | Footnote* | Excludes short-term investment holdings. |
|
|
| Material Fund Change [Text Block] |
|
|
| C000035927 |
|
|
| Shareholder Report [Line Items] |
|
|
| Fund Name |
Glenmede Total Market Plus Equity Portfolio
|
|
| Class Name |
Advisor Class
|
|
| Trading Symbol |
GTTMX
|
|
| Annual or Semi-Annual Statement [Text Block] |
This semi-annual shareholder report contains important information about the Glenmede Total Market Plus Equity Portfolio - Advisor Class (GTTMX) (the "Portfolio") for the period of November 1, 2025 to April 30, 2026.
|
|
| Additional Information [Text Block] |
You can find additional information about the Portfolio at www.glenmedeim.com/funds/fund-documents/. You can also request this information by contacting us at 1-215-419-6662.
|
|
| Additional Information Phone Number |
1-215-419-6662
|
|
| Additional Information Website |
www.glenmedeim.com/funds/fund-documents/
|
|
| Expenses [Text Block] |
What were the Portfolio costs for the period? Portfolio Operating Expenses (based on a hypothetical $10,000 investment) Table SummaryTicker | Costs of a hypothetical $10,000 investmentFootnote Reference* | Costs paid as a percentage of a $10,000 investmentFootnote Reference* |
|---|
GTTMX | $101 | 1.91%Footnote Reference(a) |
|---|
| Footnote | Description | Footnote(a) | Annualized | Footnote* | Reflects fee waivers and/or expense reimbursements, without which expenses would be higher. |
|
|
| Expenses Paid, Amount |
$ 101
|
|
| Expense Ratio, Percent |
1.91%
|
[22] |
| AssetsNet |
$ 24,556,074
|
|
| Holdings Count | Holding |
185
|
|
| InvestmentCompanyPortfolioTurnover |
38.00%
|
|
| Additional Fund Statistics [Text Block] |
Key Portfolio Statistics (as of 4/30/2026)- Total Net Assets ("TNA")$24,556,074
- # of Portfolio Holdings185
- Portfolio Turnover Rate38%
|
|
| Holdings [Text Block] |
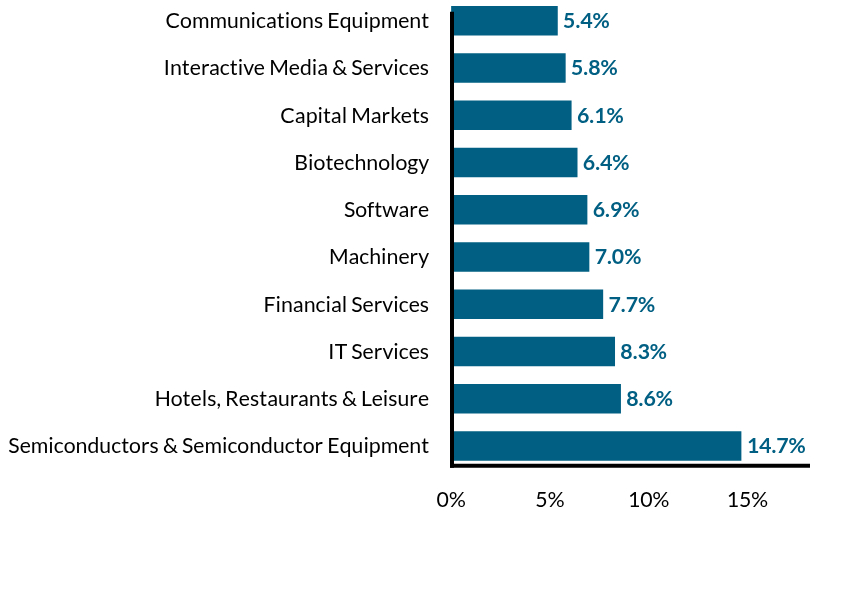
Top 10 Industries (% of TNA as of 4/30/2026)*Table SummaryValue | Value |
|---|
Semiconductors & Semiconductor Equipment | 14.7% | Hotels, Restaurants & Leisure | 8.6% | IT Services | 8.3% | Financial Services | 7.7% | Machinery | 7.0% | Software | 6.9% | Biotechnology | 6.4% | Capital Markets | 6.1% | Interactive Media & Services | 5.8% | Communications Equipment | 5.4% | |
|
| Largest Holdings [Text Block] |
Top 10 Holdings (% of TNA as of 4/30/2026)Footnote Reference*Table SummaryApplied Materials, Inc. | 3.1% |
|---|
KLA Corp. | 3.0% |
|---|
Baker Hughes Co. | 3.0% |
|---|
Catalyst Pharmaceuticals, Inc. | 2.9% |
|---|
Lam Research Corp. | 2.9% |
|---|
Alphabet, Inc., Class A | 2.8% |
|---|
F5, Inc. | 2.8% |
|---|
eBay, Inc. | 2.8% |
|---|
Cisco Systems, Inc. | 2.6% |
|---|
WESCO International, Inc. | 2.6% |
|---|
| Footnote | Description | Footnote* | Excludes short-term investment holdings. |
|
|
| Material Fund Change [Text Block] |
|
|
| C000272247 |
|
|
| Shareholder Report [Line Items] |
|
|
| Fund Name |
Glenmede Total Market Plus Equity Portfolio
|
|
| Class Name |
Institutional Class
|
|
| Trading Symbol |
GTTLX
|
|
| Annual or Semi-Annual Statement [Text Block] |
This semi-annual shareholder report contains important information about the Glenmede Total Market Plus Equity Portfolio - Institutional Class (GTTLX) (the "Portfolio") for the period of March 9, 2026 to April 30, 2026.
|
|
| Additional Information [Text Block] |
You can find additional information about the Portfolio at www.glenmedeim.com/funds/fund-documents/. You can also request this information by contacting us at 1-215-419-6662.
|
|
| Additional Information Phone Number |
1-215-419-6662
|
|
| Additional Information Website |
www.glenmedeim.com/funds/fund-documents/
|
|
| Expenses [Text Block] |
What were the Portfolio costs for the period? Portfolio Operating Expenses (based on a hypothetical $10,000 investment) Table SummaryTicker | Costs of a hypothetical $10,000 investmentFootnote Reference* | Costs paid as a percentage of a $10,000 investmentFootnote Reference* |
|---|
GTTLX | $17 | 1.14%Footnote Reference(a)Footnote Reference(b) |
|---|
| Footnote | Description | Footnote(a) | Annualized | Footnote(b) | The Institutional Class commenced operations during the reporting period. Expenses for a full reporting period would be higher than the amount shown. | Footnote* | Reflects fee waivers and/or expense reimbursements, without which expenses would be higher. |
|
|
| Expenses Paid, Amount |
$ 17
|
|
| Expense Ratio, Percent |
1.14%
|
[23],[24] |
| Expenses Short Period Footnote [Text Block] |
The Institutional Class commenced operations during the reporting period. Expenses for a full reporting period would be higher than the amount shown.
|
|
| AssetsNet |
$ 24,556,074
|
|
| Holdings Count | Holding |
185
|
|
| InvestmentCompanyPortfolioTurnover |
38.00%
|
|
| Additional Fund Statistics [Text Block] |
Key Portfolio Statistics (as of 4/30/2026)- Total Net Assets ("TNA")$24,556,074
- # of Portfolio Holdings185
- Portfolio Turnover Rate38%
|
|
| Holdings [Text Block] |
Top 10 Industries (% of TNA as of 4/30/2026)*Table SummaryValue | Value |
|---|
Semiconductors & Semiconductor Equipment | 14.7% | Hotels, Restaurants & Leisure | 8.6% | IT Services | 8.3% | Financial Services | 7.7% | Machinery | 7.0% | Software | 6.9% | Biotechnology | 6.4% | Capital Markets | 6.1% | Interactive Media & Services | 5.8% | Communications Equipment | 5.4% | |
|
| Largest Holdings [Text Block] |
Top 10 Holdings (% of TNA as of 4/30/2026)Footnote Reference*Table SummaryApplied Materials, Inc. | 3.1% |
|---|
KLA Corp. | 3.0% |
|---|
Baker Hughes Co. | 3.0% |
|---|
Catalyst Pharmaceuticals, Inc. | 2.9% |
|---|
Lam Research Corp. | 2.9% |
|---|
Alphabet, Inc., Class A | 2.8% |
|---|
F5, Inc. | 2.8% |
|---|
eBay, Inc. | 2.8% |
|---|
Cisco Systems, Inc. | 2.6% |
|---|
WESCO International, Inc. | 2.6% |
|---|
| Footnote | Description | Footnote* | Excludes short-term investment holdings. |
|
|
| Material Fund Change [Text Block] |
|
|
|
|