Pay vs Performance Disclosure - USD ($)
Dec. 31, 2025
Dec. 31, 2024
Dec. 31, 2023
Pay Versus Performance
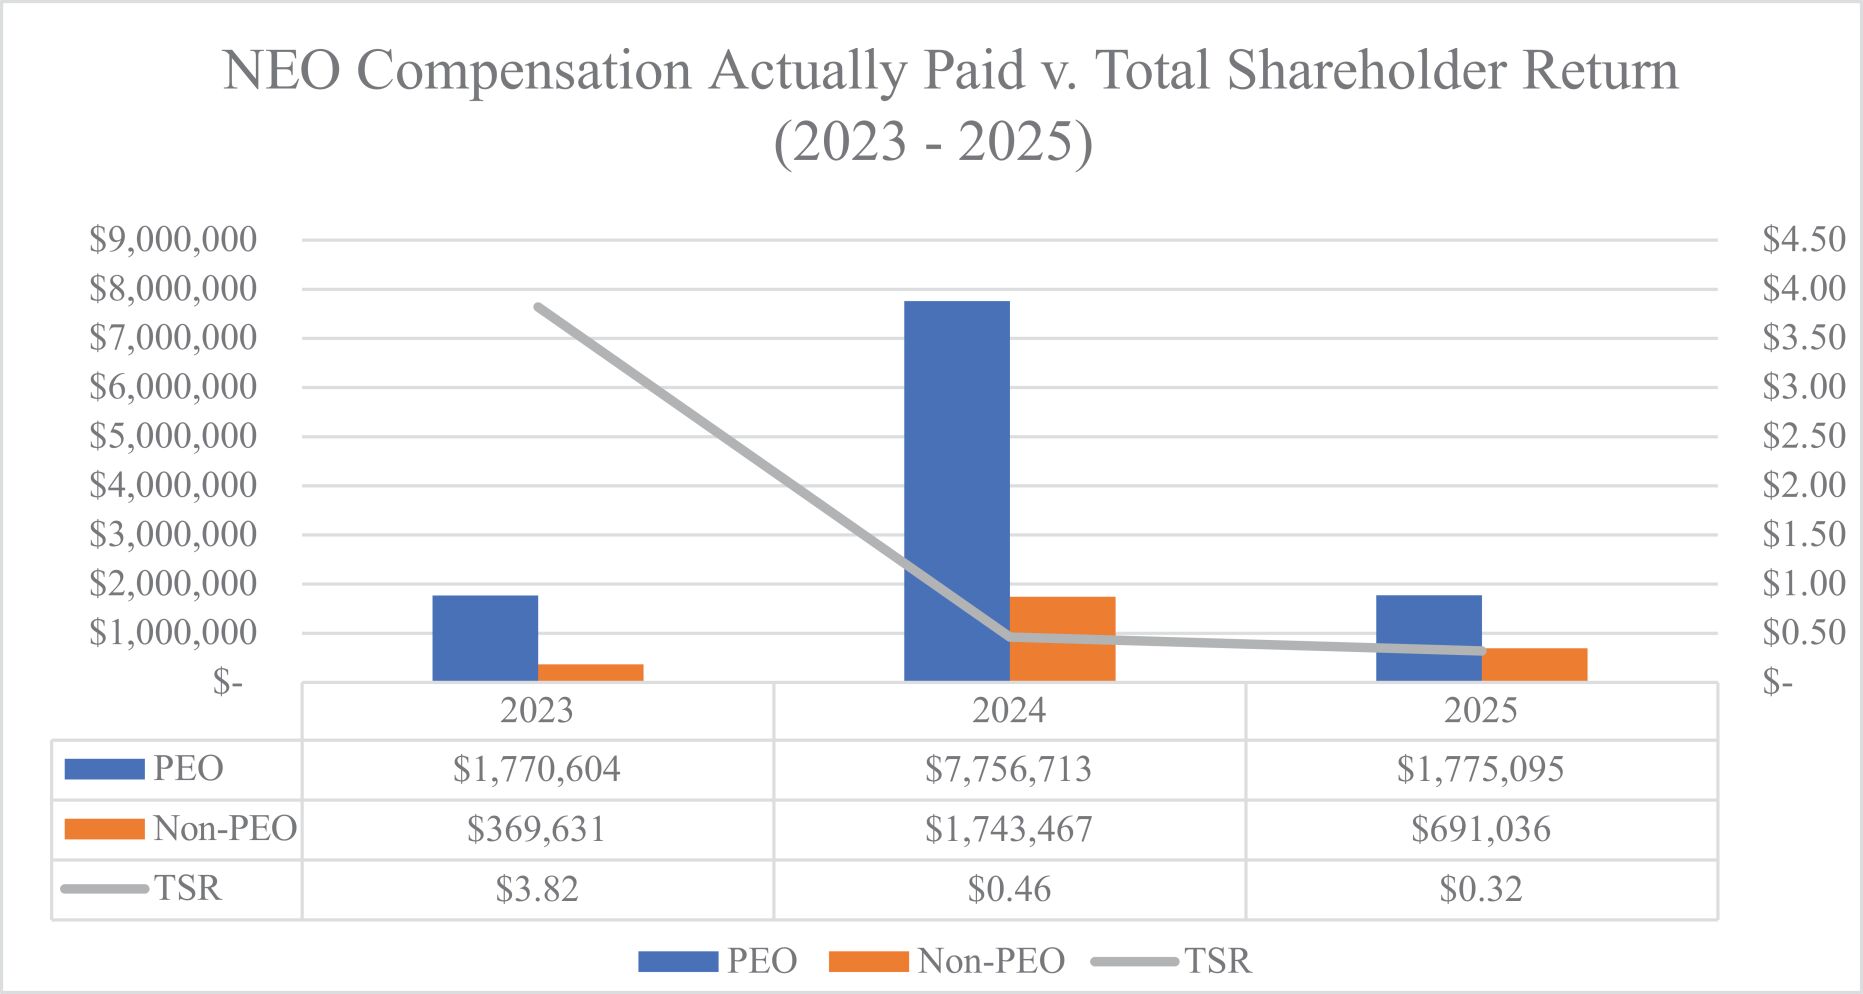
The following section has been prepared in accordance with pay versus performance rules adopted by the SEC pursuant to the Dodd-Frank Wall Street Reform and Consumer Protection Act of 2010. Under these new rules, the SEC has developed a definition of pay, referred to as Compensation Actually Paid (“CAP”). We are required to calculate CAP for the NEOs and then compare it with certain of our performance measures. Stockholders should refer to our compensation philosophy discussion and analysis in this proxy statement for a complete description of how executive compensation relates to our performance measures and how our Compensation Committee makes its decisions related thereto. Our Compensation Committee did not consider this
SEC-required
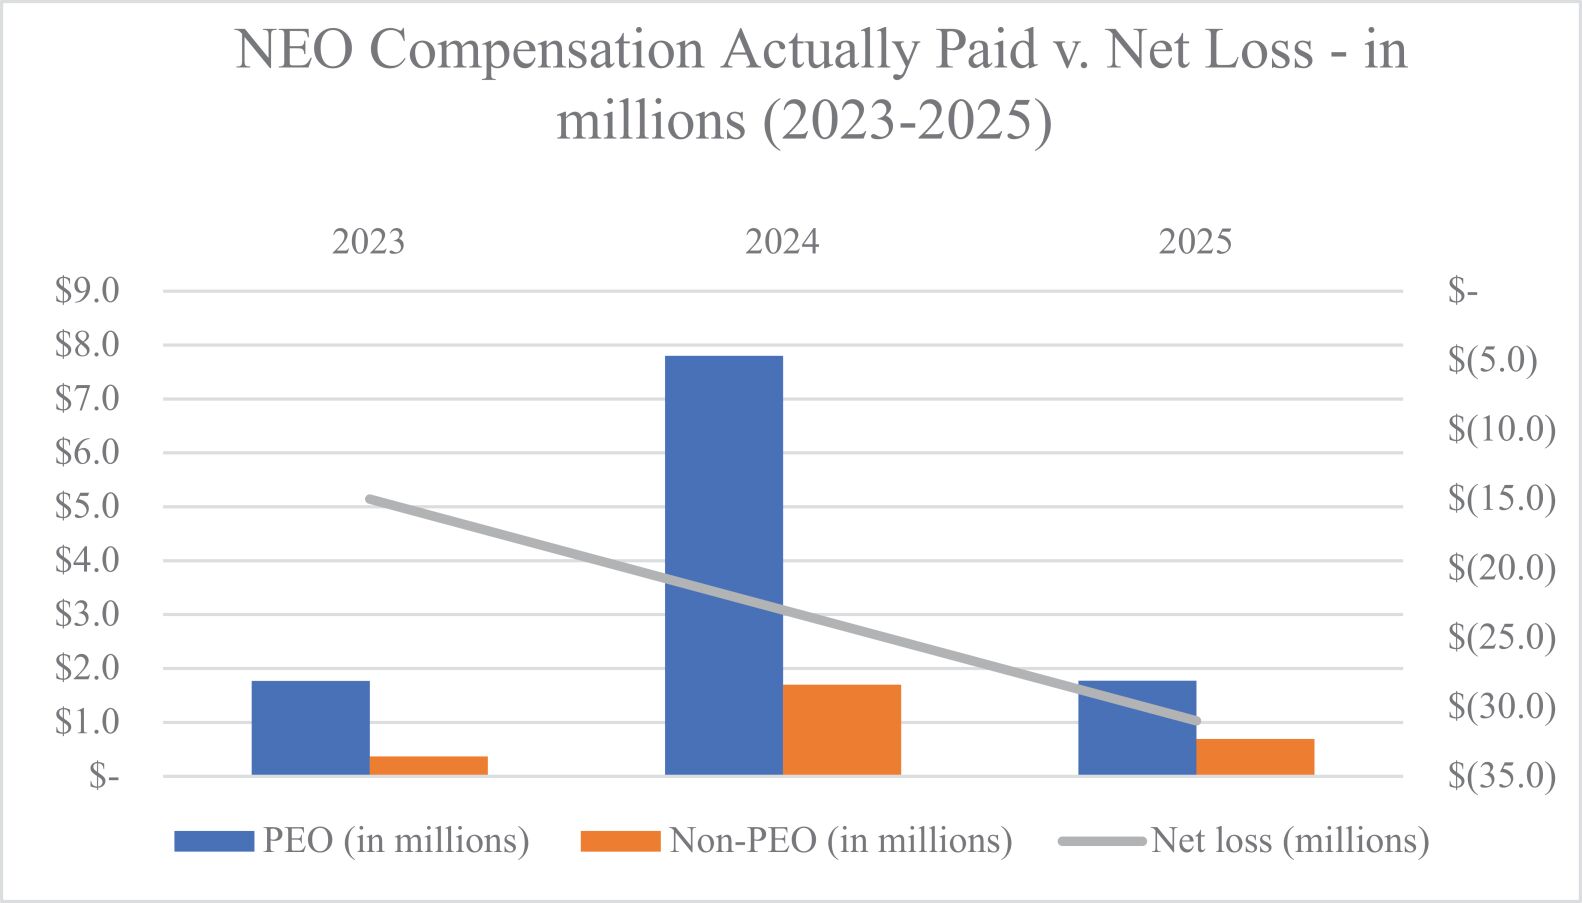
pay versus performance analysis and disclosure below in making its pay decisions for any of the years shown. The following table shows the past three fiscal years’ total compensation for the NEOs as set forth in the Summary Compensation Table (“SCT”), the CAP to the NEOs (as determined pursuant to SEC rules), our total stockholder return (“TSR”), and our net loss. We are a “smaller reporting company,” as defined in Rule
12b-2
under the Exchange Act, and have elected to provide in this proxy statement certain scaled disclosures permitted under the Exchange Act for smaller reporting companies. SEC rules require certain adjustments be made to the SCT totals to determine CAP as reported in the pay versus performance table. CAP does not necessarily represent cash and/or equity value transferred to the applicable NEOs without restriction, but rather is a valuation calculated under applicable SEC rules. The methodology for calculating CAP as required by Item 402(v) of Regulation
S-K
takes into account, among others, changes in share price and its impact on the fair value of equity awards. For information on our executive compensation program and the approach used by our Compensation Committee, please refer to the “Executive Compensation” narrative and the outstanding equity awards table. The
following table provides information about our principal executive officer (PEO) and
non-PEO
NEOs and certain financial performance information for the reported years. | Year | Summary Compensation Total for Dr. Bianco ($) (1)(a) |
Summary Compensation Total for Mr. Hoffman ($) (1)(b) |
Compensation actually paid to Dr. Bianco ($) (2) |
Compensation actually paid to Mr. Hoffman ($) (2) |
Average Summary Compensation Table Total for non-PEO ($) (3) |
Average Summary Compensation actually paid for non-PEO ($) (2) |
Value of initial fixed $100 Investment based on Total Shareholder Return (4) |
Net Income (Loss) (millions) (5) |
||||||||||||||||||||||||
2025 |
3,987,095 | — | 1,775,095 | — | 1,832,036 | 691,036 | 0.32 | (31.0 | ) | |||||||||||||||||||||||
2024 |
6,067,484 | 2,441,229 | 5,315,484 | 2,441,229 | 1,723,967 | 1,555,967 | 0.46 | (23.0 | ) | |||||||||||||||||||||||
2023 |
1,211,585 | 1,184,363 | 1,211,585 | 559,019 | 325,030 | 369,631 | 3.82 | (15.0 | ) | |||||||||||||||||||||||
| (1) | The dollar amounts reported in each column (a) are the amounts of total compensation reported for Dr. Bianco (TuHURA’s current Chief Executive Officer), and (b) Robert Hoffman (TuHURA’s former Chief Executive Officer prior to the completion of the Kintara Merger). |
| (2) | The dollar amounts reported in these columns represent the amount of “compensation actually paid” to TuHURA’s PEOs and the average “compensation actually paid” to TuHURA’s non-PEO NEOs, as computed in accordance with Item 402(v) of Regulation S-K, for each covered fiscal year. In accordance with these rules, these amounts reflect total compensation as set forth in the SCT for each year, adjusted as shown below. Equity values are calculated in accordance with FASB ASC Topic 718, and the valuation assumptions used to calculate fair values did not materially differ from those disclosed at the time of grant. The dollar amounts do not reflect the actual amount of compensation earned or received by or paid to the PEOs or non-PEO NEOs during the applicable fiscal year. |
Dr. Bianco 2025 ($) |
Mr. Hoffman 2025 ($) |
Average Other NEOs ($) |
||||||||||
Deduction for amounts reported under the option awards column in the summary compensation table |
(2,872,000 | ) | — | (1,288,000 | ) | |||||||
ASC 718 Fair Value of Awards Granted during Applicable FY that Remain Unvested as of Applicable FY End, determined as of Applicable FY End |
2,064,000 | — | 926,000 | |||||||||
ASC 718 Fair Value of Awards Granted during Applicable FY that Vested during Applicable FY, determined as of Vesting Date |
— | — | — | |||||||||
Increase/deduction for Awards Granted during Prior FY that were Outstanding and Unvested as of Applicable FY End, determined based on change in ASC 718 Fair Value from Prior FY End to Applicable FY End |
(1,172,000 | ) | — | (710,000 | ) | |||||||
Increase/deduction for Awards Granted during Prior FY that Vested During Applicable FY, determined based on change in ASC 718 Fair Value from Prior FY End to Vesting Date |
(232,000 | ) | — | (69,000 | ) | |||||||
Deduction of ASC 718 Fair Value of Awards Granted during Prior FY that were Forfeited during Applicable FY, determined as of Prior FY End |
— | — | — | |||||||||
TOTAL ADJUSTMENTS |
(2,212,000 | ) | — | (1,141,000 | ) | |||||||
| (3) | The dollar amounts reported represent the average of the amounts reported for TuHURA’s NEOs as a group (excluding TuHURA’s PEOs) in the “Total” column of the SCT in each applicable year. The names of each of the NEOs included for purposes of calculating the average amounts in each applicable year are as follows: (i) for the year ending December 31, 2025, Dan Dearborn, (ii) for the years ending December 31, |
| 2024 and 2023, Dan Dearborn and Dennis Yamashita, and (iii) for the year ending June 30, 2023, Dennis Brown (TuHURA’s former Chief Scientific Officer), and Scott Praill (TuHURA’s former Chief Financial Officer). |
| (4) | Cumulative TSR is calculated by dividing the sum of the cumulative amount of dividends for the measurement period, assuming dividend reinvestment, and the difference between TuHURA’s share price at the end and the beginning of the measurement period by TuHURA’s share price at the beginning of the measurement period. The beginning of the measurement period for each year in the table is December 31, 2022. No dividends were paid on stock or option awards in 2023, 2024 or 2025. |
| (5) | The dollar amounts reported represent the amount of net income (loss) reflected in TuHURA’s audited financial statements for (a) the years ending December 31, 2025, 2024 and 2023 and (b) the year ending June 30, 2023. |
| (2) | The dollar amounts reported in these columns represent the amount of “compensation actually paid” to TuHURA’s PEOs and the average “compensation actually paid” to TuHURA’s non-PEO NEOs, as computed in accordance with Item 402(v) of Regulation S-K, for each covered fiscal year. In accordance with these rules, these amounts reflect total compensation as set forth in the SCT for each year, adjusted as shown below. Equity values are calculated in accordance with FASB ASC Topic 718, and the valuation assumptions used to calculate fair values did not materially differ from those disclosed at the time of grant. The dollar amounts do not reflect the actual amount of compensation earned or received by or paid to the PEOs or non-PEO NEOs during the applicable fiscal year. |
Dr. Bianco 2025 ($) |
Mr. Hoffman 2025 ($) |
Average Other NEOs ($) |
||||||||||
Deduction for amounts reported under the option awards column in the summary compensation table |
(2,872,000 | ) | — | (1,288,000 | ) | |||||||
ASC 718 Fair Value of Awards Granted during Applicable FY that Remain Unvested as of Applicable FY End, determined as of Applicable FY End |
2,064,000 | — | 926,000 | |||||||||
ASC 718 Fair Value of Awards Granted during Applicable FY that Vested during Applicable FY, determined as of Vesting Date |
— | — | — | |||||||||
Increase/deduction for Awards Granted during Prior FY that were Outstanding and Unvested as of Applicable FY End, determined based on change in ASC 718 Fair Value from Prior FY End to Applicable FY End |
(1,172,000 | ) | — | (710,000 | ) | |||||||
Increase/deduction for Awards Granted during Prior FY that Vested During Applicable FY, determined based on change in ASC 718 Fair Value from Prior FY End to Vesting Date |
(232,000 | ) | — | (69,000 | ) | |||||||
Deduction of ASC 718 Fair Value of Awards Granted during Prior FY that were Forfeited during Applicable FY, determined as of Prior FY End |
— | — | — | |||||||||
TOTAL ADJUSTMENTS |
(2,212,000 | ) | — | (1,141,000 | ) | |||||||