Performance Management
Feb. 28, 2026
The
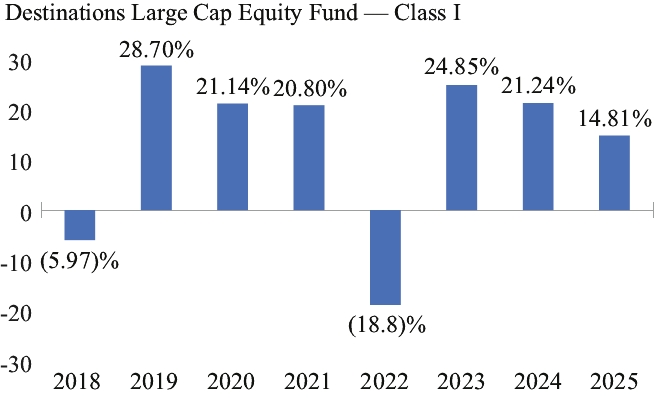
bar chart and the performance table below provide some indication of the risks of investing in the Fund by showing changes in the Fund’s
Class I shares’ performance from year to year for the past eight calendar years and by showing how the Fund’s average
annual returns for 1 year, 5 years, and since the Fund’s inception compare with those of a broad measure of market performance.
The bar chart shows only the performance of the Fund’s Class I shares. Returns for Class Z shares would have been substantially
similar to those of Class I shares and would have differed only to the extent that Class I shares have higher total annual fund
operating expenses than Class Z shares. The Fund’s
past performance, before and after taxes, does not necessarily indicate how the Fund will perform in the future. Current
performance information is available at www.destinationsfunds.com
or by calling 1-877-771-7979.
The
Fund’s best and worst calendar quarters
Best
Quarter: 22.97%
(June 30, 2020)
Worst
Quarter: (21.43)%
(March 31, 2020)
The
Fund’s Class I total return (pre-tax) from January 1, 2026 to March 31,
2026 was (5.50)%.
|
|
|
|
|
|
|
|
|
|
|
|
|
|
|
1
Year |
|
|
5
Years |
|
|
Since
Inception
(03/20/2017)
|
|
Return
Before Taxes |
|
|
|
|
|
|
|||
|
Class I
|
|
|
14.81%
|
|
|
11.26%
|
|
|
12.70%
|
|
Class Z*
|
|
|
15.01%
|
|
|
11.43%
|
|
|
12.21%
|
|
Return
After Taxes on Distributions |
|
|
|
|
|
|
|||
|
Class I
|
|
|
12.93%
|
|
|
8.61%
|
|
|
10.91%
|
|
Return
After Taxes on Distributions and Sale of Fund Shares |
|
|
|
|
|
|
|||
|
Class I
|
|
|
10.07%
|
|
|
8.29%
|
|
|
10.01%
|
|
Russell
1000 Index (reflects
no deduction for fees, expenses, or taxes) |
|
|
17.37%
|
|
|
13.59%
|
|
|
14.36% |
|
|
|
|
|
|
|
|
|
|
|
|
* |
The Fund’s Class Z shares commenced operations on July 16,
2018. |
The
after-tax returns are calculated using the highest historical individual federal marginal income tax rates and do not reflect the impact
of state and local taxes. Actual after-tax
returns depend on an individual investor’s tax situation and may differ from those shown, and after-tax returns shown are not relevant
to investors who hold their Fund shares through tax-deferred arrangements, such as 401(k) plans or individual retirement accounts.
After-tax returns are shown only for Class I and
will vary for Class Z.
The
bar chart and the performance table below provide some indication of the risks of investing in the Fund by showing changes in the Fund’s
Class I shares’ performance from year to year for the past eight calendar years and by showing how the Fund’s average
annual returns for 1 year, 5 years, and since the Fund’s inception compare with those of a broad measure of market performance.
The bar chart shows only the performance of the Fund’s Class I shares. Returns for Class Z shares would have been substantially
similar to those of Class I shares and would have differed only to the extent that Class I shares have higher total annual fund
operating expenses than Class Z shares. The Fund’s
past performance, before and after taxes, does not necessarily indicate how the Fund will perform in the future. Current
performance information is available at www.destinationsfunds.com
or by calling 1-877-771-7979.
The
Fund’s best and worst calendar quarters
Best
Quarter: 29.81%
(June 30, 2020)
Worst
Quarter: (31.04)%
(March 31, 2020)
The
Fund’s Class I total return (pre-tax) from January 1, 2026 to March 31,
2026 was 3.77%.
|
|
|
|
|
|
|
|
|
|
|
|
|
|
|
1 Year
|
|
|
5 Years
|
|
|
Since
Inception
(03/20/2017)
|
|
Return
Before Taxes |
|
|
|
|
|
|
|||
|
Class I
|
|
|
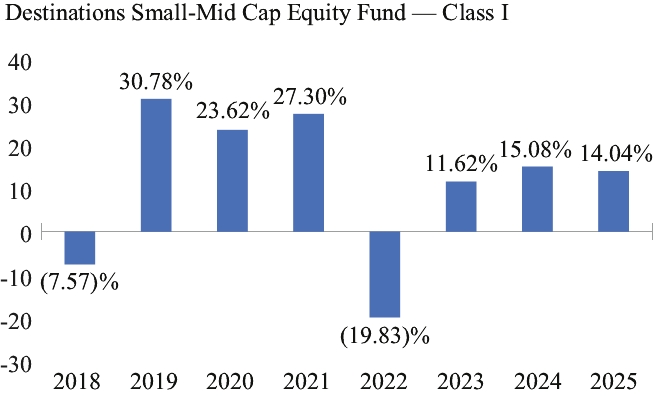
14.04%
|
|
|
8.38%
|
|
|
11.04%
|
|
Class Z*
|
|
|
14.22%
|
|
|
8.53%
|
|
|
10.26%
|
|
Return
After Taxes on Distributions |
|
|
|
|
|
|
|||
|
Class I
|
|
|
11.80%
|
|
|
5.76%
|
|
|
9.05%
|
|
Return
After Taxes on Distributions and Sale of Fund Shares |
|
|
|
|
|
|
|||
|
Class I
|
|
|
9.18%
|
|
|
5.82%
|
|
|
8.36%
|
|
Russell
2500 Index (reflects
no deduction for fees, expenses, or taxes) |
|
|
11.91%
|
|
|
7.26%
|
|
|
9.39% |
|
|
|
|
|
|
|
|
|
|
|
|
* |
The Fund’s Class Z shares commenced operations on July 16,
2018. |
The
after-tax returns are calculated using the highest historical individual federal marginal income tax rates and do not reflect the impact
of state and local taxes. Actual after-tax
returns depend on an individual investor’s tax situation and may differ from those shown, and after-tax returns shown are not relevant
to investors who hold their Fund shares through tax-deferred arrangements, such as 401(k) plans or individual retirement accounts.
After tax returns are shown only for Class I and
will vary for Class Z.
The
bar chart and the performance table below provide some indication of the risks of investing in the Fund by showing changes in the Fund’s
Class I shares’ performance from year to year for the past eight calendar years and by showing how the Fund’s average
annual returns for 1 year, 5 years, and since the Fund’s inception compare with those of a broad measure of market performance.
The bar chart shows only the performance of the Fund’s Class I shares. Returns for Class Z shares would have been substantially
similar to those of Class I shares and would have differed only to the extent that Class I shares have higher total annual fund
operating expenses than Class Z shares. The Fund’s
past performance, before and after taxes, does not necessarily indicate how the Fund will perform in the future. Current
performance information is available at www.destinationsfunds.com
or by calling 1-877-771-7979.
The
Fund’s best and worst calendar quarters
Best
Quarter: 21.77%
(June 30,
2020)
Worst
Quarter: (19.69)%
(March 31,
2020)
The
Fund’s Class I total return (pre-tax) from January 1, 2026 to March 31,
2026 was 1.62%.
|
|
|
|
|
|
|
|
|
|
|
|
|
|
|
1 Year
|
|
|
5 Years
|
|
|
Since
Inception
(03/20/2017)
|
|
Return
Before Taxes |
|
|
|
|
|
|
|||
|
Class I
|
|
|
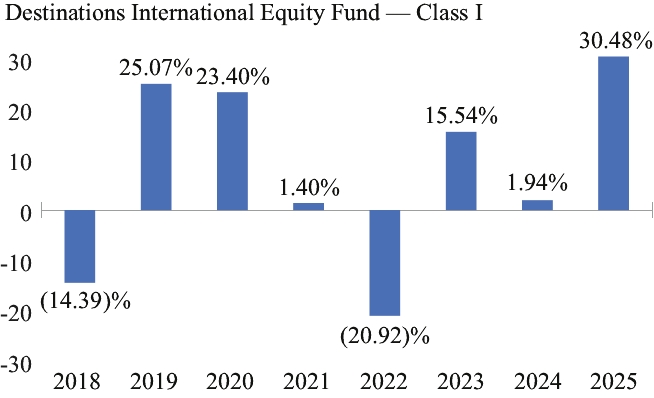
30.48%
|
|
|
4.26%
|
|
|
7.68%
|
|
Class Z*
|
|
|
30.55%
|
|
|
4.42%
|
|
|
7.25%
|
|
Return
After Taxes on Distributions |
|
|
|
|
|
|
|||
|
Class I
|
|
|
24.40%
|
|
|
3.26%
|
|
|
7.01%
|
|
Return
After Taxes on Distributions and Sale of Fund Shares |
|
|
|
|
|
|
|||
|
Class I
|
|
|
19.88%
|
|
|
3.26%
|
|
|
6.15%
|
|
FTSE
All-World ex US Index (reflects
no deduction for fees, expenses, or taxes) |
|
|
31.95%
|
|
|
8.02%
|
|
|
8.16% |
|
|
|
|
|
|
|
|
|
|
|
|
* |
The Fund’s Class Z shares commenced operations on July 16,
2018. |
The
after-tax returns are calculated using the highest historical individual federal marginal income tax rates and do not reflect the impact
of state and local taxes. Actual after-tax
returns depend on an individual investor’s tax situation and may differ from those shown, and after-tax returns shown are not relevant
to investors who hold their Fund shares through tax-deferred arrangements, such as 401(k) plans or individual retirement accounts.
After tax returns are shown only for Class I and
will vary for Class Z.
The
bar chart and the performance table below provide some indication of the risks of investing in the Fund by showing changes in the Fund’s
Class I shares’ performance from year to year for the past eight calendar years and by showing how the Fund’s average
annual returns for 1 year, 5 years, and since the Fund’s inception compare with those of a broad measure of market performance.
The bar chart shows only the performance of the Fund’s Class I shares. Returns for Class Z shares would have been substantially
similar to those of Class I shares and would have differed only to the extent that Class I shares have higher total annual fund
operating expenses than Class Z shares. The Fund’s
past performance, before and after taxes, does not necessarily indicate how the Fund will perform in the future. Current
performance information is available at www.destinationsfunds.com
or by calling 1-877-771-7979.
The
Fund’s best and worst calendar quarters
Best
Quarter: 13.45%
(December 31,
2022)
Worst
Quarter: (24.39)%
(March 31,
2020)
The
Fund’s Class I total return (pre-tax) from January 1, 2026 to March 31,
2026 was 5.06%.
|
|
|
|
|
|
|
|
|
|
|
|
|
|
|
1 Year
|
|
|
5 Years
|
|
|
Since
Inception
(03/20/2017)
|
|
Return
Before Taxes |
|
|
|
|
|
|
|||
|
Class I
|
|
|
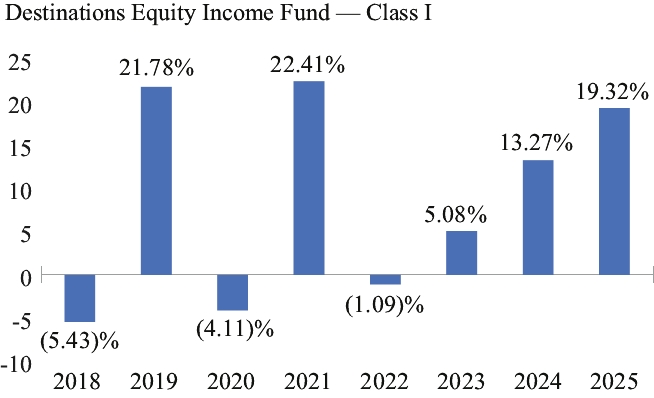
19.32%
|
|
|
11.45%
|
|
|
8.62%
|
|
Class Z*
|
|
|
19.64%
|
|
|
11.64%
|
|
|
9.36%
|
|
Return
After Taxes on Distributions |
|
|
|
|
|
|
|||
|
Class I
|
|
|
16.94%
|
|
|
10.25%
|
|
|
7.30%
|
|
Return
After Taxes on Distributions and Sale of Fund Shares |
|
|
|
|
|
|
|||
|
Class I
|
|
|
13.09%
|
|
|
8.95%
|
|
|
6.57%
|
|
FTSE
All-World Developed Index (reflects
no deduction for fees, expenses,
or
taxes) |
|
|
22.25%
|
|
|
11.97%
|
|
|
12.04%
|
|
FTSE
All-World High Dividend Yield Index (reflects no deduction for fees, expenses, or taxes) |
|
|
26.33%
|
|
|
11.31%
|
|
|
8.50% |
|
|
|
|
|
|
|
|
|
|
|
|
* |
The Fund’s Class Z shares commenced operations on July 16,
2018 |
This
table compares the Fund’s average annual total returns to those of a broad-based securities market index and an additional index
with characteristics relevant to the Fund’s investment strategy.
The
after-tax returns are calculated using the highest historical individual federal marginal income tax rates and do not reflect the impact
of state and local taxes. Actual
after-tax returns depend on an individual investor’s tax situation and may differ from those shown, and after-tax returns shown
are not relevant to investors who hold their Fund shares through tax-deferred arrangements, such as 401(k) plans or individual retirement
accounts. After tax returns are shown
only for Class I and will vary for Class Z.
The
bar chart and the performance table below provide some indication of the risks of investing in the Fund by showing changes in the Fund’s
Class I shares’ performance from year to year for the past eight calendar years and by showing how the Fund’s average
annual returns for 1 year, 5 years, and since the Fund’s inception compare with those of a broad measure of market performance.
The bar chart shows only the performance of the Fund’s Class I shares. Returns for Class Z shares would have been substantially
similar to those of Class I shares and would have differed only to the extent that Class I shares have higher total annual fund
operating expenses than Class Z shares. The Fund’s
past performance, before and after taxes, does not necessarily indicate how the Fund will perform in the future. Current
performance information is available at www.destinationsfunds.com
or by calling 1-877-771-7979.
The
Fund’s best and worst calendar quarters
Best
Quarter: 6.73%
(December 31,
2023)
Worst
Quarter: (5.65)% in
(March 31,
2022)
The
Fund’s Class I total return (pre-tax) from January 1, 2026 to March 31,
2026 was (0.01)%.
|
|
|
|
|
|
|
|
|
|
|
|
|
|
|
1 Year
|
|
|
5 Years
|
|
|
Since
Inception
(03/20/2017)
|
|
Return
Before Taxes |
|
|
|
|
|
|
|||
|
Class I
|
|
|
6.55%
|
|
|
(0.42)%
|
|
|
1.29%
|
|
Class Z*
|
|
|
6.75%
|
|
|
(0.28)%
|
|
|
1.54%
|
|
Return
After Taxes on Distributions |
|
|
|
|
|
|
|||
|
Class I
|
|
|
4.90%
|
|
|
(1.75)%
|
|
|
0.06%
|
|
Return
After Taxes on Distributions and Sale of Fund Shares |
|
|
|
|
|
|
|||
|
Class I
|
|
|
3.86%
|
|
|
(0.84)%
|
|
|
0.49%
|
|
ICE
BofA US Broad Market Index (reflects
no deduction for fees, expenses, or
taxes) |
|
|
7.15%
|
|
|
(0.42)%
|
|
|
1.94% |
|
|
|
|
|
|
|
|
|
|
|
|
* |
The Fund’s Class Z shares commenced operations on July 16,
2018. |
The
after-tax returns are calculated using the highest historical individual federal marginal income tax rates and do not reflect the impact
of state and local taxes. Actual
after-tax returns depend on an individual investor’s tax situation and may differ from those shown, and after-tax returns shown
are not relevant to investors who hold their Fund shares through tax-deferred arrangements, such as 401(k) plans or individual retirement
accounts. After tax returns are shown
only for Class I and will vary for Class Z.
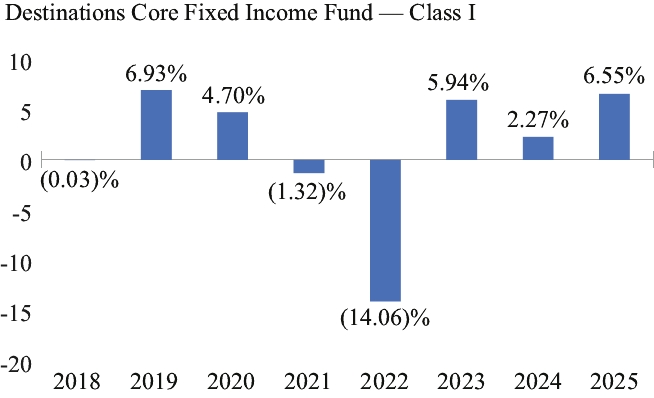
The
bar chart and the performance table below provide some indication of the risks of investing in the Fund by showing changes in the Fund’s
Class I shares’ performance from year to year for the past eight calendar years and by showing how the Fund’s average
annual returns for 1 year, 5 years, and since the Fund’s inception compare with those of a broad measure of market performance.
The bar chart shows only the performance of the Fund’s Class I shares. Returns for Class Z shares would have been substantially
similar to those of Class I shares and would have differed only to the extent that Class I shares have higher total annual fund
operating expenses than Class Z shares. The Fund’s
past performance, before and after taxes, does not necessarily indicate how the Fund will perform in the future. Current
performance information is available at www.destinationsfunds.com
or by calling 1-877-771-7979.
The
Fund’s best and worst calendar quarters
Best
Quarter: 3.92%
(June 30,
2020)
Worst
Quarter: (5.63)%
(March 31,
2020)
The
Fund’s Class I total return (pre-tax) from January 1, 2026 to March 31,
2026 was 1.35%.
|
|
|
|
|
|
|
|
|
|
|
|
|
|
|
1 Year
|
|
|
5 Years
|
|
|
Since
Inception
(03/20/2017)
|
|
Return
Before Taxes |
|
|
|
|
|
|
|||
|
Class I
|
|
|
5.77%
|
|
|
4.80%
|
|
|
3.66%
|
|
Class Z*
|
|
|
5.96%
|
|
|
4.98%
|
|
|
4.14%
|
|
Return
After Taxes on Distributions |
|
|
|
|
|
|
|||
|
Class I
|
|
|
3.20%
|
|
|
2.53%
|
|
|
1.76%
|
|
Return
After Taxes on Distributions and Sale of Fund Shares |
|
|
|
|
|
|
|||
|
Class I
|
|
|
3.39%
|
|
|
2.68%
|
|
|
1.96%
|
|
ICE
BofA US Broad Market Index (reflects
no deduction for fees, expenses, or
taxes) |
|
|
7.15%
|
|
|
(0.42)%
|
|
|
1.94%
|
|
ICE
BofA US Corporate & Government 1-3 Year Index (reflects no deduction for fees, expenses, or
taxes) |
|
|
5.31%
|
|
|
1.97%
|
|
|
2.21% |
|
|
|
|
|
|
|
|
|
|
|
|
* |
The Fund’s Class Z shares commenced operations on July 16,
2018. |
This
table compares the Fund’s average annual total returns to those of a broad-based securities market index and an additional index
with characteristics relevant to the Fund’s investment strategy.
The
after-tax returns are calculated using the highest historical individual federal marginal income tax rates and do not reflect the impact
of state and local taxes. Actual
after-tax returns depend on an individual investor’s tax situation and may differ from those shown, and after-tax returns shown
are not relevant to investors who hold their Fund shares through tax-deferred arrangements, such as 401(k) plans or individual retirement
accounts. After tax returns are shown
only for Class I and will vary for Class Z.
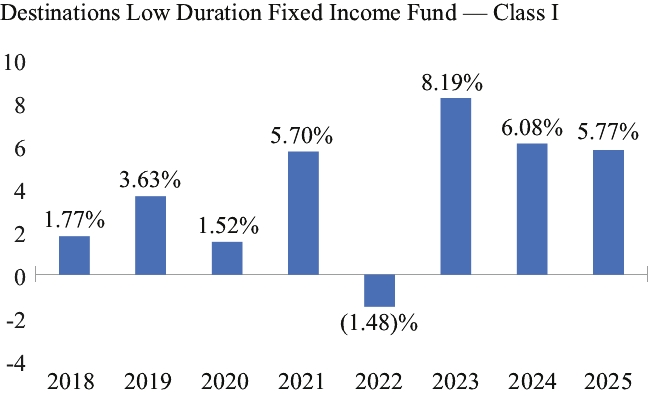
The
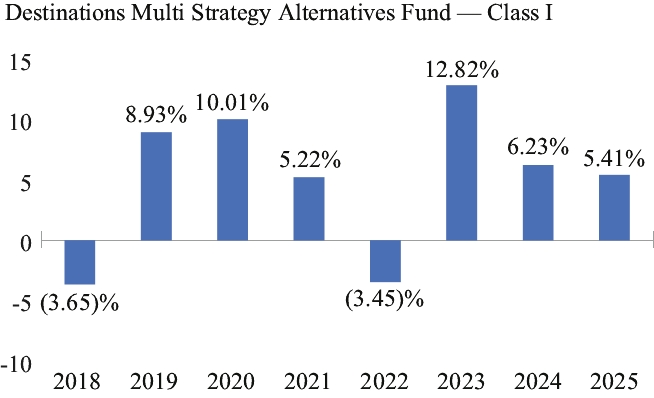
bar chart and the performance table below provide some indication of the risks of investing in the Fund by showing changes in the Fund’s
Class I shares’ performance from year to year for the past eight calendar years and by showing how the Fund’s average
annual returns for 1 year, 5 years, and since the Fund’s inception compare with those of a broad measure of market performance.
The bar chart shows only the performance of the Fund’s Class I shares. Returns for Class Z shares would have been substantially
similar to those of Class I shares and would have differed only to the extent that Class I shares have higher total annual fund
operating expenses than Class Z shares. The Fund’s
past performance, before and after taxes, does not necessarily indicate how the Fund will perform in the future. Current
performance information is available at www.destinationsfunds.com
or by calling 1-877-771-7979.
The
Fund’s best and worst calendar quarters
Best
Quarter: 7.62%
(June 30,
2020)
Worst
Quarter: (9.19)%
(March 31,
2020)
The
Fund’s Class I total return (pre-tax) from January 1, 2026 to March 31,
2026 was 0.68%.
|
|
|
|
|
|
|
|
|
|
|
|
|
|
|
1 Year
|
|
|
5 Years
|
|
|
Since
Inception
(03/20/2017)
|
|
Return
Before Taxes |
|
|
|
|
|
|
|||
|
Class I
|
|
|
7.22%
|
|
|
4.77%
|
|
|
4.23%
|
|
Class Z*
|
|
|
7.42%
|
|
|
4.94%
|
|
|
4.62%
|
|
Return
After Taxes on Distributions |
|
|
|
|
|
|
|||
|
Class I
|
|
|
4.31%
|
|
|
2.37%
|
|
|
2.14%
|
|
Return
After Taxes on Distributions and Sale of Fund Shares |
|
|
|
|
|
|
|||
|
Class I
|
|
|
4.24%
|
|
|
2.59%
|
|
|
2.31%
|
|
ICE
BofA Global Broad Market Index (USD Hedged) (reflects
no deduction for fees, expenses, or taxes) |
|
|
5.07%
|
|
|
(0.24)%
|
|
|
1.97%
|
|
* |
The Fund’s Class Z shares commenced operations on July 16,
2018. |
The
after-tax returns are calculated using the highest historical individual federal marginal income tax rates and do not reflect the impact
of state and local taxes. Actual
after-tax returns depend on an individual investor’s tax situation and may differ from those shown, and after-tax returns shown
are not relevant to investors who hold their Fund shares through tax-deferred arrangements, such as 401(k) plans or individual retirement
accounts. After tax returns are shown
only for Class I and will vary for Class Z.
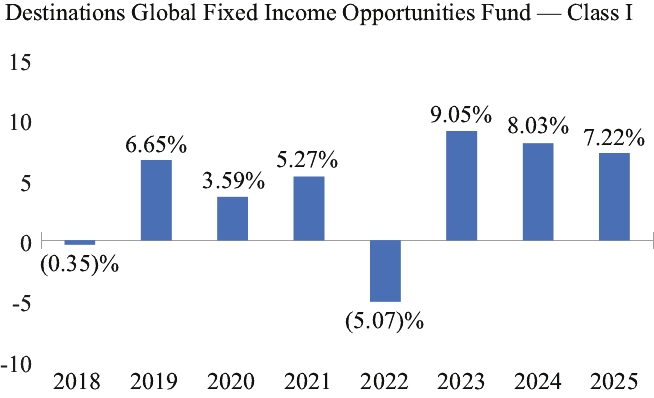
The
bar chart and the performance table below provide some indication of the risks of investing in the Fund by showing changes in the Fund’s
Class I shares’ performance from year to year for the past eight calendar years and by showing how the Fund’s average
annual returns for 1 year, 5 years, and since the Fund’s inception compare with those of a broad measure of market performance.
The bar chart shows only the performance of the Fund’s Class I shares. Returns for Class Z shares would have been substantially
similar to those of Class I shares and would have differed only to the extent that Class I shares have higher total annual fund
operating expenses than Class Z shares. The Fund’s
past performance, before and after taxes, does not necessarily indicate how the Fund will perform in the future. Current
performance information is available at www.destinationsfunds.com
or by calling 1-877-771-7979.
The
Fund’s best and worst calendar quarters
Best
Quarter: 5.43%
(December 31, 2023)
Worst
Quarter: (4.99)% (March 31,
2022)
The
Fund’s Class I total return (pre-tax) from January 1, 2026 to March 31,
2026 was (0.09)%.
|
|
|
|
|
|
|
|
|
|
|
|
|
|
|
1 Year
|
|
|
5 Years
|
|
|
Since
Inception
(03/20/2017)
|
|
Return
Before Taxes |
|
|
|
|
|
|
|||
|
Class I
|
|
|
3.58%
|
|
|
0.70%
|
|
|
1.72%
|
|
Class Z*
|
|
|
3.81%
|
|
|
0.86%
|
|
|
2.06%
|
|
Return
After Taxes on Distributions |
|
|
|
|
|
|
|||
|
Class I
|
|
|
3.58%
|
|
|
0.69%
|
|
|
1.66%
|
|
Return
After Taxes on Distributions and Sale of Fund Shares |
|
|
|
|
|
|
|||
|
Class I
|
|
|
3.27%
|
|
|
1.07%
|
|
|
1.75%
|
|
ICE
BofA US Municipal Securities 2-12 Year Index (reflects
no deduction for fees, expenses, or taxes) |
|
|
5.22%
|
|
|
1.16%
|
|
|
2.32% |
|
|
|
|
|
|
|
|
|
|
|
|
* |
The Fund’s Class Z shares commenced operations on July 16,
2018. |
The
after-tax returns are calculated using the highest historical individual federal marginal income tax rates and do not reflect the impact
of state and local taxes. Actual
after-tax returns depend on an individual investor’s tax situation and may differ from those shown, and after-tax returns shown
are not relevant to investors who hold their Fund shares through tax-deferred arrangements, such as 401(k) plans or individual retirement
accounts. After tax returns are shown
only for Class I and will vary for Class Z.
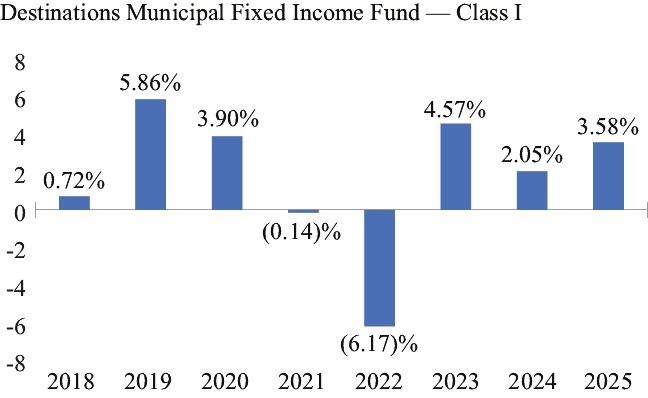
The
bar chart and the performance table below provide some indication of the risks of investing in the Fund by showing changes in the Fund’s
Class I shares’ performance from year to year for the past eight calendar years and by showing how the Fund’s average
annual returns for 1 year, 5 years, and since the Fund’s inception compare with those of a broad measure of market performance.
The bar chart shows only the performance of the Fund’s Class I shares. Returns for Class Z shares would have been substantially
similar to those of Class I shares and would have differed only to the extent that Class I shares have higher total annual fund
operating expenses than Class Z shares. The Fund’s
past performance, before and after taxes, does not necessarily indicate how the Fund will perform in the future. Current
performance information is available at www.destinationsfunds.com
or by calling 1-877-771-7979.
The
Fund’s best and worst calendar quarters
Best
Quarter: 13.31%
(June 30,
2020)
Worst
Quarter: (12.18)%
(March 31,
2020)
The
Fund’s Class I total return (pre-tax) from January 1, 2026 to March 31,
2026 was (1.13)%.
|
|
|
|
|
|
|
|
|
|
|
|
|
|
|
1 Year
|
|
|
5 Years
|
|
|
Since
Inception
(03/20/2017)
|
|
Return
Before Taxes |
|
|
|
|
|
|
|||
|
Class I
|
|
|
5.41%
|
|
|
5.12%
|
|
|
4.92%
|
|
Class Z*
|
|
|
5.61%
|
|
|
5.30%
|
|
|
5.23%
|
|
Return
After Taxes on Distributions |
|
|
|
|
|
|
|||
|
Class I
|
|
|
3.39%
|
|
|
3.12%
|
|
|
3.20%
|
|
Return
After Taxes on Distributions and Sale of Fund Shares |
|
|
|
|
|
|
|||
|
Class I
|
|
|
3.31%
|
|
|
3.13%
|
|
|
3.12%
|
|
ICE
BofA US Broad Market Index (reflects
no deduction for fees, expenses, or
taxes) |
|
|
7.15%
|
|
|
(0.42)%
|
|
|
1.94% |
|
|
|
|
|
|
|
|
|
|
|
|
* |
The Fund’s Class Z shares commenced operations on July 16,
2018. |
The
after-tax returns are calculated using the highest historical individual federal marginal income tax rates and do not reflect the impact
of state and local taxes. Actual
after-tax returns depend on an individual investor’s tax situation and may differ from those shown, and after-tax returns shown
are not relevant to investors who hold their Fund shares through tax-deferred arrangements, such as 401(k) plans or individual retirement
accounts. After tax returns are shown
only for Class I and will vary for Class Z.
The
bar chart and the performance table below provide some indication of the risks of investing in the Fund by showing changes in the Fund’s
Class I shares’ performance from year to year for the past four calendar years
and by showing how the Fund’s average annual returns for 1 year and since the Fund’s inception compare with those
of a broad measure of market performance. The bar chart shows only the performance of the Fund’s Class I
shares. Returns for Class Z shares would have been substantially similar to those of Class I shares and would have differed
only to the extent that Class I shares have higher total annual fund operating expenses than Class Z shares. The
Fund’s past performance, before and after taxes, does not necessarily indicate how the Fund will perform in the future.
Current performance information is available at www.destinationsfunds.com
or by calling 1-877-771-7979.
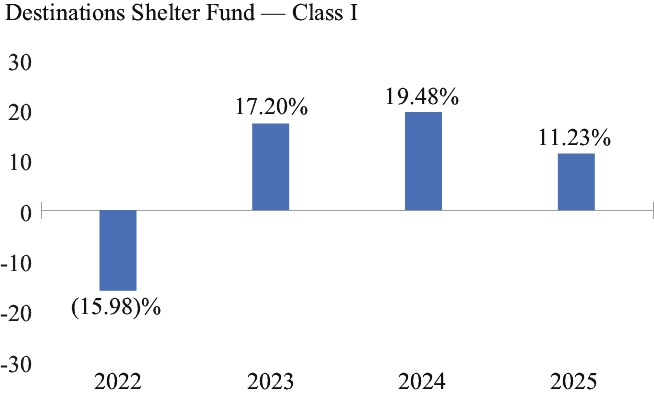
The
Fund’s best and worst calendar quarters
Best
Quarter: 7.56%
(March 31,
2024)
Worst
Quarter: (9.45)%
(June 30, 2022)
The
Fund’s Class I total return (pre-tax) from January 1, 2026 to March 31,
2026 was (4.47)%.
|
|
|
|
|
|
|
|
|
|
|
|
1 Year
|
|
|
Since
Inception
(10/26/2021)
|
|
Return
Before Taxes |
|
|
|
|
||
|
Class I
|
|
|
11.23%
|
|
|
7.17%
|
|
Class Z*
|
|
|
11.43%
|
|
|
7.04%
|
|
Return
After Taxes on Distributions |
|
|
|
|
||
|
Class I
|
|
|
11.21%
|
|
|
7.09%
|
|
Return
After Taxes on Distributions and Sale of Fund Shares |
|
|
|
|
||
|
Class I
|
|
|
6.66%
|
|
|
5.59%
|
|
Russell
1000 Index (reflects
no deduction for fees, expenses, or taxes) |
|
|
17.37%
|
|
|
10.90% |
|
|
|
|
|
|
|
|
|
* |
The Fund’s Class Z shares commenced operations on November 3,
2021. |
The
after-tax returns are calculated using the highest historical individual federal marginal income tax rates and do not reflect the impact
of state and local taxes. Actual
after-tax returns depend on an individual investor’s tax situation and may differ from those shown, and after-tax returns shown
are not relevant to investors who hold their Fund shares through tax-deferred arrangements, such as 401(k) plans or individual retirement
accounts. After tax returns are shown
only for Class I and will vary for Class Z.
From
February 1, 2021 through November 13, 2024, the Fund was not an active component in the advisory models that are implemented
through the Destinations Funds. During that time, the Fund had de minimis assets that consisted entirely of cash and the Adviser was the
sole beneficial owner of the Fund’s shares.
The
bar chart and the performance table below provide some indication of the risks of investing in the Fund by showing changes in the Fund’s
Class I shares’ performance from year to year for the past eight calendar years and by showing how the Fund’s average
annual returns for 1 year, 5 years, and since the Fund’s inception compare with those of a broad measure of market performance.
The bar chart shows only the performance of the Fund’s Class I shares. Returns for Class Z shares would have been substantially
similar to those of Class I shares and would have differed only to the extent that Class I shares have higher total annual fund
operating expenses than Class Z shares. The Fund’s
past performance, before and after taxes, does not necessarily indicate how the Fund will perform in the future. Current
performance information is available at www.destinationsfunds.com
or by calling 1-877-771-7979.
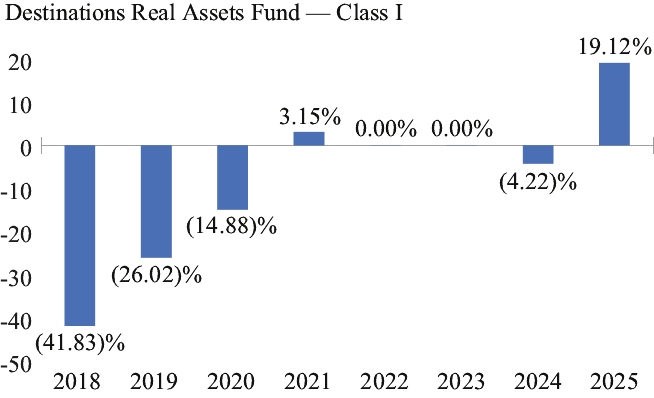
|
* |
As described above, from
February 1, 2021 through November 13, 2024, the Fund’s portfolio consisted entirely of cash. |
The
Fund’s best and worst calendar quarters
Best
Quarter: 20.39%
(June 30,
2020)
Worst
Quarter: (38.69)%
(March 31,
2020)
The
Fund’s Class I total return (pre-tax) from January 1, 2026 to March 31,
2026 was 10.16%.
|
* |
From February 1, 2021
through November 13, 2024, the Fund’s portfolio consisted entirely of cash. |
|
|
|
|
|
|
|
|
|
|
|
|
|
|
|
1 Year
|
|
|
5 Years
|
|
|
Since
Inception
(03/20/2017)
|
|
Return
Before Taxes |
|
|
|
|
|
|
|||
|
Class I
|
|
|
19.12%
|
|
|
3.32%
|
|
|
(8.86)%
|
|
Class Z*
|
|
|
19.61%
|
|
|
3.40%
|
|
|
(9.93)%
|
|
Return
After Taxes on Distributions |
|
|
|
|
|
|
|||
|
Class I
|
|
|
17.88%
|
|
|
0.98%
|
|
|
(10.71)%
|
|
Return
After Taxes on Distributions and Sale of Fund Shares |
|
|
|
|
|
|
|||
|
Class I
|
|
|
11.77%
|
|
|
1.54%
|
|
|
(6.49)%
|
|
FTSE
All World Developed Index (reflects
no deduction for fees, expenses, or taxes) |
|
|
22.25%
|
|
|
11.97%
|
|
|
12.04% |
|
|
|
|
|
|
|
|
|
|
|
|
** |
The Fund’s Class Z
shares commenced operations on July 16,
2018. |
The
after-tax returns are calculated using the highest historical individual federal marginal income tax rates and do not reflect the impact
of state and local taxes. Actual
after-tax returns depend on an individual investor’s tax situation and may differ from those shown, and after-tax returns shown
are not relevant to investors who hold their Fund shares through tax-deferred arrangements, such as 401(k) plans or individual retirement
accounts. After tax returns are shown
only for Class I and will vary for Class Z.