Shareholder Report
Apr. 30, 2026
USD ($)
Holding
| [1] | Annualized |
Shareholder Report |
6 Months Ended | |||
|---|---|---|---|---|
|
Apr. 30, 2026
USD ($)
Holding
| ||||
| Shareholder Report [Line Items] | ||||
| Document Type | N-CSRS | |||
| Amendment Flag | false | |||
| Registrant Name | SENIOR DEBT PORTFOLIO | |||
| Entity Central Index Key | 0000933188 | |||
| Entity Investment Company Type | N-1A | |||
| Document Period End Date | Apr. 30, 2026 | |||
| Shareholder Report Annual or Semi-Annual | Semi-Annual Shareholder Report | |||
| C000064522 | ||||
| Shareholder Report [Line Items] | ||||
| Fund Name | Senior Debt Portfolio | |||
| No Trading Symbol [Flag] | true | |||
| Annual or Semi-Annual Statement [Text Block] | This semi-annual shareholder report contains important information about the Senior Debt Portfolio (the "Fund") for the period of November 1, 2025 to April 30, 2026. | |||
| Additional Information [Text Block] | You can find additional information about the Fund at www.eatonvance.com/open-end-mutual-fund-documents.php and selecting Eaton Vance Floating-Rate Advantage Fund. You can also request this information by contacting us at 1-800-262-1122. | |||
| Additional Information Phone Number | 1-800-262-1122 | |||
| Additional Information Website | <span style="box-sizing: border-box; color: rgb(0, 0, 0); display: inline; flex-wrap: nowrap; font-size: 10.6667px; font-weight: 400; grid-area: auto; line-height: 16px; margin: 0px; overflow: visible; text-align: left; text-align-last: auto; white-space-collapse: preserve-breaks;">www.eatonvance.com/open-end-mutual-fund-documents.php</span> | |||
| Expenses [Text Block] | ||||
| Expenses Paid, Amount | $ 107 | |||
| Expense Ratio, Percent | 2.16% | [1] | ||
| AssetsNet | $ 4,647,450,717 | |||
| Holdings Count | Holding | 618 | |||
| InvestmentCompanyPortfolioTurnover | 15.00% | |||
| Additional Fund Statistics [Text Block] | ||||
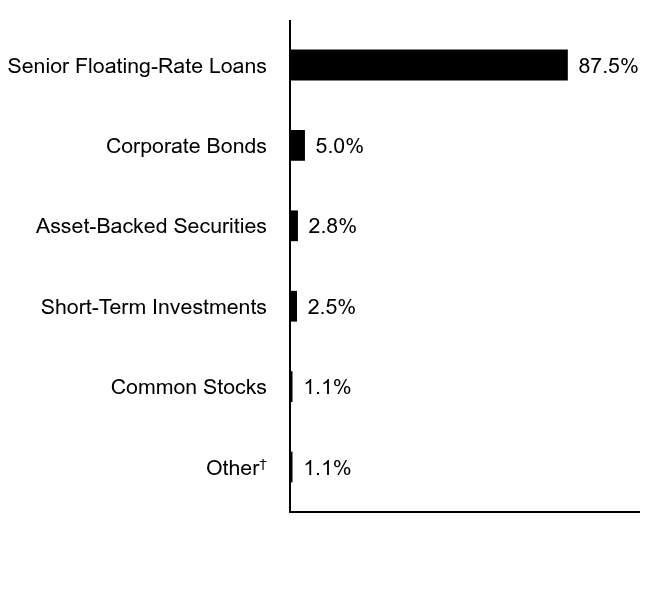
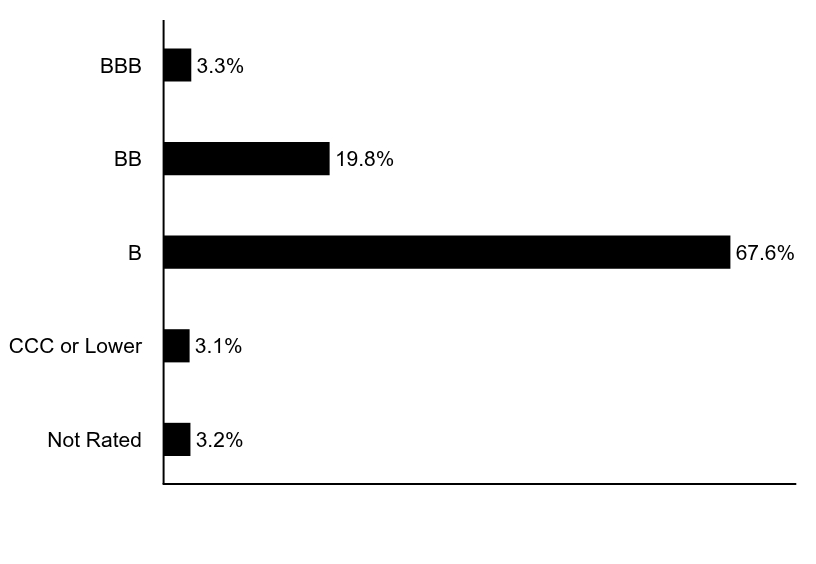
| Holdings [Text Block] | ||||
| Material Fund Change [Text Block] | ||||
| Updated Prospectus Phone Number | 1-800-262-1122 | |||
| ||||