As required by Item 402(v) of Regulation S-K, we are providing the following information about the relationship between the compensation of our named executive officers (“NEOs”) and certain measures of the Company’s financial performance. Further information about our pay-for-performance philosophy and how we align executive compensation with our performance is provided under “Executive Compensation – Compensation Discussion and Analysis.”
Our Compensation Committee did not consider the information in this “Pay Versus Performance” section in making its pay decisions for any of the fiscal years shown below. Pursuant to SEC rules, the information in this “Pay Versus Performance” section shall not be deemed to be incorporated by reference into any filing made by the Company with the SEC under the Securities Act of 1933, as amended (the “Securities Act”), or the Exchange Act, unless expressly incorporated by specific reference into such filing.
Pay Versus Performance Table
The table below reflects compensation of our principal executive officer (“PEO”), who is our Chief Executive Officer, and the average compensation of our non-PEO NEOs, during fiscal years 2026, 2025 and 2024, both as reported in the “Total” column set forth in the “Summary Compensation Table” (the “SCT”) under “Executive Compensation – Summary Compensation Tables – Summary Compensation Table,” and with certain adjustments to reflect the “Compensation Actually Paid”, as defined under SEC rules. In addition, the table below provides the Company’s cumulative total shareholder return (“TSR”) and net income.
|
Fiscal Year |
Summary Compensation Table Total for PEO(1)(3) ($) |
Compensation Actually Paid to PEO(1)(5)(6) ($) |
Average Summary Compensation Table Total for Non-PEO NEOs(2)(4) ($) |
Average Compensation Actually Paid to Non-PEO NEOs(2)(5)(7) ($) |
Value of Initial Fixed $100 Investment Based on Total Shareholder Return(8) ($) |
Net Income ($ Thousands) |
||||||||||||||||||
|
2026 |
$ | 475,379 | $ | 342,786 | $ | 266,549 | $ | 261,054 | $ | 59.10 | $ | 1,843 | ||||||||||||
|
2025 |
$ | 912,346 | $ | 770,695 | $ | 447,015 | $ | 390,490 | $ | 73.86 | $ | (9,356 | ) | |||||||||||
|
2024 |
$ | 430,820 | $ | 136,438 | $ | 418,436 | $ | 344,831 | $ | 95.07 | $ | 4,591 | ||||||||||||
|
(1) |
During fiscal years 2026, 2025 and 2024, our PEO was Olivia W. Elliott. |
|
(2) |
During fiscal year 2026, our non-PEOs NEOs consisted of Claire K. Spencer (who commenced employment on June 16, 2025), Craig J. Demarest (employed through July 2, 2025) and Donna E. Sheridan (employed through November 30, 2025). During fiscal years 2025 and 2024, our non-PEO NEOs consisted of Mr. Demarest and Ms. Sheridan. |
|
(3) |
Represents the total compensation of our PEO, as reported in the “Total” column of the SCT for the fiscal years presented. |
|
(4) |
Represents the average of the total compensation of each of our non-PEO NEOs, as reported in the “Total” column of the SCT for the fiscal years presented. |
|
(5) |
The amounts shown for Compensation Actually Paid have been calculated in accordance with Item 402(v) of Regulation S‐K and do not reflect compensation actually earned, realized or received by the NEOs. Equity values are calculated in accordance with FASB ASC Topic 718. The valuation assumptions used to calculate fair values did not materially differ from those disclosed at the time of grant. |
|
(6) |
The table below sets forth the adjustments made to the total compensation of our PEO, as reported in the “Total” column of the SCT for the fiscal years presented, to determine the Compensation Actually Paid to our PEO for each fiscal year presented. |
|
Adjustments to Determine Compensation Actually Paid to PEO |
Fiscal Year 2026 |
Fiscal Year 2025 |
Fiscal Year 2024 |
|||||||||
|
“Total” column as reported in SCT |
$ | 475,379 | $ | 912,346 | $ | 430,820 | ||||||
|
Deduction for amounts reported under the “Stock Awards” column in the SCT |
$ | - | $ | (477,500 | ) | $ | - | |||||
|
Deduction for amounts reported under the “Option Awards” column in the SCT |
$ | - | $ | - | $ | - | ||||||
|
Increase for fair value of awards granted during the year that remain unvested as of year end |
$ | - | $ | 461,250 | $ | - | ||||||
|
Increase for fair value of awards granted during year that vest during year |
$ | - | $ | - | $ | - | ||||||
|
Increase/deduction for change in fair value from prior year end to current year-end of awards granted prior to year that were outstanding and unvested as of year-end |
$ | (132,593 | ) | $ | (94,401 | ) | $ | (291,000 | ) | |||
|
Increase/deduction for change in fair value from prior year end to vesting date of awards granted prior to year that vested during year |
$ | - | $ | (31,000 | ) | $ | (3,382 | ) | ||||
|
Deduction of fair value of awards granted prior to year that were forfeited during year |
$ | - | $ | - | $ | - | ||||||
|
Increase based upon incremental fair value of awards modified during year |
$ | - | $ | - | $ | - | ||||||
|
Increase based on dividends or other earnings paid during year prior to vesting date of award |
$ | - | $ | - | $ | - | ||||||
|
Compensation Actually Paid to PEO |
$ | 342,786 | $ | 770,695 | $ | 136,438 | ||||||
|
(7) |
The table below sets forth the adjustments made to the average total compensation of our non-PEO NEOs, as reported in the “Total” column of the SCT for the fiscal years presented, to determine the average Compensation Actually Paid to our non-PEO NEOs for each fiscal year presented. |
|
Adjustments to Determine Average Compensation Actually Paid to Non-PEO NEOs |
Fiscal Year 2026 |
Fiscal Year 2025 |
Fiscal Year 2024 |
|||||||||
|
Average “Total” column as reported in SCT |
$ | 266,549 | $ | 447,015 | $ | 418,436 | ||||||
|
Deduction for amounts reported under the “Stock Awards” column in the SCT |
$ | (23,900 | ) | $ | (9,550 | ) | $ | (92,110 | ) | |||
|
Deduction for amounts reported under the “Option Awards” column in the SCT |
$ | - | $ | - | $ | (4,606 | ) | |||||
|
Increase for fair value of awards granted during the year that remain unvested as of year end |
$ | 22,000 | $ | 9,225 | $ | 101,490 | ||||||
|
Increase for fair value of awards granted during year that vest during year |
$ | - | $ | - | $ | - | ||||||
|
Increase/deduction for change in fair value from prior year-end to current year-end of awards granted prior to year that were outstanding and unvested as of year-end |
$ | - | $ | (44,720 | ) | $ | 101,490 | |||||
|
Increase/deduction for change in fair value from prior year-end to vesting date of awards granted prior to year that vested during year |
$ | (3,371 | ) | $ | (11,480 | ) | $ | 3,198 | ) | |||
|
Deduction of fair value of awards granted prior to year that were forfeited during year |
$ | (224 | ) | $ | - | $ | - | |||||
|
Increase based upon incremental fair value of awards modified during year |
$ | - | $ | - | $ | - | ||||||
|
Increase based on dividends or other earnings paid during year prior to vesting date of award |
$ | - | $ | - | $ | - | ||||||
|
Average Compensation Actually Paid to Non-PEO NEOs |
$ | 261,054 | $ | 390,490 | $ | 344,831 | ||||||
|
(8) |
Assumes $100 invested in the Common Stock on April 3, 2023, and reinvestment of all dividends. TSR for fiscal year 2026 is for that year only. TSR for fiscal year 2025 is a two-year return from April 3, 2023 through March 30, 2025. TSR for fiscal year 2024 is a three-year return from April 3, 2023 through March 29, 2026. |
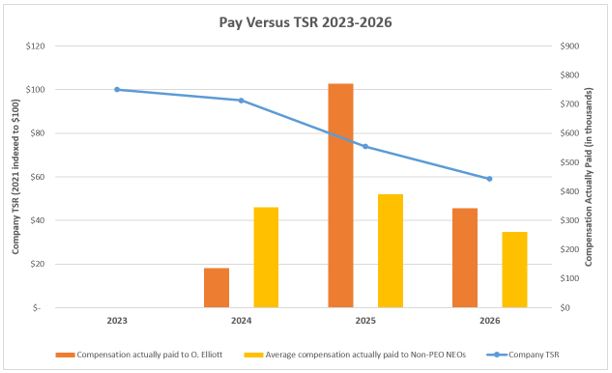
Description of Relationship Between Compensation Actually Paid and Total Shareholder Return
The following chart sets forth the relationship between Compensation Actually Paid to the PEO, the average of Compensation Actually Paid to the Non-PEO NEOs and the Company’s cumulative TSR over the three most recently completed fiscal years.
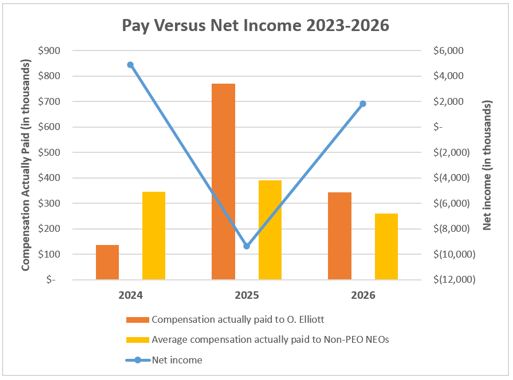
Description of Relationship Between Compensation Actually Paid and Net Income
The following chart sets forth the relationship between Compensation Actually Paid to the PEO, the average of Compensation Actually Paid to the Non-PEO NEOs and the Company’s net income during each of the three most recently completed fiscal years.