Performance Management |
Feb. 28, 2026 |
|||||||||||||||||||||
|---|---|---|---|---|---|---|---|---|---|---|---|---|---|---|---|---|---|---|---|---|---|---|
| 2x Bitcoin ETF | ||||||||||||||||||||||
| Prospectus [Line Items] | ||||||||||||||||||||||
| Bar Chart and Performance Table [Heading] | Performance | |||||||||||||||||||||
| Performance Narrative [Text Block] | The following performance information indicates some of the risks of investing in the Fund. The bar chart shows the Fund’s performance from year to year. The table illustrates how the Fund’s average annual total returns compare with those of a broad-based security market index. Past performance does not necessarily indicate how the Fund will perform in the future. Updated performance information is available at no cost on the Fund’s website at https://www.volatilityshares.com/bitx or by calling the Fund at (866) 261-0273. |
|||||||||||||||||||||
| Performance Past Does Not Indicate Future [Text] | Past performance does not necessarily indicate how the Fund will perform in the future. | |||||||||||||||||||||
| Performance Information Illustrates Variability of Returns [Text] | The following performance information indicates some of the risks of investing in the Fund. The bar chart shows the Fund’s performance from year to year. The table illustrates how the Fund’s average annual total returns compare with those of a broad-based security market inde | |||||||||||||||||||||
| Bar Chart [Heading] | Calendar Year Total Returns as of 12/31 | |||||||||||||||||||||
| Bar Chart [Table] |
|
|||||||||||||||||||||
| Bar Chart Closing [Text Block] | 
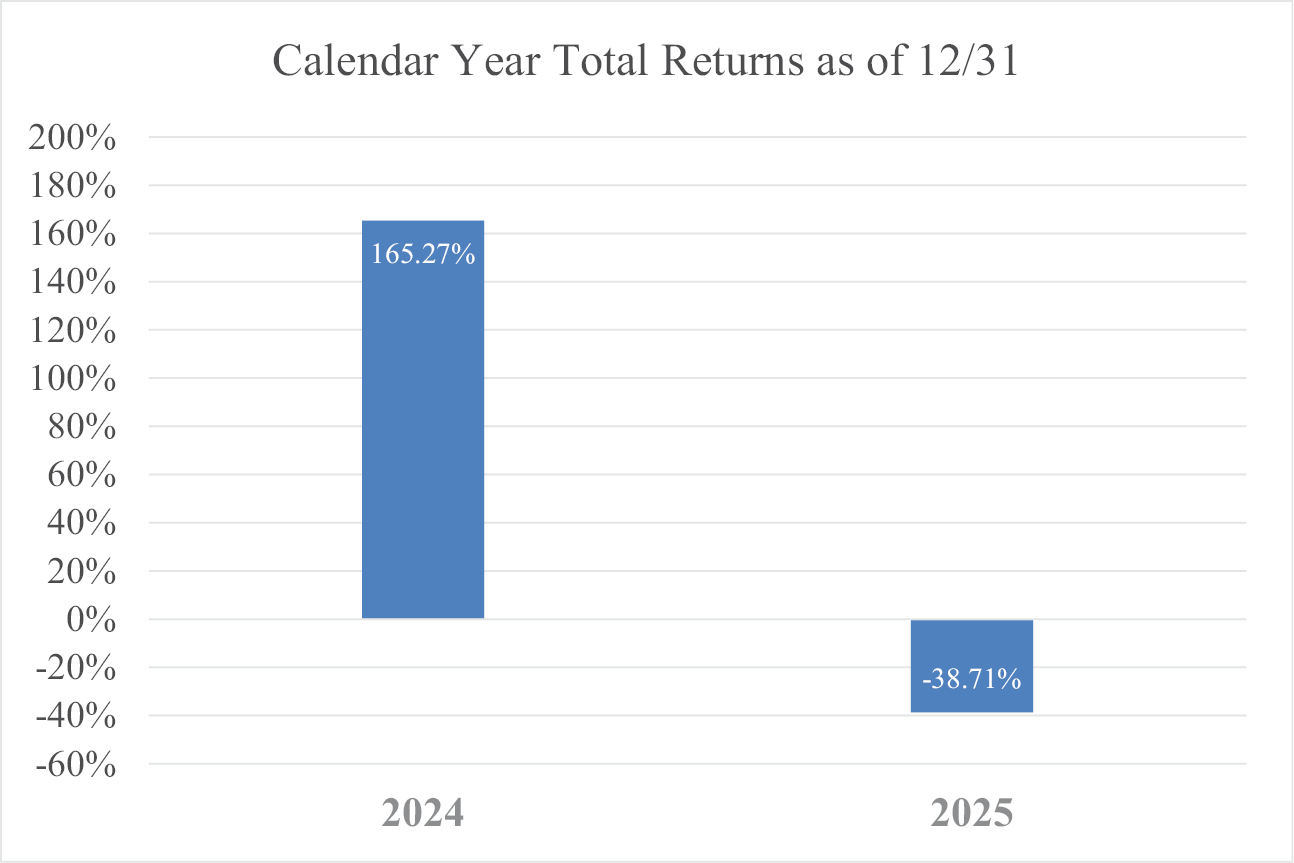
The Fund’s highest quarterly return was 134.83% (quarter-ended March 31, 2024) and the Fund’s lowest quarterly return was (46.61)% (quarter-ended December 31, 2025). The Fund’s year-to-date performance as of the most recent quarter-end (March 31, 2026) was (46.65)%. |
|||||||||||||||||||||
| Year to Date Return, Label [Optional Text] | year-to-date | |||||||||||||||||||||
| Bar Chart, Year to Date Return | (46.65%) | |||||||||||||||||||||
| Bar Chart, Year to Date Return, Date | Mar. 31, 2026 | |||||||||||||||||||||
| Highest Quarterly Return, Label [Optional Text] | highest quarterly return | |||||||||||||||||||||
| Highest Quarterly Return | 134.83% | |||||||||||||||||||||
| Highest Quarterly Return, Date | Mar. 31, 2024 | |||||||||||||||||||||
| Lowest Quarterly Return, Label [Optional Text] | lowest quarterly return | |||||||||||||||||||||
| Lowest Quarterly Return | (46.61%) | |||||||||||||||||||||
| Lowest Quarterly Return, Date | Dec. 31, 2025 | |||||||||||||||||||||
| Performance Table Heading | Average Annual Total Return as of December 31, 2025 | |||||||||||||||||||||
| Performance Table Uses Highest Federal Rate | After-tax returns in the table above are calculated using the historical highest individual U.S. federal marginal income tax rates and do not reflect the impact of state or local taxes. | |||||||||||||||||||||
| Performance Table Not Relevant to Tax Deferred | Actual after-tax returns depend on an investor’s tax situation and may differ from those shown, and after-tax returns shown are not relevant to tax-exempt investors or investors who hold Shares through tax-deferred arrangements, such as 401(k) plans or individual retirement accounts (“IRAs”). | |||||||||||||||||||||
| Performance [Table] |
|
|||||||||||||||||||||
| Index No Deduction for Fees, Expenses, or Taxes [Text] | reflects no deduction for fees, expenses or taxes | |||||||||||||||||||||
| Performance Table Closing [Text Block] | After-tax returns in the table above are calculated using the historical highest individual U.S. federal marginal income tax rates and do not reflect the impact of state or local taxes. Actual after-tax returns depend on an investor’s tax situation and may differ from those shown, and after-tax returns shown are not relevant to tax-exempt investors or investors who hold Shares through tax-deferred arrangements, such as 401(k) plans or individual retirement accounts (“IRAs”). Fund returns after taxes on distributions and sales of Shares are calculated assuming that an investor has sufficient capital gains of the same character from other investments to offset any capital losses from the sales of Shares. As a result, Fund returns after taxes on distributions and sales of Shares may exceed Fund returns before taxes and/or returns after taxes on distributions. |
|||||||||||||||||||||
| Performance Availability Website Address [Text] | https://www.volatilityshares.com/bitx | |||||||||||||||||||||
| Performance Availability Phone [Text] | (866) 261-0273 | |||||||||||||||||||||
| 2x Ether ETF | ||||||||||||||||||||||
| Prospectus [Line Items] | ||||||||||||||||||||||
| Bar Chart and Performance Table [Heading] | Performance | |||||||||||||||||||||
| Performance Narrative [Text Block] | The following performance information indicates some of the risks of investing in the Fund. The bar chart shows the Fund’s performance from year to year. The table illustrates how the Fund’s average annual total returns compare with those of a broad-based security market index. Past performance does not necessarily indicate how the Fund will perform in the future. Updated performance information is available at no cost on the Fund’s website at https://www.volatilityshares.com/ethu or by calling the Fund at (866) 261-0273. |
|||||||||||||||||||||
| Performance Past Does Not Indicate Future [Text] | Past performance does not necessarily indicate how the Fund will perform in the future. | |||||||||||||||||||||
| Performance Information Illustrates Variability of Returns [Text] | The following performance information indicates some of the risks of investing in the Fund. The bar chart shows the Fund’s performance from year to year. The table illustrates how the Fund’s average annual total returns compare with those of a broad-based security market index. | |||||||||||||||||||||
| Bar Chart [Heading] | Calendar Year Total Returns as of 12/31 | |||||||||||||||||||||
| Bar Chart [Table] |
|
|||||||||||||||||||||
| Bar Chart Closing [Text Block] | 
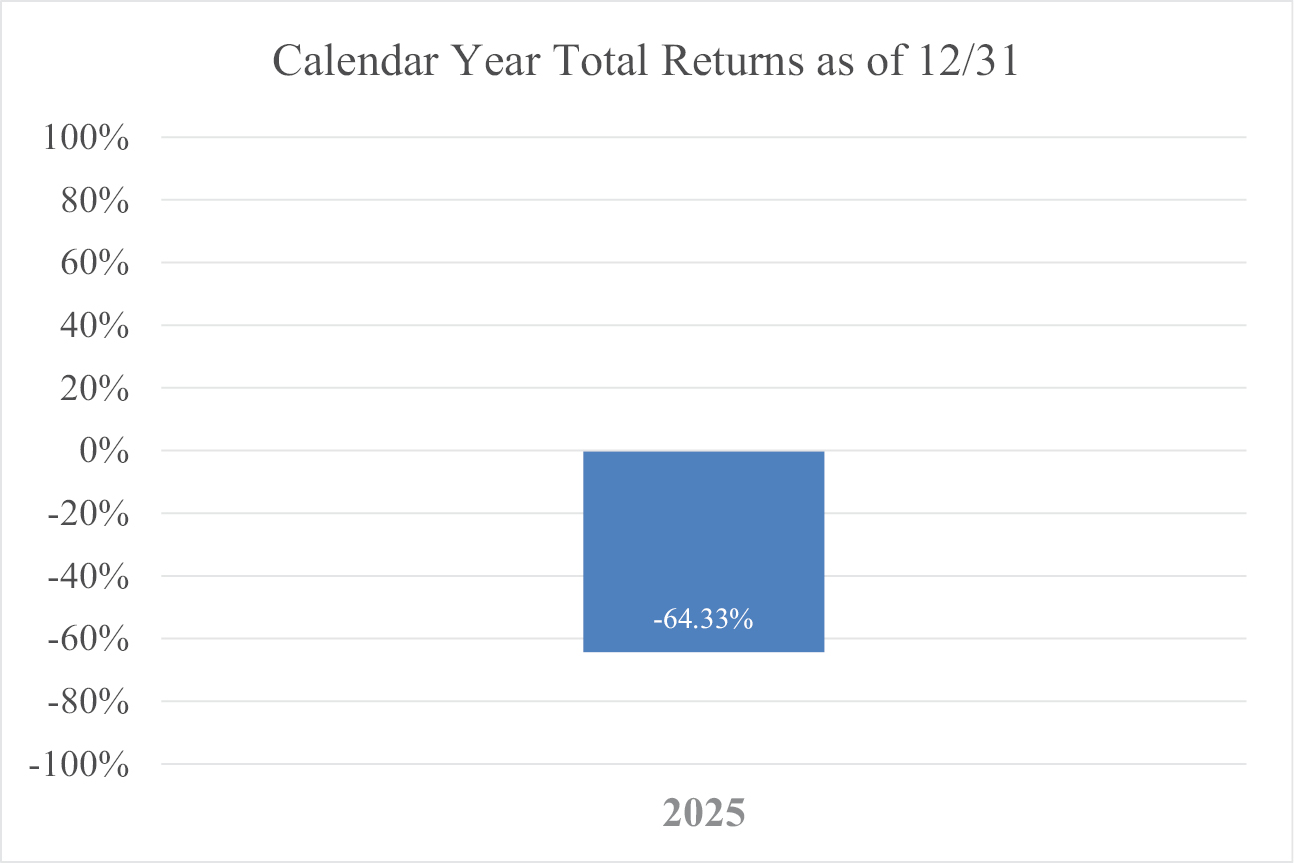
The Fund’s highest quarterly return was 130.01% (quarter-ended September 30, 2025) and the Fund’s lowest quarterly return was (76.38)% (quarter-ended March 31, 2025). The Fund’s year-to-date performance as of the most recent quarter-end (March 31, 2026) was (59.10)%. |
|||||||||||||||||||||
| Year to Date Return, Label [Optional Text] | year-to-date | |||||||||||||||||||||
| Bar Chart, Year to Date Return | (59.10%) | |||||||||||||||||||||
| Bar Chart, Year to Date Return, Date | Mar. 31, 2026 | |||||||||||||||||||||
| Highest Quarterly Return, Label [Optional Text] | highest quarterly return | |||||||||||||||||||||
| Highest Quarterly Return | 130.01% | |||||||||||||||||||||
| Highest Quarterly Return, Date | Sep. 30, 2025 | |||||||||||||||||||||
| Lowest Quarterly Return, Label [Optional Text] | lowest quarterly return | |||||||||||||||||||||
| Lowest Quarterly Return | (76.38%) | |||||||||||||||||||||
| Lowest Quarterly Return, Date | Mar. 31, 2025 | |||||||||||||||||||||
| Performance Table Heading | Average Annual Total Return as of December 31, 2025 | |||||||||||||||||||||
| Performance Table Uses Highest Federal Rate | After-tax returns in the table above are calculated using the historical highest individual U.S. federal marginal income tax rates and do not reflect the impact of state or local taxes. | |||||||||||||||||||||
| Performance Table Not Relevant to Tax Deferred | Actual after-tax returns depend on an investor’s tax situation and may differ from those shown, and after-tax returns shown are not relevant to tax-exempt investors or investors who hold Shares through tax-deferred arrangements, such as 401(k) plans or individual retirement accounts (“IRAs”). | |||||||||||||||||||||
| Performance [Table] |
|
|||||||||||||||||||||
| Index No Deduction for Fees, Expenses, or Taxes [Text] | reflects no deduction for fees, expenses or taxes | |||||||||||||||||||||
| Performance Table Closing [Text Block] | After-tax returns in the table above are calculated using the historical highest individual U.S. federal marginal income tax rates and do not reflect the impact of state or local taxes. Actual after-tax returns depend on an investor’s tax situation and may differ from those shown, and after-tax returns shown are not relevant to tax-exempt investors or investors who hold Shares through tax-deferred arrangements, such as 401(k) plans or individual retirement accounts (“IRAs”). Fund returns after taxes on distributions and sales of Shares are calculated assuming that an investor has sufficient capital gains of the same character from other investments to offset any capital losses from the sales of Shares. As a result, Fund returns after taxes on distributions and sales of Shares may exceed Fund returns before taxes and/or returns after taxes on distributions. |
|||||||||||||||||||||
| Performance Availability Website Address [Text] | https://www.volatilityshares.com/ethu | |||||||||||||||||||||
| Performance Availability Phone [Text] | (866) 261-0273 | |||||||||||||||||||||
| Solana ETF | ||||||||||||||||||||||
| Prospectus [Line Items] | ||||||||||||||||||||||
| Bar Chart and Performance Table [Heading] | Performance | |||||||||||||||||||||
| Performance Narrative [Text Block] | As of the date of this prospectus, the Fund has been in operation for less than one full calendar year and therefore does not report its performance. Once available, the Fund’s performance information will be accessible on the Fund’s website at www.volatilityshares.com and will provide some indication of the risks of investing in the Fund. |
|||||||||||||||||||||
| Performance One Year or Less [Text] | As of the date of this prospectus, the Fund has been in operation for less than one full calendar year and therefore does not report its performance. | |||||||||||||||||||||
| Performance Availability Website Address [Text] | www.volatilityshares.com | |||||||||||||||||||||
| 2x Solana ETF | ||||||||||||||||||||||
| Prospectus [Line Items] | ||||||||||||||||||||||
| Bar Chart and Performance Table [Heading] | Performance | |||||||||||||||||||||
| Performance Narrative [Text Block] | As of the date of this prospectus, the Fund has been in operation for less than one full calendar year and therefore does not report its performance. Once available, the Fund’s performance information will be accessible on the Fund’s website at www.volatilityshares.com and will provide some indication of the risks of investing in the Fund. |
|||||||||||||||||||||
| Performance One Year or Less [Text] | As of the date of this prospectus, the Fund has been in operation for less than one full calendar year and therefore does not report its performance. | |||||||||||||||||||||
| Performance Availability Website Address [Text] | www.volatilityshares.com | |||||||||||||||||||||
| XRP ETF | ||||||||||||||||||||||
| Prospectus [Line Items] | ||||||||||||||||||||||
| Bar Chart and Performance Table [Heading] | Performance | |||||||||||||||||||||
| Performance Narrative [Text Block] | As of the date of this prospectus, the Fund has been in operation for less than one full calendar year and therefore does not report its performance. Once available, the Fund’s performance information will be accessible on the Fund’s website at www.volatilityshares.com and will provide some indication of the risks of investing in the Fund. |
|||||||||||||||||||||
| Performance One Year or Less [Text] | As of the date of this prospectus, the Fund has been in operation for less than one full calendar year and therefore does not report its performance. | |||||||||||||||||||||
| Performance Availability Website Address [Text] | www.volatilityshares.com | |||||||||||||||||||||
| 2x XRP ETF | ||||||||||||||||||||||
| Prospectus [Line Items] | ||||||||||||||||||||||
| Bar Chart and Performance Table [Heading] | Performance | |||||||||||||||||||||
| Performance Narrative [Text Block] | As of the date of this prospectus, the Fund has been in operation for less than one full calendar year and therefore does not report its performance. Once available, the Fund’s performance information will be accessible on the Fund’s website at www.volatilityshares.com and will provide some indication of the risks of investing in the Fund. |
|||||||||||||||||||||
| Performance One Year or Less [Text] | As of the date of this prospectus, the Fund has been in operation for less than one full calendar year and therefore does not report its performance. | |||||||||||||||||||||
| Performance Availability Website Address [Text] | www.volatilityshares.com | |||||||||||||||||||||
| Volatility Premium Plus ETF | ||||||||||||||||||||||
| Prospectus [Line Items] | ||||||||||||||||||||||
| Bar Chart and Performance Table [Heading] | Performance | |||||||||||||||||||||
| Performance Narrative [Text Block] | The following performance information indicates some of the risks of investing in the Fund. The bar chart shows the Fund’s performance from year to year. The table illustrates how the Fund’s average annual total returns compare with those of a broad-based security market index. Past performance does not necessarily indicate how the Fund will perform in the future. Updated performance information is available at no cost on the Fund’s website at https://www.volatilityshares.com/zvol or by calling the Fund at (866) 261-0273. |
|||||||||||||||||||||
| Performance Past Does Not Indicate Future [Text] | Past performance does not necessarily indicate how the Fund will perform in the future. | |||||||||||||||||||||
| Performance Information Illustrates Variability of Returns [Text] | The following performance information indicates some of the risks of investing in the Fund. The bar chart shows the Fund’s performance from year to year. The table illustrates how the Fund’s average annual total returns compare with those of a broad-based security market index. | |||||||||||||||||||||
| Bar Chart [Heading] | Calendar Year Total Returns as of 12/31 | |||||||||||||||||||||
| Bar Chart [Table] |
|
|||||||||||||||||||||
| Bar Chart Closing [Text Block] | 
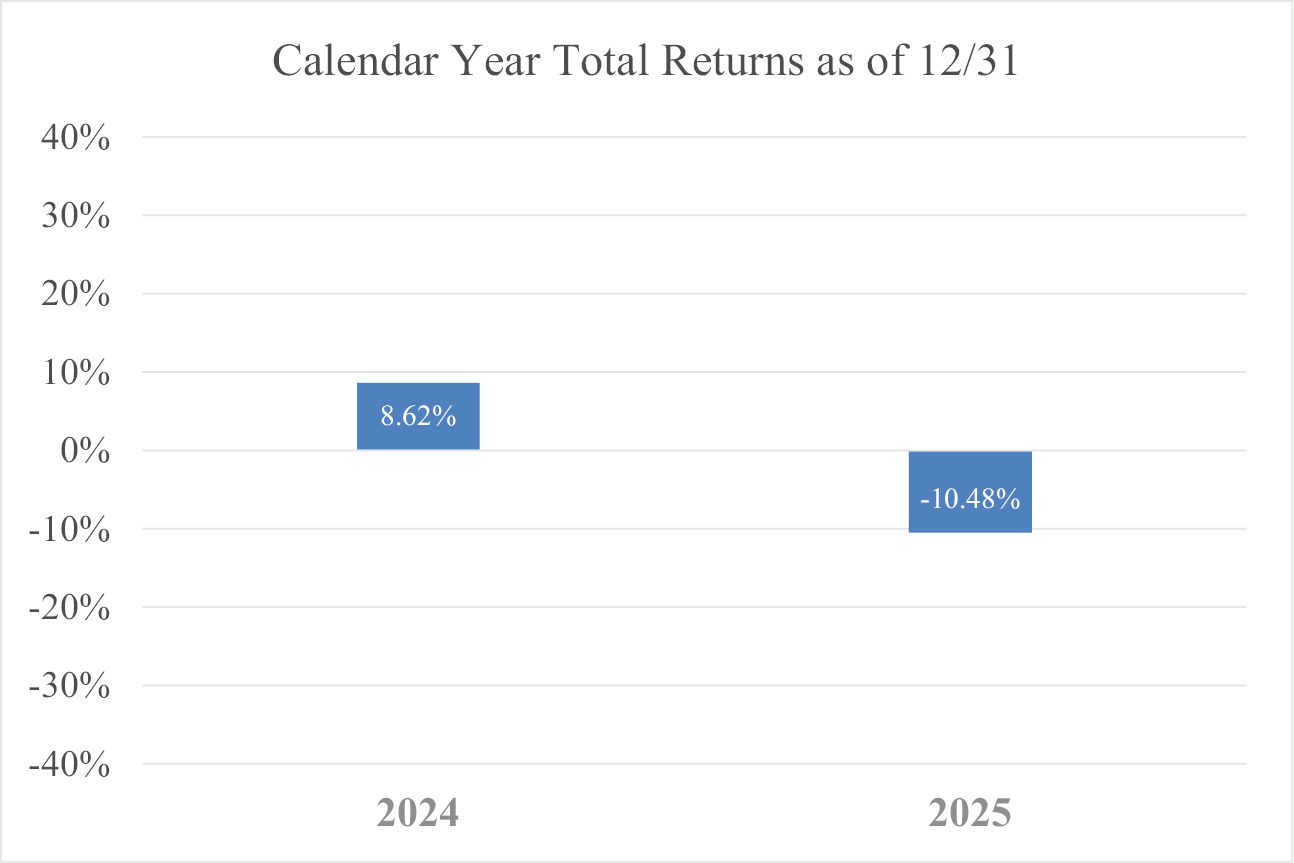
The Fund’s highest quarterly return was 11.17% (quarter-ended December 31, 2024) and the Fund’s lowest quarterly return was (10.21)% (quarter-ended June 30, 2025). The Fund’s year-to-date performance as of the most recent quarter-end (March 31, 2026) was (11.93)%. |
|||||||||||||||||||||
| Year to Date Return, Label [Optional Text] | year-to-date | |||||||||||||||||||||
| Bar Chart, Year to Date Return | (11.93%) | |||||||||||||||||||||
| Bar Chart, Year to Date Return, Date | Mar. 31, 2026 | |||||||||||||||||||||
| Highest Quarterly Return, Label [Optional Text] | highest quarterly return | |||||||||||||||||||||
| Highest Quarterly Return | 11.17% | |||||||||||||||||||||
| Highest Quarterly Return, Date | Dec. 31, 2024 | |||||||||||||||||||||
| Lowest Quarterly Return, Label [Optional Text] | lowest quarterly return | |||||||||||||||||||||
| Lowest Quarterly Return | (10.21%) | |||||||||||||||||||||
| Lowest Quarterly Return, Date | Jun. 30, 2025 | |||||||||||||||||||||
| Performance Table Heading | Average Annual Total Return as of December 31, 2025 | |||||||||||||||||||||
| Performance Table Uses Highest Federal Rate | After-tax returns in the table above are calculated using the historical highest individual U.S. federal marginal income tax rates and do not reflect the impact of state or local taxes. | |||||||||||||||||||||
| Performance Table Not Relevant to Tax Deferred | Actual after-tax returns depend on an investor’s tax situation and may differ from those shown, and after-tax returns shown are not relevant to tax-exempt investors or investors who hold Shares through tax-deferred arrangements, such as 401(k) plans or individual retirement accounts (“IRAs”). | |||||||||||||||||||||
| Performance [Table] |
(1) On or about October 27, 2025, the Fund ceased tracking the S&P 500® VIX Mid-Term Futures Inverse Daily Index. Therefore, the Fund’s performance and historical returns shown for periods prior to October 27, 2025, are not indicative of the performance that the Fund, based on its current investment strategies, would have generated. |
|||||||||||||||||||||
| Index No Deduction for Fees, Expenses, or Taxes [Text] | reflects no deduction for fees, expenses or taxes | |||||||||||||||||||||
| Performance Table Closing [Text Block] | After-tax returns in the table above are calculated using the historical highest individual U.S. federal marginal income tax rates and do not reflect the impact of state or local taxes. Actual after-tax returns depend on an investor’s tax situation and may differ from those shown, and after-tax returns shown are not relevant to tax-exempt investors or investors who hold Shares through tax-deferred arrangements, such as 401(k) plans or individual retirement accounts (“IRAs”). Fund returns after taxes on distributions and sales of Shares are calculated assuming that an investor has sufficient capital gains of the same character from other investments to offset any capital losses from the sales of Shares. As a result, Fund returns after taxes on distributions and sales of Shares may exceed Fund returns before taxes and/or returns after taxes on distributions. |
|||||||||||||||||||||
| Performance Availability Website Address [Text] | https://www.volatilityshares.com/zvol | |||||||||||||||||||||
| Performance Availability Phone [Text] | (866) 261-0273 | |||||||||||||||||||||