Performance Management
|
Jun. 26, 2026 |
| Blueprint Adaptive Growth Allocation Fund |
|
| Prospectus [Line Items] |
|
| Bar Chart and Performance Table [Heading] |
PERFORMANCE
SUMMARY
|
| Performance Narrative [Text Block] |
The
bar chart and table that follow provide some indication of the risks of investing in the Fund by showing changes in the Fund’s performance
from year to year and by showing how the Fund’s average annual total returns for one year, five-year and since inception compare
with those of a broad-based securities market index. How the Fund has performed in the past (before and after taxes) is not necessarily
an indication of how the Fund will perform in the future. Performance information, current through the most recent month end, is available
by calling 1-866-983-4525 or by visiting the Fund’s website at www.blueprintmutualfunds.com.
|
| Performance Past Does Not Indicate Future [Text] |
How the Fund has performed in the past (before and after taxes) is not necessarily
an indication of how the Fund will perform in the future.
|
| Performance Information Illustrates Variability of Returns [Text] |
The
bar chart and table that follow provide some indication of the risks of investing in the Fund by showing changes in the Fund’s performance
from year to year and by showing how the Fund’s average annual total returns for one year, five-year and since inception compare
with those of a broad-based securities market index.
|
| Bar Chart [Table] |
| |
2021 |
2022 |
2023 |
2024 |
2025 |
| * |
15.50% |
-18.28% |
12.11% |
19.29% |
13.04% |
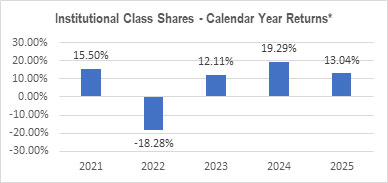
| * | The
Fund’s year-to-date return through March 31, 2026 is (1.50)%. |
|
| Bar Chart Closing [Text Block] |
Quarterly
Returns During This Time Period
Highest: 10.21%
(quarter ended March 31, 2024)
Lowest: (9.00)%
(quarter ended June 30, 2022)
|
| Year to Date Return, Label [Optional Text] |
The
Fund’s year-to-date return
|
| Bar Chart, Year to Date Return |
(1.50%)
|
| Bar Chart, Year to Date Return, Date |
Mar. 31, 2026
|
| Highest Quarterly Return, Label [Optional Text] |
Highest
|
| Highest Quarterly Return |
10.21%
|
| Highest Quarterly Return, Date |
Mar. 31, 2024
|
| Lowest Quarterly Return, Label [Optional Text] |
Lowest
|
| Lowest Quarterly Return |
(9.00%)
|
| Lowest Quarterly Return, Date |
Jun. 30, 2022
|
| Performance Table Heading |
Average Annual Total Returns for periods ended December 31, 2025
|
| Performance Table Uses Highest Federal Rate |
After-tax
returns are calculated using the historical highest individual federal marginal income tax rates and do not reflect the impact of state
and local taxes.
|
| Performance Table Not Relevant to Tax Deferred |
Actual after-tax returns depend on an investor’s tax situation and may differ from those shown. After-tax returns
shown are not relevant to investors who hold their shares through tax-deferred arrangements, such as a 401(k) plan or an individual retirement
account (“IRA”).
|
| Performance [Table] |
| Average
Annual Total Returns (for periods ended December 31, 2025) |
One
Year |
Five
Years |
Since
Inception
(March 31, 2020) |
| Institutional
Class |
|
|
|
| Return
Before Taxes |
13.04% |
7.37% |
9.78% |
| Return
After Taxes on Distributions |
11.81% |
7.03% |
9.46% |
| Return
After Taxes on Distributions and Sales of Fund Shares |
8.42% |
5.75% |
7.77% |
S&P
500® Index
(reflects no deduction for fees, expenses or taxes) |
17.88% |
14.42% |
20.25% |
|
| Index No Deduction for Fees, Expenses, or Taxes [Text] |
reflects no deduction for fees, expenses or taxes
|
| Performance Table Closing [Text Block] |
After-tax
returns are calculated using the historical highest individual federal marginal income tax rates and do not reflect the impact of state
and local taxes. Actual after-tax returns depend on an investor’s tax situation and may differ from those shown. After-tax returns
shown are not relevant to investors who hold their shares through tax-deferred arrangements, such as a 401(k) plan or an individual retirement
account (“IRA”).
|
| Performance Availability Website Address [Text] |
www.blueprintmutualfunds.com
|
| Performance Availability Phone [Text] |
1-866-983-4525
|
| HVIA Equity Fund |
|
| Prospectus [Line Items] |
|
| Bar Chart and Performance Table [Heading] |
PERFORMANCE
SUMMARY
|
| Performance Narrative [Text Block] |
The
bar chart and table that follow provide some indication of the risks of investing in the Fund by showing changes in the Fund’s
performance from year to year and by showing how the Fund’s average annual total returns for one year, five years, and since inception
compare with those of a broad-based securities market index. The bar chart and tables show the performance of the Fund’s Institutional
Class, which is the only class currently being offered. The Investor Class, if available, would have substantially similar annual returns
and would differ only to the extent the Investor Class has different expenses. How the Fund has performed in the past (before and after
taxes) is not necessarily an indication of how the Fund will perform in the future. Updated performance information, current through
the most recent month end, is available by calling 1-888-209-8710 or by visiting the Fund’s website at www.hviafunds.com.
|
| Performance Past Does Not Indicate Future [Text] |
How the Fund has performed in the past (before and after
taxes) is not necessarily an indication of how the Fund will perform in the future.
|
| Performance Information Illustrates Variability of Returns [Text] |
The
bar chart and table that follow provide some indication of the risks of investing in the Fund by showing changes in the Fund’s
performance from year to year and by showing how the Fund’s average annual total returns for one year, five years, and since inception
compare with those of a broad-based securities market index.
|
| Bar Chart [Heading] |
Calendar
Year Returns*
|
| Bar Chart [Table] |
| |
2017 |
2018 |
2019 |
2020 |
2021 |
2022 |
2023 |
2024 |
2025 |
| * |
23.00% |
-6.10% |
29.81% |
26.17% |
28.96% |
-20.39% |
27.68% |
17.17% |
16.72% |
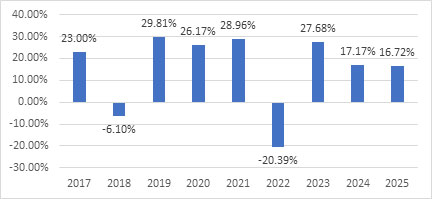
| * | The
Fund’s year-to-date return through March 31, 2026 is (5.14)%. |
|
| Bar Chart Closing [Text Block] |
Quarterly
Returns During This Time Period
| Highest |
24.44% |
(June
30, 2020) |
| Lowest |
(17.52)% |
(March
31, 2020) |
|
| Year to Date Return, Label [Optional Text] |
The
Fund’s year-to-date return
|
| Bar Chart, Year to Date Return |
(5.14%)
|
| Bar Chart, Year to Date Return, Date |
Mar. 31, 2026
|
| Highest Quarterly Return, Label [Optional Text] |
Highest
|
| Highest Quarterly Return |
24.44%
|
| Highest Quarterly Return, Date |
Jun. 30, 2020
|
| Lowest Quarterly Return, Label [Optional Text] |
Lowest
|
| Lowest Quarterly Return |
(17.52%)
|
| Lowest Quarterly Return, Date |
Mar. 31, 2020
|
| Performance Table Heading |
Average Annual Total Returns for periods ended December 31, 2025
|
| Performance Table Uses Highest Federal Rate |
After-tax
returns are calculated using the historical highest individual federal marginal income tax rates and do not reflect the impact of state
and local taxes.
|
| Performance Table Not Relevant to Tax Deferred |
Actual after-tax returns depend on an investor’s tax situation and may differ from those shown. After-tax returns
shown are not relevant to investors who hold their shares through tax-deferred arrangements, such as 401(k) plan or an individual retirement
account (“IRA”).
|
| Performance [Table] |
Average
Annual Total Returns
for Period Ended December 31, 2025 |
One
Year |
Five
Years |
Since
Inception |
| Return
Before Taxes |
16.72% |
12.38% |
14.89% |
| Return
After Taxes on Distributions |
14.73% |
11.19% |
14.07% |
| Return
After Taxes on Distributions and Sale of Fund Shares |
11.32% |
9.68% |
12.34% |
S&P
500® Index
(reflects
no deduction for fees, expenses or taxes) |
17.88% |
14.42% |
15.22% |
|
| Performance Table One Class of after Tax Shown [Text] |
After-tax returns are shown for the Fund’s Institutional Class only and after-tax returns for the
Investor Class will vary.
|
| Index No Deduction for Fees, Expenses, or Taxes [Text] |
reflects
no deduction for fees, expenses or taxes
|
| Performance Table Closing [Text Block] |
After-tax
returns are calculated using the historical highest individual federal marginal income tax rates and do not reflect the impact of state
and local taxes. Actual after-tax returns depend on an investor’s tax situation and may differ from those shown. After-tax returns
shown are not relevant to investors who hold their shares through tax-deferred arrangements, such as 401(k) plan or an individual retirement
account (“IRA”). After-tax returns are shown for the Fund’s Institutional Class only and after-tax returns for the
Investor Class will vary.
|
| Performance Availability Website Address [Text] |
www.hviafunds.com
|
| Performance Availability Phone [Text] |
1-888-209-8710
|
| Nia Impact Solutions Fund |
|
| Prospectus [Line Items] |
|
| Bar Chart and Performance Table [Heading] |
PERFORMANCE
SUMMARY
|
| Performance Narrative [Text Block] |
The
bar chart and table that follow provide some indication of the risks of investing in the Fund by showing changes in the Fund’s
performance from year to year and by showing how the Fund’s average annual returns for one year and since inception compare with
those of a broad-based securities market index. How the Fund has performed in the past (before and after taxes) is not necessarily an
indication of how the Fund will perform in the future. Updated performance information, current through the most recent month end, is
available by calling 1-833-571-2833 or visiting www.niaimpactfunds.com.
|
| Performance Past Does Not Indicate Future [Text] |
How the Fund has performed in the past (before and after taxes) is not necessarily an
indication of how the Fund will perform in the future.
|
| Performance Information Illustrates Variability of Returns [Text] |
The
bar chart and table that follow provide some indication of the risks of investing in the Fund by showing changes in the Fund’s
performance from year to year and by showing how the Fund’s average annual returns for one year and since inception compare with
those of a broad-based securities market index.
|
| Bar Chart [Heading] |
Calendar
Year Returns*
|
| Bar Chart [Table] |
| |
2023 |
2024 |
2025 |
| * |
13.14% |
10.89% |
16.26% |
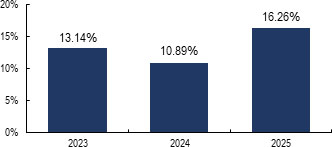
| * | The
Fund’s year-to-date return through March 31, 2026 is (3.33)%. |
|
| Bar Chart Closing [Text Block] |
Quarterly
Returns During This Time Period
| Highest: |
13.95%
(quarter ended December 31, 2023) |
| Lowest: |
(8.03)%
(quarter ended September 30, 2023) |
|
| Year to Date Return, Label [Optional Text] |
The
Fund’s year-to-date return
|
| Bar Chart, Year to Date Return |
(3.33%)
|
| Bar Chart, Year to Date Return, Date |
Mar. 31, 2026
|
| Highest Quarterly Return, Label [Optional Text] |
Highest
|
| Highest Quarterly Return |
13.95%
|
| Highest Quarterly Return, Date |
Dec. 31, 2023
|
| Lowest Quarterly Return, Label [Optional Text] |
Lowest
|
| Lowest Quarterly Return |
(8.03%)
|
| Lowest Quarterly Return, Date |
Sep. 30, 2023
|
| Performance Table Heading |
Average Annual Total Returns periods ended December 31, 2025
|
| Performance Table Uses Highest Federal Rate |
After-tax
returns are calculated using the historical highest individual federal marginal income tax rates and do not reflect the impact of state
and local taxes.
|
| Performance Table Not Relevant to Tax Deferred |
Actual after-tax returns depend on an investor’s tax situation and may differ from those shown. After-tax returns
shown are not relevant to investors who hold their shares through tax-deferred arrangements, such as a 401(k) plan or an individual retirement
account (“IRA”).
|
| Performance [Table] |
Average
Annual Total Returns
for Period Ended December 31, 2025 |
One
Year |
Since
Inception
(May 10, 2022) |
| Return
Before Taxes |
16.26% |
10.38% |
| Return
After Taxes on Distributions |
16.19% |
10.26% |
| Return
After Taxes on Distributions and Sale of Fund Shares |
9.68% |
8.12% |
MSCI
ACWI IMI Index
(reflects no deduction for fees, expenses or taxes) |
22.05% |
15.63% |
|
| Index No Deduction for Fees, Expenses, or Taxes [Text] |
reflects no deduction for fees, expenses or taxes
|
| Performance Table Closing [Text Block] |
After-tax
returns are calculated using the historical highest individual federal marginal income tax rates and do not reflect the impact of state
and local taxes. Actual after-tax returns depend on an investor’s tax situation and may differ from those shown. After-tax returns
shown are not relevant to investors who hold their shares through tax-deferred arrangements, such as a 401(k) plan or an individual retirement
account (“IRA”).
|
| Performance Availability Website Address [Text] |
www.niaimpactfunds.com
|
| Performance Availability Phone [Text] |
1-833-571-2833
|