Shareholder Report
|
6 Months Ended |
|
Apr. 30, 2026
USD ($)
Holding
|
|---|
| Shareholder Report [Line Items] |
|
|
| Document Type |
N-CSRS
|
|
| Amendment Flag |
false
|
|
| Registrant Name |
Thrivent Mutual Funds
|
|
| Entity Central Index Key |
0000811869
|
|
| Entity Investment Company Type |
N-1A
|
|
| Document Period End Date |
Apr. 30, 2026
|
|
| C000002053 |
|
|
| Shareholder Report [Line Items] |
|
|
| Fund Name |
Thrivent Aggressive Allocation Fund
|
|
| Class Name |
A
|
|
| Trading Symbol |
TAAAX
|
|
| Annual or Semi-Annual Statement [Text Block] |
This semi-annual shareholder report contains important information about the Thrivent Aggressive Allocation Fund (the Fund) for the six months ended April 30, 2026.
|
|
| Shareholder Report Annual or Semi-Annual |
Semi-Annual Shareholder Report
|
|
| Additional Information Phone Number |
800-847-4836
|
|
| Additional Information Website |
www.thriventmutualfunds.com/prospectus
|
|
| Expenses [Text Block] |
What were the Fund's costs for the last six months?(based on a hypothetical $10,000 investment) Table SummaryShare Class | Cost of a $10k Investment | Cost Paid as a % of a $10k Investment |
|---|
Class A | $47 | 0.91%Footnote Reference** |
|---|
| Footnote | Description | Footnote** | Computed on an annualized basis for periods less than one year. |
|
|
| Expenses Paid, Amount |
$ 47
|
|
| Expense Ratio, Percent |
0.91%
|
[1] |
| AssetsNet |
$ 3,444,381,628
|
|
| Holdings Count | Holding |
1,121
|
|
| Advisory Fees Paid, Amount |
$ 8,892,823
|
|
| InvestmentCompanyPortfolioTurnover |
22.00%
|
|
| Additional Fund Statistics [Text Block] |
Table SummaryTotal Net Assets | # of Portfolio Holdings | Portfolio Turnover Rate | Advisory Fees Paid |
|---|
$3,444,381,628 | 1,121 | 22% | $8,892,823 | |
|
| Holdings [Text Block] |
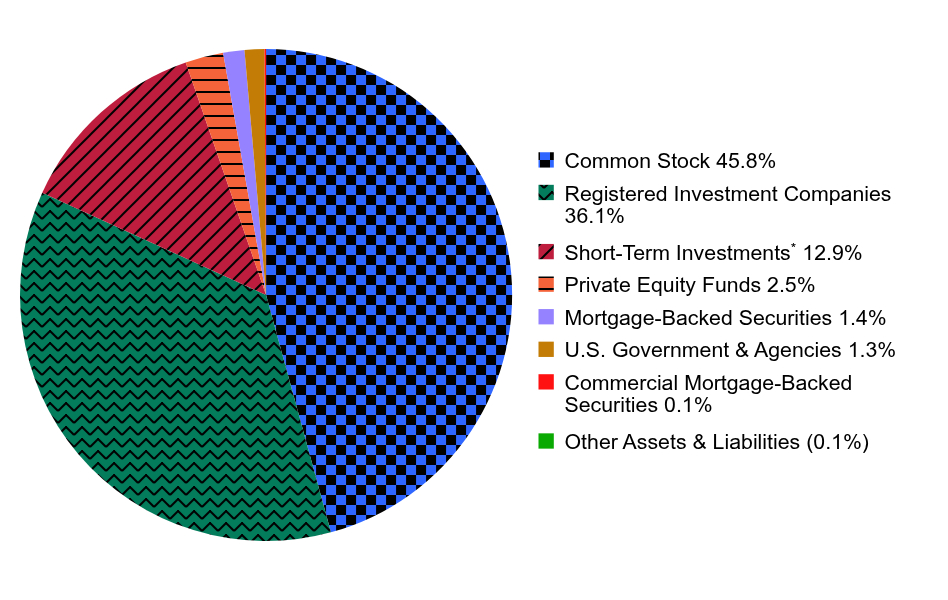
Portfolio Composition (% of Net Assets)Table SummaryValue | Value |
|---|
Common Stock | 45.8% | Registered Investment Companies | 36.1% | Short-Term InvestmentsFootnote Reference* | 12.9% | Private Equity Funds | 2.5% | Mortgage-Backed Securities | 1.4% | U.S. Government & Agencies | 1.3% | Commercial Mortgage-Backed Securities | 0.1% | Other Assets & Liabilities | (0.1%) | * A portion of Short-Term Investments are equitized through the use of derivatives held by this Fund. A complete listing of derivatives held by the Fund can be found on the Fund's Schedule of Investments. |
|
| Largest Holdings [Text Block] |
Top Ten Holdings (% of Net Assets)Table SummaryThrivent Large Cap Growth Fund, Class S | 8.2% |
|---|
Thrivent International Equity Fund, Class S | 6.6% |
|---|
Thrivent Large Cap Value Fund, Class S | 4.8% |
|---|
Thrivent Core International Equity Fund | 3.9% |
|---|
Thrivent Mid Cap Stock Fund, Class S | 2.9% |
|---|
Thrivent Global Stock Fund, Class S | 2.4% |
|---|
Thrivent Core Emerging Markets Equity Fund | 2.3% |
|---|
Thrivent Small Cap Stock Fund, Class S | 2.0% |
|---|
Thrivent Mid Cap Value ETF | 1.8% |
|---|
NVIDIA Corporation | 1.8% |
|---|
|
|
| C000002054 |
|
|
| Shareholder Report [Line Items] |
|
|
| Fund Name |
Thrivent Aggressive Allocation Fund
|
|
| Class Name |
S
|
|
| Trading Symbol |
TAAIX
|
|
| Annual or Semi-Annual Statement [Text Block] |
This semi-annual shareholder report contains important information about the Thrivent Aggressive Allocation Fund (the Fund) for the six months ended April 30, 2026.
|
|
| Shareholder Report Annual or Semi-Annual |
Semi-Annual Shareholder Report
|
|
| Additional Information Phone Number |
800-847-4836
|
|
| Additional Information Website |
www.thriventmutualfunds.com/prospectus
|
|
| Expenses [Text Block] |
What were the Fund's costs for the last six months?(based on a hypothetical $10,000 investment) Table SummaryShare Class | Cost of a $10k Investment | Cost Paid as a % of a $10k Investment |
|---|
Class S | $38 | 0.73%Footnote Reference** |
|---|
| Footnote | Description | Footnote** | Computed on an annualized basis for periods less than one year. |
|
|
| Expenses Paid, Amount |
$ 38
|
|
| Expense Ratio, Percent |
0.73%
|
[2] |
| AssetsNet |
$ 3,444,381,628
|
|
| Holdings Count | Holding |
1,121
|
|
| Advisory Fees Paid, Amount |
$ 8,892,823
|
|
| InvestmentCompanyPortfolioTurnover |
22.00%
|
|
| Additional Fund Statistics [Text Block] |
Table SummaryTotal Net Assets | # of Portfolio Holdings | Portfolio Turnover Rate | Advisory Fees Paid |
|---|
$3,444,381,628 | 1,121 | 22% | $8,892,823 | |
|
| Holdings [Text Block] |
Portfolio Composition (% of Net Assets)Table SummaryValue | Value |
|---|
Common Stock | 45.8% | Registered Investment Companies | 36.1% | Short-Term InvestmentsFootnote Reference* | 12.9% | Private Equity Funds | 2.5% | Mortgage-Backed Securities | 1.4% | U.S. Government & Agencies | 1.3% | Commercial Mortgage-Backed Securities | 0.1% | Other Assets & Liabilities | (0.1%) | * A portion of Short-Term Investments are equitized through the use of derivatives held by this Fund. A complete listing of derivatives held by the Fund can be found on the Fund's Schedule of Investments. |
|
| Largest Holdings [Text Block] |
Top Ten Holdings (% of Net Assets)Table SummaryThrivent Large Cap Growth Fund, Class S | 8.2% |
|---|
Thrivent International Equity Fund, Class S | 6.6% |
|---|
Thrivent Large Cap Value Fund, Class S | 4.8% |
|---|
Thrivent Core International Equity Fund | 3.9% |
|---|
Thrivent Mid Cap Stock Fund, Class S | 2.9% |
|---|
Thrivent Global Stock Fund, Class S | 2.4% |
|---|
Thrivent Core Emerging Markets Equity Fund | 2.3% |
|---|
Thrivent Small Cap Stock Fund, Class S | 2.0% |
|---|
Thrivent Mid Cap Value ETF | 1.8% |
|---|
NVIDIA Corporation | 1.8% |
|---|
|
|
| C000002055 |
|
|
| Shareholder Report [Line Items] |
|
|
| Fund Name |
Thrivent Dynamic Allocation Fund
|
|
| Class Name |
A
|
|
| Trading Symbol |
AABFX
|
|
| Annual or Semi-Annual Statement [Text Block] |
This semi-annual shareholder report contains important information about the Thrivent Dynamic Allocation Fund (the Fund) for the six months ended April 30, 2026.
|
|
| Shareholder Report Annual or Semi-Annual |
Semi-Annual Shareholder Report
|
|
| Additional Information Phone Number |
800-847-4836
|
|
| Additional Information Website |
www.thriventmutualfunds.com/prospectus
|
|
| Expenses [Text Block] |
What were the Fund's costs for the last six months?(based on a hypothetical $10,000 investment) Table SummaryShare Class | Cost of a $10k Investment | Cost Paid as a % of a $10k Investment |
|---|
Class A | $49 | 0.97%Footnote Reference** |
|---|
| Footnote | Description | Footnote** | Computed on an annualized basis for periods less than one year. |
|
|
| Expenses Paid, Amount |
$ 49
|
|
| Expense Ratio, Percent |
0.97%
|
[3] |
| AssetsNet |
$ 456,662,677
|
|
| Holdings Count | Holding |
977
|
|
| Advisory Fees Paid, Amount |
$ 1,218,488
|
|
| InvestmentCompanyPortfolioTurnover |
48.00%
|
|
| Additional Fund Statistics [Text Block] |
Table SummaryTotal Net Assets | # of Portfolio Holdings | Portfolio Turnover Rate | Advisory Fees Paid |
|---|
$456,662,677 | 977 | 48% | $1,218,488 | |
|
| Holdings [Text Block] |
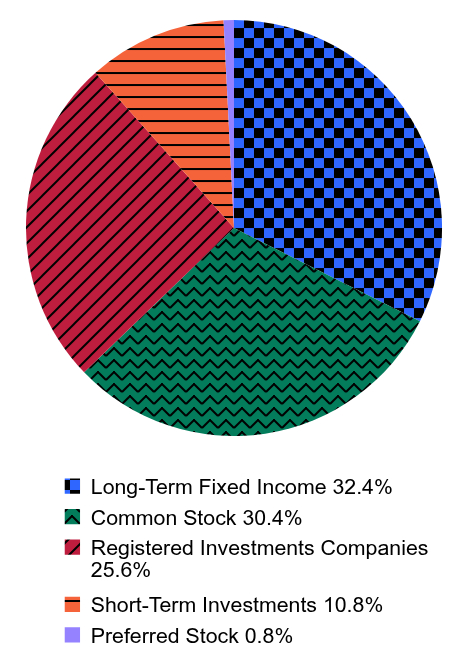
Portfolio Composition (% of Portfolio)Table SummaryValue | Value |
|---|
Long-Term Fixed Income | 32.4% | Common Stock | 30.4% | Registered Investments Companies | 25.6% | Short-Term Investments | 10.8% | Preferred Stock | 0.8% | Major Market Sectors (% of Net Assets)Table SummaryU.S. Affiliated Registered Investment Companies | 26.0% |
|---|
Mortgage-Backed Securities | 13.6% |
|---|
Information Technology | 9.6% |
|---|
Collateralized Mortgage Obligations | 6.7% |
|---|
Financials | 5.9% |
|---|
U.S. Government & Agencies | 5.1% |
|---|
Asset-Backed Securities | 4.3% |
|---|
Industrials | 3.9% |
|---|
Consumer Discretionary | 3.4% |
|---|
Communications Services | 3.2% |
|---|
|
|
| Largest Holdings [Text Block] |
Top Ten Holdings (% of Net Assets)Table SummaryThrivent Core International Equity Fund | 8.1% |
|---|
Thrivent Core Investment Grade Corporate Bond Fund | 7.2% |
|---|
Thrivent Core High Yield Bond Fund | 5.5% |
|---|
Thrivent Core Emerging Markets Debt Fund | 5.1% |
|---|
Federal National Mortgage Association Conventional 30-Yr. Pass Through | 1.9% |
|---|
NVIDIA Corporation | 1.6% |
|---|
Microsoft Corporation | 1.3% |
|---|
Amazon.com, Inc. | 1.3% |
|---|
Apple, Inc. | 1.0% |
|---|
Federal National Mortgage Association Conventional 15-Yr. Pass Through | 1.0% |
|---|
|
|
| C000002056 |
|
|
| Shareholder Report [Line Items] |
|
|
| Fund Name |
Thrivent Dynamic Allocation Fund
|
|
| Class Name |
S
|
|
| Trading Symbol |
IBBFX
|
|
| Annual or Semi-Annual Statement [Text Block] |
This semi-annual shareholder report contains important information about the Thrivent Dynamic Allocation Fund (the Fund) for the six months ended April 30, 2026.
|
|
| Shareholder Report Annual or Semi-Annual |
Semi-Annual Shareholder Report
|
|
| Additional Information Phone Number |
800-847-4836
|
|
| Additional Information Website |
www.thriventmutualfunds.com/prospectus
|
|
| Expenses [Text Block] |
What were the Fund's costs for the last six months?(based on a hypothetical $10,000 investment) Table SummaryShare Class | Cost of a $10k Investment | Cost Paid as a % of a $10k Investment |
|---|
Class S | $37 | 0.73%Footnote Reference** |
|---|
| Footnote | Description | Footnote** | Computed on an annualized basis for periods less than one year. |
|
|
| Expenses Paid, Amount |
$ 37
|
|
| Expense Ratio, Percent |
0.73%
|
[4] |
| AssetsNet |
$ 456,662,677
|
|
| Holdings Count | Holding |
977
|
|
| Advisory Fees Paid, Amount |
$ 1,218,488
|
|
| InvestmentCompanyPortfolioTurnover |
48.00%
|
|
| Additional Fund Statistics [Text Block] |
Table SummaryTotal Net Assets | # of Portfolio Holdings | Portfolio Turnover Rate | Advisory Fees Paid |
|---|
$456,662,677 | 977 | 48% | $1,218,488 | |
|
| Holdings [Text Block] |
Portfolio Composition (% of Portfolio)Table SummaryValue | Value |
|---|
Long-Term Fixed Income | 32.4% | Common Stock | 30.4% | Registered Investments Companies | 25.6% | Short-Term Investments | 10.8% | Preferred Stock | 0.8% | Major Market Sectors (% of Net Assets)Table SummaryU.S. Affiliated Registered Investment Companies | 26.0% |
|---|
Mortgage-Backed Securities | 13.6% |
|---|
Information Technology | 9.6% |
|---|
Collateralized Mortgage Obligations | 6.7% |
|---|
Financials | 5.9% |
|---|
U.S. Government & Agencies | 5.1% |
|---|
Asset-Backed Securities | 4.3% |
|---|
Industrials | 3.9% |
|---|
Consumer Discretionary | 3.4% |
|---|
Communications Services | 3.2% |
|---|
|
|
| Largest Holdings [Text Block] |
Top Ten Holdings (% of Net Assets)Table SummaryThrivent Core International Equity Fund | 8.1% |
|---|
Thrivent Core Investment Grade Corporate Bond Fund | 7.2% |
|---|
Thrivent Core High Yield Bond Fund | 5.5% |
|---|
Thrivent Core Emerging Markets Debt Fund | 5.1% |
|---|
Federal National Mortgage Association Conventional 30-Yr. Pass Through | 1.9% |
|---|
NVIDIA Corporation | 1.6% |
|---|
Microsoft Corporation | 1.3% |
|---|
Amazon.com, Inc. | 1.3% |
|---|
Apple, Inc. | 1.0% |
|---|
Federal National Mortgage Association Conventional 15-Yr. Pass Through | 1.0% |
|---|
|
|
| C000003642 |
|
|
| Shareholder Report [Line Items] |
|
|
| Fund Name |
Thrivent Global Stock Fund
|
|
| Class Name |
A
|
|
| Trading Symbol |
AALGX
|
|
| Annual or Semi-Annual Statement [Text Block] |
This semi-annual shareholder report contains important information about the Thrivent Global Stock Fund (the Fund) for the six months ended April 30, 2026.
|
|
| Shareholder Report Annual or Semi-Annual |
Semi-Annual Shareholder Report
|
|
| Additional Information Phone Number |
800-847-4836
|
|
| Additional Information Website |
www.thriventmutualfunds.com/prospectus
|
|
| Expenses [Text Block] |
What were the Fund's costs for the last six months?(based on a hypothetical $10,000 investment) Table SummaryShare Class | Cost of a $10k Investment | Cost Paid as a % of a $10k Investment |
|---|
Class A | $47 | 0.92%Footnote Reference** |
|---|
| Footnote | Description | Footnote** | Computed on an annualized basis for periods less than one year. |
|
|
| Expenses Paid, Amount |
$ 47
|
|
| Expense Ratio, Percent |
0.92%
|
[5] |
| AssetsNet |
$ 2,448,715,769
|
|
| Holdings Count | Holding |
1,269
|
|
| Advisory Fees Paid, Amount |
$ 6,317,473
|
|
| InvestmentCompanyPortfolioTurnover |
25.00%
|
|
| Additional Fund Statistics [Text Block] |
Table SummaryTotal Net Assets | # of Portfolio Holdings | Portfolio Turnover Rate | Advisory Fees Paid |
|---|
$2,448,715,769 | 1,269 | 25% | $6,317,473 | |
|
| Holdings [Text Block] |
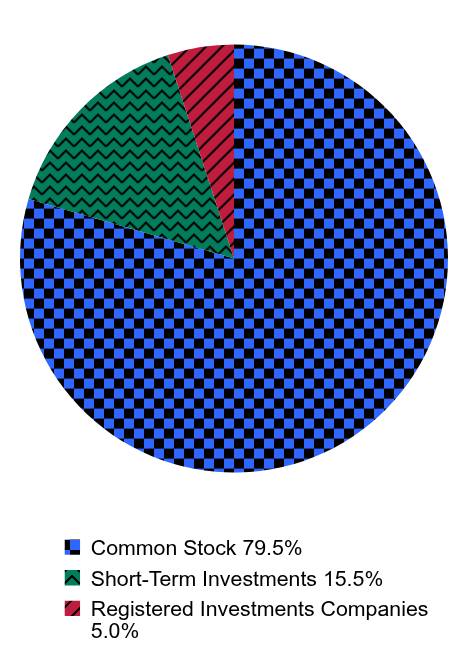
Portfolio Composition (% of Portfolio)Table SummaryValue | Value |
|---|
Common Stock | 79.5% | Short-Term Investments | 15.5% | Registered Investments Companies | 5.0% | Major Market Sectors (% of Net Assets)Table SummaryInformation Technology | 16.0% |
|---|
Financials | 15.0% |
|---|
Industrials | 12.7% |
|---|
Health Care | 7.6% |
|---|
Consumer Discretionary | 6.7% |
|---|
Communications Services | 6.1% |
|---|
U.S. Affiliated Registered Investment Companies | 4.1% |
|---|
Energy | 4.0% |
|---|
Consumer Staples | 3.2% |
|---|
Materials | 3.2% |
|---|
|
|
| Largest Holdings [Text Block] |
Top Ten Holdings (% of Net Assets)Table SummaryThrivent Core Emerging Markets Equity Fund | 3.6% |
|---|
NVIDIA Corporation | 2.3% |
|---|
Amazon.com, Inc. | 2.1% |
|---|
Microsoft Corporation | 2.0% |
|---|
Alphabet, Inc., Class C | 1.5% |
|---|
Apple, Inc. | 1.3% |
|---|
Meta Platforms, Inc. | 1.2% |
|---|
Alphabet, Inc., Class A | 1.1% |
|---|
Broadcom, Inc. | 1.1% |
|---|
ASML Holding NV | 0.9% |
|---|
|
|
| C000003644 |
|
|
| Shareholder Report [Line Items] |
|
|
| Fund Name |
Thrivent Global Stock Fund
|
|
| Class Name |
S
|
|
| Trading Symbol |
IILGX
|
|
| Annual or Semi-Annual Statement [Text Block] |
This semi-annual shareholder report contains important information about the Thrivent Global Stock Fund (the Fund) for the six months ended April 30, 2026.
|
|
| Shareholder Report Annual or Semi-Annual |
Semi-Annual Shareholder Report
|
|
| Additional Information Phone Number |
800-847-4836
|
|
| Additional Information Website |
www.thriventmutualfunds.com/prospectus
|
|
| Expenses [Text Block] |
What were the Fund's costs for the last six months?(based on a hypothetical $10,000 investment) Table SummaryShare Class | Cost of a $10k Investment | Cost Paid as a % of a $10k Investment |
|---|
Class S | $32 | 0.62%Footnote Reference** |
|---|
| Footnote | Description | Footnote** | Computed on an annualized basis for periods less than one year. |
|
|
| Expenses Paid, Amount |
$ 32
|
|
| Expense Ratio, Percent |
0.62%
|
[6] |
| AssetsNet |
$ 2,448,715,769
|
|
| Holdings Count | Holding |
1,269
|
|
| Advisory Fees Paid, Amount |
$ 6,317,473
|
|
| InvestmentCompanyPortfolioTurnover |
25.00%
|
|
| Additional Fund Statistics [Text Block] |
Table SummaryTotal Net Assets | # of Portfolio Holdings | Portfolio Turnover Rate | Advisory Fees Paid |
|---|
$2,448,715,769 | 1,269 | 25% | $6,317,473 | |
|
| Holdings [Text Block] |
Portfolio Composition (% of Portfolio)Table SummaryValue | Value |
|---|
Common Stock | 79.5% | Short-Term Investments | 15.5% | Registered Investments Companies | 5.0% | Major Market Sectors (% of Net Assets)Table SummaryInformation Technology | 16.0% |
|---|
Financials | 15.0% |
|---|
Industrials | 12.7% |
|---|
Health Care | 7.6% |
|---|
Consumer Discretionary | 6.7% |
|---|
Communications Services | 6.1% |
|---|
U.S. Affiliated Registered Investment Companies | 4.1% |
|---|
Energy | 4.0% |
|---|
Consumer Staples | 3.2% |
|---|
Materials | 3.2% |
|---|
|
|
| Largest Holdings [Text Block] |
Top Ten Holdings (% of Net Assets)Table SummaryThrivent Core Emerging Markets Equity Fund | 3.6% |
|---|
NVIDIA Corporation | 2.3% |
|---|
Amazon.com, Inc. | 2.1% |
|---|
Microsoft Corporation | 2.0% |
|---|
Alphabet, Inc., Class C | 1.5% |
|---|
Apple, Inc. | 1.3% |
|---|
Meta Platforms, Inc. | 1.2% |
|---|
Alphabet, Inc., Class A | 1.1% |
|---|
Broadcom, Inc. | 1.1% |
|---|
ASML Holding NV | 0.9% |
|---|
|
|
| C000088463 |
|
|
| Shareholder Report [Line Items] |
|
|
| Fund Name |
Thrivent Government Bond Fund
|
|
| Class Name |
A
|
|
| Trading Symbol |
TBFAX
|
|
| Annual or Semi-Annual Statement [Text Block] |
This semi-annual shareholder report contains important information about the Thrivent Government Bond Fund (the Fund) for the six months ended April 30, 2026.
|
|
| Shareholder Report Annual or Semi-Annual |
Semi-Annual Shareholder Report
|
|
| Additional Information Phone Number |
800-847-4836
|
|
| Additional Information Website |
www.thriventmutualfunds.com/prospectus
|
|
| Expenses Paid, Amount |
$ 39
|
|
| Expense Ratio, Percent |
0.79%
|
[7] |
| AssetsNet |
$ 45,435,094
|
|
| Holdings Count | Holding |
76
|
|
| Advisory Fees Paid, Amount |
$ 89,855
|
|
| InvestmentCompanyPortfolioTurnover |
181.00%
|
|
| Additional Fund Statistics [Text Block] |
Fund Statistics
|
|
| Holdings [Text Block] |
Table SummaryU.S. Treasury Notes | 16.7% |
|---|
U.S. Treasury Notes | 14.2% |
|---|
U.S. Treasury Notes | 11.7% |
|---|
U.S. Treasury Notes | 5.5% |
|---|
U.S. Treasury Bonds | 3.5% |
|---|
U.S. Treasury Notes | 3.2% |
|---|
Federal Home Loan Mortgage Corporation - REMIC | 1.7% |
|---|
U.S. Treasury Bonds | 1.5% |
|---|
Federal National Mortgage Association Conventional 40-Yr. Pass Through | 1.4% |
|---|
Federal National Mortgage Association Conventional 30-Yr. Pass Through | 1.3% |
|---|
Table SummaryU.S. Government & Agencies | 57.1% |
|---|
Mortgage-Backed Securities | 19.3% |
|---|
Collateralized Mortgage Obligations | 14.0% |
|---|
Commercial Mortgage-Backed Securities | 4.7% |
|---|
Asset-Backed Securities | 4.4% |
|---|
Table SummaryValue | Value |
|---|
ETFs/Closed-End Funds | 0.0 | Non-Rated | 2.7 | D | 0.0 | C | 0.0 | CA | 0.0 | CAA | 0.0 | B | 0.0 | BA | 0.0 | BAA | 0.0 | A | 0.0 | AA | 53.3 | AAA | 0.4 | U.S. Gov't Guaranteed | 43.6 | Table SummaryValue | Value |
|---|
Long-Term Fixed Income | 96.9% | Short-Term Investments | 3.1% |
|
|
| Credit Ratings Selection [Text Block] |
Bond Quality Ratings
|
|
| C000088464 |
|
|
| Shareholder Report [Line Items] |
|
|
| Fund Name |
Thrivent Government Bond Fund
|
|
| Class Name |
S
|
|
| Trading Symbol |
TBFIX
|
|
| Annual or Semi-Annual Statement [Text Block] |
This semi-annual shareholder report contains important information about the Thrivent Government Bond Fund (the Fund) for the six months ended April 30, 2026.
|
|
| Shareholder Report Annual or Semi-Annual |
Semi-Annual Shareholder Report
|
|
| Additional Information Phone Number |
800-847-4836
|
|
| Additional Information Website |
www.thriventmutualfunds.com/prospectus
|
|
| Expenses Paid, Amount |
$ 24
|
|
| Expense Ratio, Percent |
0.48%
|
[8] |
| AssetsNet |
$ 45,435,094
|
|
| Holdings Count | Holding |
76
|
|
| Advisory Fees Paid, Amount |
$ 89,855
|
|
| InvestmentCompanyPortfolioTurnover |
181.00%
|
|
| Additional Fund Statistics [Text Block] |
Fund Statistics
|
|
| Holdings [Text Block] |
Table SummaryU.S. Treasury Notes | 16.7% |
|---|
U.S. Treasury Notes | 14.2% |
|---|
U.S. Treasury Notes | 11.7% |
|---|
U.S. Treasury Notes | 5.5% |
|---|
U.S. Treasury Bonds | 3.5% |
|---|
U.S. Treasury Notes | 3.2% |
|---|
Federal Home Loan Mortgage Corporation - REMIC | 1.7% |
|---|
U.S. Treasury Bonds | 1.5% |
|---|
Federal National Mortgage Association Conventional 40-Yr. Pass Through | 1.4% |
|---|
Federal National Mortgage Association Conventional 30-Yr. Pass Through | 1.3% |
|---|
Table SummaryU.S. Government & Agencies | 57.1% |
|---|
Mortgage-Backed Securities | 19.3% |
|---|
Collateralized Mortgage Obligations | 14.0% |
|---|
Commercial Mortgage-Backed Securities | 4.7% |
|---|
Asset-Backed Securities | 4.4% |
|---|
Table SummaryValue | Value |
|---|
ETFs/Closed-End Funds | 0.0 | Non-Rated | 2.7 | D | 0.0 | C | 0.0 | CA | 0.0 | CAA | 0.0 | B | 0.0 | BA | 0.0 | BAA | 0.0 | A | 0.0 | AA | 53.3 | AAA | 0.4 | U.S. Gov't Guaranteed | 43.6 | Table SummaryValue | Value |
|---|
Long-Term Fixed Income | 96.9% | Short-Term Investments | 3.1% |
|
|
| Credit Ratings Selection [Text Block] |
Bond Quality Ratings
|
|
| C000003614 |
|
|
| Shareholder Report [Line Items] |
|
|
| Fund Name |
Thrivent High Yield Fund
|
|
| Class Name |
A
|
|
| Trading Symbol |
LBHYX
|
|
| Annual or Semi-Annual Statement [Text Block] |
This semi-annual shareholder report contains important information about the Thrivent High Yield Fund (the Fund) for the six months ended April 30, 2026.
|
|
| Shareholder Report Annual or Semi-Annual |
Semi-Annual Shareholder Report
|
|
| Additional Information Phone Number |
800-847-4836
|
|
| Additional Information Website |
www.thriventmutualfunds.com/prospectus
|
|
| Expenses Paid, Amount |
$ 41
|
|
| Expense Ratio, Percent |
0.81%
|
[9] |
| AssetsNet |
$ 815,594,265
|
|
| Holdings Count | Holding |
676
|
|
| Advisory Fees Paid, Amount |
$ 1,449,555
|
|
| InvestmentCompanyPortfolioTurnover |
17.00%
|
|
| Additional Fund Statistics [Text Block] |
Fund Statistics
|
|
| Holdings [Text Block] |
Table SummaryiShares Broad USD High Yield Corporate Bond ETF | 1.0% |
|---|
Venture Global LNG, Inc. | 0.6% |
|---|
DIRECTV Financing, LLC/DIRECTV Financing Co-Obligor, Inc. | 0.5% |
|---|
Cloud Software Group, Inc. | 0.5% |
|---|
Vistra Corporation | 0.5% |
|---|
TerraForm Power Operating, LLC | 0.5% |
|---|
CCO Holdings, LLC/CCO Holdings Capital Corporation | 0.5% |
|---|
1261229 B.C., Ltd. | 0.5% |
|---|
Tenet Healthcare Corporation | 0.4% |
|---|
Marriott Ownership Resorts, Inc. | 0.4% |
|---|
Table SummaryConsumer Cyclical | 16.6% |
|---|
Communications Services | 13.1% |
|---|
Financials | 12.4% |
|---|
Consumer Non-Cyclical | 11.2% |
|---|
Energy | 11.0% |
|---|
Capital Goods | 10.3% |
|---|
Technology | 8.6% |
|---|
Basic Materials | 5.4% |
|---|
Utilities | 3.4% |
|---|
Transportation | 1.9% |
|---|
Table SummaryValue | Value |
|---|
ETFs/Closed-End Funds | 1.1 | Non-Rated | 0.3 | D | 0.0 | C | 0.0 | CA | 0.1 | CAA | 8.9 | B | 47.3 | BA | 39.9 | BAA | 2.3 | A | 0.1 | AA | 0.0 | AAA | 0.0 | U.S. Gov't Guaranteed | 0.0 | Table SummaryValue | Value |
|---|
Long-Term Fixed Income | 91.7% | Short-Term Investments | 4.7% | Bank Loans | 2.3% | Registered Investments Companies | 1.1% | Preferred Stock | 0.2% | Common Stock< | 0.1% |
|
|
| Credit Ratings Selection [Text Block] |
Bond Quality Ratings
|
|
| C000003616 |
|
|
| Shareholder Report [Line Items] |
|
|
| Fund Name |
Thrivent High Yield Fund
|
|
| Class Name |
S
|
|
| Trading Symbol |
LBHIX
|
|
| Annual or Semi-Annual Statement [Text Block] |
This semi-annual shareholder report contains important information about the Thrivent High Yield Fund (the Fund) for the six months ended April 30, 2026.
|
|
| Shareholder Report Annual or Semi-Annual |
Semi-Annual Shareholder Report
|
|
| Additional Information Phone Number |
800-847-4836
|
|
| Additional Information Website |
www.thriventmutualfunds.com/prospectus
|
|
| Expenses Paid, Amount |
$ 28
|
|
| Expense Ratio, Percent |
0.55%
|
[10] |
| AssetsNet |
$ 815,594,265
|
|
| Holdings Count | Holding |
676
|
|
| Advisory Fees Paid, Amount |
$ 1,449,555
|
|
| InvestmentCompanyPortfolioTurnover |
17.00%
|
|
| Additional Fund Statistics [Text Block] |
Fund Statistics
|
|
| Holdings [Text Block] |
Table SummaryiShares Broad USD High Yield Corporate Bond ETF | 1.0% |
|---|
Venture Global LNG, Inc. | 0.6% |
|---|
DIRECTV Financing, LLC/DIRECTV Financing Co-Obligor, Inc. | 0.5% |
|---|
Cloud Software Group, Inc. | 0.5% |
|---|
Vistra Corporation | 0.5% |
|---|
TerraForm Power Operating, LLC | 0.5% |
|---|
CCO Holdings, LLC/CCO Holdings Capital Corporation | 0.5% |
|---|
1261229 B.C., Ltd. | 0.5% |
|---|
Tenet Healthcare Corporation | 0.4% |
|---|
Marriott Ownership Resorts, Inc. | 0.4% |
|---|
Table SummaryConsumer Cyclical | 16.6% |
|---|
Communications Services | 13.1% |
|---|
Financials | 12.4% |
|---|
Consumer Non-Cyclical | 11.2% |
|---|
Energy | 11.0% |
|---|
Capital Goods | 10.3% |
|---|
Technology | 8.6% |
|---|
Basic Materials | 5.4% |
|---|
Utilities | 3.4% |
|---|
Transportation | 1.9% |
|---|
Table SummaryValue | Value |
|---|
ETFs/Closed-End Funds | 1.1 | Non-Rated | 0.3 | D | 0.0 | C | 0.0 | CA | 0.1 | CAA | 8.9 | B | 47.3 | BA | 39.9 | BAA | 2.3 | A | 0.1 | AA | 0.0 | AAA | 0.0 | U.S. Gov't Guaranteed | 0.0 | Table SummaryValue | Value |
|---|
Long-Term Fixed Income | 91.7% | Short-Term Investments | 4.7% | Bank Loans | 2.3% | Registered Investments Companies | 1.1% | Preferred Stock | 0.2% | Common Stock< | 0.1% |
|
|
| Credit Ratings Selection [Text Block] |
Bond Quality Ratings
|
|
| C000198645 |
|
|
| Shareholder Report [Line Items] |
|
|
| Fund Name |
Thrivent High Yield Municipal Bond Fund
|
|
| Class Name |
S
|
|
| Trading Symbol |
THMBX
|
|
| Annual or Semi-Annual Statement [Text Block] |
This semi-annual shareholder report contains important information about the Thrivent High Yield Municipal Bond Fund (the Fund) for the six months ended April 30, 2026.
|
|
| Shareholder Report Annual or Semi-Annual |
Semi-Annual Shareholder Report
|
|
| Additional Information Phone Number |
800-847-4836
|
|
| Additional Information Website |
www.thriventmutualfunds.com/prospectus
|
|
| Expenses Paid, Amount |
$ 30
|
|
| Expense Ratio, Percent |
0.60%
|
[11] |
| AssetsNet |
$ 56,796,235
|
|
| Holdings Count | Holding |
252
|
|
| Advisory Fees Paid, Amount |
$ 131,468
|
|
| InvestmentCompanyPortfolioTurnover |
23.00%
|
|
| Additional Fund Statistics [Text Block] |
Fund Statistics
|
|
| Holdings [Text Block] |
Table SummaryHealth Care | 22.6% |
|---|
Education | 21.8% |
|---|
Housing | 18.1% |
|---|
Transportation | 10.0% |
|---|
Industrial Revenue | 9.7% |
|---|
Tax Revenue | 7.7% |
|---|
Utilities | 6.1% |
|---|
Local/State Government | 3.4% |
|---|
Miscellaneous | 1.8% |
|---|
Tobacco Settlement | 0.4% |
|---|
|
|
| C000003634 |
|
|
| Shareholder Report [Line Items] |
|
|
| Fund Name |
Thrivent Income Fund
|
|
| Class Name |
A
|
|
| Trading Symbol |
LUBIX
|
|
| Annual or Semi-Annual Statement [Text Block] |
This semi-annual shareholder report contains important information about the Thrivent Income Fund (the Fund) for the six months ended April 30, 2026.
|
|
| Shareholder Report Annual or Semi-Annual |
Semi-Annual Shareholder Report
|
|
| Additional Information Phone Number |
800-847-4836
|
|
| Additional Information Website |
www.thriventmutualfunds.com/prospectus
|
|
| Expenses Paid, Amount |
$ 37
|
|
| Expense Ratio, Percent |
0.75%
|
[12] |
| AssetsNet |
$ 1,290,442,879
|
|
| Holdings Count | Holding |
598
|
|
| Advisory Fees Paid, Amount |
$ 2,106,678
|
|
| InvestmentCompanyPortfolioTurnover |
34.00%
|
|
| Additional Fund Statistics [Text Block] |
Fund Statistics
|
|
| Holdings [Text Block] |
Table SummaryU.S. Treasury Notes | 1.0% |
|---|
Sprint Capital Corporation | 0.6% |
|---|
U.S. Treasury Bonds | 0.6% |
|---|
U.S. Treasury Notes | 0.6% |
|---|
U.S. Treasury Bonds | 0.5% |
|---|
Federal Home Loan Mortgage Corporation Conventional 30-Yr. Pass Through | 0.5% |
|---|
Federal Home Loan Mortgage Corporation Conventional 30-Yr. Pass Through | 0.5% |
|---|
U.S. Treasury Notes | 0.5% |
|---|
Angel Oak Mortgage Trust | 0.4% |
|---|
Bank of America Corporation | 0.4% |
|---|
Table SummaryFinancials | 35.7% |
|---|
Utilities | 9.8% |
|---|
Consumer Non-Cyclical | 9.7% |
|---|
Technology | 8.6% |
|---|
Communications Services | 5.7% |
|---|
Energy | 5.6% |
|---|
Capital Goods | 5.4% |
|---|
Consumer Cyclical | 5.3% |
|---|
U.S. Government & Agencies | 3.9% |
|---|
Collateralized Mortgage Obligations | 3.1% |
|---|
Table SummaryValue | Value |
|---|
ETFs/Closed-End Funds | 0.0 | Non-Rated | 2.0 | D | 0.0 | C | 0.0 | CA | 0.0 | CAA | 0.0 | B | 1.0 | BA | 7.0 | BAA | 54.6 | A | 25.5 | AA | 4.3 | AAA | 0.9 | U.S. Gov't Guaranteed | 4.8 | Table SummaryValue | Value |
|---|
Long-Term Fixed Income | 98.7% | Short-Term Investments | 1.0% | Preferred Stock | 0.3% |
|
|
| Credit Ratings Selection [Text Block] |
Bond Quality Ratings
|
|
| C000003636 |
|
|
| Shareholder Report [Line Items] |
|
|
| Fund Name |
Thrivent Income Fund
|
|
| Class Name |
S
|
|
| Trading Symbol |
LBIIX
|
|
| Annual or Semi-Annual Statement [Text Block] |
This semi-annual shareholder report contains important information about the Thrivent Income Fund (the Fund) for the six months ended April 30, 2026.
|
|
| Shareholder Report Annual or Semi-Annual |
Semi-Annual Shareholder Report
|
|
| Additional Information Phone Number |
800-847-4836
|
|
| Additional Information Website |
www.thriventmutualfunds.com/prospectus
|
|
| Expenses Paid, Amount |
$ 24
|
|
| Expense Ratio, Percent |
0.48%
|
[13] |
| AssetsNet |
$ 1,290,442,879
|
|
| Holdings Count | Holding |
598
|
|
| Advisory Fees Paid, Amount |
$ 2,106,678
|
|
| InvestmentCompanyPortfolioTurnover |
34.00%
|
|
| Additional Fund Statistics [Text Block] |
Fund Statistics
|
|
| Holdings [Text Block] |
Table SummaryU.S. Treasury Notes | 1.0% |
|---|
Sprint Capital Corporation | 0.6% |
|---|
U.S. Treasury Bonds | 0.6% |
|---|
U.S. Treasury Notes | 0.6% |
|---|
U.S. Treasury Bonds | 0.5% |
|---|
Federal Home Loan Mortgage Corporation Conventional 30-Yr. Pass Through | 0.5% |
|---|
Federal Home Loan Mortgage Corporation Conventional 30-Yr. Pass Through | 0.5% |
|---|
U.S. Treasury Notes | 0.5% |
|---|
Angel Oak Mortgage Trust | 0.4% |
|---|
Bank of America Corporation | 0.4% |
|---|
Table SummaryFinancials | 35.7% |
|---|
Utilities | 9.8% |
|---|
Consumer Non-Cyclical | 9.7% |
|---|
Technology | 8.6% |
|---|
Communications Services | 5.7% |
|---|
Energy | 5.6% |
|---|
Capital Goods | 5.4% |
|---|
Consumer Cyclical | 5.3% |
|---|
U.S. Government & Agencies | 3.9% |
|---|
Collateralized Mortgage Obligations | 3.1% |
|---|
Table SummaryValue | Value |
|---|
ETFs/Closed-End Funds | 0.0 | Non-Rated | 2.0 | D | 0.0 | C | 0.0 | CA | 0.0 | CAA | 0.0 | B | 1.0 | BA | 7.0 | BAA | 54.6 | A | 25.5 | AA | 4.3 | AAA | 0.9 | U.S. Gov't Guaranteed | 4.8 | Table SummaryValue | Value |
|---|
Long-Term Fixed Income | 98.7% | Short-Term Investments | 1.0% | Preferred Stock | 0.3% |
|
|
| Credit Ratings Selection [Text Block] |
Bond Quality Ratings
|
|
| C000058555 |
|
|
| Shareholder Report [Line Items] |
|
|
| Fund Name |
Thrivent International Equity Fund
|
|
| Class Name |
A
|
|
| Trading Symbol |
TWAAX
|
|
| Annual or Semi-Annual Statement [Text Block] |
This semi-annual shareholder report contains important information about the Thrivent International Equity Fund (the Fund) for the six months ended April 30, 2026.
|
|
| Shareholder Report Annual or Semi-Annual |
Semi-Annual Shareholder Report
|
|
| Additional Information Phone Number |
800-847-4836
|
|
| Additional Information Website |
www.thriventmutualfunds.com/prospectus
|
|
| Expenses Paid, Amount |
$ 61
|
|
| Expense Ratio, Percent |
1.16%
|
[14] |
| AssetsNet |
$ 1,078,876,084
|
|
| Holdings Count | Holding |
1,348
|
|
| Advisory Fees Paid, Amount |
$ 3,309,639
|
|
| InvestmentCompanyPortfolioTurnover |
61.00%
|
|
| Additional Fund Statistics [Text Block] |
Fund Statistics
|
|
| Holdings [Text Block] |
Table SummaryTaiwan Semiconductor Manufacturing Company, Ltd. | 4.5% |
|---|
Samsung Electronics Company, Ltd. | 2.0% |
|---|
ASML Holding NV | 1.4% |
|---|
SK Hynix, Inc. | 1.4% |
|---|
Novartis AG | 1.1% |
|---|
Tencent Holdings, Ltd. | 1.0% |
|---|
ABB, Ltd. | 1.0% |
|---|
Shell plc | 0.9% |
|---|
Allianz SE | 0.9% |
|---|
BHP Group, Ltd. | 0.9% |
|---|
Table SummaryFinancials | 24.1% |
|---|
Information Technology | 17.1% |
|---|
Industrials | 14.6% |
|---|
Materials | 7.9% |
|---|
Energy | 6.1% |
|---|
Health Care | 6.0% |
|---|
Consumer Discretionary | 5.7% |
|---|
Communications Services | 4.0% |
|---|
Consumer Staples | 3.4% |
|---|
Utilities | 2.8% |
|---|
Table SummaryJapan | 13.9% |
|---|
Canada | 7.9% |
|---|
United Kingdom | 7.7% |
|---|
Taiwan | 7.6% |
|---|
South Korea | 5.7% |
|---|
Switzerland | 4.7% |
|---|
Australia | 4.3% |
|---|
France | 4.1% |
|---|
Netherlands | 4.1% |
|---|
China | 3.7% |
|---|
Other Countries | 30.0% |
|---|
Table SummaryValue | Value |
|---|
Common Stock | 93.9% | Short-Term Investments | 5.3% | Preferred Stock | 0.8% |
|
|
| C000058556 |
|
|
| Shareholder Report [Line Items] |
|
|
| Fund Name |
Thrivent International Equity Fund
|
|
| Class Name |
S
|
|
| Trading Symbol |
TWAIX
|
|
| Annual or Semi-Annual Statement [Text Block] |
This semi-annual shareholder report contains important information about the Thrivent International Equity Fund (the Fund) for the six months ended April 30, 2026.
|
|
| Shareholder Report Annual or Semi-Annual |
Semi-Annual Shareholder Report
|
|
| Additional Information Phone Number |
800-847-4836
|
|
| Additional Information Website |
www.thriventmutualfunds.com/prospectus
|
|
| Expenses Paid, Amount |
$ 42
|
|
| Expense Ratio, Percent |
0.78%
|
[15] |
| AssetsNet |
$ 1,078,876,084
|
|
| Holdings Count | Holding |
1,348
|
|
| Advisory Fees Paid, Amount |
$ 3,309,639
|
|
| InvestmentCompanyPortfolioTurnover |
61.00%
|
|
| Additional Fund Statistics [Text Block] |
Fund Statistics
|
|
| Holdings [Text Block] |
Table SummaryTaiwan Semiconductor Manufacturing Company, Ltd. | 4.5% |
|---|
Samsung Electronics Company, Ltd. | 2.0% |
|---|
ASML Holding NV | 1.4% |
|---|
SK Hynix, Inc. | 1.4% |
|---|
Novartis AG | 1.1% |
|---|
Tencent Holdings, Ltd. | 1.0% |
|---|
ABB, Ltd. | 1.0% |
|---|
Shell plc | 0.9% |
|---|
Allianz SE | 0.9% |
|---|
BHP Group, Ltd. | 0.9% |
|---|
Table SummaryFinancials | 24.1% |
|---|
Information Technology | 17.1% |
|---|
Industrials | 14.6% |
|---|
Materials | 7.9% |
|---|
Energy | 6.1% |
|---|
Health Care | 6.0% |
|---|
Consumer Discretionary | 5.7% |
|---|
Communications Services | 4.0% |
|---|
Consumer Staples | 3.4% |
|---|
Utilities | 2.8% |
|---|
Table SummaryJapan | 13.9% |
|---|
Canada | 7.9% |
|---|
United Kingdom | 7.7% |
|---|
Taiwan | 7.6% |
|---|
South Korea | 5.7% |
|---|
Switzerland | 4.7% |
|---|
Australia | 4.3% |
|---|
France | 4.1% |
|---|
Netherlands | 4.1% |
|---|
China | 3.7% |
|---|
Other Countries | 30.0% |
|---|
Table SummaryValue | Value |
|---|
Common Stock | 93.9% | Short-Term Investments | 5.3% | Preferred Stock | 0.8% |
|
|
| C000003637 |
|
|
| Shareholder Report [Line Items] |
|
|
| Fund Name |
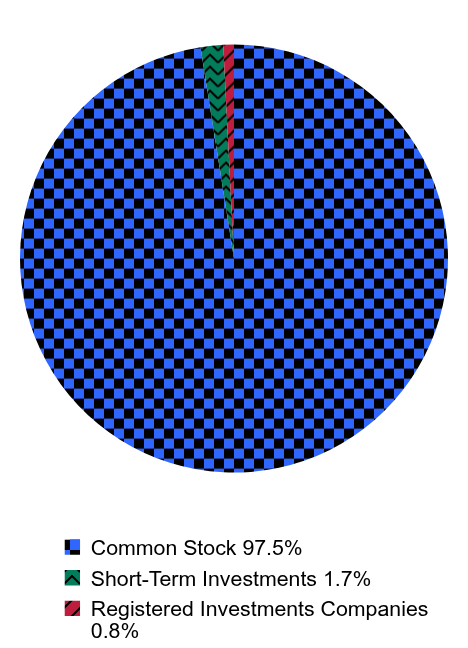
Thrivent Large Cap Growth Fund
|
|
| Class Name |
A
|
|
| Trading Symbol |
AAAGX
|
|
| Annual or Semi-Annual Statement [Text Block] |
This semi-annual shareholder report contains important information about the Thrivent Large Cap Growth Fund (the Fund) for the six months ended April 30, 2026.
|
|
| Shareholder Report Annual or Semi-Annual |
Semi-Annual Shareholder Report
|
|
| Additional Information Phone Number |
800-847-4836
|
|
| Additional Information Website |
www.thriventmutualfunds.com/prospectus
|
|
| Expenses [Text Block] |
What were the Fund's costs for the last six months?(based on a hypothetical $10,000 investment) Table SummaryShare Class | Cost of a $10k Investment | Cost Paid as a % of a $10k Investment |
|---|
Class A | $48 | 0.98%Footnote Reference** |
|---|
| Footnote | Description | Footnote** | Computed on an annualized basis for periods less than one year. |
|
|
| Expenses Paid, Amount |
$ 48
|
|
| Expense Ratio, Percent |
0.98%
|
[16] |
| AssetsNet |
$ 4,361,291,601
|
|
| Holdings Count | Holding |
44
|
|
| Advisory Fees Paid, Amount |
$ 12,809,872
|
|
| InvestmentCompanyPortfolioTurnover |
23.00%
|
|
| Additional Fund Statistics [Text Block] |
Table SummaryTotal Net Assets | # of Portfolio Holdings | Portfolio Turnover Rate | Advisory Fees Paid |
|---|
$4,361,291,601 | 44 | 23% | $12,809,872 | |
|
| Holdings [Text Block] |
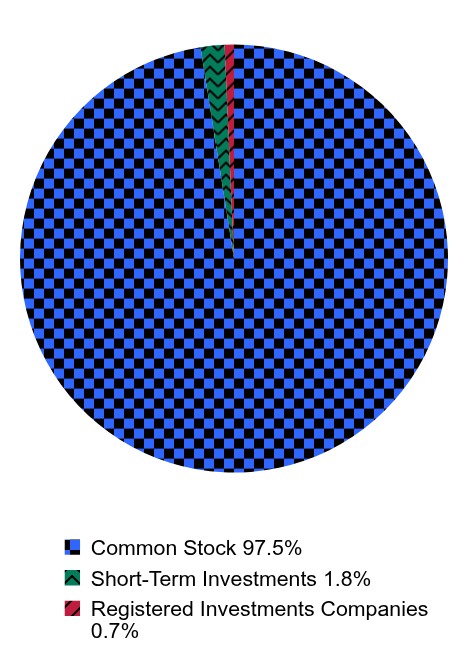
Portfolio Composition (% of Portfolio)Table SummaryValue | Value |
|---|
Common Stock | 97.5% | Short-Term Investments | 1.8% | Registered Investments Companies | 0.7% | Major Market Sectors (% of Net Assets)Table SummaryInformation Technology | 42.0% |
|---|
Communications Services | 16.4% |
|---|
Consumer Discretionary | 13.2% |
|---|
Industrials | 10.5% |
|---|
Financials | 6.8% |
|---|
Health Care | 5.7% |
|---|
Consumer Staples | 1.8% |
|---|
Utilities | 0.7% |
|---|
U.S. Unaffiliated Registered Investment Companies | 0.7% |
|---|
Energy | 0.6% |
|---|
|
|
| Largest Holdings [Text Block] |
Top Ten Holdings (% of Net Assets)Table SummaryNVIDIA Corporation | 10.9% |
|---|
Amazon.com, Inc. | 8.0% |
|---|
Microsoft Corporation | 6.1% |
|---|
Apple, Inc. | 6.0% |
|---|
Alphabet, Inc., Class A | 5.3% |
|---|
Broadcom, Inc. | 5.1% |
|---|
Alphabet, Inc., Class C | 4.6% |
|---|
Meta Platforms, Inc. | 4.1% |
|---|
Tesla, Inc. | 2.8% |
|---|
Advanced Micro Devices, Inc. | 2.5% |
|---|
|
|
| C000003639 |
|
|
| Shareholder Report [Line Items] |
|
|
| Fund Name |
Thrivent Large Cap Growth Fund
|
|
| Class Name |
S
|
|
| Trading Symbol |
THLCX
|
|
| Annual or Semi-Annual Statement [Text Block] |
This semi-annual shareholder report contains important information about the Thrivent Large Cap Growth Fund (the Fund) for the six months ended April 30, 2026.
|
|
| Shareholder Report Annual or Semi-Annual |
Semi-Annual Shareholder Report
|
|
| Additional Information Phone Number |
800-847-4836
|
|
| Additional Information Website |
www.thriventmutualfunds.com/prospectus
|
|
| Expenses [Text Block] |
What were the Fund's costs for the last six months?(based on a hypothetical $10,000 investment) Table SummaryShare Class | Cost of a $10k Investment | Cost Paid as a % of a $10k Investment |
|---|
Class S | $37 | 0.74%Footnote Reference** |
|---|
| Footnote | Description | Footnote** | Computed on an annualized basis for periods less than one year. |
|
|
| Expenses Paid, Amount |
$ 37
|
|
| Expense Ratio, Percent |
0.74%
|
[17] |
| AssetsNet |
$ 4,361,291,601
|
|
| Holdings Count | Holding |
44
|
|
| Advisory Fees Paid, Amount |
$ 12,809,872
|
|
| InvestmentCompanyPortfolioTurnover |
23.00%
|
|
| Additional Fund Statistics [Text Block] |
Table SummaryTotal Net Assets | # of Portfolio Holdings | Portfolio Turnover Rate | Advisory Fees Paid |
|---|
$4,361,291,601 | 44 | 23% | $12,809,872 | |
|
| Holdings [Text Block] |
Portfolio Composition (% of Portfolio)Table SummaryValue | Value |
|---|
Common Stock | 97.5% | Short-Term Investments | 1.8% | Registered Investments Companies | 0.7% | Major Market Sectors (% of Net Assets)Table SummaryInformation Technology | 42.0% |
|---|
Communications Services | 16.4% |
|---|
Consumer Discretionary | 13.2% |
|---|
Industrials | 10.5% |
|---|
Financials | 6.8% |
|---|
Health Care | 5.7% |
|---|
Consumer Staples | 1.8% |
|---|
Utilities | 0.7% |
|---|
U.S. Unaffiliated Registered Investment Companies | 0.7% |
|---|
Energy | 0.6% |
|---|
|
|
| Largest Holdings [Text Block] |
Top Ten Holdings (% of Net Assets)Table SummaryNVIDIA Corporation | 10.9% |
|---|
Amazon.com, Inc. | 8.0% |
|---|
Microsoft Corporation | 6.1% |
|---|
Apple, Inc. | 6.0% |
|---|
Alphabet, Inc., Class A | 5.3% |
|---|
Broadcom, Inc. | 5.1% |
|---|
Alphabet, Inc., Class C | 4.6% |
|---|
Meta Platforms, Inc. | 4.1% |
|---|
Tesla, Inc. | 2.8% |
|---|
Advanced Micro Devices, Inc. | 2.5% |
|---|
|
|
| C000003645 |
|
|
| Shareholder Report [Line Items] |
|
|
| Fund Name |
Thrivent Large Cap Value Fund
|
|
| Class Name |
A
|
|
| Trading Symbol |
AAUTX
|
|
| Annual or Semi-Annual Statement [Text Block] |
This semi-annual shareholder report contains important information about the Thrivent Large Cap Value Fund (the Fund) for the six months ended April 30, 2026.
|
|
| Shareholder Report Annual or Semi-Annual |
Semi-Annual Shareholder Report
|
|
| Additional Information Phone Number |
800-847-4836
|
|
| Additional Information Website |
www.thriventmutualfunds.com/prospectus
|
|
| Expenses [Text Block] |
What were the Fund's costs for the last six months?(based on a hypothetical $10,000 investment) Table SummaryShare Class | Cost of a $10k Investment | Cost Paid as a % of a $10k Investment |
|---|
Class A | $43 | 0.82%Footnote Reference** |
|---|
| Footnote | Description | Footnote** | Computed on an annualized basis for periods less than one year. |
|
|
| Expenses Paid, Amount |
$ 43
|
|
| Expense Ratio, Percent |
0.82%
|
[18] |
| AssetsNet |
$ 3,532,248,025
|
|
| Holdings Count | Holding |
81
|
|
| Advisory Fees Paid, Amount |
$ 7,280,532
|
|
| InvestmentCompanyPortfolioTurnover |
15.00%
|
|
| Additional Fund Statistics [Text Block] |
Table SummaryTotal Net Assets | # of Portfolio Holdings | Portfolio Turnover Rate | Advisory Fees Paid |
|---|
$3,532,248,025 | 81 | 15% | $7,280,532 | |
|
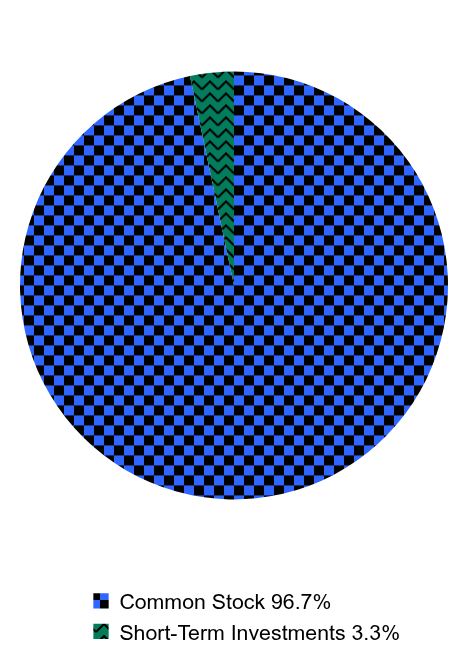
| Holdings [Text Block] |
Portfolio Composition (% of Portfolio)Table SummaryValue | Value |
|---|
Common Stock | 96.7% | Short-Term Investments | 3.3% | Major Market Sectors (% of Net Assets)Table SummaryFinancials | 17.5% |
|---|
Information Technology | 14.7% |
|---|
Industrials | 12.3% |
|---|
Health Care | 11.7% |
|---|
Energy | 8.8% |
|---|
Consumer Discretionary | 6.8% |
|---|
Communications Services | 6.6% |
|---|
Utilities | 6.3% |
|---|
Materials | 4.4% |
|---|
Consumer Staples | 4.4% |
|---|
|
|
| Largest Holdings [Text Block] |
Top Ten Holdings (% of Net Assets)Table SummarySamsung Electronics Company, Ltd. | 3.2% |
|---|
Microsoft Corporation | 3.1% |
|---|
Exxon Mobil Corporation | 2.9% |
|---|
Wells Fargo & Company | 2.6% |
|---|
Bank of America Corporation | 2.5% |
|---|
Alphabet, Inc., Class C | 2.3% |
|---|
Cisco Systems, Inc. | 2.2% |
|---|
Qualcomm, Inc. | 2.1% |
|---|
Merck & Company, Inc. | 2.1% |
|---|
Amazon.com, Inc. | 2.1% |
|---|
|
|
| C000003647 |
|
|
| Shareholder Report [Line Items] |
|
|
| Fund Name |
Thrivent Large Cap Value Fund
|
|
| Class Name |
S
|
|
| Trading Symbol |
TLVIX
|
|
| Annual or Semi-Annual Statement [Text Block] |
This semi-annual shareholder report contains important information about the Thrivent Large Cap Value Fund (the Fund) for the six months ended April 30, 2026.
|
|
| Shareholder Report Annual or Semi-Annual |
Semi-Annual Shareholder Report
|
|
| Additional Information Phone Number |
800-847-4836
|
|
| Additional Information Website |
www.thriventmutualfunds.com/prospectus
|
|
| Expenses [Text Block] |
What were the Fund's costs for the last six months?(based on a hypothetical $10,000 investment) Table SummaryShare Class | Cost of a $10k Investment | Cost Paid as a % of a $10k Investment |
|---|
Class S | $30 | 0.57%Footnote Reference** |
|---|
| Footnote | Description | Footnote** | Computed on an annualized basis for periods less than one year. |
|
|
| Expenses Paid, Amount |
$ 30
|
|
| Expense Ratio, Percent |
0.57%
|
[19] |
| AssetsNet |
$ 3,532,248,025
|
|
| Holdings Count | Holding |
81
|
|
| Advisory Fees Paid, Amount |
$ 7,280,532
|
|
| InvestmentCompanyPortfolioTurnover |
15.00%
|
|
| Additional Fund Statistics [Text Block] |
Table SummaryTotal Net Assets | # of Portfolio Holdings | Portfolio Turnover Rate | Advisory Fees Paid |
|---|
$3,532,248,025 | 81 | 15% | $7,280,532 | |
|
| Holdings [Text Block] |
Portfolio Composition (% of Portfolio)Table SummaryValue | Value |
|---|
Common Stock | 96.7% | Short-Term Investments | 3.3% | Major Market Sectors (% of Net Assets)Table SummaryFinancials | 17.5% |
|---|
Information Technology | 14.7% |
|---|
Industrials | 12.3% |
|---|
Health Care | 11.7% |
|---|
Energy | 8.8% |
|---|
Consumer Discretionary | 6.8% |
|---|
Communications Services | 6.6% |
|---|
Utilities | 6.3% |
|---|
Materials | 4.4% |
|---|
Consumer Staples | 4.4% |
|---|
|
|
| Largest Holdings [Text Block] |
Top Ten Holdings (% of Net Assets)Table SummarySamsung Electronics Company, Ltd. | 3.2% |
|---|
Microsoft Corporation | 3.1% |
|---|
Exxon Mobil Corporation | 2.9% |
|---|
Wells Fargo & Company | 2.6% |
|---|
Bank of America Corporation | 2.5% |
|---|
Alphabet, Inc., Class C | 2.3% |
|---|
Cisco Systems, Inc. | 2.2% |
|---|
Qualcomm, Inc. | 2.1% |
|---|
Merck & Company, Inc. | 2.1% |
|---|
Amazon.com, Inc. | 2.1% |
|---|
|
|
| C000217755 |
|
|
| Shareholder Report [Line Items] |
|
|
| Fund Name |
Thrivent Mid Cap Growth Fund
|
|
| Class Name |
S
|
|
| Trading Symbol |
TMCGX
|
|
| Annual or Semi-Annual Statement [Text Block] |
This semi-annual shareholder report contains important information about the Thrivent Mid Cap Growth Fund (the Fund) for the six months ended April 30, 2026.
|
|
| Shareholder Report Annual or Semi-Annual |
Semi-Annual Shareholder Report
|
|
| Additional Information Phone Number |
800-847-4836
|
|
| Additional Information Website |
www.thriventmutualfunds.com/prospectus
|
|
| Expenses [Text Block] |
What were the Fund's costs for the last six months?(based on a hypothetical $10,000 investment) Table SummaryShare Class | Cost of a $10k Investment | Cost Paid as a % of a $10k Investment |
|---|
Class S | $45 | 0.90%Footnote Reference** |
|---|
| Footnote | Description | Footnote** | Computed on an annualized basis for periods less than one year. |
|
|
| Expenses Paid, Amount |
$ 45
|
|
| Expense Ratio, Percent |
0.90%
|
[20] |
| AssetsNet |
$ 32,430,632
|
|
| Holdings Count | Holding |
75
|
|
| Advisory Fees Paid, Amount |
$ 123,315
|
|
| InvestmentCompanyPortfolioTurnover |
47.00%
|
|
| Additional Fund Statistics [Text Block] |
Table SummaryTotal Net Assets | # of Portfolio Holdings | Portfolio Turnover Rate | Advisory Fees Paid |
|---|
$32,430,632 | 75 | 47% | $123,315 | |
|
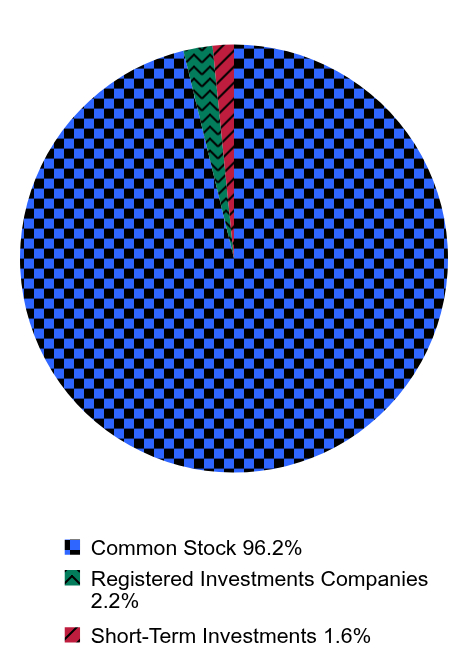
| Holdings [Text Block] |
Portfolio Composition (% of Portfolio)Table SummaryValue | Value |
|---|
Common Stock | 96.2% | Registered Investments Companies | 2.2% | Short-Term Investments | 1.6% | Major Market Sectors (% of Net Assets)Table SummaryIndustrials | 26.6% |
|---|
Information Technology | 24.5% |
|---|
Consumer Discretionary | 15.0% |
|---|
Health Care | 12.2% |
|---|
Financials | 7.3% |
|---|
Consumer Staples | 3.1% |
|---|
U.S. Unaffiliated Registered Investment Companies | 2.2% |
|---|
Energy | 2.0% |
|---|
Utilities | 1.5% |
|---|
Real Estate | 1.5% |
|---|
|
|
| Largest Holdings [Text Block] |
Top Ten Holdings (% of Net Assets)Table SummaryMonolithic Power Systems, Inc. | 4.2% |
|---|
Vertiv Holdings Company | 2.7% |
|---|
IDEXX Laboratories, Inc. | 2.3% |
|---|
Hilton Worldwide Holdings, Inc. | 2.3% |
|---|
Howmet Aerospace, Inc. | 2.3% |
|---|
Quanta Services, Inc. | 2.2% |
|---|
EMCOR Group, Inc. | 2.2% |
|---|
Amphenol Corporation | 1.8% |
|---|
Casey's General Stores, Inc. | 1.8% |
|---|
Arista Networks, Inc. | 1.7% |
|---|
|
|
| C000003596 |
|
|
| Shareholder Report [Line Items] |
|
|
| Fund Name |
Thrivent Mid Cap Stock Fund
|
|
| Class Name |
A
|
|
| Trading Symbol |
AASCX
|
|
| Annual or Semi-Annual Statement [Text Block] |
This semi-annual shareholder report contains important information about the Thrivent Mid Cap Stock Fund (the Fund) for the six months ended April 30, 2026.
|
|
| Shareholder Report Annual or Semi-Annual |
Semi-Annual Shareholder Report
|
|
| Additional Information Phone Number |
800-847-4836
|
|
| Additional Information Website |
www.thriventmutualfunds.com/prospectus
|
|
| Expenses [Text Block] |
What were the Fund's costs for the last six months?(based on a hypothetical $10,000 investment) Table SummaryShare Class | Cost of a $10k Investment | Cost Paid as a % of a $10k Investment |
|---|
Class A | $52 | 0.98%Footnote Reference** |
|---|
| Footnote | Description | Footnote** | Computed on an annualized basis for periods less than one year. |
|
|
| Expenses Paid, Amount |
$ 52
|
|
| Expense Ratio, Percent |
0.98%
|
[21] |
| AssetsNet |
$ 3,008,604,514
|
|
| Holdings Count | Holding |
67
|
|
| Advisory Fees Paid, Amount |
$ 9,086,546
|
|
| InvestmentCompanyPortfolioTurnover |
34.00%
|
|
| Additional Fund Statistics [Text Block] |
Table SummaryTotal Net Assets | # of Portfolio Holdings | Portfolio Turnover Rate | Advisory Fees Paid |
|---|
$3,008,604,514 | 67 | 34% | $9,086,546 | |
|
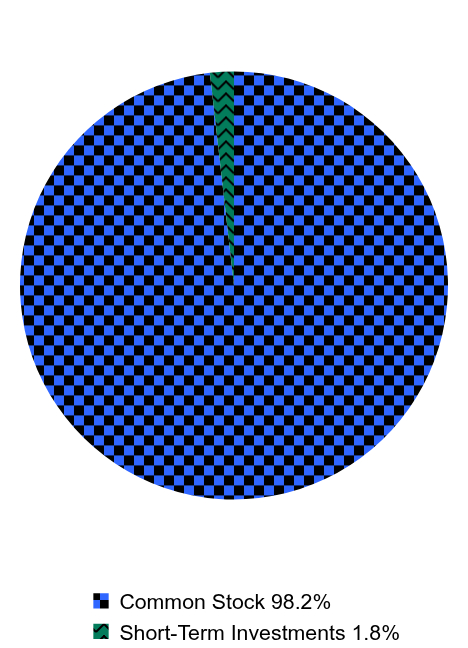
| Holdings [Text Block] |
Portfolio Composition (% of Portfolio)Table SummaryValue | Value |
|---|
Common Stock | 98.2% | Short-Term Investments | 1.8% | Major Market Sectors (% of Net Assets)Table SummaryIndustrials | 24.4% |
|---|
Information Technology | 16.4% |
|---|
Financials | 13.5% |
|---|
Consumer Discretionary | 10.6% |
|---|
Health Care | 10.0% |
|---|
Materials | 5.3% |
|---|
Real Estate | 4.7% |
|---|
Energy | 4.6% |
|---|
Utilities | 4.2% |
|---|
Consumer Staples | 2.5% |
|---|
|
|
| Largest Holdings [Text Block] |
Top Ten Holdings (% of Net Assets)Table SummarySteel Dynamics, Inc. | 3.2% |
|---|
Nokia Oyj ADR | 2.8% |
|---|
Onto Innovation, Inc. | 2.5% |
|---|
First Industrial Realty Trust, Inc. | 2.4% |
|---|
Monolithic Power Systems, Inc. | 2.3% |
|---|
M&T Bank Corporation | 2.2% |
|---|
Howmet Aerospace, Inc. | 2.2% |
|---|
Arch Capital Group, Ltd. | 2.1% |
|---|
Quanta Services, Inc. | 2.1% |
|---|
Devon Energy Corporation | 1.9% |
|---|
|
|
| C000003598 |
|
|
| Shareholder Report [Line Items] |
|
|
| Fund Name |
Thrivent Mid Cap Stock Fund
|
|
| Class Name |
S
|
|
| Trading Symbol |
TMSIX
|
|
| Annual or Semi-Annual Statement [Text Block] |
This semi-annual shareholder report contains important information about the Thrivent Mid Cap Stock Fund (the Fund) for the six months ended April 30, 2026.
|
|
| Shareholder Report Annual or Semi-Annual |
Semi-Annual Shareholder Report
|
|
| Additional Information Phone Number |
800-847-4836
|
|
| Additional Information Website |
www.thriventmutualfunds.com/prospectus
|
|
| Expenses [Text Block] |
What were the Fund's costs for the last six months?(based on a hypothetical $10,000 investment) Table SummaryShare Class | Cost of a $10k Investment | Cost Paid as a % of a $10k Investment |
|---|
Class S | $40 | 0.76%Footnote Reference** |
|---|
| Footnote | Description | Footnote** | Computed on an annualized basis for periods less than one year. |
|
|
| Expenses Paid, Amount |
$ 40
|
|
| Expense Ratio, Percent |
0.76%
|
[22] |
| AssetsNet |
$ 3,008,604,514
|
|
| Holdings Count | Holding |
67
|
|
| Advisory Fees Paid, Amount |
$ 9,086,546
|
|
| InvestmentCompanyPortfolioTurnover |
34.00%
|
|
| Additional Fund Statistics [Text Block] |
Table SummaryTotal Net Assets | # of Portfolio Holdings | Portfolio Turnover Rate | Advisory Fees Paid |
|---|
$3,008,604,514 | 67 | 34% | $9,086,546 | |
|
| Holdings [Text Block] |
Portfolio Composition (% of Portfolio)Table SummaryValue | Value |
|---|
Common Stock | 98.2% | Short-Term Investments | 1.8% | Major Market Sectors (% of Net Assets)Table SummaryIndustrials | 24.4% |
|---|
Information Technology | 16.4% |
|---|
Financials | 13.5% |
|---|
Consumer Discretionary | 10.6% |
|---|
Health Care | 10.0% |
|---|
Materials | 5.3% |
|---|
Real Estate | 4.7% |
|---|
Energy | 4.6% |
|---|
Utilities | 4.2% |
|---|
Consumer Staples | 2.5% |
|---|
|
|
| Largest Holdings [Text Block] |
Top Ten Holdings (% of Net Assets)Table SummarySteel Dynamics, Inc. | 3.2% |
|---|
Nokia Oyj ADR | 2.8% |
|---|
Onto Innovation, Inc. | 2.5% |
|---|
First Industrial Realty Trust, Inc. | 2.4% |
|---|
Monolithic Power Systems, Inc. | 2.3% |
|---|
M&T Bank Corporation | 2.2% |
|---|
Howmet Aerospace, Inc. | 2.2% |
|---|
Arch Capital Group, Ltd. | 2.1% |
|---|
Quanta Services, Inc. | 2.1% |
|---|
Devon Energy Corporation | 1.9% |
|---|
|
|
| C000003599 |
|
|
| Shareholder Report [Line Items] |
|
|
| Fund Name |
Thrivent Moderate Allocation Fund
|
|
| Class Name |
A
|
|
| Trading Symbol |
THMAX
|
|
| Annual or Semi-Annual Statement [Text Block] |
This semi-annual shareholder report contains important information about the Thrivent Moderate Allocation Fund (the Fund) for the six months ended April 30, 2026.
|
|
| Shareholder Report Annual or Semi-Annual |
Semi-Annual Shareholder Report
|
|
| Additional Information Phone Number |
800-847-4836
|
|
| Additional Information Website |
www.thriventmutualfunds.com/prospectus
|
|
| Expenses [Text Block] |
What were the Fund's costs for the last six months?(based on a hypothetical $10,000 investment) Table SummaryShare Class | Cost of a $10k Investment | Cost Paid as a % of a $10k Investment |
|---|
Class A | $38 | 0.76%Footnote Reference** |
|---|
| Footnote | Description | Footnote** | Computed on an annualized basis for periods less than one year. |
|
|
| Expenses Paid, Amount |
$ 38
|
|
| Expense Ratio, Percent |
0.76%
|
[23] |
| AssetsNet |
$ 4,366,134,331
|
|
| Holdings Count | Holding |
1,274
|
|
| Advisory Fees Paid, Amount |
$ 8,655,787
|
|
| InvestmentCompanyPortfolioTurnover |
25.00%
|
|
| Additional Fund Statistics [Text Block] |
Table SummaryTotal Net Assets | # of Portfolio Holdings | Portfolio Turnover Rate | Advisory Fees Paid |
|---|
$4,366,134,331 | 1,274 | 25% | $8,655,787 | |
|
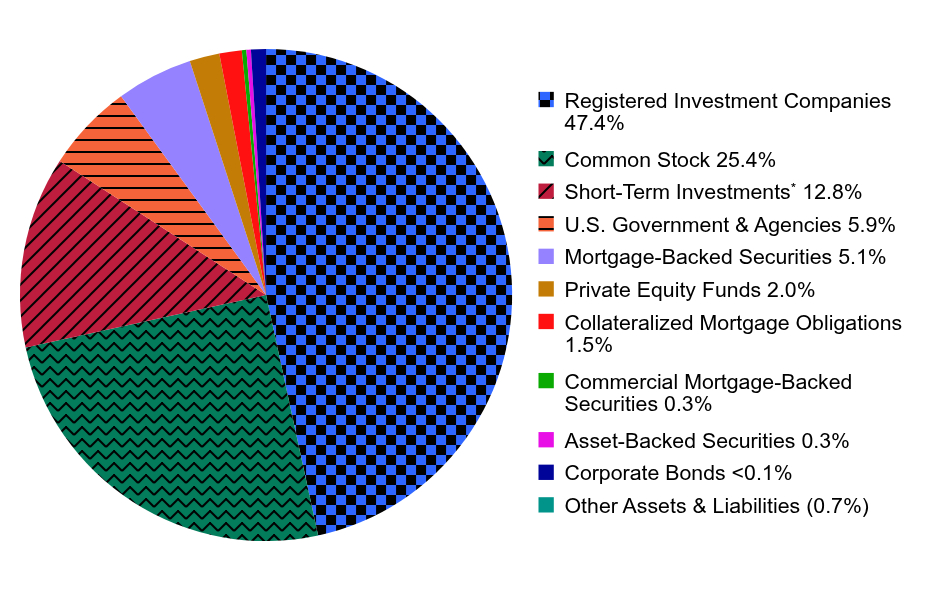
| Holdings [Text Block] |
Portfolio Composition (% of Net Assets)Table SummaryValue | Value |
|---|
Registered Investment Companies | 47.4% | Common Stock | 25.4% | Short-Term InvestmentsFootnote Reference* | 12.8% | U.S. Government & Agencies | 5.9% | Mortgage-Backed Securities | 5.1% | Private Equity Funds | 2.0% | Collateralized Mortgage Obligations | 1.5% | Commercial Mortgage-Backed Securities | 0.3% | Asset-Backed Securities | 0.3% | Corporate Bonds | | Other Assets & Liabilities | (0.7%) | * A portion of Short-Term Investments are equitized through the use of derivatives held by this Fund. A complete listing of derivatives held by the Fund can be found on the Fund's Schedule of Investments. |
|
| Largest Holdings [Text Block] |
Top Ten Holdings (% of Net Assets)Table SummaryThrivent Large Cap Growth Fund, Class S | 11.3% |
|---|
Thrivent Large Cap Value Fund, Class S | 10.6% |
|---|
Thrivent International Equity Fund, Class S | 4.7% |
|---|
Thrivent Core Investment Grade Corporate Bond Fund | 3.4% |
|---|
Thrivent Income Fund, Class S | 2.9% |
|---|
Thrivent Global Stock Fund, Class S | 2.6% |
|---|
Thrivent Mid Cap Stock Fund, Class S | 2.4% |
|---|
Thrivent Core High Yield Bond Fund | 2.0% |
|---|
Thrivent Short-Term Bond Fund, Class S | 1.7% |
|---|
Thrivent Core Emerging Markets Debt Fund | 1.4% |
|---|
|
|
| C000003600 |
|
|
| Shareholder Report [Line Items] |
|
|
| Fund Name |
Thrivent Moderate Allocation Fund
|
|
| Class Name |
S
|
|
| Trading Symbol |
TMAIX
|
|
| Annual or Semi-Annual Statement [Text Block] |
This semi-annual shareholder report contains important information about the Thrivent Moderate Allocation Fund (the Fund) for the six months ended April 30, 2026.
|
|
| Shareholder Report Annual or Semi-Annual |
Semi-Annual Shareholder Report
|
|
| Additional Information Phone Number |
800-847-4836
|
|
| Additional Information Website |
www.thriventmutualfunds.com/prospectus
|
|
| Expenses [Text Block] |
What were the Fund's costs for the last six months?(based on a hypothetical $10,000 investment) Table SummaryShare Class | Cost of a $10k Investment | Cost Paid as a % of a $10k Investment |
|---|
Class S | $27 | 0.53%Footnote Reference** |
|---|
| Footnote | Description | Footnote** | Computed on an annualized basis for periods less than one year. |
|
|
| Expenses Paid, Amount |
$ 27
|
|
| Expense Ratio, Percent |
0.53%
|
[24] |
| AssetsNet |
$ 4,366,134,331
|
|
| Holdings Count | Holding |
1,274
|
|
| Advisory Fees Paid, Amount |
$ 8,655,787
|
|
| InvestmentCompanyPortfolioTurnover |
25.00%
|
|
| Additional Fund Statistics [Text Block] |
Table SummaryTotal Net Assets | # of Portfolio Holdings | Portfolio Turnover Rate | Advisory Fees Paid |
|---|
$4,366,134,331 | 1,274 | 25% | $8,655,787 | |
|
| Holdings [Text Block] |
Portfolio Composition (% of Net Assets)Table SummaryValue | Value |
|---|
Registered Investment Companies | 47.4% | Common Stock | 25.4% | Short-Term InvestmentsFootnote Reference* | 12.8% | U.S. Government & Agencies | 5.9% | Mortgage-Backed Securities | 5.1% | Private Equity Funds | 2.0% | Collateralized Mortgage Obligations | 1.5% | Commercial Mortgage-Backed Securities | 0.3% | Asset-Backed Securities | 0.3% | Corporate Bonds | | Other Assets & Liabilities | (0.7%) | * A portion of Short-Term Investments are equitized through the use of derivatives held by this Fund. A complete listing of derivatives held by the Fund can be found on the Fund's Schedule of Investments. |
|
| Largest Holdings [Text Block] |
Top Ten Holdings (% of Net Assets)Table SummaryThrivent Large Cap Growth Fund, Class S | 11.3% |
|---|
Thrivent Large Cap Value Fund, Class S | 10.6% |
|---|
Thrivent International Equity Fund, Class S | 4.7% |
|---|
Thrivent Core Investment Grade Corporate Bond Fund | 3.4% |
|---|
Thrivent Income Fund, Class S | 2.9% |
|---|
Thrivent Global Stock Fund, Class S | 2.6% |
|---|
Thrivent Mid Cap Stock Fund, Class S | 2.4% |
|---|
Thrivent Core High Yield Bond Fund | 2.0% |
|---|
Thrivent Short-Term Bond Fund, Class S | 1.7% |
|---|
Thrivent Core Emerging Markets Debt Fund | 1.4% |
|---|
|
|
| C000003601 |
|
|
| Shareholder Report [Line Items] |
|
|
| Fund Name |
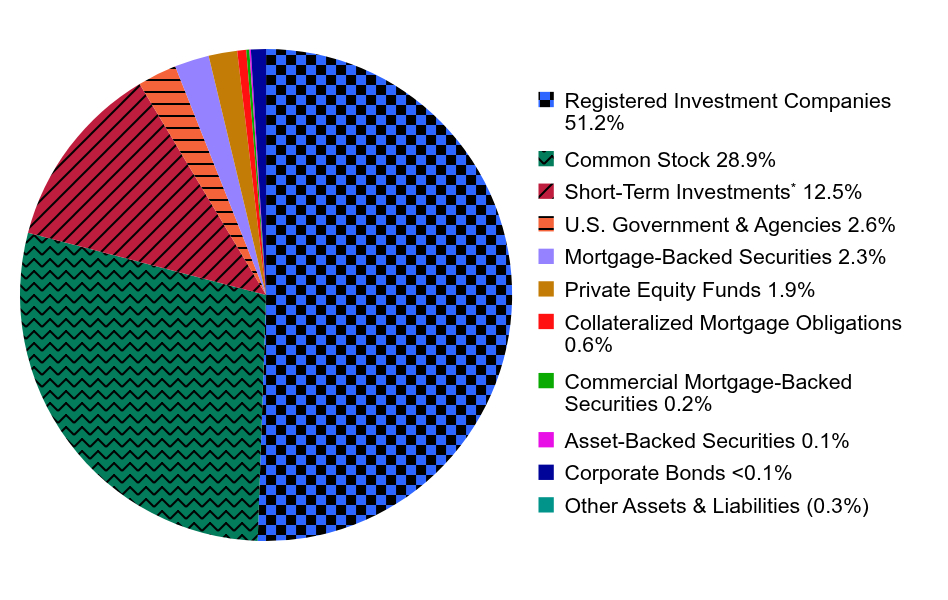
Thrivent Moderately Aggressive Allocation Fund
|
|
| Class Name |
A
|
|
| Trading Symbol |
TMAAX
|
|
| Annual or Semi-Annual Statement [Text Block] |
This semi-annual shareholder report contains important information about the Thrivent Moderately Aggressive Allocation Fund (the Fund) for the six months ended April 30, 2026.
|
|
| Shareholder Report Annual or Semi-Annual |
Semi-Annual Shareholder Report
|
|
| Additional Information Phone Number |
800-847-4836
|
|
| Additional Information Website |
www.thriventmutualfunds.com/prospectus
|
|
| Expenses [Text Block] |
What were the Fund's costs for the last six months?(based on a hypothetical $10,000 investment) Table SummaryShare Class | Cost of a $10k Investment | Cost Paid as a % of a $10k Investment |
|---|
Class A | $39 | 0.77%Footnote Reference** |
|---|
| Footnote | Description | Footnote** | Computed on an annualized basis for periods less than one year. |
|
|
| Expenses Paid, Amount |
$ 39
|
|
| Expense Ratio, Percent |
0.77%
|
[25] |
| AssetsNet |
$ 5,633,692,532
|
|
| Holdings Count | Holding |
1,271
|
|
| Advisory Fees Paid, Amount |
$ 11,453,297
|
|
| InvestmentCompanyPortfolioTurnover |
18.00%
|
|
| Additional Fund Statistics [Text Block] |
Table SummaryTotal Net Assets | # of Portfolio Holdings | Portfolio Turnover Rate | Advisory Fees Paid |
|---|
$5,633,692,532 | 1,271 | 18% | $11,453,297 | |
|
| Holdings [Text Block] |
Portfolio Composition (% of Net Assets)Table SummaryValue | Value |
|---|
Registered Investment Companies | 51.2% | Common Stock | 28.9% | Short-Term InvestmentsFootnote Reference* | 12.5% | U.S. Government & Agencies | 2.6% | Mortgage-Backed Securities | 2.3% | Private Equity Funds | 1.9% | Collateralized Mortgage Obligations | 0.6% | Commercial Mortgage-Backed Securities | 0.2% | Asset-Backed Securities | 0.1% | Corporate Bonds | | Other Assets & Liabilities | (0.3%) | * A portion of Short-Term Investments are equitized through the use of derivatives held by this Fund. A complete listing of derivatives held by the Fund can be found on the Fund's Schedule of Investments. |
|
| Largest Holdings [Text Block] |
Top Ten Holdings (% of Net Assets)Table SummaryThrivent Large Cap Growth Fund, Class S | 11.1% |
|---|
Thrivent Large Cap Value Fund, Class S | 9.7% |
|---|
Thrivent International Equity Fund, Class S | 7.3% |
|---|
Thrivent Global Stock Fund, Class S | 5.2% |
|---|
Thrivent Mid Cap Stock Fund, Class S | 3.8% |
|---|
Thrivent Core International Equity Fund | 3.3% |
|---|
Thrivent Core Emerging Markets Equity Fund | 2.0% |
|---|
Thrivent Small Cap Stock Fund, Class S | 1.6% |
|---|
Thrivent Core Investment Grade Corporate Bond Fund | 1.5% |
|---|
Thrivent Income Fund, Class S | 1.3% |
|---|
|
|
| C000003602 |
|
|
| Shareholder Report [Line Items] |
|
|
| Fund Name |
Thrivent Moderately Aggressive Allocation Fund
|
|
| Class Name |
S
|
|
| Trading Symbol |
TMAFX
|
|
| Annual or Semi-Annual Statement [Text Block] |
This semi-annual shareholder report contains important information about the Thrivent Moderately Aggressive Allocation Fund (the Fund) for the six months ended April 30, 2026.
|
|
| Shareholder Report Annual or Semi-Annual |
Semi-Annual Shareholder Report
|
|
| Additional Information Phone Number |
800-847-4836
|
|
| Additional Information Website |
www.thriventmutualfunds.com/prospectus
|
|
| Expenses [Text Block] |
What were the Fund's costs for the last six months?(based on a hypothetical $10,000 investment) Table SummaryShare Class | Cost of a $10k Investment | Cost Paid as a % of a $10k Investment |
|---|
Class S | $28 | 0.55%Footnote Reference** |
|---|
| Footnote | Description | Footnote** | Computed on an annualized basis for periods less than one year. |
|
|
| Expenses Paid, Amount |
$ 28
|
|
| Expense Ratio, Percent |
0.55%
|
[26] |
| AssetsNet |
$ 5,633,692,532
|
|
| Holdings Count | Holding |
1,271
|
|
| Advisory Fees Paid, Amount |
$ 11,453,297
|
|
| InvestmentCompanyPortfolioTurnover |
18.00%
|
|
| Additional Fund Statistics [Text Block] |
Table SummaryTotal Net Assets | # of Portfolio Holdings | Portfolio Turnover Rate | Advisory Fees Paid |
|---|
$5,633,692,532 | 1,271 | 18% | $11,453,297 | |
|
| Holdings [Text Block] |
Portfolio Composition (% of Net Assets)Table SummaryValue | Value |
|---|
Registered Investment Companies | 51.2% | Common Stock | 28.9% | Short-Term InvestmentsFootnote Reference* | 12.5% | U.S. Government & Agencies | 2.6% | Mortgage-Backed Securities | 2.3% | Private Equity Funds | 1.9% | Collateralized Mortgage Obligations | 0.6% | Commercial Mortgage-Backed Securities | 0.2% | Asset-Backed Securities | 0.1% | Corporate Bonds | | Other Assets & Liabilities | (0.3%) | * A portion of Short-Term Investments are equitized through the use of derivatives held by this Fund. A complete listing of derivatives held by the Fund can be found on the Fund's Schedule of Investments. |
|
| Largest Holdings [Text Block] |
Top Ten Holdings (% of Net Assets)Table SummaryThrivent Large Cap Growth Fund, Class S | 11.1% |
|---|
Thrivent Large Cap Value Fund, Class S | 9.7% |
|---|
Thrivent International Equity Fund, Class S | 7.3% |
|---|
Thrivent Global Stock Fund, Class S | 5.2% |
|---|
Thrivent Mid Cap Stock Fund, Class S | 3.8% |
|---|
Thrivent Core International Equity Fund | 3.3% |
|---|
Thrivent Core Emerging Markets Equity Fund | 2.0% |
|---|
Thrivent Small Cap Stock Fund, Class S | 1.6% |
|---|
Thrivent Core Investment Grade Corporate Bond Fund | 1.5% |
|---|
Thrivent Income Fund, Class S | 1.3% |
|---|
|
|
| C000003603 |
|
|
| Shareholder Report [Line Items] |
|
|
| Fund Name |
Thrivent Moderately Conservative Allocation Fund
|
|
| Class Name |
A
|
|
| Trading Symbol |
TCAAX
|
|
| Annual or Semi-Annual Statement [Text Block] |
This semi-annual shareholder report contains important information about the Thrivent Moderately Conservative Allocation Fund (the Fund) for the six months ended April 30, 2026.
|
|
| Shareholder Report Annual or Semi-Annual |
Semi-Annual Shareholder Report
|
|
| Additional Information Phone Number |
800-847-4836
|
|
| Additional Information Website |
www.thriventmutualfunds.com/prospectus
|
|
| Expenses [Text Block] |
What were the Fund's costs for the last six months?(based on a hypothetical $10,000 investment) Table SummaryShare Class | Cost of a $10k Investment | Cost Paid as a % of a $10k Investment |
|---|
Class A | $40 | 0.80%Footnote Reference** |
|---|
| Footnote | Description | Footnote** | Computed on an annualized basis for periods less than one year. |
|
|
| Expenses Paid, Amount |
$ 40
|
|
| Expense Ratio, Percent |
0.80%
|
[27] |
| AssetsNet |
$ 1,213,326,884
|
|
| Holdings Count | Holding |
1,269
|
|
| Advisory Fees Paid, Amount |
$ 2,513,476
|
|
| InvestmentCompanyPortfolioTurnover |
25.00%
|
|
| Additional Fund Statistics [Text Block] |
Table SummaryTotal Net Assets | # of Portfolio Holdings | Portfolio Turnover Rate | Advisory Fees Paid |
|---|
$1,213,326,884 | 1,269 | 25% | $2,513,476 | |
|
| Holdings [Text Block] |
Portfolio Composition (% of Net Assets)Table SummaryValue | Value |
|---|
Registered Investment Companies | 50.8% | Common Stock | 12.8% | Short-Term InvestmentsFootnote Reference* | 12.2% | U.S. Government & Agencies | 10.8% | Mortgage-Backed Securities | 9.4% | Collateralized Mortgage Obligations | 2.7% | Private Equity Funds | 1.3% | Commercial Mortgage-Backed Securities | 0.7% | Asset-Backed Securities | 0.6% | Corporate Bonds | | Other Assets & Liabilities | (1.3%) | * A portion of Short-Term Investments are equitized through the use of derivatives held by this Fund. A complete listing of derivatives held by the Fund can be found on the Fund's Schedule of Investments. |
|
| Largest Holdings [Text Block] |
Top Ten Holdings (% of Net Assets)Table SummaryThrivent Large Cap Value Fund, Class S | 12.0% |
|---|
Thrivent Large Cap Growth Fund, Class S | 7.2% |
|---|
Thrivent Core Investment Grade Corporate Bond Fund | 6.2% |
|---|
Thrivent Income Fund, Class S | 5.4% |
|---|
Thrivent Core High Yield Bond Fund | 3.6% |
|---|
Thrivent Short-Term Bond Fund, Class S | 3.1% |
|---|
Thrivent International Equity Fund, Class S | 2.9% |
|---|
Thrivent Core Emerging Markets Debt Fund | 2.6% |
|---|
U.S. Treasury Notes | 2.2% |
|---|
Thrivent High Yield Fund, Class S | 2.1% |
|---|
|
|
| C000003604 |
|
|
| Shareholder Report [Line Items] |
|
|
| Fund Name |
Thrivent Moderately Conservative Allocation Fund
|
|
| Class Name |
S
|
|
| Trading Symbol |
TCAIX
|
|
| Annual or Semi-Annual Statement [Text Block] |
This semi-annual shareholder report contains important information about the Thrivent Moderately Conservative Allocation Fund (the Fund) for the six months ended April 30, 2026.
|
|
| Shareholder Report Annual or Semi-Annual |
Semi-Annual Shareholder Report
|
|
| Additional Information Phone Number |
800-847-4836
|
|
| Additional Information Website |
www.thriventmutualfunds.com/prospectus
|
|
| Expenses [Text Block] |
What were the Fund's costs for the last six months?(based on a hypothetical $10,000 investment) Table SummaryShare Class | Cost of a $10k Investment | Cost Paid as a % of a $10k Investment |
|---|
Class S | $28 | 0.56%Footnote Reference** |
|---|
| Footnote | Description | Footnote** | Computed on an annualized basis for periods less than one year. |
|
|
| Expenses Paid, Amount |
$ 28
|
|
| Expense Ratio, Percent |
0.56%
|
[28] |
| AssetsNet |
$ 1,213,326,884
|
|
| Holdings Count | Holding |
1,269
|
|
| Advisory Fees Paid, Amount |
$ 2,513,476
|
|
| InvestmentCompanyPortfolioTurnover |
25.00%
|
|
| Additional Fund Statistics [Text Block] |
Table SummaryTotal Net Assets | # of Portfolio Holdings | Portfolio Turnover Rate | Advisory Fees Paid |
|---|
$1,213,326,884 | 1,269 | 25% | $2,513,476 | |
|
| Holdings [Text Block] |
Portfolio Composition (% of Net Assets)Table SummaryValue | Value |
|---|
Registered Investment Companies | 50.8% | Common Stock | 12.8% | Short-Term InvestmentsFootnote Reference* | 12.2% | U.S. Government & Agencies | 10.8% | Mortgage-Backed Securities | 9.4% | Collateralized Mortgage Obligations | 2.7% | Private Equity Funds | 1.3% | Commercial Mortgage-Backed Securities | 0.7% | Asset-Backed Securities | 0.6% | Corporate Bonds | | Other Assets & Liabilities | (1.3%) | * A portion of Short-Term Investments are equitized through the use of derivatives held by this Fund. A complete listing of derivatives held by the Fund can be found on the Fund's Schedule of Investments. |
|
| Largest Holdings [Text Block] |
Top Ten Holdings (% of Net Assets)Table SummaryThrivent Large Cap Value Fund, Class S | 12.0% |
|---|
Thrivent Large Cap Growth Fund, Class S | 7.2% |
|---|
Thrivent Core Investment Grade Corporate Bond Fund | 6.2% |
|---|
Thrivent Income Fund, Class S | 5.4% |
|---|
Thrivent Core High Yield Bond Fund | 3.6% |
|---|
Thrivent Short-Term Bond Fund, Class S | 3.1% |
|---|
Thrivent International Equity Fund, Class S | 2.9% |
|---|
Thrivent Core Emerging Markets Debt Fund | 2.6% |
|---|
U.S. Treasury Notes | 2.2% |
|---|
Thrivent High Yield Fund, Class S | 2.1% |
|---|
|
|
| C000003605 |
|
|
| Shareholder Report [Line Items] |
|
|
| Fund Name |
Thrivent Money Market Fund
|
|
| Class Name |
A
|
|
| Trading Symbol |
AMMXX
|
|
| Annual or Semi-Annual Statement [Text Block] |
This semi-annual shareholder report contains important information about the Thrivent Money Market Fund (the Fund) for the six months ended April 30, 2026.
|
|
| Shareholder Report Annual or Semi-Annual |
Semi-Annual Shareholder Report
|
|
| Additional Information Phone Number |
800-847-4836
|
|
| Additional Information Website |
www.thriventmutualfunds.com/prospectus
|
|
| Expenses Paid, Amount |
$ 15
|
|
| Expense Ratio, Percent |
0.31%
|
[29] |
| AssetsNet |
$ 3,330,195,265
|
|
| Holdings Count | Holding |
185
|
|
| Advisory Fees Paid, Amount |
$ 3,655,836
|
|
| Additional Fund Statistics [Text Block] |
Fund Statistics
|
|
| Holdings [Text Block] |
Table SummaryValue | Value |
|---|
U.S. Government Agency Debt (if categorized as coupon-paying notes) | 45.8% | U.S. Treasury Debt | 28.7% | U.S. Government Agency Debt (if categorized as no-coupon discount notes) | 17.1% | U.S. Treasury Repurchase Agreement, if collateralized only by U.S. Treasuries (including Strips) and cash | 7.1% | Investment Company | 1.3% |
|
|
| C000003607 |
|
|
| Shareholder Report [Line Items] |
|
|
| Fund Name |
Thrivent Money Market Fund
|
|
| Class Name |
S
|
|
| Trading Symbol |
AALXX
|
|
| Annual or Semi-Annual Statement [Text Block] |
This semi-annual shareholder report contains important information about the Thrivent Money Market Fund (the Fund) for the six months ended April 30, 2026.
|
|
| Shareholder Report Annual or Semi-Annual |
Semi-Annual Shareholder Report
|
|
| Additional Information Phone Number |
800-847-4836
|
|
| Additional Information Website |
www.thriventmutualfunds.com/prospectus
|
|
| Expenses Paid, Amount |
$ 16
|
|
| Expense Ratio, Percent |
0.33%
|
[30] |
| AssetsNet |
$ 3,330,195,265
|
|
| Holdings Count | Holding |
185
|
|
| Advisory Fees Paid, Amount |
$ 3,655,836
|
|
| Additional Fund Statistics [Text Block] |
Fund Statistics
|
|
| Holdings [Text Block] |
Table SummaryValue | Value |
|---|
U.S. Government Agency Debt (if categorized as coupon-paying notes) | 45.8% | U.S. Treasury Debt | 28.7% | U.S. Government Agency Debt (if categorized as no-coupon discount notes) | 17.1% | U.S. Treasury Repurchase Agreement, if collateralized only by U.S. Treasuries (including Strips) and cash | 7.1% | Investment Company | 1.3% |
|
|
| C000002058 |
|
|
| Shareholder Report [Line Items] |
|
|
| Fund Name |
Thrivent Multisector Bond Fund
|
|
| Class Name |
A
|
|
| Trading Symbol |
AAINX
|
|
| Annual or Semi-Annual Statement [Text Block] |
This semi-annual shareholder report contains important information about the Thrivent Multisector Bond Fund (the Fund) for the six months ended April 30, 2026.
|
|
| Shareholder Report Annual or Semi-Annual |
Semi-Annual Shareholder Report
|
|
| Additional Information Phone Number |
800-847-4836
|
|
| Additional Information Website |
www.thriventmutualfunds.com/prospectus
|
|
| Expenses Paid, Amount |
$ 44
|
|
| Expense Ratio, Percent |
0.88%
|
[31] |
| AssetsNet |
$ 858,234,100
|
|
| Holdings Count | Holding |
623
|
|
| Advisory Fees Paid, Amount |
$ 1,846,741
|
|
| InvestmentCompanyPortfolioTurnover |
47.00%
|
|
| Additional Fund Statistics [Text Block] |
Fund Statistics
|
|
| Holdings [Text Block] |
Table SummaryThrivent Core High Yield Bond Fund | 18.5% |
|---|
Thrivent Core Investment Grade Corporate Bond Fund | 17.7% |
|---|
Thrivent Core Emerging Markets Debt Fund | 8.1% |
|---|
U.S. Treasury Notes | 2.3% |
|---|
Federal National Mortgage Association Conventional 30-Yr. Pass Through | 1.6% |
|---|
Federal Home Loan Mortgage Corporation Conventional 30-Yr. Pass Through | 1.4% |
|---|
Federal National Mortgage Association Conventional 15-Yr. Pass Through | 0.9% |
|---|
U.S. Treasury Notes | 0.9% |
|---|
U.S. Treasury Notes | 0.8% |
|---|
U.S. Treasury Notes | 0.7% |
|---|
Table SummaryU.S. Affiliated Registered Investment Companies | 44.3% |
|---|
Collateralized Mortgage Obligations | 15.7% |
|---|
Mortgage-Backed Securities | 11.8% |
|---|
Asset-Backed Securities | 10.1% |
|---|
U.S. Government & Agencies | 6.9% |
|---|
Financials | 2.8% |
|---|
U.S. Unaffiliated Registered Investment Companies | 2.0% |
|---|
Commercial Mortgage-Backed Securities | 1.2% |
|---|
Utilities | 1.1% |
|---|
Technology | 0.9% |
|---|
Table SummaryValue | Value |
|---|
ETFs/Closed-End Funds | 2.0 | Non-Rated | 15.4 | D | 0.0 | C | 0.0 | CA | 0.1 | CAA | 1.9 | B | 9.7 | BA | 13.3 | BAA | 17.9 | A | 11.5 | AA | 8.8 | AAA | 3.6 | U.S. Gov't Guaranteed | 15.8 | Table SummaryValue | Value |
|---|
Long-Term Fixed Income | 49.1% | Registered Investments Companies | 44.5% | Short-Term Investments | 5.1% | Preferred Stock | 1.3% | Common Stock< | 0.1% |
|
|
| Credit Ratings Selection [Text Block] |
Bond Quality Ratings
|
|
| C000002059 |
|
|
| Shareholder Report [Line Items] |
|
|
| Fund Name |
Thrivent Multisector Bond Fund
|
|
| Class Name |
S
|
|
| Trading Symbol |
IIINX
|
|
| Annual or Semi-Annual Statement [Text Block] |
This semi-annual shareholder report contains important information about the Thrivent Multisector Bond Fund (the Fund) for the six months ended April 30, 2026.
|
|
| Shareholder Report Annual or Semi-Annual |
Semi-Annual Shareholder Report
|
|
| Additional Information Phone Number |
800-847-4836
|
|
| Additional Information Website |
www.thriventmutualfunds.com/prospectus
|
|
| Expenses Paid, Amount |
$ 32
|
|
| Expense Ratio, Percent |
0.64%
|
[32] |
| AssetsNet |
$ 858,234,100
|
|
| Holdings Count | Holding |
623
|
|
| Advisory Fees Paid, Amount |
$ 1,846,741
|
|
| InvestmentCompanyPortfolioTurnover |
47.00%
|
|
| Additional Fund Statistics [Text Block] |
Fund Statistics
|
|
| Holdings [Text Block] |
Table SummaryThrivent Core High Yield Bond Fund | 18.5% |
|---|
Thrivent Core Investment Grade Corporate Bond Fund | 17.7% |
|---|
Thrivent Core Emerging Markets Debt Fund | 8.1% |
|---|
U.S. Treasury Notes | 2.3% |
|---|
Federal National Mortgage Association Conventional 30-Yr. Pass Through | 1.6% |
|---|
Federal Home Loan Mortgage Corporation Conventional 30-Yr. Pass Through | 1.4% |
|---|
Federal National Mortgage Association Conventional 15-Yr. Pass Through | 0.9% |
|---|
U.S. Treasury Notes | 0.9% |
|---|
U.S. Treasury Notes | 0.8% |
|---|
U.S. Treasury Notes | 0.7% |
|---|
Table SummaryU.S. Affiliated Registered Investment Companies | 44.3% |
|---|
Collateralized Mortgage Obligations | 15.7% |
|---|
Mortgage-Backed Securities | 11.8% |
|---|
Asset-Backed Securities | 10.1% |
|---|
U.S. Government & Agencies | 6.9% |
|---|
Financials | 2.8% |
|---|
U.S. Unaffiliated Registered Investment Companies | 2.0% |
|---|
Commercial Mortgage-Backed Securities | 1.2% |
|---|
Utilities | 1.1% |
|---|
Technology | 0.9% |
|---|
Table SummaryValue | Value |
|---|
ETFs/Closed-End Funds | 2.0 | Non-Rated | 15.4 | D | 0.0 | C | 0.0 | CA | 0.1 | CAA | 1.9 | B | 9.7 | BA | 13.3 | BAA | 17.9 | A | 11.5 | AA | 8.8 | AAA | 3.6 | U.S. Gov't Guaranteed | 15.8 | Table SummaryValue | Value |
|---|
Long-Term Fixed Income | 49.1% | Registered Investments Companies | 44.5% | Short-Term Investments | 5.1% | Preferred Stock | 1.3% | Common Stock< | 0.1% |
|
|
| Credit Ratings Selection [Text Block] |
Bond Quality Ratings
|
|
| C000003608 |
|
|
| Shareholder Report [Line Items] |
|
|
| Fund Name |
Thrivent Municipal Bond Fund
|
|
| Class Name |
A
|
|
| Trading Symbol |
AAMBX
|
|
| Annual or Semi-Annual Statement [Text Block] |
This semi-annual shareholder report contains important information about the Thrivent Municipal Bond Fund (the Fund) for the six months ended April 30, 2026.
|
|
| Shareholder Report Annual or Semi-Annual |
Semi-Annual Shareholder Report
|
|
| Additional Information Phone Number |
800-847-4836
|
|
| Additional Information Website |
www.thriventmutualfunds.com/prospectus
|
|
| Expenses Paid, Amount |
$ 38
|
|
| Expense Ratio, Percent |
0.76%
|
[33] |
| AssetsNet |
$ 1,132,699,142
|
|
| Holdings Count | Holding |
527
|
|
| Advisory Fees Paid, Amount |
$ 2,352,457
|
|
| InvestmentCompanyPortfolioTurnover |
13.00%
|
|
| Additional Fund Statistics [Text Block] |
Fund Statistics
|
|
| Holdings [Text Block] |
Table SummaryTransportation | 22.2% |
|---|
Health Care | 20.5% |
|---|
Education | 20.1% |
|---|
Tax Revenue | 12.1% |
|---|
Utilities | 10.3% |
|---|
Industrial Revenue | 5.9% |
|---|
Housing | 2.9% |
|---|
Local/State Government | 2.2% |
|---|
Pre-refunded | 1.2% |
|---|
Miscellaneous | 1.2% |
|---|
|
|
| C000003610 |
|
|
| Shareholder Report [Line Items] |
|
|
| Fund Name |
Thrivent Municipal Bond Fund
|
|
| Class Name |
S
|
|
| Trading Symbol |
TMBIX
|
|
| Annual or Semi-Annual Statement [Text Block] |
This semi-annual shareholder report contains important information about the Thrivent Municipal Bond Fund (the Fund) for the six months ended April 30, 2026.
|
|
| Shareholder Report Annual or Semi-Annual |
Semi-Annual Shareholder Report
|
|
| Additional Information Phone Number |
800-847-4836
|
|
| Additional Information Website |
www.thriventmutualfunds.com/prospectus
|
|
| Expenses Paid, Amount |
$ 25
|
|
| Expense Ratio, Percent |
0.50%
|
[34] |
| AssetsNet |
$ 1,132,699,142
|
|
| Holdings Count | Holding |
527
|
|
| Advisory Fees Paid, Amount |
$ 2,352,457
|
|
| InvestmentCompanyPortfolioTurnover |
13.00%
|
|
| Additional Fund Statistics [Text Block] |
Fund Statistics
|
|
| Holdings [Text Block] |
Table SummaryTransportation | 22.2% |
|---|
Health Care | 20.5% |
|---|
Education | 20.1% |
|---|
Tax Revenue | 12.1% |
|---|
Utilities | 10.3% |
|---|
Industrial Revenue | 5.9% |
|---|
Housing | 2.9% |
|---|
Local/State Government | 2.2% |
|---|
Pre-refunded | 1.2% |
|---|
Miscellaneous | 1.2% |
|---|
|
|
| C000003648 |
|
|
| Shareholder Report [Line Items] |
|
|
| Fund Name |
Thrivent Short-Term Bond Fund
|
|
| Class Name |
A
|
|
| Trading Symbol |
LBLAX
|
|
| Annual or Semi-Annual Statement [Text Block] |
This semi-annual shareholder report contains important information about the Thrivent Short-Term Bond Fund (the Fund) for the six months ended April 30, 2026.
|
|
| Shareholder Report Annual or Semi-Annual |
Semi-Annual Shareholder Report
|
|
| Additional Information Phone Number |
800-847-4836
|
|
| Additional Information Website |
www.thriventmutualfunds.com/prospectus
|
|
| Expenses Paid, Amount |
$ 29
|
|
| Expense Ratio, Percent |
0.58%
|
[35] |
| AssetsNet |
$ 1,138,599,909
|
|
| Holdings Count | Holding |
563
|
|
| Advisory Fees Paid, Amount |
$ 1,618,655
|
|
| InvestmentCompanyPortfolioTurnover |
43.00%
|
|
| Additional Fund Statistics [Text Block] |
Fund Statistics
|
|
| Holdings [Text Block] |
Table SummaryU.S. Treasury Notes | 2.9% |
|---|
Avis Budget Rental Car Funding AESOP, LLC | 0.6% |
|---|
PPM CLO 2, Ltd. | 0.5% |
|---|
AMSR Trust | 0.5% |
|---|
Tricon Residential Trust | 0.5% |
|---|
Madison Park Funding XXXIX, Ltd. | 0.5% |
|---|
CarVal CLO III, Ltd. | 0.5% |
|---|
Morgan Stanley Residential Mortgage Loan Trust | 0.5% |
|---|
Palmer Square Loan Funding, Ltd. | 0.4% |
|---|
Palmer Square Loan Funding, Ltd. | 0.4% |
|---|
Table SummaryFinancials | 34.1% |
|---|
Collateralized Mortgage Obligations | 15.7% |
|---|
Asset-Backed Securities | 12.5% |
|---|
Consumer Non-Cyclical | 5.8% |
|---|
Consumer Cyclical | 5.7% |
|---|
Technology | 5.6% |
|---|
Utilities | 3.7% |
|---|
U.S. Government & Agencies | 3.4% |
|---|
Energy | 3.3% |
|---|
Commercial Mortgage-Backed Securities | 2.6% |
|---|
Table SummaryValue | Value |
|---|
ETFs/Closed-End Funds | 0.0 | Non-Rated | 12.3 | D | 0.0 | C | 0.0 | CA | 0.0 | CAA | 0.1 | B | 0.3 | BA | 4.2 | BAA | 38.8 | A | 20.3 | AA | 8.1 | AAA | 12.6 | U.S. Gov't Guaranteed | 3.4 | Table SummaryValue | Value |
|---|
Long-Term Fixed Income | 99.5% | Short-Term Investments | 0.4% | Preferred Stock | 0.1% |
|
|
| Credit Ratings Selection [Text Block] |
Bond Quality Ratings
|
|
| C000003650 |
|
|
| Shareholder Report [Line Items] |
|
|
| Fund Name |
Thrivent Short-Term Bond Fund
|
|
| Class Name |
S
|
|
| Trading Symbol |
THLIX
|
|
| Annual or Semi-Annual Statement [Text Block] |
This semi-annual shareholder report contains important information about the Thrivent Short-Term Bond Fund (the Fund) for the six months ended April 30, 2026.
|
|
| Shareholder Report Annual or Semi-Annual |
Semi-Annual Shareholder Report
|
|
| Additional Information Phone Number |
800-847-4836
|
|
| Additional Information Website |
www.thriventmutualfunds.com/prospectus
|
|
| Expenses Paid, Amount |
$ 22
|
|
| Expense Ratio, Percent |
0.43%
|
[36] |
| AssetsNet |
$ 1,138,599,909
|
|
| Holdings Count | Holding |
563
|
|
| Advisory Fees Paid, Amount |
$ 1,618,655
|
|
| InvestmentCompanyPortfolioTurnover |
43.00%
|
|
| Additional Fund Statistics [Text Block] |
Fund Statistics
|
|
| Holdings [Text Block] |
Table SummaryU.S. Treasury Notes | 2.9% |
|---|
Avis Budget Rental Car Funding AESOP, LLC | 0.6% |
|---|
PPM CLO 2, Ltd. | 0.5% |
|---|
AMSR Trust | 0.5% |
|---|
Tricon Residential Trust | 0.5% |
|---|
Madison Park Funding XXXIX, Ltd. | 0.5% |
|---|
CarVal CLO III, Ltd. | 0.5% |
|---|
Morgan Stanley Residential Mortgage Loan Trust | 0.5% |
|---|
Palmer Square Loan Funding, Ltd. | 0.4% |
|---|
Palmer Square Loan Funding, Ltd. | 0.4% |
|---|
Table SummaryFinancials | 34.1% |
|---|
Collateralized Mortgage Obligations | 15.7% |
|---|
Asset-Backed Securities | 12.5% |
|---|
Consumer Non-Cyclical | 5.8% |
|---|
Consumer Cyclical | 5.7% |
|---|
Technology | 5.6% |
|---|
Utilities | 3.7% |
|---|
U.S. Government & Agencies | 3.4% |
|---|
Energy | 3.3% |
|---|
Commercial Mortgage-Backed Securities | 2.6% |
|---|
Table SummaryValue | Value |
|---|
ETFs/Closed-End Funds | 0.0 | Non-Rated | 12.3 | D | 0.0 | C | 0.0 | CA | 0.0 | CAA | 0.1 | B | 0.3 | BA | 4.2 | BAA | 38.8 | A | 20.3 | AA | 8.1 | AAA | 12.6 | U.S. Gov't Guaranteed | 3.4 | Table SummaryValue | Value |
|---|
Long-Term Fixed Income | 99.5% | Short-Term Investments | 0.4% | Preferred Stock | 0.1% |
|
|
| Credit Ratings Selection [Text Block] |
Bond Quality Ratings
|
|
| C000198646 |
|
|
| Shareholder Report [Line Items] |
|
|
| Fund Name |
Thrivent Small Cap Growth Fund
|
|
| Class Name |
S
|
|
| Trading Symbol |
TSCGX
|
|
| Annual or Semi-Annual Statement [Text Block] |
This semi-annual shareholder report contains important information about the Thrivent Small Cap Growth Fund (the Fund) for the six months ended April 30, 2026.
|
|
| Shareholder Report Annual or Semi-Annual |
Semi-Annual Shareholder Report
|
|
| Additional Information Phone Number |
800-847-4836
|
|
| Additional Information Website |
www.thriventmutualfunds.com/prospectus
|
|
| Expenses [Text Block] |
What were the Fund's costs for the last six months?(based on a hypothetical $10,000 investment) Table SummaryShare Class | Cost of a $10k Investment | Cost Paid as a % of a $10k Investment |
|---|
Class S | $49 | 0.95%Footnote Reference** |
|---|
| Footnote | Description | Footnote** | Computed on an annualized basis for periods less than one year. |
|
|
| Expenses Paid, Amount |
$ 49
|
|
| Expense Ratio, Percent |
0.95%
|
[37] |
| AssetsNet |
$ 76,763,605
|
|
| Holdings Count | Holding |
95
|
|
| Advisory Fees Paid, Amount |
$ 327,313
|
|
| InvestmentCompanyPortfolioTurnover |
67.00%
|
|
| Additional Fund Statistics [Text Block] |
Table SummaryTotal Net Assets | # of Portfolio Holdings | Portfolio Turnover Rate | Advisory Fees Paid |
|---|
$76,763,605 | 95 | 67% | $327,313 | |
|
| Holdings [Text Block] |
Portfolio Composition (% of Portfolio)Table SummaryValue | Value |
|---|
Common Stock | 97.8% | Short-Term Investments | 2.2% | Major Market Sectors (% of Net Assets)Table SummaryIndustrials | 30.9% |
|---|
Information Technology | 22.2% |
|---|
Health Care | 17.5% |
|---|
Consumer Discretionary | 10.0% |
|---|
Financials | 6.5% |
|---|
Consumer Staples | 3.9% |
|---|
Materials | 3.4% |
|---|
Energy | 2.2% |
|---|
Utilities | 1.0% |
|---|
Real Estate | 0.8% |
|---|
|
|
| Largest Holdings [Text Block] |
Top Ten Holdings (% of Net Assets)Table SummaryJFrog, Ltd. | 2.5% |
|---|
Fabrinet | 2.1% |
|---|
Guidewire Software, Inc. | 2.1% |
|---|
BWX Technologies, Inc. | 1.9% |
|---|
Rambus, Inc. | 1.9% |
|---|
SiTime Corporation | 1.9% |
|---|
Triumph Financial, Inc. | 1.9% |
|---|
RBC Bearings, Inc. | 1.8% |
|---|
Applied Industrial Technologies, Inc. | 1.8% |
|---|
Lattice Semiconductor Corporation | 1.8% |
|---|
|
|
| C000003627 |
|
|
| Shareholder Report [Line Items] |
|
|
| Fund Name |
Thrivent Small Cap Stock Fund
|
|
| Class Name |
A
|
|
| Trading Symbol |
AASMX
|
|
| Annual or Semi-Annual Statement [Text Block] |
This semi-annual shareholder report contains important information about the Thrivent Small Cap Stock Fund (the Fund) for the six months ended April 30, 2026.
|
|
| Shareholder Report Annual or Semi-Annual |
Semi-Annual Shareholder Report
|
|
| Additional Information Phone Number |
800-847-4836
|
|
| Additional Information Website |
www.thriventmutualfunds.com/prospectus
|
|
| Expenses [Text Block] |
What were the Fund's costs for the last six months?(based on a hypothetical $10,000 investment) Table SummaryShare Class | Cost of a $10k Investment | Cost Paid as a % of a $10k Investment |
|---|
Class A | $53 | 1.00%Footnote Reference** |
|---|
| Footnote | Description | Footnote** | Computed on an annualized basis for periods less than one year. |
|
|
| Expenses Paid, Amount |
$ 53
|
|
| Expense Ratio, Percent |
1.00%
|
[38] |
| AssetsNet |
$ 2,919,248,724
|
|
| Holdings Count | Holding |
87
|
|
| Advisory Fees Paid, Amount |
$ 8,771,444
|
|
| InvestmentCompanyPortfolioTurnover |
28.00%
|
|
| Additional Fund Statistics [Text Block] |
Table SummaryTotal Net Assets | # of Portfolio Holdings | Portfolio Turnover Rate | Advisory Fees Paid |
|---|
$2,919,248,724 | 87 | 28% | $8,771,444 | |
|
| Holdings [Text Block] |
Portfolio Composition (% of Portfolio)Table SummaryValue | Value |
|---|
Common Stock | 97.5% | Short-Term Investments | 1.7% | Registered Investments Companies | 0.8% | Major Market Sectors (% of Net Assets)Table SummaryIndustrials | 20.4% |
|---|
Information Technology | 15.5% |
|---|
Financials | 14.8% |
|---|
Consumer Discretionary | 12.9% |
|---|
Health Care | 11.0% |
|---|
Materials | 6.6% |
|---|
Energy | 4.5% |
|---|
Real Estate | 3.9% |
|---|
Consumer Staples | 3.7% |
|---|
Utilities | 3.5% |
|---|
|
|
| Largest Holdings [Text Block] |
Top Ten Holdings (% of Net Assets)Table SummaryTTM Technologies, Inc. | 3.2% |
|---|
Littelfuse, Inc. | 2.3% |
|---|
SharkNinja, Inc. | 2.1% |
|---|
IES Holdings, Inc. | 1.9% |
|---|
Element Solutions, Inc. | 1.7% |
|---|
Twist Bioscience Corporation | 1.6% |
|---|
John B. Sanfilippo & Son, Inc. | 1.6% |
|---|
BWX Technologies, Inc. | 1.6% |
|---|
Plexus Corporation | 1.6% |
|---|
Terreno Realty Corporation | 1.6% |
|---|
|
|
| C000003629 |
|
|
| Shareholder Report [Line Items] |
|
|
| Fund Name |
Thrivent Small Cap Stock Fund
|
|
| Class Name |
S
|
|
| Trading Symbol |
TSCSX
|
|
| Annual or Semi-Annual Statement [Text Block] |
This semi-annual shareholder report contains important information about the Thrivent Small Cap Stock Fund (the Fund) for the six months ended April 30, 2026.
|
|
| Shareholder Report Annual or Semi-Annual |
Semi-Annual Shareholder Report
|
|
| Additional Information Phone Number |
800-847-4836
|
|
| Additional Information Website |
www.thriventmutualfunds.com/prospectus
|
|
| Expenses [Text Block] |
What were the Fund's costs for the last six months?(based on a hypothetical $10,000 investment) Table SummaryShare Class | Cost of a $10k Investment | Cost Paid as a % of a $10k Investment |
|---|
Class S | $42 | 0.80%Footnote Reference** |
|---|
| Footnote | Description | Footnote** | Computed on an annualized basis for periods less than one year. |
|
|
| Expenses Paid, Amount |
$ 42
|
|
| Expense Ratio, Percent |
0.80%
|
[39] |
| AssetsNet |
$ 2,919,248,724
|
|
| Holdings Count | Holding |
87
|
|
| Advisory Fees Paid, Amount |
$ 8,771,444
|
|
| InvestmentCompanyPortfolioTurnover |
28.00%
|
|
| Additional Fund Statistics [Text Block] |
Table SummaryTotal Net Assets | # of Portfolio Holdings | Portfolio Turnover Rate | Advisory Fees Paid |
|---|
$2,919,248,724 | 87 | 28% | $8,771,444 | |
|
| Holdings [Text Block] |
Portfolio Composition (% of Portfolio)Table SummaryValue | Value |
|---|
Common Stock | 97.5% | Short-Term Investments | 1.7% | Registered Investments Companies | 0.8% | Major Market Sectors (% of Net Assets)Table SummaryIndustrials | 20.4% |
|---|
Information Technology | 15.5% |
|---|
Financials | 14.8% |
|---|
Consumer Discretionary | 12.9% |
|---|
Health Care | 11.0% |
|---|
Materials | 6.6% |
|---|
Energy | 4.5% |
|---|
Real Estate | 3.9% |
|---|
Consumer Staples | 3.7% |
|---|
Utilities | 3.5% |
|---|
|
|
| Largest Holdings [Text Block] |
Top Ten Holdings (% of Net Assets)Table SummaryTTM Technologies, Inc. | 3.2% |
|---|
Littelfuse, Inc. | 2.3% |
|---|
SharkNinja, Inc. | 2.1% |
|---|
IES Holdings, Inc. | 1.9% |
|---|
Element Solutions, Inc. | 1.7% |
|---|
Twist Bioscience Corporation | 1.6% |
|---|
John B. Sanfilippo & Son, Inc. | 1.6% |
|---|
BWX Technologies, Inc. | 1.6% |
|---|
Plexus Corporation | 1.6% |
|---|
Terreno Realty Corporation | 1.6% |
|---|
|
|
|
|