Shareholder Report
|
6 Months Ended |
|
Apr. 30, 2026
USD ($)
Holding
|
|---|
| Shareholder Report [Line Items] |
|
|
| Document Type |
N-CSRS
|
|
| Amendment Flag |
false
|
|
| Registrant Name |
COMMERCE FUNDS
|
|
| Entity Central Index Key |
0000926243
|
|
| Entity Investment Company Type |
N-1A
|
|
| Document Period End Date |
Apr. 30, 2026
|
|
| Shareholder Report Annual or Semi-Annual |
Semi-Annual Shareholder Report
|
|
| C000027719 |
|
|
| Shareholder Report [Line Items] |
|
|
| Fund Name |
Commerce Growth Fund
|
|
| Trading Symbol |
CFGRX
|
|
| Annual or Semi-Annual Statement [Text Block] |
This Semi-Annual shareholder report contains important information about Commerce Growth Fund for the period of November 1, 2025 to April 30, 2026.
|
|
| Additional Information [Text Block] |
You can find additional information about the Fund at www.commercefunds.com. You can also request this information by contacting us at 1-800-995-6365.
|
|
| Material Fund Change Notice [Text Block] |
This report also describes changes to the Fund that occurred after the end of the reporting period.
|
|
| Additional Information Phone Number |
1-800-995-6365
|
|
| Additional Information Website |
www.commercefunds.com
|
|
| Expenses [Text Block] |
What were the Fund costs for the last six months? Semi-Annual Fund Operating Expenses (based on a hypothetical $10,000 investment)
Table Summary
Fund |
Costs of a $10,000 investment |
Costs paid as a percentage of a $10,000 investment |
Commerce Growth Fund |
$37 |
0.75%Footnote Reference* |
| Footnote |
Description |
Footnote* |
Annualized | |
|
| Expenses Paid, Amount |
$ 37
|
|
| Expense Ratio, Percent |
0.75%
|
[1] |
| Material Change Date |
Apr. 30, 2026
|
|
| AssetsNet |
$ 192,482,950
|
|
| Holdings Count | Holding |
52
|
|
| Advisory Fees Paid, Amount |
$ 402,507
|
|
| InvestmentCompanyPortfolioTurnover |
14.00%
|
|
| Additional Fund Statistics [Text Block] |
Table Summary
FUND STATISTICS |
A |
Total Net Assets |
$192,482,950 |
# of Portfolio Holdings |
52 |
Portfolio Turnover Rate |
14% |
Total Advisory Fees Paid |
$402,507 | |
|
| Holdings [Text Block] |
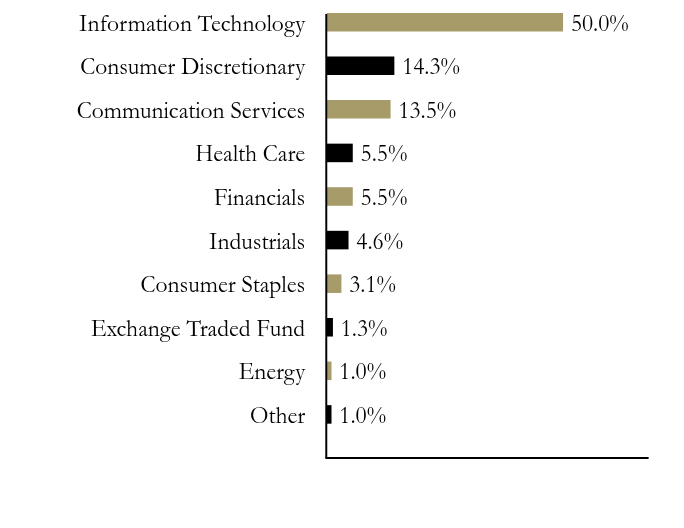
Sector Allocation (% of Total Net Assets)
Table Summary
Value |
Value |
Other |
1.0% |
Energy |
1.0% |
Exchange Traded Fund |
1.3% |
Consumer Staples |
3.1% |
Industrials |
4.6% |
Financials |
5.5% |
Health Care |
5.5% |
Communication Services |
13.5% |
Consumer Discretionary |
14.3% |
Information Technology |
50.0% | |
|
| Largest Holdings [Text Block] |
Top Ten Issuers (% of Total Net Assets)
Table Summary
NVIDIA Corp. |
13.5% |
Apple, Inc. |
11.0% |
Microsoft Corp. |
9.4% |
Alphabet, Inc., Class A |
7.0% |
Broadcom, Inc. |
5.3% |
Amazon.com, Inc. |
5.1% |
Meta Platforms, Inc., Class A |
3.1% |
Tesla, Inc. |
2.9% |
Eli Lilly & Co. |
2.0% |
Visa, Inc., Class A |
1.6% | |
|
| Material Fund Change Expenses [Text Block] |
At its May 14, 2026 meeting, the Board of Trustees of The Commerce Funds approved the permanent reduction of the Fund's contractual fee rate, as well as a new contractual expense limitation for the Fund. Effective August 1, 2026, under the new contractual fee rate, the Fund's management fee, calculated as a percentage of the Fund's average daily net assets, will be reduced to 0.30%, and the Fund's contractual expense limitation will be reduced to 0.70%.
|
|
| Updated Prospectus Phone Number |
1-800-995-6365
|
|
| Updated Prospectus Email Address |
<span style="box-sizing: border-box; color: rgb(0, 0, 0); display: inline; flex-wrap: nowrap; font-size: 12px; font-weight: 400; grid-area: auto; line-height: 18px; margin: 0px; overflow: visible; text-align: left; text-align-last: auto; white-space-collapse: preserve-breaks;">commercefunds@commercebank.com</span>
|
|
| Updated Prospectus Web Address |
https://www.commercefunds.com/literature-and-resources/prospectus-and-guide
|
|
| C000027721 |
|
|
| Shareholder Report [Line Items] |
|
|
| Fund Name |
Commerce Value Fund
|
|
| Trading Symbol |
CFVLX
|
|
| Annual or Semi-Annual Statement [Text Block] |
This Semi-Annual shareholder report contains important information about Commerce Value Fund for the period of November 1, 2025 to April 30, 2026.
|
|
| Additional Information [Text Block] |
You can find additional information about the Fund at www.commercefunds.com. You can also request this information by contacting us at 1-800-995-6365.
|
|
| Material Fund Change Notice [Text Block] |
This report also describes changes to the Fund that occurred after the end of the reporting period.
|
|
| Additional Information Phone Number |
1-800-995-6365
|
|
| Additional Information Website |
www.commercefunds.com
|
|
| Expenses [Text Block] |
What were the Fund costs for the last six months? Semi-Annual Fund Operating Expenses (based on a hypothetical $10,000 investment)
Table Summary
Fund |
Costs of a $10,000 investment |
Costs paid as a percentage of a $10,000 investment |
Commerce Value Fund |
$36 |
0.69%Footnote Reference* |
| Footnote |
Description |
Footnote* |
Annualized | |
|
| Expenses Paid, Amount |
$ 36
|
|
| Expense Ratio, Percent |
0.69%
|
[2] |
| Material Change Date |
Apr. 30, 2026
|
|
| AssetsNet |
$ 229,911,519
|
|
| Holdings Count | Holding |
58
|
|
| Advisory Fees Paid, Amount |
$ 353,323
|
|
| InvestmentCompanyPortfolioTurnover |
19.00%
|
|
| Additional Fund Statistics [Text Block] |
Table Summary
FUND STATISTICS |
A |
Total Net Assets |
$229,911,519 |
# of Portfolio Holdings |
58 |
Portfolio Turnover Rate |
19% |
Total Advisory Fees Paid |
$353,323 | |
|
| Holdings [Text Block] |
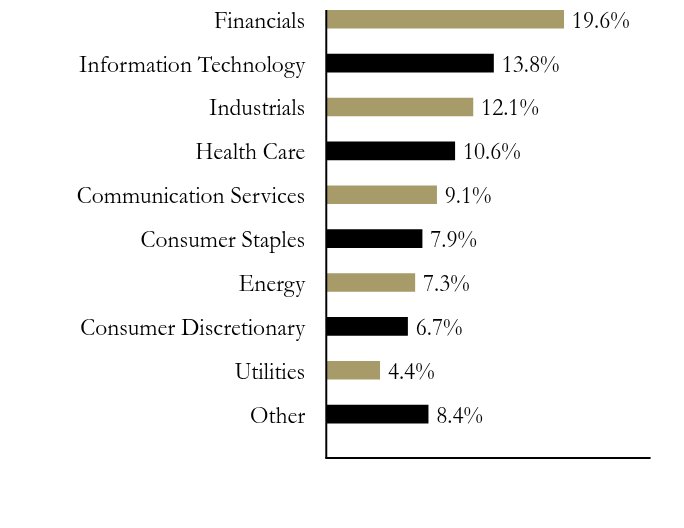
Sector Allocation (% of Total Net Assets)
Table Summary
Value |
Value |
Other |
8.4% |
Utilities |
4.4% |
Consumer Discretionary |
6.7% |
Energy |
7.3% |
Consumer Staples |
7.9% |
Communication Services |
9.1% |
Health Care |
10.6% |
Industrials |
12.1% |
Information Technology |
13.8% |
Financials |
19.6% | |
|
| Largest Holdings [Text Block] |
Top Ten Issuers (% of Total Net Assets)
Table Summary
Alphabet, Inc., Class A |
3.6% |
Texas Instruments, Inc. |
2.8% |
JPMorgan Chase & Co. |
2.4% |
Eaton Corp. PLC |
2.4% |
Morgan Stanley |
2.3% |
Cisco Systems, Inc. |
2.3% |
Berkshire Hathaway, Inc., Class B |
2.2% |
Blackrock, Inc. |
2.2% |
Bank of America Corp. |
2.1% |
Prologis, Inc. |
2.0% | |
|
| Material Fund Change Expenses [Text Block] |
At its May 14, 2026 meeting, the Board of Trustees of The Commerce Funds approved the permanent reduction of the Fund's contractual fee rate. Effective August 1, 2026, under the new contractual fee rate, the Fund's management fee, calculated as a percentage of the Fund's average daily net assets, will be reduced to 0.25%.
|
|
| Updated Prospectus Phone Number |
1-800-995-6365
|
|
| Updated Prospectus Email Address |
<span style="box-sizing: border-box; color: rgb(0, 0, 0); display: inline; flex-wrap: nowrap; font-size: 12px; font-weight: 400; grid-area: auto; line-height: 18px; margin: 0px; overflow: visible; text-align: left; text-align-last: auto; white-space-collapse: preserve-breaks;">commercefunds@commercebank.com</span>
|
|
| Updated Prospectus Web Address |
https://www.commercefunds.com/literature-and-resources/prospectus-and-guide
|
|
| C000027723 |
|
|
| Shareholder Report [Line Items] |
|
|
| Fund Name |
Commerce MidCap Growth Fund
|
|
| Trading Symbol |
CFAGX
|
|
| Annual or Semi-Annual Statement [Text Block] |
This Semi-Annual shareholder report contains important information about Commerce MidCap Growth Fund for the period of November 1, 2025 to April 30, 2026.
|
|
| Additional Information [Text Block] |
You can find additional information about the Fund at www.commercefunds.com. You can also request this information by contacting us at 1-800-995-6365.
|
|
| Material Fund Change Notice [Text Block] |
This report also describes changes to the Fund that occurred after the end of the reporting period.
|
|
| Additional Information Phone Number |
1-800-995-6365
|
|
| Additional Information Website |
www.commercefunds.com
|
|
| Expenses [Text Block] |
What were the Fund costs for the last six months? Semi-Annual Fund Operating Expenses (based on a hypothetical $10,000 investment)
Table Summary
Fund |
Costs of a $10,000 investment |
Costs paid as a percentage of a $10,000 investment |
Commerce MidCap Growth Fund |
$44 |
0.89%Footnote Reference* |
| Footnote |
Description |
Footnote* |
Annualized | |
|
| Expenses Paid, Amount |
$ 44
|
|
| Expense Ratio, Percent |
0.89%
|
[3] |
| Material Change Date |
Apr. 30, 2026
|
|
| AssetsNet |
$ 129,701,292
|
|
| Holdings Count | Holding |
76
|
|
| Advisory Fees Paid, Amount |
$ 362,430
|
|
| InvestmentCompanyPortfolioTurnover |
28.00%
|
|
| Additional Fund Statistics [Text Block] |
Table Summary
FUND STATISTICS |
A |
Total Net Assets |
$129,701,292 |
# of Portfolio Holdings |
76 |
Portfolio Turnover Rate |
28% |
Total Advisory Fees Paid |
$362,430 | |
|
| Holdings [Text Block] |
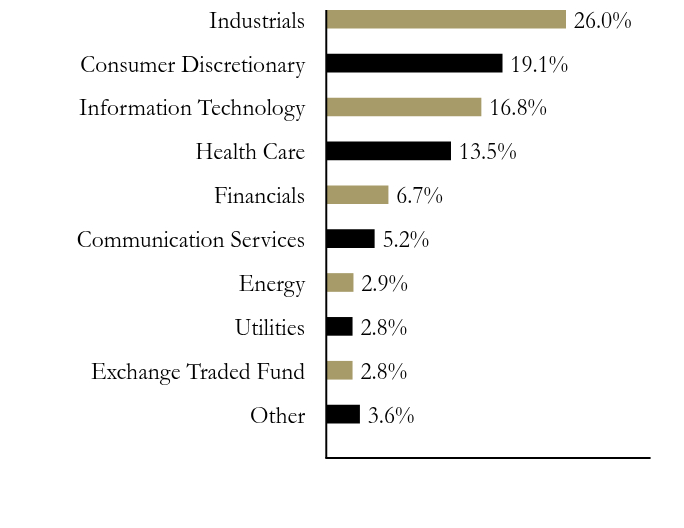
Sector Allocation (% of Total Net Assets)
Table Summary
Value |
Value |
Other |
3.6% |
Exchange Traded Fund |
2.8% |
Utilities |
2.8% |
Energy |
2.9% |
Communication Services |
5.2% |
Financials |
6.7% |
Health Care |
13.5% |
Information Technology |
16.8% |
Consumer Discretionary |
19.1% |
Industrials |
26.0% | |
|
| Largest Holdings [Text Block] |
Top Ten Issuers (% of Total Net Assets)
Table Summary
Vertiv Holdings Co., Class A |
4.0% |
Howmet Aerospace, Inc. |
3.0% |
iShares Russell Mid-Cap Growth ETF |
2.8% |
Quanta Services, Inc. |
2.5% |
Monolithic Power Systems, Inc. |
2.4% |
Hilton Worldwide Holdings, Inc. |
2.3% |
Royal Caribbean Cruises Ltd. |
2.1% |
Comfort Systems USA, Inc. |
2.0% |
Cloudflare, Inc., Class A |
1.9% |
Vistra Corp. |
1.7% | |
|
| Material Fund Change Expenses [Text Block] |
At its May 14, 2026 meeting, the Board of Trustees of The Commerce Funds approved the permanent reduction of the Fund's contractual fee rate. Effective August 1, 2026, under the new contractual fee rate, the Fund's management fee, calculated as a percentage of the Fund's average daily net assets, will be reduced to 0.30%.
|
|
| Updated Prospectus Phone Number |
1-800-995-6365
|
|
| Updated Prospectus Email Address |
<span style="box-sizing: border-box; color: rgb(0, 0, 0); display: inline; flex-wrap: nowrap; font-size: 12px; font-weight: 400; grid-area: auto; line-height: 18px; margin: 0px; overflow: visible; text-align: left; text-align-last: auto; white-space-collapse: preserve-breaks;">commercefunds@commercebank.com</span>
|
|
| Updated Prospectus Web Address |
https://www.commercefunds.com/literature-and-resources/prospectus-and-guide
|
|
| C000246257 |
|
|
| Shareholder Report [Line Items] |
|
|
| Fund Name |
Commerce MidCap Value Fund
|
|
| Trading Symbol |
CFMVX
|
|
| Annual or Semi-Annual Statement [Text Block] |
This Semi-Annual shareholder report contains important information about Commerce MidCap Value Fund for the period of November 1, 2025 to April 30, 2026.
|
|
| Additional Information [Text Block] |
You can find additional information about the Fund at www.commercefunds.com. You can also request this information by contacting us at 1-800-995-6365.
|
|
| Material Fund Change Notice [Text Block] |
This report also describes changes to the Fund that occurred after the end of the reporting period.
|
|
| Additional Information Phone Number |
1-800-995-6365
|
|
| Additional Information Website |
www.commercefunds.com
|
|
| Expenses [Text Block] |
What were the Fund costs for the last six months? Semi-Annual Fund Operating Expenses (based on a hypothetical $10,000 investment)
Table Summary
Fund |
Costs of a $10,000 investment |
Costs paid as a percentage of a $10,000 investmentFootnote Reference** |
Commerce MidCap Value Fund |
$37 |
0.70%Footnote Reference* |
| Footnote |
Description |
Footnote* |
Annualized |
Footnote** |
Reflects fee waiver and/or expense reimbursements, without which expenses would have been higher. | |
|
| Expenses Paid, Amount |
$ 37
|
|
| Expense Ratio, Percent |
0.70%
|
[4] |
| Material Change Date |
Apr. 30, 2026
|
|
| AssetsNet |
$ 38,981,055
|
|
| Holdings Count | Holding |
81
|
|
| Advisory Fees Paid, Amount |
$ 31,780
|
|
| InvestmentCompanyPortfolioTurnover |
28.00%
|
|
| Additional Fund Statistics [Text Block] |
Table Summary
FUND STATISTICS |
A |
Total Net Assets |
$38,981,055 |
# of Portfolio Holdings |
81 |
Portfolio Turnover Rate |
28% |
Total Advisory Fees Paid |
$31,780 | |
|
| Holdings [Text Block] |
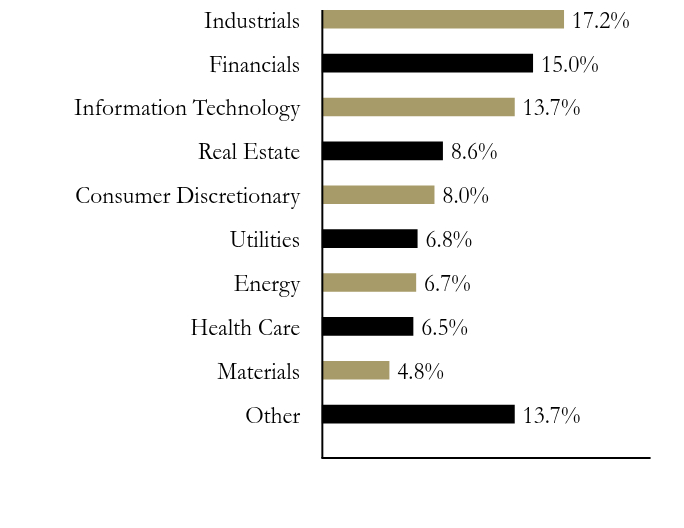
Sector Allocation (% of Total Net Assets)
Table Summary
Value |
Value |
Other |
13.7% |
Materials |
4.8% |
Health Care |
6.5% |
Energy |
6.7% |
Utilities |
6.8% |
Consumer Discretionary |
8.0% |
Real Estate |
8.6% |
Information Technology |
13.7% |
Financials |
15.0% |
Industrials |
17.2% | |
|
| Largest Holdings [Text Block] |
Top Ten Issuers (% of Total Net Assets)
Table Summary
iShares Russell Mid-Cap Value ETF |
4.0% |
Monolithic Power Systems, Inc. |
1.7% |
State Street Institutional US Government Money Market Fund, Premier Class |
1.7% |
Microchip Technology, Inc. |
1.7% |
TD SYNNEX Corp. |
1.6% |
Skyworks Solutions, Inc. |
1.5% |
Cummins, Inc. |
1.4% |
State Street Corp. |
1.4% |
Eaton Corp. PLC |
1.3% |
Littelfuse, Inc. |
1.3% | |
|
| Material Fund Change Expenses [Text Block] |
At its May 14, 2026 meeting, the Board of Trustees of The Commerce Funds approved the permanent reduction of the Fund's contractual fee rate. Effective August 1, 2026, under the new contractual fee rate, the Fund's management fee, calculated as a percentage of the Fund's average daily net assets, will be reduced to 0.30%.
|
|
| Updated Prospectus Phone Number |
1-800-995-6365
|
|
| Updated Prospectus Email Address |
<span style="box-sizing: border-box; color: rgb(0, 0, 0); display: inline; flex-wrap: nowrap; font-size: 12px; font-weight: 400; grid-area: auto; line-height: 18px; margin: 0px; overflow: visible; text-align: left; text-align-last: auto; white-space-collapse: preserve-breaks;">commercefunds@commercebank.com</span>
|
|
| Updated Prospectus Web Address |
https://www.commercefunds.com/literature-and-resources/prospectus-and-guide
|
|
| C000027729 |
|
|
| Shareholder Report [Line Items] |
|
|
| Fund Name |
Commerce Bond Fund
|
|
| Trading Symbol |
CFBNX
|
|
| Annual or Semi-Annual Statement [Text Block] |
This Semi-Annual shareholder report contains important information about Commerce Bond Fund for the period of November 1, 2025 to April 30, 2026.
|
|
| Additional Information [Text Block] |
You can find additional information about the Fund at www.commercefunds.com. You can also request this information by contacting us at 1-800-995-6365.
|
|
| Material Fund Change Notice [Text Block] |
This report also describes changes to the Fund that occurred after the end of the reporting period.
|
|
| Additional Information Phone Number |
1-800-995-6365
|
|
| Additional Information Website |
www.commercefunds.com
|
|
| Expenses [Text Block] |
What were the Fund costs for the last six months? Semi-Annual Fund Operating Expenses (based on a hypothetical $10,000 investment)
Table Summary
Fund |
Costs of a $10,000 investment |
Costs paid as a percentage of a $10,000 investment |
Commerce Bond Fund |
$31 |
0.63%Footnote Reference* |
| Footnote |
Description |
Footnote* |
Annualized | |
|
| Expenses Paid, Amount |
$ 31
|
|
| Expense Ratio, Percent |
0.63%
|
[5] |
| Material Change Date |
Apr. 30, 2026
|
|
| AssetsNet |
$ 1,226,915,792
|
|
| Holdings Count | Holding |
461
|
|
| Advisory Fees Paid, Amount |
$ 2,188,059
|
|
| InvestmentCompanyPortfolioTurnover |
5.00%
|
|
| Additional Fund Statistics [Text Block] |
Table Summary
FUND STATISTICS |
A |
Total Net Assets |
$1,226,915,792 |
# of Portfolio Holdings |
461 |
Portfolio Turnover Rate |
5% |
Total Advisory Fees Paid |
$2,188,059 | |
|
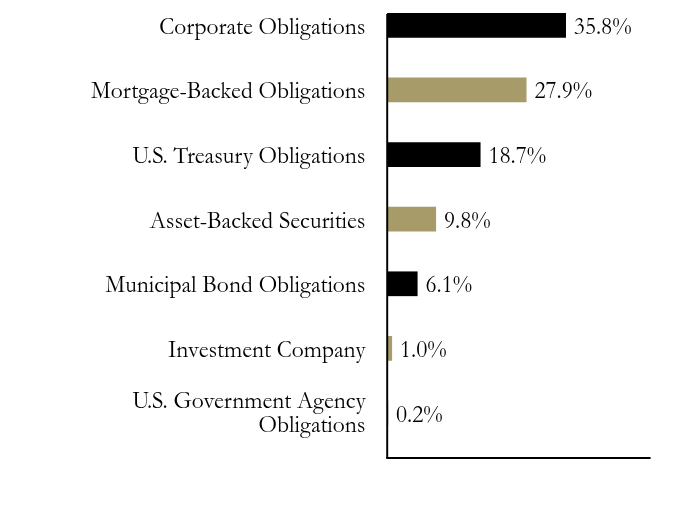
| Holdings [Text Block] |
Types of Security Allocation (% of Total Net Assets)
Table Summary
Value |
Value |
U.S. Government Agency Obligations |
0.2% |
Investment Company |
1.0% |
Municipal Bond Obligations |
6.1% |
Asset-Backed Securities |
9.8% |
U.S. Treasury Obligations |
18.7% |
Mortgage-Backed Obligations |
27.9% |
Corporate Obligations |
35.8% | Credit Rating (% of Total Net Assets)Footnote Reference*
Table Summary
AAA |
11.2% |
AA |
11.5% |
A |
21.4% |
BBB |
14.1% |
CCC |
0.2% |
U.S. Govt. |
39.1% |
Non-Rated |
2.0% |
| Footnote |
Description |
Footnote* |
For financial reporting purposes, credit quality ratings shown above reflect the highest rating assigned by either S&P Global Ratings or Moody’s Investors Service, Inc. if ratings differ. These rating agencies are independent, nationally recognized statistical rating organizations and are widely used. Investment grade ratings are credit ratings of BBB/Baa or higher. Below investment grade ratings are credit ratings of BB/Ba or lower. Investments designated Non-Rated or N/R are not rated by either rating agency. Unrated investments do not necessarily indicate low credit quality. Credit quality ratings are subject to change. | |
|
| Credit Ratings Selection [Text Block] |
For financial reporting purposes, credit quality ratings shown above reflect the highest rating assigned by either S&P Global Ratings or Moody’s Investors Service, Inc. if ratings differ. These rating agencies are independent, nationally recognized statistical rating organizations and are widely used. Investment grade ratings are credit ratings of BBB/Baa or higher. Below investment grade ratings are credit ratings of BB/Ba or lower. Investments designated Non-Rated or N/R are not rated by either rating agency. Unrated investments do not necessarily indicate low credit quality. Credit quality ratings are subject to change.
|
|
| Material Fund Change Expenses [Text Block] |
At its May 14, 2026 meeting, the Board of Trustees of The Commerce Funds approved the permanent reduction of the Fund's contractual fee rate, as well as a new contractual expense limitation for the Fund. Effective August 1, 2026, under the new contractual fee rate, the Fund's management fee, calculated as a percentage of the Fund's average daily net assets, will be reduced to 0.13%, and the Fund's contractual expense limitation will be reduced to 0.45%.
|
|
| Updated Prospectus Phone Number |
1-800-995-6365
|
|
| Updated Prospectus Email Address |
<span style="box-sizing: border-box; color: rgb(0, 0, 0); display: inline; flex-wrap: nowrap; font-size: 12px; font-weight: 400; grid-area: auto; line-height: 18px; margin: 0px; overflow: visible; text-align: left; text-align-last: auto; white-space-collapse: preserve-breaks;">commercefunds@commercebank.com</span>
|
|
| Updated Prospectus Web Address |
https://www.commercefunds.com/literature-and-resources/prospectus-and-guide
|
|
| C000027731 |
|
|
| Shareholder Report [Line Items] |
|
|
| Fund Name |
Commerce Short-Term Government Fund
|
|
| Trading Symbol |
CFSTX
|
|
| Annual or Semi-Annual Statement [Text Block] |
This Semi-Annual shareholder report contains important information about Commerce Short-Term Government Fund for the period of November 1, 2025 to April 30, 2026.
|
|
| Additional Information [Text Block] |
You can find additional information about the Fund at www.commercefunds.com. You can also request this information by contacting us at 1-800-995-6365.
|
|
| Material Fund Change Notice [Text Block] |
This report also describes changes to the Fund that occurred after the end of the reporting period.
|
|
| Additional Information Phone Number |
1-800-995-6365
|
|
| Additional Information Website |
www.commercefunds.com
|
|
| Expenses [Text Block] |
What were the Fund costs for the last six months? Semi-Annual Fund Operating Expenses (based on a hypothetical $10,000 investment)
Table Summary
Fund |
Costs of a $10,000 investment |
Costs paid as a percentage of a $10,000 investmentFootnote Reference** |
Commerce Short-Term Government Fund |
$34 |
0.68%Footnote Reference* |
| Footnote |
Description |
Footnote* |
Annualized |
Footnote** |
Reflects fee waiver and/or expense reimbursements, without which expenses would have been higher. | |
|
| Expenses Paid, Amount |
$ 34
|
|
| Expense Ratio, Percent |
0.68%
|
[6] |
| Material Change Date |
Apr. 30, 2026
|
|
| AssetsNet |
$ 27,971,279
|
|
| Holdings Count | Holding |
113
|
|
| Advisory Fees Paid, Amount |
$ 0
|
|
| InvestmentCompanyPortfolioTurnover |
6.00%
|
|
| Additional Fund Statistics [Text Block] |
Table Summary
FUND STATISTICS |
A |
Total Net Assets |
$27,971,279 |
# of Portfolio Holdings |
113 |
Portfolio Turnover Rate |
6% |
Total Advisory Fees Paid |
$0 | |
|
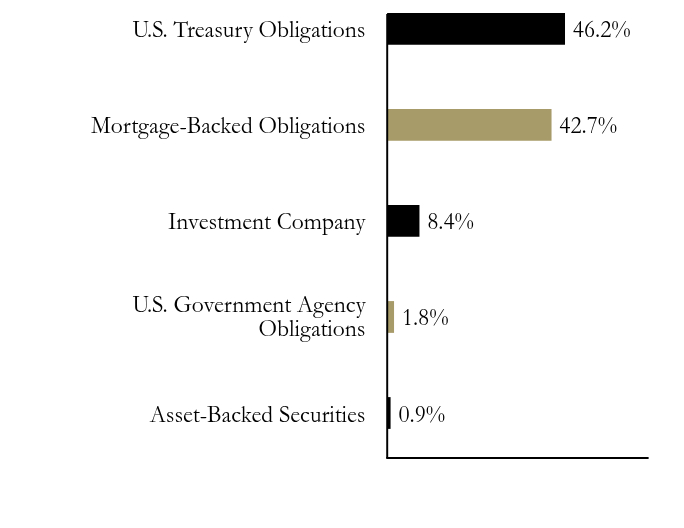
| Holdings [Text Block] |
Types of Security Allocation (% of Total Net Assets)
Table Summary
Value |
Value |
Asset-Backed Securities |
0.9% |
U.S. Government Agency Obligations |
1.8% |
Investment Company |
8.4% |
Mortgage-Backed Obligations |
42.7% |
U.S. Treasury Obligations |
46.2% | Credit Rating (% of Total Net Assets)Footnote Reference*
Table Summary
AAA |
12.9% |
AA |
2.3% |
BB |
0.6% |
U.S. Govt. |
82.9% |
Non-Rated |
1.3% |
| Footnote |
Description |
Footnote* |
For financial reporting purposes, credit quality ratings shown above reflect the highest rating assigned by either S&P Global Ratings or Moody’s Investors Service, Inc. if ratings differ. These rating agencies are independent, nationally recognized statistical rating organizations and are widely used. Investment grade ratings are credit ratings of BBB/Baa or higher. Below investment grade ratings are credit ratings of BB/Ba or lower. Investments designated Non-Rated or N/R are not rated by either rating agency. Unrated investments do not necessarily indicate low credit quality. Credit quality ratings are subject to change. | |
|
| Credit Ratings Selection [Text Block] |
For financial reporting purposes, credit quality ratings shown above reflect the highest rating assigned by either S&P Global Ratings or Moody’s Investors Service, Inc. if ratings differ. These rating agencies are independent, nationally recognized statistical rating organizations and are widely used. Investment grade ratings are credit ratings of BBB/Baa or higher. Below investment grade ratings are credit ratings of BB/Ba or lower. Investments designated Non-Rated or N/R are not rated by either rating agency. Unrated investments do not necessarily indicate low credit quality. Credit quality ratings are subject to change.
|
|
| Material Fund Change Objectives [Text Block] |
At its May 14, 2026 meeting, the Board of Trustees of The Commerce Funds approved a plan to liquidate and terminate the Fund (the "Liquidation"). The Liquidation is anticipated to occur on or about August 31, 2026.
|
|
| Updated Prospectus Phone Number |
1-800-995-6365
|
|
| Updated Prospectus Email Address |
<span style="box-sizing: border-box; color: rgb(0, 0, 0); display: inline; flex-wrap: nowrap; font-size: 12px; font-weight: 400; grid-area: auto; line-height: 18px; margin: 0px; overflow: visible; text-align: left; text-align-last: auto; white-space-collapse: preserve-breaks;">commercefunds@commercebank.com</span>
|
|
| Updated Prospectus Web Address |
https://www.commercefunds.com/literature-and-resources/prospectus-and-guide
|
|
| C000027733 |
|
|
| Shareholder Report [Line Items] |
|
|
| Fund Name |
Commerce National Tax-Free Intermediate Bond Fund
|
|
| Trading Symbol |
CFNLX
|
|
| Annual or Semi-Annual Statement [Text Block] |
This Semi-Annual shareholder report contains important information about Commerce National Tax-Free Intermediate Bond Fund for the period of November 1, 2025 to April 30, 2026.
|
|
| Additional Information [Text Block] |
You can find additional information about the Fund at www.commercefunds.com. You can also request this information by contacting us at 1-800-995-6365.
|
|
| Material Fund Change Notice [Text Block] |
This report also describes changes to the Fund that occurred after the end of the reporting period.
|
|
| Additional Information Phone Number |
1-800-995-6365
|
|
| Additional Information Website |
www.commercefunds.com
|
|
| Expenses [Text Block] |
What were the Fund costs for the last six months? Semi-Annual Fund Operating Expenses (based on a hypothetical $10,000 investment)
Table Summary
Fund |
Costs of a $10,000 investment |
Costs paid as a percentage of a $10,000 investment |
Commerce National Tax-Free Intermediate Bond Fund |
$31 |
0.62%Footnote Reference* |
| Footnote |
Description |
Footnote* |
Annualized | |
|
| Expenses Paid, Amount |
$ 31
|
|
| Expense Ratio, Percent |
0.62%
|
[7] |
| Material Change Date |
Apr. 30, 2026
|
|
| AssetsNet |
$ 349,540,343
|
|
| Holdings Count | Holding |
352
|
|
| Advisory Fees Paid, Amount |
$ 610,015
|
|
| InvestmentCompanyPortfolioTurnover |
10.00%
|
|
| Additional Fund Statistics [Text Block] |
Table Summary
FUND STATISTICS |
A |
Total Net Assets |
$349,540,343 |
# of Portfolio Holdings |
352 |
Portfolio Turnover Rate |
10% |
Total Advisory Fees Paid |
$610,015 | |
|
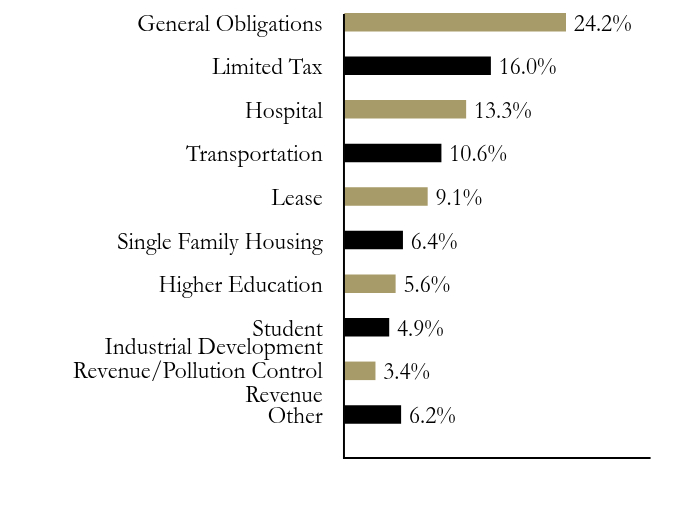
| Holdings [Text Block] |
Sector Allocation (% of Total Net Assets)
Table Summary
Value |
Value |
Other |
6.2% |
Industrial Development Revenue/Pollution Control Revenue |
3.4% |
Student |
4.9% |
Higher Education |
5.6% |
Single Family Housing |
6.4% |
Lease |
9.1% |
Transportation |
10.6% |
Hospital |
13.3% |
Limited Tax |
16.0% |
General Obligations |
24.2% | Credit Rating (% of Total Net Assets)Footnote Reference*
Table Summary
AAA |
3.3% |
AA |
61.7% |
A |
30.8% |
BBB |
0.5% |
Non-Rated |
3.5% |
| Footnote |
Description |
Footnote* |
For financial reporting purposes, credit quality ratings shown above reflect the highest rating assigned by either S&P Global Ratings or Moody’s Investors Service, Inc. if ratings differ. These rating agencies are independent, nationally recognized statistical rating organizations and are widely used. Investment grade ratings are credit ratings of BBB/Baa or higher. Below investment grade ratings are credit ratings of BB/Ba or lower. Investments designated Non-Rated or N/R are not rated by either rating agency. Unrated investments do not necessarily indicate low credit quality. Credit quality ratings are subject to change. | |
|
| Credit Ratings Selection [Text Block] |
For financial reporting purposes, credit quality ratings shown above reflect the highest rating assigned by either S&P Global Ratings or Moody’s Investors Service, Inc. if ratings differ. These rating agencies are independent, nationally recognized statistical rating organizations and are widely used. Investment grade ratings are credit ratings of BBB/Baa or higher. Below investment grade ratings are credit ratings of BB/Ba or lower. Investments designated Non-Rated or N/R are not rated by either rating agency. Unrated investments do not necessarily indicate low credit quality. Credit quality ratings are subject to change.
|
|
| Material Fund Change Expenses [Text Block] |
At its May 14, 2026 meeting, the Board of Trustees of The Commerce Funds approved the permanent reduction of the Fund's contractual fee rate. Effective August 1, 2026, under the new contractual fee rate, the Fund's management fee, calculated as a percentage of the Fund's average daily net assets, will be reduced to 0.30%.
|
|
| Updated Prospectus Phone Number |
1-800-995-6365
|
|
| Updated Prospectus Email Address |
<span style="box-sizing: border-box; color: rgb(0, 0, 0); display: inline; flex-wrap: nowrap; font-size: 12px; font-weight: 400; grid-area: auto; line-height: 18px; margin: 0px; overflow: visible; text-align: left; text-align-last: auto; white-space-collapse: preserve-breaks;">commercefunds@commercebank.com</span>
|
|
| Updated Prospectus Web Address |
https://www.commercefunds.com/literature-and-resources/prospectus-and-guide
|
|
| C000027715 |
|
|
| Shareholder Report [Line Items] |
|
|
| Fund Name |
Commerce Missouri Tax-Free Intermediate Bond Fund
|
|
| Trading Symbol |
CFMOX
|
|
| Annual or Semi-Annual Statement [Text Block] |
This Semi-Annual shareholder report contains important information about Commerce Missouri Tax-Free Intermediate Bond Fund for the period of November 1, 2025 to April 30, 2026.
|
|
| Additional Information [Text Block] |
You can find additional information about the Fund at www.commercefunds.com. You can also request this information by contacting us at 1-800-995-6365.
|
|
| Material Fund Change Notice [Text Block] |
This report also describes changes to the Fund that occurred after the end of the reporting period.
|
|
| Additional Information Phone Number |
1-800-995-6365
|
|
| Additional Information Website |
www.commercefunds.com
|
|
| Expenses [Text Block] |
What were the Fund costs for the last six months? Semi-Annual Fund Operating Expenses (based on a hypothetical $10,000 investment)
Table Summary
Fund |
Costs of a $10,000 investment |
Costs paid as a percentage of a $10,000 investment |
Commerce Missouri Tax-Free Intermediate Bond Fund |
$34 |
0.69%Footnote Reference* |
| Footnote |
Description |
Footnote* |
Annualized | |
|
| Expenses Paid, Amount |
$ 34
|
|
| Expense Ratio, Percent |
0.69%
|
[8] |
| Material Change Date |
Apr. 30, 2026
|
|
| AssetsNet |
$ 218,876,190
|
|
| Holdings Count | Holding |
208
|
|
| Advisory Fees Paid, Amount |
$ 459,042
|
|
| InvestmentCompanyPortfolioTurnover |
8.00%
|
|
| Additional Fund Statistics [Text Block] |
Table Summary
FUND STATISTICS |
A |
Total Net Assets |
$218,876,190 |
# of Portfolio Holdings |
208 |
Portfolio Turnover Rate |
8% |
Total Advisory Fees Paid |
$459,042 | |
|
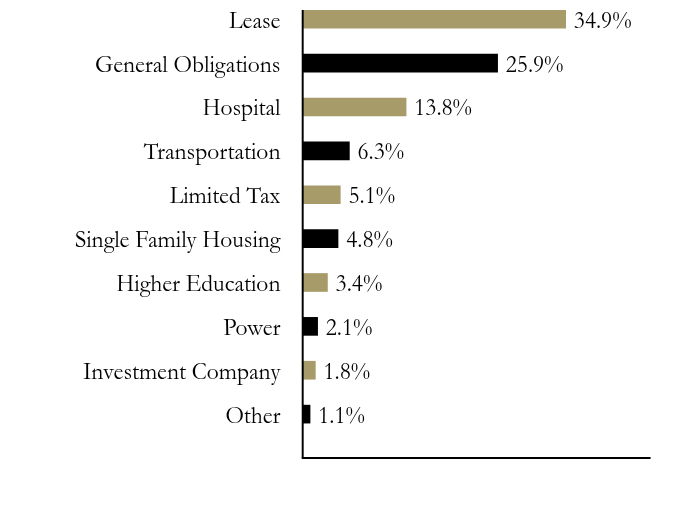
| Holdings [Text Block] |
Sector Allocation (% of Total Net Assets)
Table Summary
Value |
Value |
Other |
1.1% |
Investment Company |
1.8% |
Power |
2.1% |
Higher Education |
3.4% |
Single Family Housing |
4.8% |
Limited Tax |
5.1% |
Transportation |
6.3% |
Hospital |
13.8% |
General Obligations |
25.9% |
Lease |
34.9% | Credit Rating (% of Total Net Assets)Footnote Reference*
Table Summary
AAA |
0.1% |
AA |
55.8% |
A |
36.6% |
BBB |
3.4% |
Non-Rated |
3.3% |
| Footnote |
Description |
Footnote* |
For financial reporting purposes, credit quality ratings shown above reflect the highest rating assigned by either S&P Global Ratings or Moody’s Investors Service, Inc. if ratings differ. These rating agencies are independent, nationally recognized statistical rating organizations and are widely used. Investment grade ratings are credit ratings of BBB/Baa or higher. Below investment grade ratings are credit ratings of BB/Ba or lower. Investments designated Non-Rated or N/R are not rated by either rating agency. Unrated investments do not necessarily indicate low credit quality. Credit quality ratings are subject to change. | |
|
| Credit Ratings Selection [Text Block] |
For financial reporting purposes, credit quality ratings shown above reflect the highest rating assigned by either S&P Global Ratings or Moody’s Investors Service, Inc. if ratings differ. These rating agencies are independent, nationally recognized statistical rating organizations and are widely used. Investment grade ratings are credit ratings of BBB/Baa or higher. Below investment grade ratings are credit ratings of BB/Ba or lower. Investments designated Non-Rated or N/R are not rated by either rating agency. Unrated investments do not necessarily indicate low credit quality. Credit quality ratings are subject to change.
|
|
| Material Fund Change Expenses [Text Block] |
At its May 14, 2026 meeting, the Board of Trustees of The Commerce Funds approved the permanent reduction of the Fund's contractual fee rate. Effective August 1, 2026, under the new contractual fee rate, the Fund's management fee, calculated as a percentage of the Fund's average daily net assets, will be reduced to 0.30%.
|
|
| Updated Prospectus Phone Number |
1-800-995-6365
|
|
| Updated Prospectus Email Address |
<span style="box-sizing: border-box; color: rgb(0, 0, 0); display: inline; flex-wrap: nowrap; font-size: 12px; font-weight: 400; grid-area: auto; line-height: 18px; margin: 0px; overflow: visible; text-align: left; text-align-last: auto; white-space-collapse: preserve-breaks;">commercefunds@commercebank.com</span>
|
|
| Updated Prospectus Web Address |
https://www.commercefunds.com/literature-and-resources/prospectus-and-guide
|
|
| C000027717 |
|
|
| Shareholder Report [Line Items] |
|
|
| Fund Name |
Commerce Kansas Tax-Free Intermediate Bond Fund
|
|
| Trading Symbol |
KTXIX
|
|
| Annual or Semi-Annual Statement [Text Block] |
This Semi-Annual shareholder report contains important information about Commerce Kansas Tax-Free Intermediate Bond Fund for the period of November 1, 2025 to April 30, 2026.
|
|
| Additional Information [Text Block] |
You can find additional information about the Fund at www.commercefunds.com. You can also request this information by contacting us at 1-800-995-6365.
|
|
| Material Fund Change Notice [Text Block] |
This report also describes changes to the Fund that occurred after the end of the reporting period.
|
|
| Additional Information Phone Number |
1-800-995-6365
|
|
| Additional Information Website |
www.commercefunds.com
|
|
| Expenses [Text Block] |
What were the Fund costs for the last six months? Semi-Annual Fund Operating Expenses (based on a hypothetical $10,000 investment)
Table Summary
Fund |
Costs of a $10,000 investment |
Costs paid as a percentage of a $10,000 investmentFootnote Reference** |
Commerce Kansas Tax-Free Intermediate Bond Fund |
$35 |
0.70%Footnote Reference* |
| Footnote |
Description |
Footnote* |
Annualized |
Footnote** |
Reflects fee waiver and/or expense reimbursements, without which expenses would have been higher. | |
|
| Expenses Paid, Amount |
$ 35
|
|
| Expense Ratio, Percent |
0.70%
|
[9] |
| Material Change Date |
Apr. 30, 2026
|
|
| AssetsNet |
$ 101,177,343
|
|
| Holdings Count | Holding |
106
|
|
| Advisory Fees Paid, Amount |
$ 173,796
|
|
| InvestmentCompanyPortfolioTurnover |
12.00%
|
|
| Additional Fund Statistics [Text Block] |
Table Summary
FUND STATISTICS |
A |
Total Net Assets |
$101,177,343 |
# of Portfolio Holdings |
106 |
Portfolio Turnover Rate |
12% |
Total Advisory Fees Paid |
$173,796 | |
|
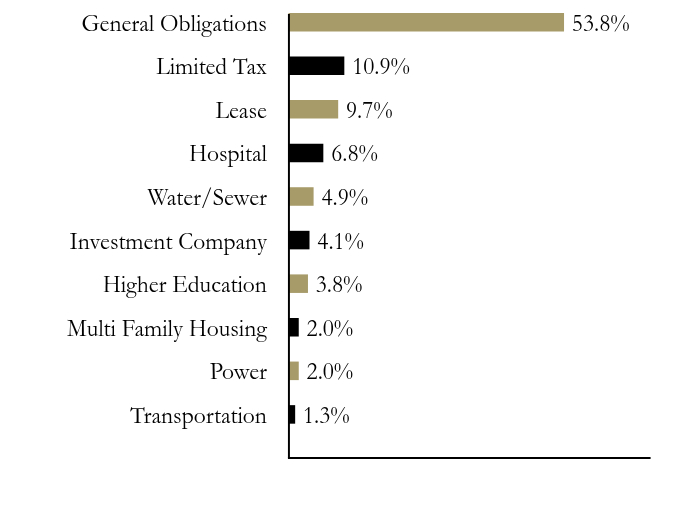
| Holdings [Text Block] |
Sector Allocation (% of Total Net Assets)
Table Summary
Value |
Value |
Transportation |
1.3% |
Power |
2.0% |
Multi Family Housing |
2.0% |
Higher Education |
3.8% |
Investment Company |
4.1% |
Water/Sewer |
4.9% |
Hospital |
6.8% |
Lease |
9.7% |
Limited Tax |
10.9% |
General Obligations |
53.8% | Credit Rating (% of Total Net Assets)Footnote Reference*
Table Summary
AAA |
7.4% |
AA |
70.0% |
A |
13.5% |
BBB |
3.1% |
Non-Rated |
5.4% |
| Footnote |
Description |
Footnote* |
For financial reporting purposes, credit quality ratings shown above reflect the highest rating assigned by either S&P Global Ratings or Moody’s Investors Service, Inc. if ratings differ. These rating agencies are independent, nationally recognized statistical rating organizations and are widely used. Investment grade ratings are credit ratings of BBB/Baa or higher. Below investment grade ratings are credit ratings of BB/Ba or lower. Investments designated Non-Rated or N/R are not rated by either rating agency. Unrated investments do not necessarily indicate low credit quality. Credit quality ratings are subject to change. | |
|
| Credit Ratings Selection [Text Block] |
For financial reporting purposes, credit quality ratings shown above reflect the highest rating assigned by either S&P Global Ratings or Moody’s Investors Service, Inc. if ratings differ. These rating agencies are independent, nationally recognized statistical rating organizations and are widely used. Investment grade ratings are credit ratings of BBB/Baa or higher. Below investment grade ratings are credit ratings of BB/Ba or lower. Investments designated Non-Rated or N/R are not rated by either rating agency. Unrated investments do not necessarily indicate low credit quality. Credit quality ratings are subject to change.
|
|
| Material Fund Change Expenses [Text Block] |
At its May 14, 2026 meeting, the Board of Trustees of The Commerce Funds approved the permanent reduction of the Fund's contractual fee rate. Effective August 1, 2026, under the new contractual fee rate, the Fund's management fee, calculated as a percentage of the Fund's average daily net assets, will be reduced to 0.30%.
|
|
| Updated Prospectus Phone Number |
1-800-995-6365
|
|
| Updated Prospectus Email Address |
<span style="box-sizing: border-box; color: rgb(0, 0, 0); display: inline; flex-wrap: nowrap; font-size: 12px; font-weight: 400; grid-area: auto; line-height: 18px; margin: 0px; overflow: visible; text-align: left; text-align-last: auto; white-space-collapse: preserve-breaks;">commercefunds@commercebank.com</span>
|
|
| Updated Prospectus Web Address |
https://www.commercefunds.com/literature-and-resources/prospectus-and-guide
|
|
|
|