Exhibit 99.3
ICON plc and Subsidiaries
Consolidated Financial Statements
Year ended 31 December 2025
Registered number: 145835
Directors’ Report and Consolidated Financial Statements
| | | | | |
| Contents | Page |
| |
| Directors and Other Information | |
| |
| Directors’ Report | |
| |
| Statement of Directors’ Responsibilities in respect of the Directors’ report and the financial statements | |
| |
| Independent Auditor’s Report to the Members of ICON plc | |
| |
| Consolidated Statement of Profit and Loss | |
| |
| Consolidated Statement of Comprehensive Income | |
| |
| Consolidated Statement of Financial Position | |
| |
| Consolidated Statement of Changes in Equity | |
| |
| Consolidated Statement of Cash Flows | |
| |
| Notes to Consolidated Financial Statements | |
| |
| Company Statement of Financial Position | |
| |
| Company Statement of Changes in Equity | |
| |
| Notes to Company Financial Statements | |
| |
| Reconciliation from IFRS to US Accounting Policies (Unaudited) | |
| |
| Appendix A: Risk Factors | |
Directors and Other Information
| | | | | |
| Directors | Ciaran Murray (Irish – Chair) |
| Barry Balfe (Irish – Chief Executive Officer) |
| Rónán Murphy (Irish – Non-Executive) |
| Dr. John Climax (Irish – Non-Executive) |
| Dr. Linda Grais (American – Non-Executive) |
| Eugene McCague (Irish – Non-Executive) |
| Julie O'Neill (Irish – Non-Executive) |
| Anne Whitaker (American – Non-Executive) |
| Kevin Egan (Irish – Non-Executive) |
| Jeff Elliott (American – Non-Executive) |
| |
| Company secretary | Diarmaid Cunningham |
| |
| Registered office | South County Business Park |
| Leopardstown |
| Dublin 18 |
| Ireland |
| |
Auditor | Ernst & Young |
| Harcourt Centre |
| Harcourt Street |
| Dublin 2 |
| Ireland |
| |
| Solicitors | A & L Goodbody |
| 25 North Wall Quay |
| Dublin 1 |
| Ireland |
| |
| White & Case LLP |
| 1221 Avenue of the Americas |
| New York |
| NY 10020-1095 |
| USA |
| |
| Registrars | Computershare Investor Services (Ireland) Limited |
| 3100 Lake Drive |
| Citywest Business Park |
| Dublin 24 |
| Ireland |
| |
Bankers | Citibank |
| Canada Square |
| Canary Wharf |
| London E14 5LB |
| United Kingdom |
| |
| JP Morgan Chase Bank N.A. |
| 383 Madison Avenue |
| New York |
| NY 10179 |
| USA |
The Directors present their report and audited consolidated and company financial statements of ICON plc (“the Company”, “ICON”, “we”, “our” or “us”), a public limited company incorporated in the Republic of Ireland, and its subsidiary undertakings (“the Subsidiaries”), with the Company and the Subsidiaries being together (“the Group”) for the year ended 31 December 2025.
The Company’s ordinary shares are traded on the NASDAQ Global Select Market (“NASDAQ”). The Company is considered a foreign private issuer in the U.S. and accordingly it is not subject to the same ongoing regulatory requirements as a U.S. registered company with a primary listing on NASDAQ.
These Consolidated and Company financial statements (together “the financial statements”) for the year ended 31 December 2025 are prepared in accordance with International Financial Reporting Standards as adopted by the European Union (“IFRS”) and meet the reporting requirements pursuant to Irish Company Law. In addition to the Consolidated financial statements contained in this annual report, we also prepare consolidated financial statements on Form 20-F pursuant to the rules and regulations of the U.S. Securities and Exchange Commission (“SEC”) and in accordance with accounting principles generally accepted in the United States (U.S. GAAP). The Form 20-F (under U.S. GAAP) is a separate document, a copy of which may be obtained from the Company’s website www.iconplc.com. IFRS differs in certain respects from U.S. GAAP, details of which are set out on pages 151 to 155 of this annual report.
The Investigation
In October 2025, the Audit Committee initiated an investigation into certain accounting practices and controls, following concerns reported to the Audit Committee through Group management. The Audit Committee promptly engaged outside legal counsel, who were supported by forensic and technical accounting firms, to conduct the investigation (the “Investigation”) and notified the Group’s independent auditors. The Group has also self-reported the matter to the SEC and other relevant agencies. The Investigation primarily focused on revenue recognition practices, and, in connection with the Investigation, the Group has determined that improper adjustments were made to the clinical trial services revenue of the Group in 2023 and 2024. The Group also identified errors in determining the estimated cost to complete, the assessment of realizable value, and certain manual adjustments in respect of clinical trial services revenue contracts during 2023 and 2024.
[Continued on next page]
Directors’ Report (continued)
The impact of the errors on the Consolidated Statement of Operations is shown below. For additional information refer to Note 1 Basis of preparation and statement of accounting policies - Restatement due to prior year adjustments in Notes to the Consolidated Financial Statements.
| | | | | | | |
| | |
| | 31 December
2024 | |
| | (in thousands, except per share data) |
| Revenue | | | |
| As Reported | | $ | 8,281,676 | | |
| As Restated | | $ | 8,188,990 | | |
| Impact | | $ | (92,686) | | |
| Impact % | | (1.1) | % | |
| | | |
| Profit for the financial year | | | |
| As Reported | | $ | 779,425 | | |
| As Restated | | $ | 727,077 | | |
| Impact | | $ | (52,348) | | |
| Impact % | | (6.7) | % | |
| | | |
| Earnings per share - Basic | | | |
| As Reported | | $ | 9.45 | | |
| As Restated | | $ | 8.81 | | |
| Impact | | $ | (0.64) | | |
| | | |
| Earnings per share - Diluted | | | |
| As Reported | | $ | 9.38 | | |
| As Restated | | $ | 8.75 | | |
| Impact | | $ | (0.63) | | |
| | | |
| | | |
The errors on the Consolidated Statement of Financial Position as at 31 December 2024 represent 1.4% of Total Assets; and of Total Equity & Liabilities.
The restatement errors does not affect cash flows or net debt.
Principal activities, business review and future developments
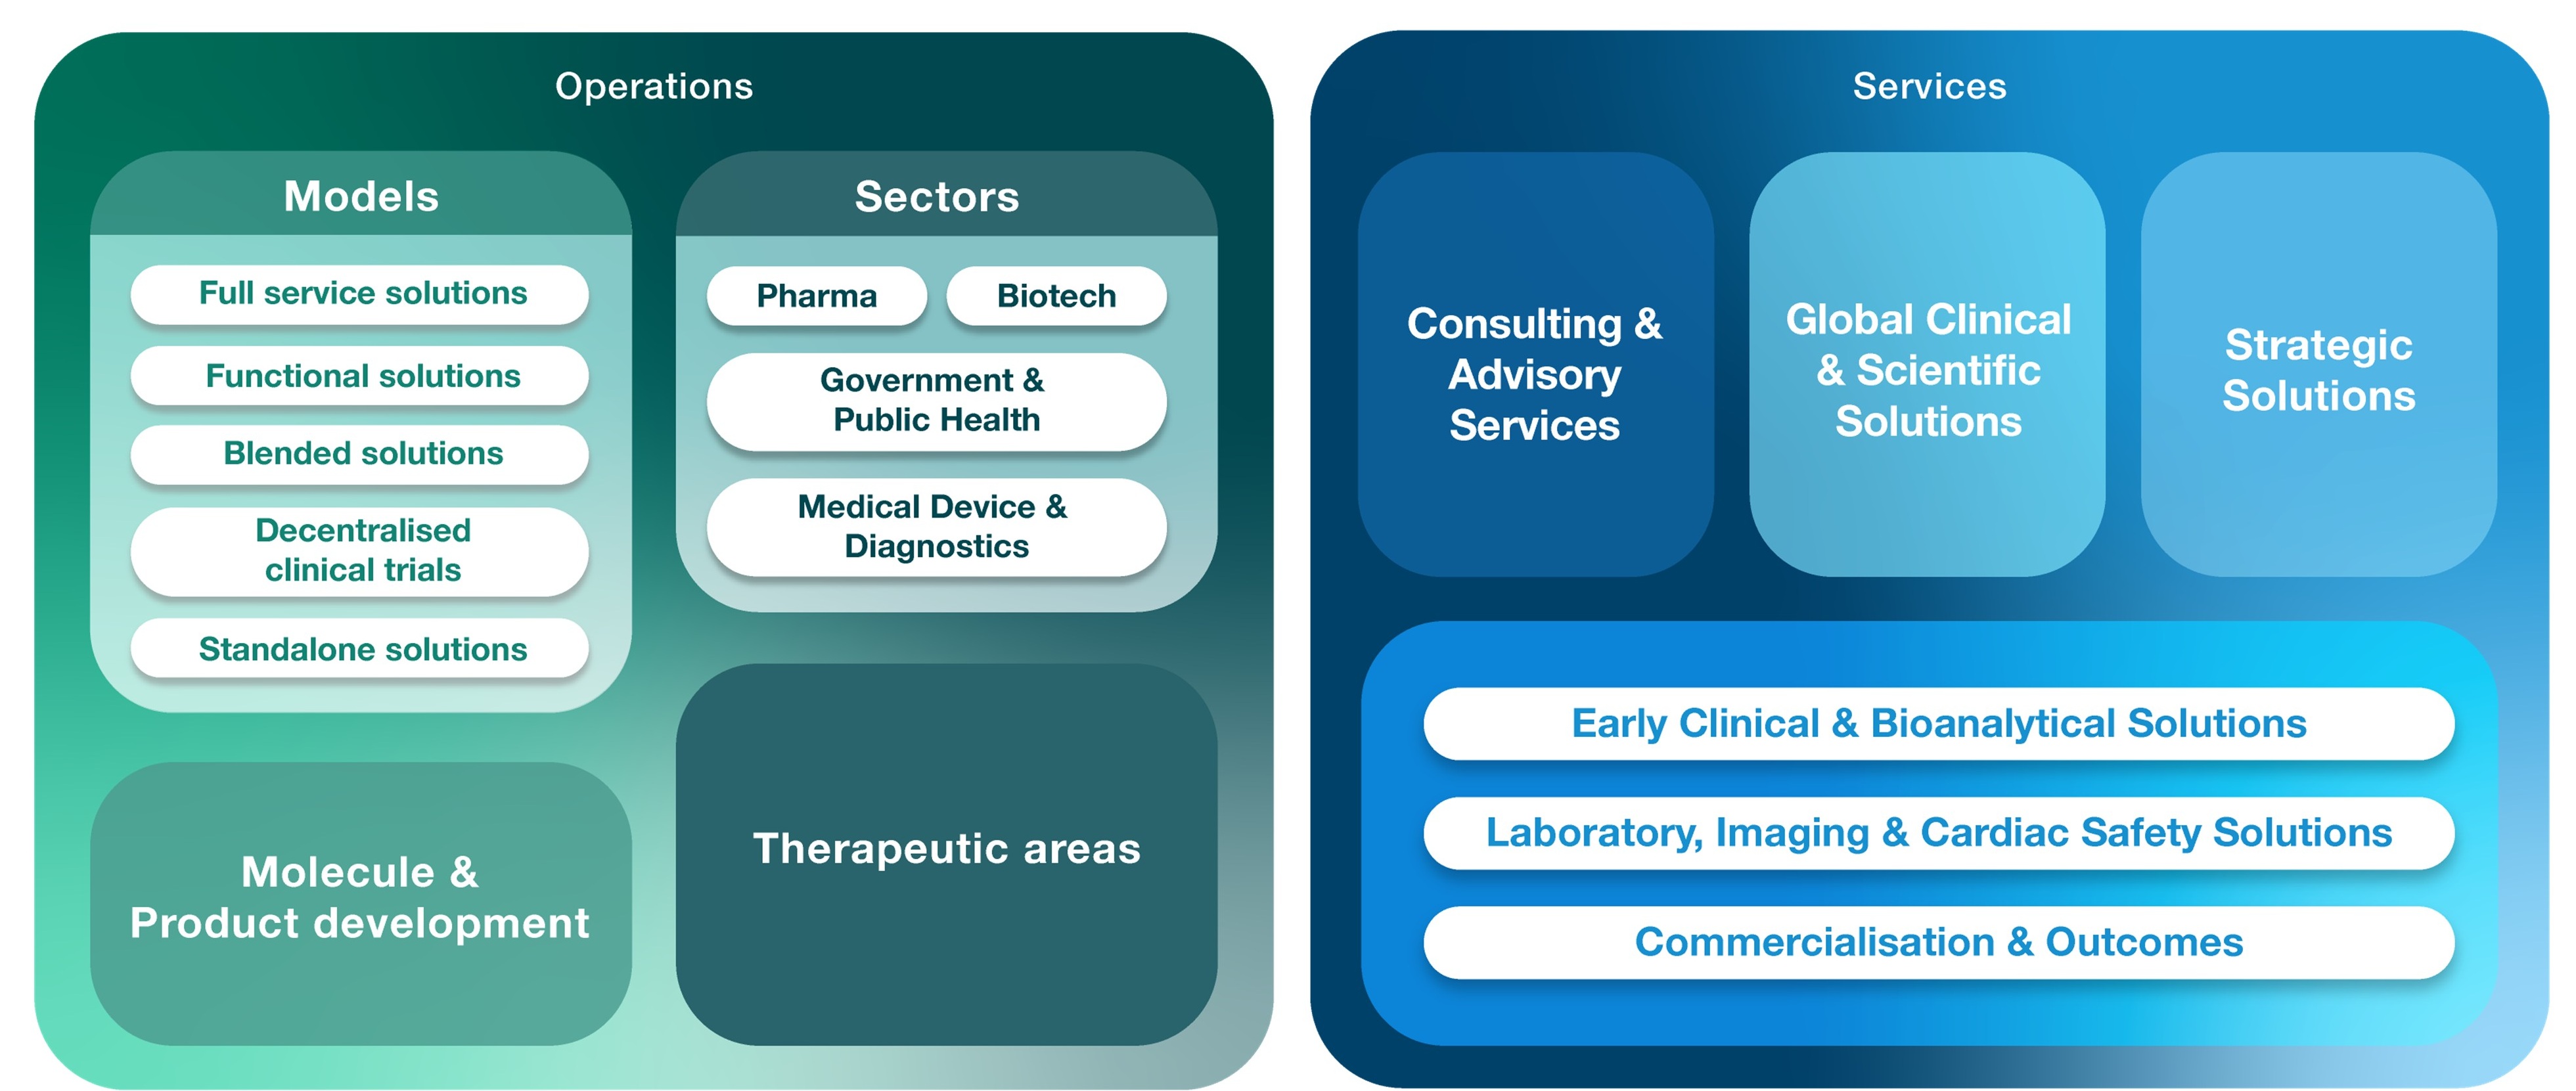
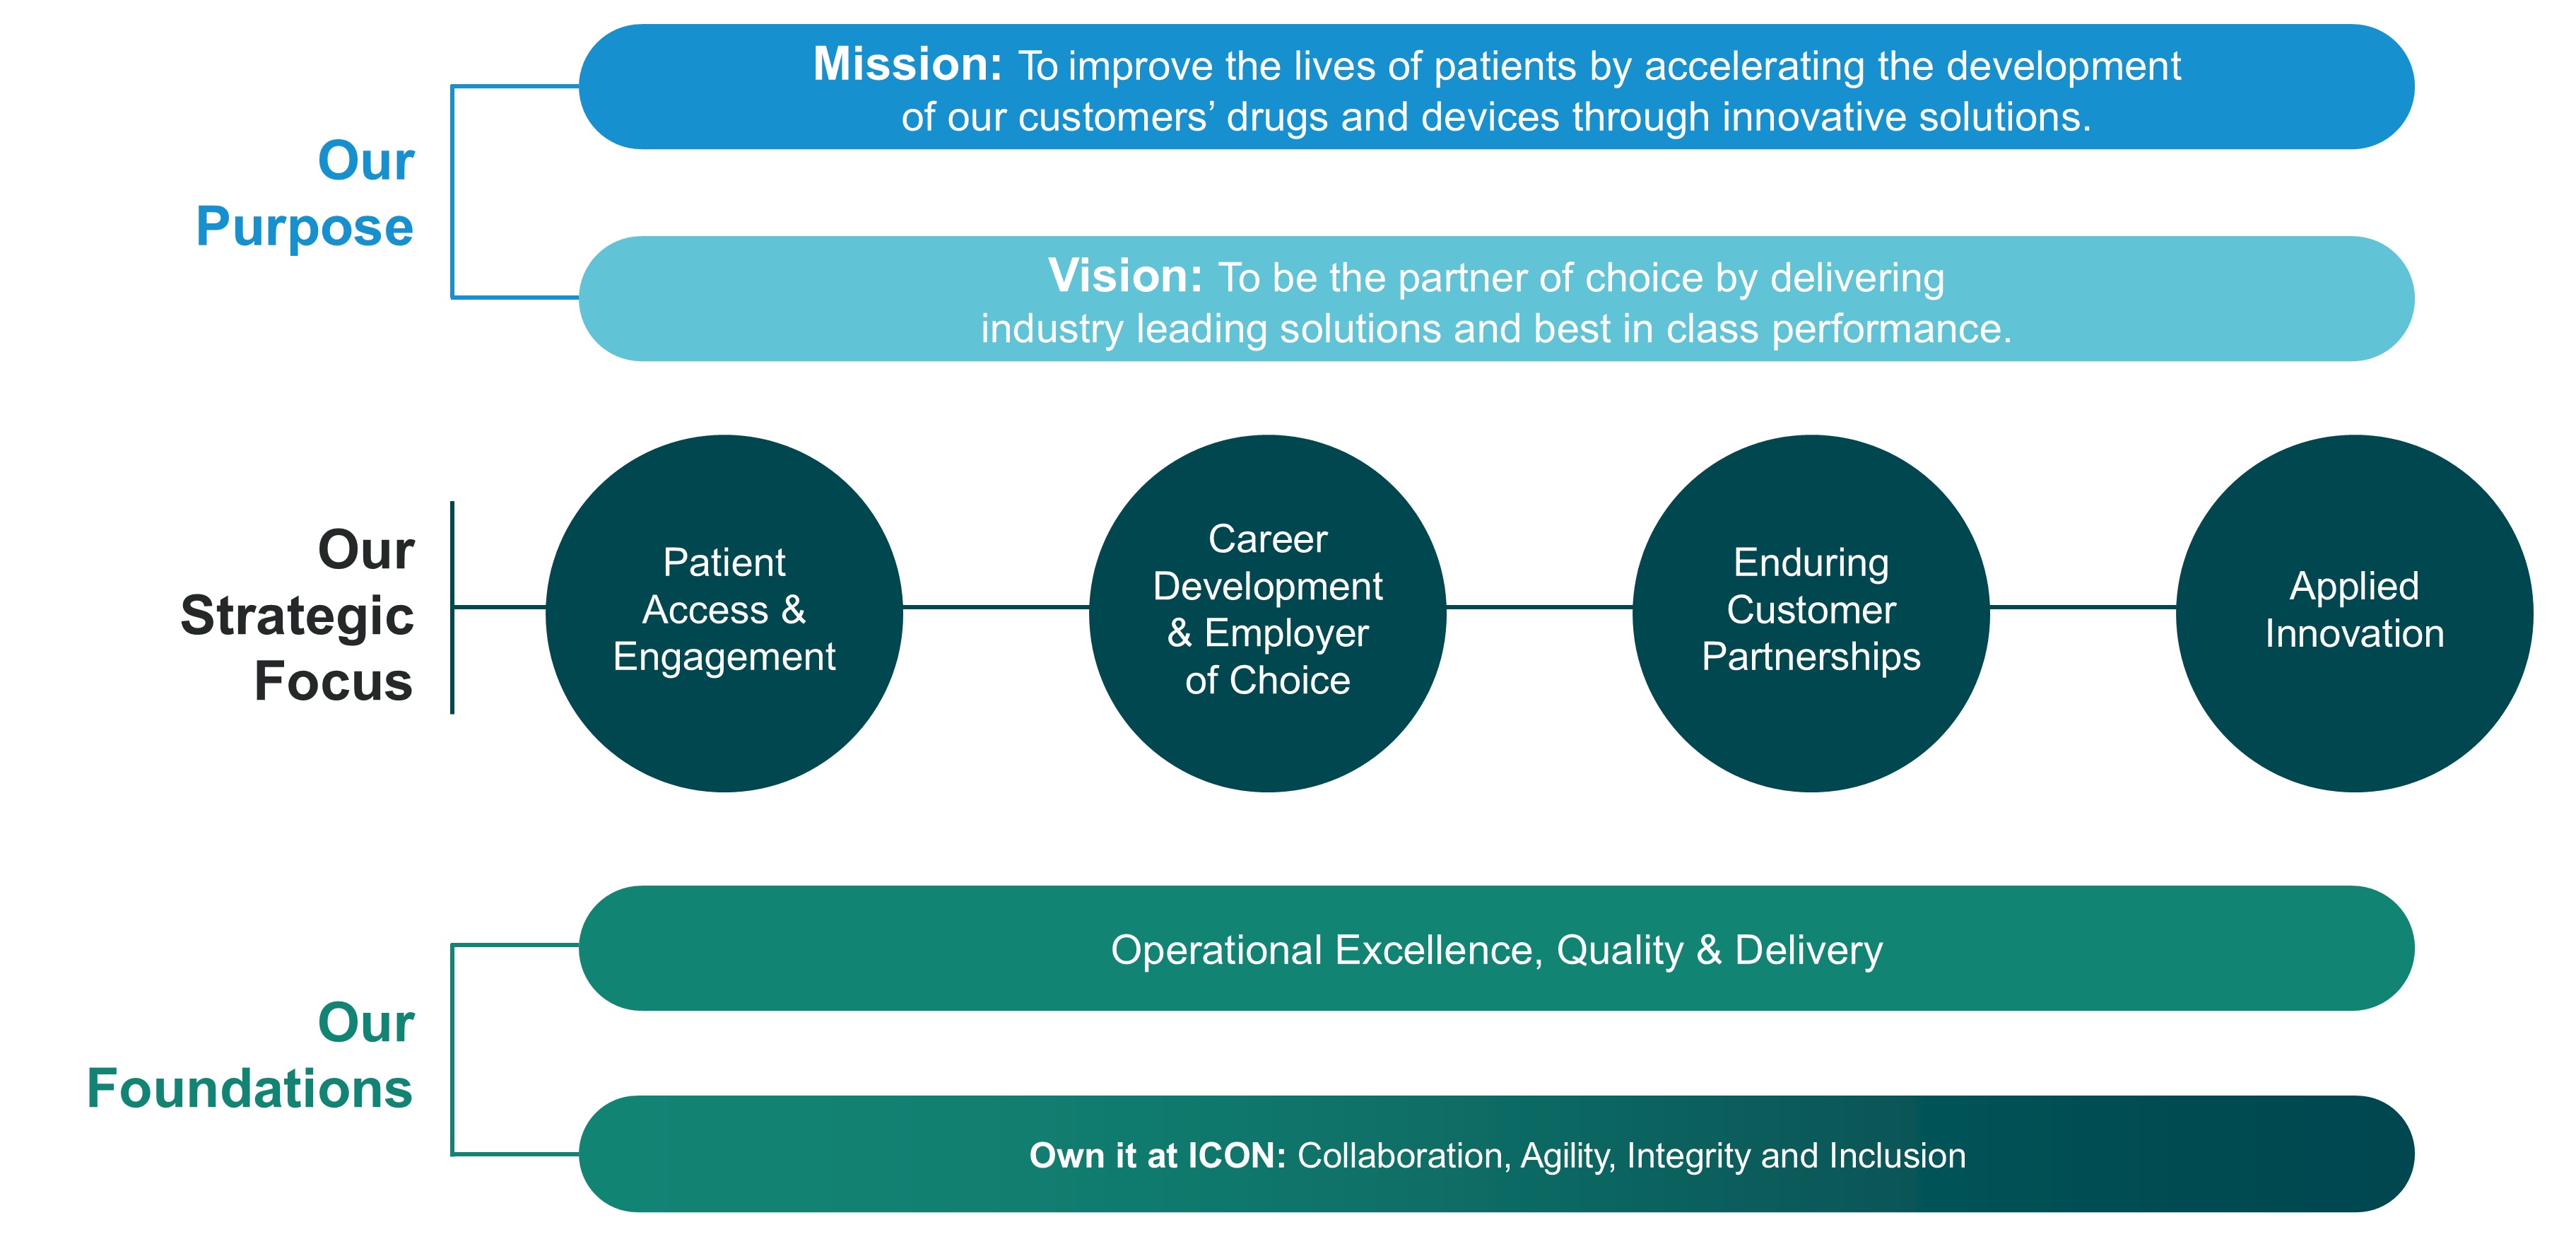
ICON is a contract research organisation (“CRO”), founded in Dublin, Ireland in 1990. For over thirty years we have grown significantly to become a global provider of outsourced development and commercialisation services to pharmaceutical, biotechnology, medical device and government and public health organisations. Our mission is to improve the lives of patients by accelerating the development of our customers’ drugs and devices through innovative solutions.
We are a public limited company in Ireland and operate under the Irish Companies Act. Our principal executive office is located at: South County Business Park, Leopardstown, Dublin 18, Republic of Ireland. The contact telephone number of this office is +353 1 2912000. Our website is www.iconplc.com.
We offer a full range of clinical, consulting and commercial services that range from clinical development strategy, planning and trial design, to full study execution, and post-market commercialisation. ICON provides its services across a range of clinical outsourcing operating models including strategic partnerships, preferred provider, full-service delivery to functional service provision and stand-alone services.
Directors’ Report (continued)
We specialise in the strategic development, management and analysis of programmes that support all stages of the clinical development process, from compound selection to Phase I-IV clinical studies. We earn revenue by providing a number of different services to our customers. These services are integral components of the clinical development process and include clinical trial management, consulting, contract staffing, data solutions and laboratory services.
Our vision is to be the partner of choice by delivering industry leading solutions and best in class performance in clinical development. We believe that we are one of a select group of CROs with the expertise and capability to conduct clinical trials in the major therapeutic areas on a global basis and have the operational flexibility to provide development services on a stand-alone basis or as part of an integrated full-service solution. In order to achieve this vision, we continue to invest in technology and data analytics capabilities.
ICON maintains a sustained focus on research and development. We continue to enhance our portfolio of data solutions and decentralised clinical trial technology through the development of industry-leading technologies and processes to support our clients. ICON is leading the industry transformation through four key levers: transforming clinical trials, site and patient centricity, applied innovation, and seamless, integrated service delivery.
At 31 December 2025, we employed approximately 40,100 employees in 97 locations in 55 countries. During the year ended 31 December 2025, we derived 30.6%, 57.9% and 11.5% of our revenue in the United States, Europe and Rest of World, respectively.
We have achieved strong growth since our foundation in 1990. We focus our innovation on those factors that are critical to our clients - reducing time to market, reducing cost and increasing quality. Our global team has extensive experience in a broad range of therapeutic areas. ICON has been recognised as one of the world's leading Contract Research Organisations (“CROs”) through a number of high-profile industry awards (see www.iconplc.com/awards).
As our market has evolved, biopharmaceutical companies are tackling productivity challenges, budget constraints and greater demands to demonstrate product value; all of which are placing increased pressure on their revenues and levels of profitability. However, these trends have generally been positive for CROs, as increased outsourcing has been adopted by these companies as they seek to create greater efficiencies in their development processes, convert previously fixed costs to variable, and accelerate time to market for new treatments. We believe innovation in the biopharma sector has been fuelled by recent advances in technology, improving scientific profiles of drug targets, and increasing the pipeline of quality assets that can be investigated for further development. This provides biopharma companies an opportunity to strengthen their development pipeline with promising drug candidates, particularly those that are facing challenging patent expiries to their current marketed products.
Directors’ Report (continued)
We believe regulatory and reimbursement pressures will continue to necessitate expansion of late stage (post marketing) research, as increasing requirements to demonstrate the economic value of new treatments are expected. As a result, we believe outcomes and comparative effectiveness research will most likely be required in order to secure on-going product reimbursement. Furthermore, we believe advances in molecular biology and genetics will drive further growth in innovation in the long term, which in turn should create further growth opportunities for both biopharma companies and their outsourced development partners.
We expect that continued outsourcing will be a core strategy of clients in the near and mid-term as they seek to optimise their development operations and adopt models that allow for increased efficiencies. Larger clients were the first to form strategic partnerships with global CROs in an effort to reduce the number of outsource partners with whom they engage and to reduce inefficiencies in their current clinical development models. More recently, we have seen the increasing adoption of this reduced partner model with mid-tier pharmaceutical and biotechnology firms as they also recognise the value of strategic engagement with their development partners. As outsourcing penetration increases, we believe clients may seek a greater level of integration of service offerings from CROs, although some will continue to purchase services on a stand-alone basis. Creating greater connectivity and “seamlessness” between our services and the sharing of real-time clinical, operational and “real world” data with clients will therefore become increasingly important for CROs. ICON will seek to benefit from this increased outsourcing by clients to grow our business by increasing market share with our existing client base and adding new clients within the Phase I-IV outsourced development services market; the aim being to ensure we will be considered for all major Phase I-IV projects.
Delivery of our mission and strategy is focused on our four strategic pillars, being (i) Patient Access & Engagement (ii) Career Development & Employer of Choice (iii) Enduring Customer Partnerships and (iv) Applied Innovation.
Patient Access & Engagement
ICON has a focused patient, site and data strategy, which is helping us to improve site identification, study placement and patient recruitment and retention.
Accellacare is ICON's global clinical research network offering customers a wide range of stand-alone and integrated solutions at site or in patients' homes as part of decentralised trials. Our patient centric approach accelerates study start-up and increases patient recruitment and retention for the pharmaceutical, biotechnology and medical device industries.
Accellacare In-Home Services takes study visits directly to patients where they live, work, study or play in all phases and therapeutic areas of clinical trials. By bringing trial visits directly to patients, we ease the burden of participating in clinical research to increase patient recruitment and retention. Accellacare In-Home Services has experience in more than 500 clinical trials, tailoring our services to fit each study's specific requirements across more than 55 countries. This cohesive approach is leading to higher patient recruitment and retention rates. Accellacare is also achieving faster study start-up for its customers through efficiencies gained in central process management including budget and contracting, which can otherwise be a source of delay. This combined with a finely tuned feasibility approach allows the network to identify and recruit more patients to studies, in a wide range of therapeutic areas, in a shorter time frame. Accellacare is an important
Directors’ Report (continued)
part of the integrated patient, site and data strategy, helping us to improve patient recruitment and retention. Through Accellacare, we are committed to delivering on the promise of patient centricity in clinical research whilst also providing investigators with innovative treatments for their patients with a quality-focused clinical research infrastructure supported by experienced professionals globally.
Accellacare Site Resourcing supports sites to address resource constraints and/or barriers to participation due to a lack of resources. This includes supporting sites with patient recruitment, for example conducting database searches, liaising with referral departments and following up with patients referred from digital patient recruitment campaigns. Accellacare Site Resourcing can also support sites with resources throughout the clinical trial conduct, for example administration support, Electronic Case Report Form (“eCRF”) data entry and query resolution and database lock preparation. The Accellacare Site Resourcing team provides a range of resources from Clinical Research Coordinators, Clinical Research Nurses, Clinical Trial Educators and other specialised resources for example, dieticians required for obesity studies. Accellacare Site Resourcing can deploy resources to site in approximately 20 countries. Through Accellacare Site Resourcing we are committed to delivering highly qualified staff to investigator sites and enable site success in clinical trial participation, delivery and performance.
The Accellacare Site Network encompasses 21 owned/embedded sites across the US, UK and Spain as well as a number of collaboration agreements with other sites. Accellacare offers a quality focused clinical research infrastructure delivering value and benefits to sponsors. Accellacare supports customers with faster start-up and the time from site selection to site initiation visit when compared to other sites. Furthermore, Accellacare achieves on average more patients per site when compared to other sites.
In 2025, Accellacare Site Network further expanded its site partnerships and focused on enhancing capabilities within its US and UK locations with a continued focus on central nervous system (“CNS”) capabilities and oncology. This included onboarding 27 new investigators across therapeutic areas and a specific increase in oncologists at our Chicago location, providing access to 12 investigators focused on oncology.
The Elite Sites, ICON's dedicated programme for top-tier site networks, was designed to offer an infrastructure for those networks who have set themselves apart. These networks have been selected for their high-performance quality, consistency with faster start-up, and ability to meet or exceed recruitment commitments. With the use of ICON’s Elite Site programme, the aim is for clients to increase reliability with delivery, reduce site or country footprint, shorten overall study timelines and ultimately get drugs to market faster. ICON Elite Sites have been selected to align with a few key therapeutic areas – oncology, neurosciences, and gastrointestinal/ non-alcoholic steatohepatitis (NASH) in which these networks have shown the ability to be true differentiators for our clients and study teams. The ICON Elite Sites programme has a global reach, including 5 networks presently, and will continue to expand to best support our clients.
Finding and engaging suitable patients to conduct clinical trials is one of the biggest issues facing the drug development industry today. The performance of investigative sites that do take part in research is uneven, hard to predict and many trials do not meet the initial recruitment goals. The current market challenge in patient enrolment creates an opportunity for ICON to differentiate its service offering and we are working to reduce patient recruitment times through enhanced site and investigator selection based on key performance metrics and through use of our proprietary FIRECREST technology which is used to train and support sites during the development process.
ICON's site networks enhance our ability to enrol patients onto the clinical studies we perform. We have also developed strategic alliances with investigator site groups and healthcare systems in all major global research markets. In partnership with others, we are pioneering patient recruitment solutions that leverage cognitive computing to transform clinical trial matching and allow a data-driven approach to deliver the right patients for trials. One Search is our intuitive, integrated workflow and interrogation tool that enables access to multiple data sources and provides the visualisation and tools necessary for optimum site identification based on ICON and industry data of capability, experience and performance. Scoring on enrolment performance, speed of start-up and quality supports better site selection.
Career development and employer of choice
ICON is an award-winning workplace that enables our employees to make a difference to patients’ lives by being part of a world-class clinical research organisation that helps deliver new medicines & medical devices that are benefiting patients worldwide.
Our global team of 40,100 employees is united in purpose, working together in an inclusive environment to help solve some of the world’s most complex healthcare challenges. We value integrity, inclusion, collaboration and agility, which together form our ‘Own it’ culture that fosters innovative ideas and a vibrant workplace.
Our success depends on the knowledge, skills and calibre of our people. That’s why we are committed to developing a continuous learning culture – one where we challenge employees with engaging work and where every experience adds to their professional development.
Directors’ Report (continued)
Through our industry leading learning management system, internally developed professional development programmes and partnerships with leading academic institutions, employees are encouraged to broaden their scientific, technical and business knowledge.
With a strong emphasis on personal and professional development, ICON equips employees with the skills, knowledge and expertise to navigate and succeed in a dynamic work environment. Employees have access to tools that will help them develop the skills to support their career aspirations. At ICON, we provide growth opportunities for every stage of an employee’s career, empowering them to progress and reach new heights.
From training and development programmes to mentorship and coaching, we're committed to helping our employees reach their full potential.
Our Total Reward philosophy is designed to attract, retain, and motivate top talent by offering a holistic and competitive package that reflects our commitment to fairness, equity, and employee wellbeing.
We regularly benchmark our rewards to ensure our compensation and benefits remain competitive in the market. Our goal is to recognise and differentiate based on performance while maintaining a strong value proposition for our employees.
We are committed to pay practices that are transparent, consistent, and free from bias. Our commitment to achieving and maintaining fair pay is central to making ICON a truly inclusive workplace. Our approach ensures that employees are rewarded fairly for their skills, experience, and performance.
We prioritise the well-being of our employees. Across the world, our programmes include comprehensive health benefits, wellness initiatives, and resources that support work-life balance and resilience.
Through this philosophy, we aim to create an environment where employees feel valued, supported, and empowered to thrive both professionally and personally.
Enduring customer partnerships
We continue to focus on expanding and deepening our partnerships with existing customers, while also developing new customer relationships.
Strategic client relationships will increasingly manifest themselves in many different forms. Many of these relationships will require innovative forms of collaboration across ICON service areas and departments and will therefore require increased flexibility to offer services on both a standalone functional basis and as part of a fully integrated service solution. To support this objective, we continue to evolve our collaboration and delivery models, invest in technology that will enable closer data integration across our service areas and enhance our project and programme management capabilities.
To meet the evolving needs of both our existing and new clients we continue to enhance our capabilities through both organic service development and targeted acquisitions. In addition, we continue to enhance our scientific and therapeutic expertise to support our customers in specific areas including oncology, orphan and rare diseases, CNS, dermatology, infectious disease and women's health.
ICON has extensive experience in vaccine clinical development for commercial businesses, governments and NGOs. This experience enabled us to play a significant role in the search for vaccines and treatments for COVID-19.
We continue to target growth in under-penetrated CRO market segments. Penetration within medical device companies has lagged that of bio-pharma firms but is beginning to accelerate. EU regulatory reform enacted in 2017 is a further catalyst to growth in this segment as it included stricter requirements to perform clinical evaluations and post-sale surveillance. In early 2020, ICON acquired MedPass which has further enhanced our value offering in this area.
We also invested significantly in our site and patient network (Accellacare), and consider our expertise and offering in this area as one of our strategic pillars.
Applied innovation
At ICON plc, innovation is focused on the factors that are critical to our clients and patients. We develop and integrate technologies that significantly enhance the efficiency and productivity of drug and device development programmes, providing transparency across all areas of a study and improving the predictability of outcomes. Our approach combines best-in-class third-party platforms with a suite of differentiated proprietary solutions. Together, these enable smarter trial design and execution, faster and more reliable patient recruitment, and more patient-centric data collection and analysis, including the capture of digital health data directly from patients’ devices.
Directors’ Report (continued)
Operational excellence, quality and delivery
Quality is the foundation of our success. The quality of our work is vital to our mission of bringing better medications to patients around the world. We are committed to maintaining, supporting, checking and improving our quality systems to meet or exceed the quality standards demanded by our clients, patients and regulatory authorities. We focus our innovation on the factors that are critical to our clients – reducing time to market, reducing cost and increasing quality – and our global team of experts has extensive experience in a broad range of therapeutic areas.
Quality project execution underpins all that we do and we have an ongoing focus on developing our people and processes to continue to enhance our service delivery. We also deploy supporting technologies which we believe will enable faster and deeper insights into the quality of trial data.
We are focused on operational excellence across our support functions, and we operate a global business support infrastructure across functions including finance, information technology, facilities, human resources, legal and quality assurance. This enables us to enhance the service levels across these support areas whilst driving down the costs of the service provision.
Principal activities of the Company
The principal activity of the Company is to act as a holding Company. The Company also operates branch offices in Poland (Warsaw), Latvia (Riga), and a representative office in Lithuania (Vilnius), all of which provide contract research services to the pharmaceutical industry.
Acquisition activity
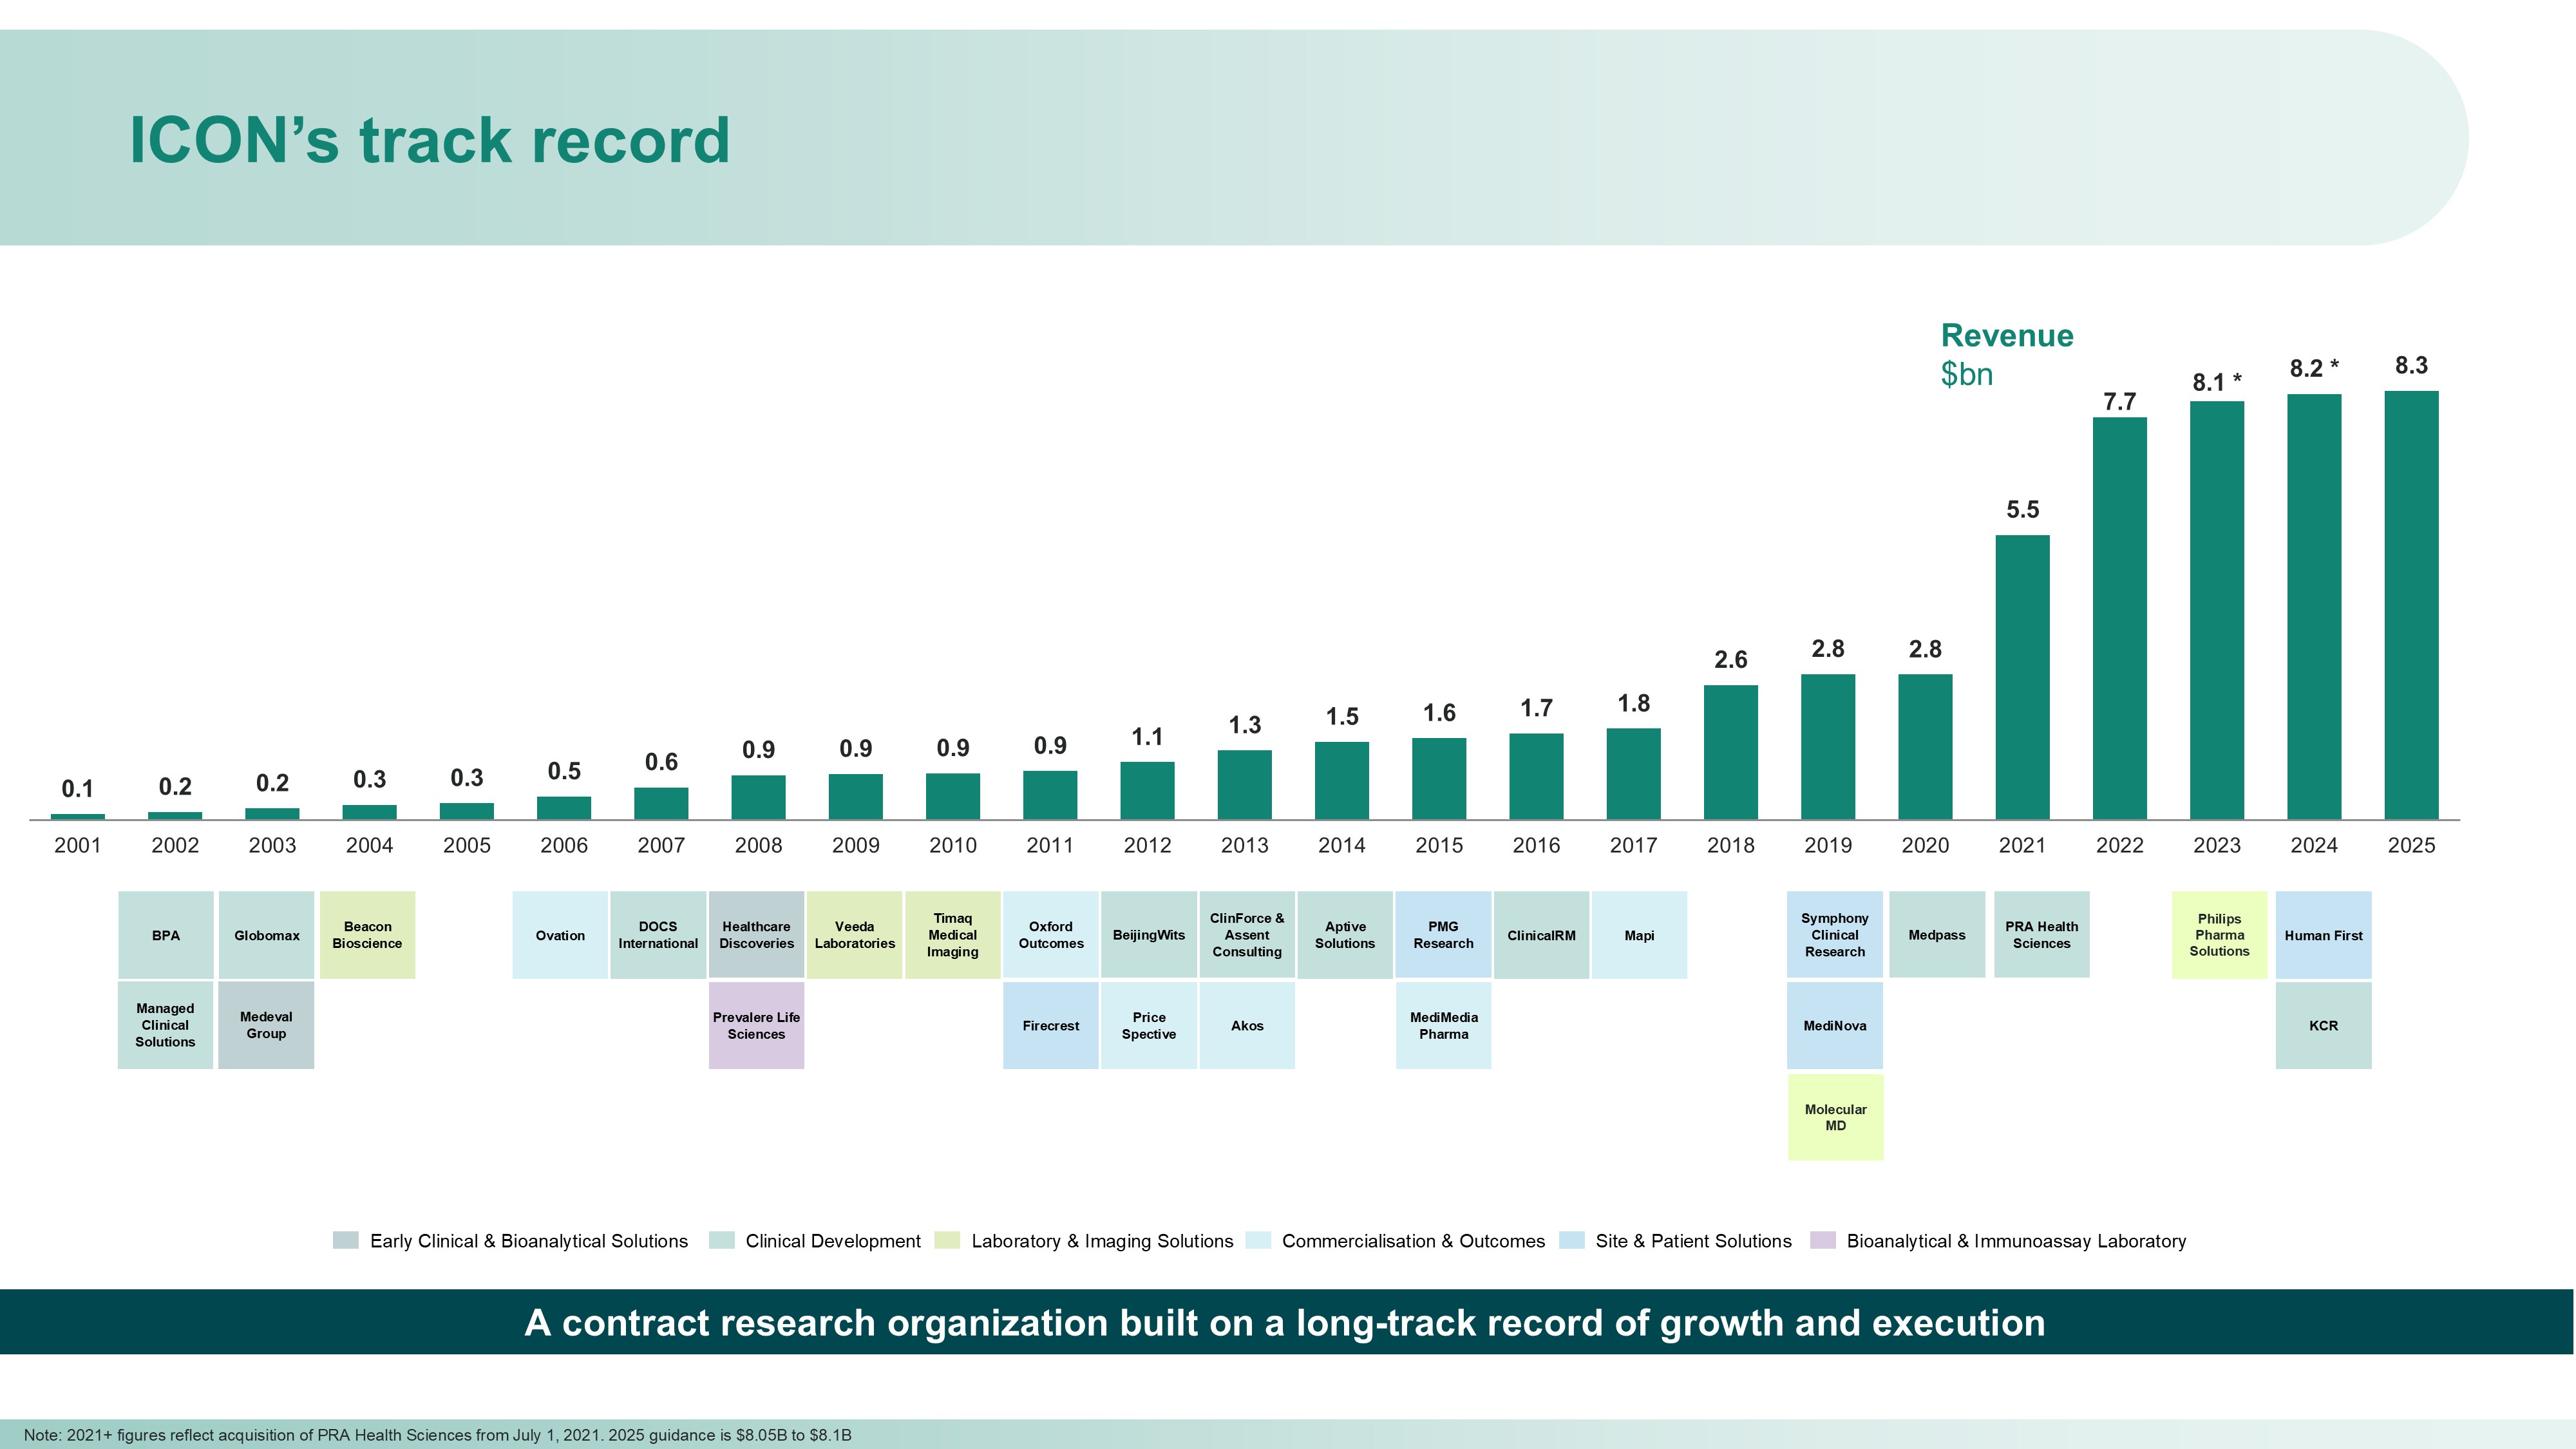
Since ICON was founded, the Group has expanded through organic growth, together with a number of strategic acquisitions to enhance its expertise and capabilities in certain areas of the clinical development process and to broaden the service portfolio and add scale to existing services.
Recent investments, which continue to strengthen our service offerings to meet the needs of our customers include:
On 19 August 2024, the Group acquired the KCR S.A Group (“KCR”), a CRO offering full service and functional services provision (“FSP”) clinical trial services. On 9 January 2024, the Group acquired HumanFirst, Inc. (“HumanFirst”), a life sciences technology company.
Directors’ Report (continued)
*Revenue figures for 2023 and 2024 have been adjusted for the Restatement.
Directors’ Report (continued)
Results and dividends
The results for the financial year and state of affairs of the Group are set out in the Consolidated Statement of Profit and Loss, the Consolidated Statement of Comprehensive Income, the Consolidated Statement of Financial Position, the Consolidated Statement of Changes in Equity and the Consolidated Statement of Cash Flows on pages 40 to 45 respectively. The Directors do not propose the payment of a dividend for the year ended 31 December 2025.
In the year ended 31 December 2025, the Group restated the prior year financial information. Details of the restatements are contained in Note 1 to the Consolidated Financial Statements.
The following table sets forth for the periods indicated certain financial data as a percentage of revenue and the percentage change in these items compared to the prior comparable period, being the key performance indicators used by management. The trends illustrated in the following table may not be indicative of future results.
| | | | | | | | | | | |
| 31 December
2025 | 31 December
2024
(As Restated) | Percentage increase/decrease |
| As a percentage of revenue | |
| Revenue | 100.0 | % | 100.0 | % | 0.8 | % |
| Costs and expenses | | | |
| Direct costs excluding exceptional items | 73.6 | % | 71.0 | % | 4.4 | % |
| Other operating expenses excluding exceptional items | 14.1 | % | 14.8 | % | (4.1) | % |
| Operating profit excluding exceptional items | 12.3 | % | 14.2 | % | (12.6) | % |
| Exceptional items: | | | |
| Transaction and integration related expenses | 0.3 | % | 0.4 | % | (14.6) | % |
| Restructuring expenses | 1.0 | % | 1.1 | % | (14.2) | % |
| Goodwill impairment | 4.5 | % | — | % | NM |
| Impairment of non-financial assets | 1.2 | % | — | % | NM |
| Provision for onerous contract | 0.1 | % | — | % | NM |
| Operating profit including exceptional items | 5.2 | % | 12.7 | % | (58.8) | % |
*NM - not meaningful
Twelve months ended 31 December 2025 compared to twelve months ended 31 December 2024 (As Restated)
Revenue
| | | | | | | | | | | | | | |
| 31 December
2025 | 31 December
2024
(As Restated) | Change |
| $’000 | $’000 | $’000 | % |
| Revenue | 8,251,340 | | 8,188,990 | | 62,350 | | 0.8 | % |
Revenue for the year ended 31 December 2025 increased by $62.4 million, or 0.8%, to $8,251.3 million, compared to $8,189.0 million for the year ended 31 December 2024. Revenue increased by 0.1% in constant currency terms.
For the year ended 31 December 2025, the Group derived approximately 30.6%, 57.9% and 11.5% of our revenue in the United States, Europe and Rest of World, respectively. Revenues from our top five customers amounted to $2,046.2 million in the year ended 31 December 2025 compared to $2,063.6 million in the year ended 31 December 2024 or 24.8% and 25.2% respectively. New customer accounts are continually added across the full portfolio of large pharma customers, mid-tier pharma customers and biotech customers.
Revenue in Ireland increased by $479.8 million for the year ended 31 December 2025, to $3,183.6 million, compared to $2,703.8 million for the year ended 31 December 2024. Revenue in Ireland during the year ended 31 December 2025 increased by 17.7% compared to an overall increase in Group revenue of 0.8%. Revenue in Ireland is principally a function of our global contracting model (see Note 2 Segmental information in Notes to the Consolidated Financial Statements).
Directors’ Report (continued)
Revenue in the Rest of Europe increased by $31.4 million or 2.0% for the year ended 31 December 2025, to $1,590.9 million in the year ended 31 December 2025, compared to $1,559.5 million for the year ended 31 December 2024. Revenue in the U.S. decreased by $458.2 million or 15.4% for the year ended 31 December 2025, to $2,524.9 million in the year ended 31 December 2025, compared to $2,983.1 million for the year ended 31 December 2024. Revenue in our Rest of World (‘Other’) region increased by $9.3 million or 1.0% for the year ended 31 December 2025, to $951.9 million compared to $942.6 million for the year ended 31 December 2024.
Direct costs
| | | | | | | | | | | |
| 31 December
2025 | 31 December
2024
(As Restated) | Change |
| $’000 | $’000 | $’000 |
| Direct costs | 6,076,286 | | 5,817,764 | | 258,522 | |
| % of revenue | 73.6 | % | 71.0 | % | 4.4 | % |
Direct costs for the year ended 31 December 2025 increased by $258.5 million or 4.4%, to $6,076.3 million from $5,817.8 million for the year ended 31 December 2024. Direct costs consist primarily of investigator and other reimbursable costs, compensation, associated fringe benefits and share based compensation expense for project-related employees and other direct project driven costs. The increase in direct costs for the year ended 31 December 2025 as compared to 31 December 2024, arose due to an increase in third party investigator / other reimbursable costs and laboratories partially offset by decreases in personnel related costs, and travel costs. As a percentage of revenue, direct costs have increased to 73.6% for the year ended 31 December 2025 compared to 71.0% for the year ended 31 December 2024.
Other Operating Expenses
| | | | | | | | | | | |
| 31 December
2025 | 31 December
2024 | Change |
| Other operating expenses excluding exceptional items ($'000) | 1,163,024 | | 1,212,972 | | (49,948) | |
| % of revenue | 14.1 | % | 14.8 | % | (4.1 | %) |
| Other operating expenses including exceptional items ($'000) | 1,747,976 | | 1,334,669 | | 413,307 | |
| % of revenue | 21.2 | % | 16.3 | % | 31.0 | % |
Other operating expenses (excluding exceptional items) for the year ended 31 December 2025 decreased by $49.9 million, or 4.1%, to $1,163.0 million compared to $1,213.0 million for the year ended 31 December 2024. Other operating expenses comprise primarily of compensation, related fringe benefits and routine share based compensation expense for non-project-related employees, recruitment expenditures, professional service costs, advertising costs, costs related to facilities and information systems, depreciation and amortisation. Further, costs incurred relating to the Investigation, including out of scope audit fees resulting from the impact of the Investigation, and in defence of the Putative Class Action (as referred to in Note 27 Litigation in Notes to the Consolidated Financial Statements) are classified within this category.
As a percentage of revenue, other operating expenses (excluding exceptional items) decreased to 14.1% of revenue for the year ended 31 December 2025, compared to 14.8% of revenue for the year ended 31 December 2024. The decrease in costs for the year ended 31 December 2025 primarily reflects decreases in amortisation of $110.6 million, decreases in professional fees, general and marketing costs of $22.3 million, offset by adverse foreign exchange movements ($39.3 million during the year ended 31 December 2025) and increases in facilities and depreciation cost of $19.1 million.
Directors’ Report (continued)
Exceptional items
Restructuring, transaction and integration-related expenses
| | | | | | | | | | | |
| 31 December
2025 | 31 December
2024 | Change |
| Transaction and integration related ($'000) | 25,269 | | 29,574 | | (4,305) | |
| % of revenue | 0.3 | % | 0.4 | % | (14.6) | % |
| Restructuring ($'000) | 79,069 | | 92,123 | | (13,054) | |
| % of revenue | 1.0 | % | 1.1 | % | (14.2) | % |
During the year ended 31 December 2025, the Group incurred $104.3 million for restructuring, transaction and integration-related expenses. The charge includes transaction and integration costs of $25.3 million associated with ongoing integration activities related to our recent acquisitions. Such costs include professional fees, legal costs and related integration costs.
The Group has also undertaken a restructuring programme aimed at realigning its workforce as well as reviewing its global office footprint and optimising its locations to best fit the requirements of the Group. This programme has resulted in a charge of $79.1 million in the year ended 31 December 2025. In the year ended 31 December 2024, a restructuring charge of $92.1 million was recognised. The restructuring plan reflects a workforce reduction of $74.6 million (31 December 2024: $74.5 million) and an office consolidation programme to optimise the Group's office footprint of $4.5 million (31 December 2024: $17.6 million).
Impairments & Provision for onerous contracts
| | | | | | | | | | | |
| 31 December
2025 | 31 December
2024 | Change |
| Goodwill impairment ($'000) | 367,587 | | — | | 367,587 | |
| % of revenue | 4.5 | % | — | | NM |
| Impairment of non-financial assets ($'000) | 101,027 | | — | | 101,027 | |
| % of revenue | 1.2 | % | — | | NM |
Provision for onerous contract ($'000) | 12,000 | | — | | 12,000 | |
| % of revenue | 0.1 | % | — | | NM |
During the year ended 31 December 2025, an impairment indicator was identified specific to the Group's Data Solutions reporting unit that indicated the carrying amount of the Data Solutions reporting unit may not be recoverable. This indicator related to the Group’s revised expectations on the future performance of the reporting unit considering specific external market participant factors.
As a result, the Group recorded a goodwill impairment charge of $367.6 million (31 December 2024: $nil) in the Consolidated Statements of Profit and Loss related to the Data Solutions reporting unit. This represented the entire balance of goodwill attributed to the Data Solutions reporting unit. This charge represents 4.5% of revenue for the year ending 31 December 2025. Impairment of non-financial assets of $101.0 million (31 December 2024: $nil) was recorded related to property, plant and equipment and intangible assets in the Data Solutions reporting unit. This charge represents 1.2% of revenue for the year ending 31 December 2025. Further the Group recorded a provision of $12.0 million (31 December 2024: $nil) for onerous contracts in respect of the Data Solutions reporting unit. This charge represents 0.1% of revenue for the year ending 31 December 2025.
Directors’ Report (continued)
Operating profit
| | | | | | | | | | | |
| 31 December
2025 | 31 December
2024
(As Restated) | Change |
| Operating profit excluding exceptional items ($'000) | 1,012,030 | | 1,158,254 | | (146,224) | |
| % of revenue | 12.3 | % | 14.2 | % | (12.6 | %) |
| Operating profit including exceptional items ($'000) | 427,078 | | 1,036,557 | | (609,479) | |
| % of revenue | 5.2 | % | 12.7 | % | (58.8 | %) |
Operating profit (excluding exceptional items) for the year ended 31 December 2025 decreased by $146.2 million, or 12.6%, to $1,012.0 million, compared to $1,158.3 million for the year ended 31 December 2024. As a percentage of revenue, operating profit (excluding exceptional items) for the year ended 31 December 2025 decreased to 12.3% compared to 14.2% for the year ended 31 December 2024.
Operating profit (including exceptional items) for the year ended 31 December 2025 decreased by $609.5 million, or 58.8%, to $427.1 million, compared to $1,036.6 million for the year ended 31 December 2024. As a percentage of revenue, operating profit (including exceptional items) for the year ended 31 December 2025 decreased to 5.2% compared to 12.7% for the year ended 31 December 2024.
Finance income and costs
| | | | | | | | | | | | | | |
| 31 December
2025 | 31 December
2024 | Change |
| $’000 | $’000 | $’000 | % |
| Finance income | 7,109 | | 8,609 | | (1,500) | | (17.4 | %) |
| Finance costs excluding exceptional items | (203,674) | | (242,616) | | 38,942 | | (16.1 | %) |
Finance costs decreased to $203.7 million for the year ended 31 December 2025 from $242.6 million for the year ended 31 December 2024. The decrease in the period reflects significant repayments of the Group's loan facilities in 2024, the repricing of the senior secured term loan facility and senior secured revolving credit facility in March 2024, and the impact of reduced interest rates on the New Notes issued in May 2024. Finance income for the year decreased to $7.1 million for the year ended 31 December 2025 from $8.6 million for the year ended 31 December 2024.
Income tax expense
| | | | | | | | | | | | | | |
| 31 December
2025 | 31 December
2024
(As Restated) | Change |
| Income tax expense excluding exceptional items ($'000) | 57,966 | | 96,749 | | (38,783) | | (40.1 | %) |
| Effective income tax rate (%) | 7.1 | % | 10.5 | % | | |
| Income tax expense including exceptional items ($'000) | 16,475 | | 75,473 | | (58,998) | | (78.2 | %) |
| Effective income tax rate (%) | 7.1 | % | 9.4 | % | | |
Income tax expense (including exceptional items) for the period decreased to $16.5 million for the year ended 31 December 2025 from $75.5 million for the year ended 31 December 2024. The Group’s effective tax rate (including exceptional items) for the year ended 31 December 2025 was 7.1% (7.1% excluding the effect of exceptional items) compared with 9.4% (10.5% excluding the effect of exceptional items) for the year ended 31 December 2024; primarily due to changes in various tax laws and the level of deferred tax benefit associated with the amortisation of intangible assets. With the exception of the foregoing, the Group's effective tax rate remains principally a function of the distribution of pre-tax profits amongst the territories in which it operates.
Risks and uncertainties
Under Irish Company Law (Section 327 of the Companies Act), the Directors are required to give a description of the principal risks and uncertainties which it faced at 31 December 2025. Details of the principal risks and uncertainties facing the Group are set out in Appendix A: Risk Factors of this annual report and form an integral part of the Directors’ Report.
Directors’ Report (continued)
Future developments
The Group looks forward to continuing to expand through organic growth, together with strategic acquisitions to enhance its expertise and capabilities in certain areas of the clinical development process and to continue to deliver on its mission to accelerate the development of drugs and devices that save lives and improve the quality of life.
Please see Note 29 Subsequent events in Notes to the Consolidated Financial Statements for details of events in the period from year-end to the approval of the financial statements.
Financial risk management
Group financial risk management is governed by policies and guidelines which are reviewed and approved annually by the Board of Directors. These policies and guidelines primarily cover foreign exchange risk, credit risk, liquidity risk and interest rate risk. The principal objective of these policies and guidelines is to ensure the minimisation of financial risk at reasonable cost. The Group’s financial instruments comprise cash and cash equivalents, current asset investments, lease obligations and negotiated debt facilities. The main purpose of these financial instruments is to fund the working capital requirements of the Group, the cost of new acquisitions and ensure continued growth. The Group also occasionally uses derivative financial instruments to reduce exposure to fluctuations in foreign exchange rates. The principal financial risk facing the Group is foreign exchange risk and interest rate risk (although interest rate risk is now limited: at 31 December 2025, 73% of the Group's outstanding debt was at a fixed interest rate (31 December 2024: 73%)). Other financial risks include credit risk and liquidity risk. Further details are set out in Note 24 Financial instruments in Notes to the Consolidated Financial Statements and Note 11 Financial instruments in Notes to the Company Financial Statements. The Group does not undertake any trading activity in financial instruments nor does it enter into any leveraged derivative transactions. The Group treasury function centrally manages the Group’s funding and liquidity requirements.
Financing
On 1 July 2021, the Group completed the acquisition of PRA Health Sciences, Inc. (“PRA”) by means of a merger whereby Indigo Merger Sub, Inc., a Delaware corporation and subsidiary of ICON, merged with and into PRA, the parent of PRA Health Sciences (the “Merger”). In conjunction with the completion of the merger, ICON entered into a credit agreement (the “Credit Agreement”) providing for a senior secured term loan facility of $5,515 million and a senior secured revolving loan facility in an initial aggregate principal amount of $300 million (the “Senior Secured Credit Facilities”).
In addition to the Senior Secured Credit Facilities, the Group issued $500 million in aggregate principal amount of 2.875% senior secured notes in a private offering (the “2026 Notes”). On 2 May 2023, the Group agreed with its lenders to increase the aggregate principal amount of the senior secured revolving loan facility from $300 million to $500 million.
The New Notes
On 8 May 2024, ICON Investments Six Designated Activity Company (the “Issuer”), a wholly-owned subsidiary of ICON plc, issued $2 billion senior secured notes (“the New Notes”). The New Notes were issued in aggregate principal amounts of: $750 million 5.809% Senior Secured Notes due 2027 (the “2027 Notes”), $750 million 5.849% Senior Secured Notes due 2029 (the “2029 Notes”) and $500 million 6.000% Senior Secured Notes due 2034 (the “2034 Notes”). The proceeds from the issuance were used to repay a portion of the senior secured term loan outstanding under the Senior Secured Credit Facilities and to pay fees, costs and expenses related to the offering.
Repricing - senior secured term loan facility
On 14 March 2024, the parties to the Credit Agreement entered into a Third Amendment to the Credit Agreement (the “Third Amendment”) in connection with the repricing of the senior secured term loan facility and the senior secured revolving credit facility (The Third Amendment in relation to the senior secured revolving credit facility was further amended by the Fourth Amendment as referred to below).
With respect to the senior secured term loan facility, the repricing culminated in a margin reduction of 25 basis points, from 2.25% (based on the then-current first lien net leverage ratio) to 2.0%; and the elimination of the credit adjustment spread. The combination of the above resulted in an overall reduction of 51 basis points on the senior secured term loan facility (assuming quarterly refixing).
Directors’ Report (continued)
Repricing and extension – senior secured revolving credit facility
On 26 November 2025, the parties to the Credit Agreement entered into a Fourth Amendment (the “Fourth Amendment”) to reprice and extend the senior secured revolving credit facility.
As a result of the Fourth Amendment, the maturity was extended from a five-year term to a seven-year term ending 1 July 2028. Reflecting the Fourth Amendment, the interest rate margin applicable to borrowings under the revolving loan facility will be, at the option of the borrower, either (i) the applicable base rate plus an applicable margin of 0.35% or 0.00%, based on the Company’s current corporate family rating assigned by S&P of BB (or lower) or BB+ (or higher), respectively, or (ii) Term SOFR plus an applicable margin of 1.35%, 1.00%, 0.75%, 0.55%, or 0.40% based on the Company’s current corporate family rating assigned by S&P of BB (or lower), BB+, BBB-, BBB or BBB+ (or higher), respectively. In addition, lenders under the revolving loan facility are entitled to commitment fees as a percentage of the applicable margin at the time of drawing and utilisation fees dependent on the proportion of the facility drawn.
Senior Secured Credit Facilities repayment
During the year ended 31 December 2025, the Group made mandatory principal repayments of $29.8 million (31 December 2024: mandatory and voluntary principal repayments of $2,304.8 million) of the senior secured term loan facility. There have been no voluntary repayments made during the year ended 31 December 2025. For the year ended 31 December 2024, voluntary repayments resulted in an accelerated charge associated with previously capitalised fees of $16.9 million.
In addition, during the year ended 31 December 2025, the Group drew $50.0 million (31 December 2024: $318.0 million) of the senior secured revolving loan facility and repaid $50.0 million (31 December 2024: $373.0 million). At 31 December 2025, $nil was drawn under the senior secured revolving loan facility (31 December 2024: $nil). Refer to Note 21 Bank credit lines and loan facilities in Notes to the Consolidated Financial Statements for further details on the Company's Senior Secured Credit Facilities.
Bridge Secured Credit Facility
On 27 April 2026, ICON Global Treasury Unlimited Company (the “Bridge Facility Borrower”) entered into a bridge facility credit agreement for an aggregate principal amount of $500 million (the "Bridge Secured Credit Facility"). The proceeds of the Bridge Secured Credit Facility may be used to discharge and repay in full $500 million aggregate principal amount of 2.875% Senior Secured Notes (the “2026 Notes”) issued by a subsidiary of the Group in July 2021. The Bridge Secured Credit Facility will mature on 26 April 2027.
The borrowings under the Bridge Secured Credit Facility do not amortise and are due at final maturity. The interest rate margin applicable to borrowings under the Bridge Secured Credit Facility is USD Term SOFR plus a fixed calendared applicable margin ranging from 1.00% to 2.25%. At 25 June 2026 , the applicable margin was 1.00%.
The Bridge Facility Borrower’s obligations under the Bridge Secured Credit Facility are guaranteed by ICON and the subsidiary guarantors party thereto. The Bridge Secured Credit Facility is secured by a lien on substantially all of the assets (subject to certain exceptions) of ICON, the Bridge Facility Borrower and each of the subsidiary guarantors, and the Bridge Secured Credit Facility will have a first-priority lien on such assets which will rank pari passu with the lien securing ICON’s other first lien secured indebtedness and is subject to other permitted liens. The Company is permitted to make voluntary prepayments under the Bridge Secured Credit Facility without premium or penalty (subject to customary break funding payments).
The Bridge Secured Credit Facility contains customary negative covenants, including, but not limited to, restrictions on the ability of ICON and its subsidiaries to merge and consolidate with other companies, incur indebtedness, grant liens or security interests on assets, pay dividends or make other restricted payments, sell or otherwise transfer assets or enter into transactions with affiliates.
The Bridge Secured Credit Facility provides that, upon the occurrence of certain events of default, the obligations under the credit agreement may be accelerated. Such events of default will include payment defaults to the lenders thereunder, material inaccuracies of representations and warranties, covenant defaults, cross-defaults to other material indebtedness, voluntary and involuntary bankruptcy proceedings, material monetary judgments, material pension-plan events, change of control and other customary events of default.
The Group has contractual liabilities for lease arrangements of $153.4 million which will be predominantly settled over the next five year period through cash payments.
Subsequent events
Details of subsequent events are set out in Note 29 Subsequent events in Notes to the Consolidated Financial Statements.
Directors’ Report (continued)
Directors and Company Secretary
The following table sets forth information concerning the composition of the Company’s Board and its committees as of 31 December 2025:
| | | | | | | | |
| Name | | Position |
| Ciaran Murray | | Chair and Director |
Barry Balfe (1)(5) | | Chief Executive Officer and Director |
| | |
Rónán Murphy (2)(3)(5) | | Lead Independent Director |
| Dr. John Climax | | Director |
| Dr. Steve Cutler | | Director |
Eugene McCague (3)(4) | | Director |
Julie O'Neill (2)(3) | | Director |
Dr. Linda Grais (2)(4) | | Director |
Anne Whitaker (4) | | Director |
| Diarmaid Cunningham | | Company Secretary |
(1)Named Executive Officer of the Company.
(2)Member of Compensation and Organisation Committee.
(3)Member of Audit Committee.
(4)Member of Nominating, Sustainability and Governance Committee.
(5)Member of Execution Committee.
On 4 September 2025, the Group announced that Chief Executive Officer (“CEO”), Dr. Steve Cutler, would retire from his role as CEO effective 1 October 2025 and Mr. Barry Balfe, ICON's Chief Operating Officer (“COO”), would succeed Dr. Cutler on that date. Mr. Balfe was also appointed to the Board of Directors effective 3 September 2025. Dr. Cutler resigned from the Board effective 21 May 2026.
Effective 1 June 2026, Mr. Kevin Egan and Mr. Jeff Elliott joined the Board of Directors.
Directors’ remuneration and interests
Details required by Companies Act, section 329, of Directors’ interests in the Group’s shares are set out in Note 10 Payroll and related benefits in Notes to the Consolidated Financial Statements.
Details of the Directors’ remuneration are set out in Note 6 Profit before taxation and Note 10 Payroll and related benefits in Notes to the Consolidated Financial Statements.
Directors’ authority to allot and purchase shares
Under the provisions of the Companies Act 2014 and the Company’s Constitution, the Directors are authorised to allot relevant securities, subject to approval by the shareholders of the Company in general meeting. Such authority is granted by ordinary resolution and is limited in amount and duration in accordance with applicable law. At each Annual General Meeting, shareholders renew the Directors’ authority to allot shares, to disapply statutory pre-emption rights, and to authorise the Company to purchase its own shares within specified limits.
On 18 February 2025, the Company's Board of Directors authorised an additional share repurchase programme under which the Company could acquire up to $750.0 million of the outstanding ordinary shares of the Company (by way of redemption). On 22 July 2025, the Company's Board of Directors authorised a further additional repurchase programme under which the Company could repurchase up to $500.0 million of the outstanding ordinary shares of the Company (by way of redemption).
During the year ended 31 December 2025, 4,504,330 ordinary shares were redeemed by the Company at an average price of $166.51 per share for a total consideration of $750.0 million. As of 31 December 2025, the Company has remaining authorisation (which includes unutilised amounts from previous authorisations) to repurchase up to $750.0 million of ordinary shares under the repurchase programme.
All ordinary shares that were redeemed under the repurchase programmes were cancelled in accordance with the constitution of the Company and the nominal value of these shares transferred to other undenominated capital as required by Irish Company law.
Further detail on the share repurchase programmes is included in Note 22 Share capital in Notes to the Consolidated Financial Statements.
Directors’ Report (continued)
Rights and Obligations attaching to the Company’s shares
The authorised share capital of the Company is €6,000,000 divided into 100,000,000 ordinary shares of €0.06 at 31 December 2025. Holders of ordinary shares will be entitled to receive such dividends as may be recommended by the Board of Directors of the Company and approved by the shareholders and/or such interim dividends as the Board of Directors of the Company may decide. On liquidation or a winding up of the Company, all assets available for distribution will be paid out to the holders of the Company's ordinary shares. Holders of ordinary shares have no conversion or redemption rights. On a show of hands, every holder of an ordinary share present in person or proxy at a general meeting of shareholders shall have one vote with no individual having more than one vote.
Change of control
A certain number of the Group’s customer contracts allow the customer to terminate the contract in the event of a change in control of the Group.
The Senior Secured Credit Facilities, details of which are set out in Note 21 Bank credit lines and loan facilities in Notes to the Consolidated Financial Statements, provides that, upon the occurrence of a change of control, the obligations thereunder may be accelerated.
The New Notes, details of which are set out in Note 21 Bank credit lines and loan facilities in Notes to the Consolidated Financial Statements, provides that, unless the Issuer has previously or concurrently delivered a redemption notice with respect to all the outstanding notes within 30 days following such Change of Control Triggering Event, the Issuer will make an offer to purchase all of the notes on the terms set forth in the indenture.
Furthermore, certain Group companies have entered capital grant agreements with the Irish government agency, Enterprise Ireland, whereby the Group covenants that the controlling interest in the Company will not change without Enterprise Ireland’s prior written consent, which will not be unreasonably withheld.
Additionally, the Company's share option and restricted share unit plans contain change in control provisions which provide for the acceleration of the vesting and exercisability of outstanding options and awards of restricted share units in the event that a change in control occurs with respect to the Company.
Corporate Governance
The Company is listed on the NASDAQ Global Select Market. The Company complies with the corporate governance listing requirements under the NASDAQ marketplace rules.
NASDAQ may provide exemptions from certain NASDAQ corporate governance standards to a foreign private issuer if, among other reasons those standards are contrary to a law, rule or regulation of a public authority exercising jurisdiction over such issuer or contrary to generally accepted business practices in the issuer’s home country of domicile, provided, that, the foreign private issuer properly notifies NASDAQ and makes the required disclosure except to the extent that such exemptions would be contrary to United States federal securities laws.
The exemptions that the Company relies on, and the practices the Company adheres to, are as follows:
•The Company is exempt from provisions set forth in NASDAQ Rule 5620(c), which requires each issuer (other than limited partnerships) to provide for a quorum in its by-laws for any meeting of the holders of common stock, which shall in no case be less than 33.33% of the outstanding shares of the issuer’s common voting stock. The Company’s Constitution requires that only 3 members be present, in person or by proxy, at a shareholder meeting to constitute a quorum. This quorum requirement is in accordance with Irish law and generally accepted business practices in Ireland.
•The Company is exempt from provisions set forth in NASDAQ Rule 5635(c) which requires (other than for certain specified exceptions) shareholder approval prior to the establishment or material amendment of a stock option or purchase plan or other equity compensation arrangement made or materially amended, pursuant to which stock may be acquired by officers, Directors, employees or consultants. Irish law does not require shareholder approval with respect to equity compensation arrangements. Accordingly, the 2019 Consultants and Directors Restricted Share Unit Plan, the 2013 Employees Restricted Share Unit Plan and the amendments to the Employee Share Option Plan 2008 and Consultants Share Option Plan 2008 were adopted by the Board of Directors without shareholder approval.
Directors’ Report (continued)
•The Company is exempt from provisions set forth in NASDAQ Rule 5605(b)(2), which requires independent Directors to hold regularly scheduled meetings at which only independent Directors are present. Irish law does not require independent Directors to hold regularly scheduled meetings at which only independent Directors are present. The Company holds regularly scheduled meetings which all of the Directors may attend and the Lead Independent Director may call meetings of the independent Directors and non-employee Directors of the Board, as appropriate, in accordance with the Lead Independent Director Charter.
The Company's practices with regard to these requirements are not prohibited by Irish law.
Audit Committee
The Audit Committee meets a minimum of four times a year. It reviews the quarterly and annual financial statements, the effectiveness of the system of internal control and recommends the appointment and removal of the external auditors. It monitors the adequacy of internal accounting practices and addresses all issues raised and recommendations made by the external auditors. The Audit Committee pre-approves all audit and non-audit services provided to the Company by its external auditors typically on an annual basis, with updates to such pre-approvals considered on a quarterly basis. Additional audit and non-audit services not covered by the annual or quarterly pre-approvals may be approved by the Audit Committee on a case-by-case basis. Between scheduled meetings, the Chair of the Audit Committee may pre-approve such services, which are subsequently reported to the full Audit Committee at its next meeting. The Audit Committee reviews all services which are provided by the external auditor to review the independence and objectivity of the external auditor, taking into consideration relevant professional and regulatory requirements. The Chief Financial Officer, the Head of Internal Audit, the Chief Administrative Officer and General Counsel and the external auditors normally attend all meetings of the Audit Committee and have direct access to the Committee Chairperson at all times. The Audit Committee is responsible for the oversight and monitoring of the external reporting on environmental, social and governance (“ESG”) matters included in the financial statements and data quality related to such reporting in coordination with the Nominating, Sustainability and Governance Committee. The Audit Committee is currently comprised of three independent Directors: Mr. Rónán Murphy (Chairperson), Mr. Eugene McCague and Ms. Julie O'Neill.
Significant shareholdings
The Company has been notified of the following shareholdings in excess of 3% of the issued share capital of the Company as at 31 December 2025:
| | | | | | | | |
| Name | % | Number of Shares |
| Artisan Partners Limited Partnership | 9.0 | | 6,873,977 |
| Wellington Management Group, LLP | 5.7 | | 4,350,750 |
| Orbis Investment Management Ltd. | 5.5 | | 4,208,000 |
| Invesco Ltd. | 4.9 | | 3,757,896 |
| FMR LLC | 4.0 | | 3,097,895 |
| Principal Financial Group Inc | 3.9 | | 3,001,535 |
| Ninety One UK Limited | 3.8 | | 2,945,810 |
| Harris Associates L.P. | 3.3 | | 2,510,166 |
All Directors, officers and other key employees as a group (1) | 1.2 | | 915,240 |
(1)Includes 373,437 ordinary shares issuable upon the exercise of stock options granted by the Company, 94,875 RSUs awarded by the Company to Directors, officers and other key employees and 36,358 PSUs awarded by the Company to Directors, officers and other key employees. Of the PSUs, performance conditions determine how many of them will vest and, if performance targets are exceeded, additional PSUs will be issued and vest in accordance with the terms of the relevant PSU award, the figure included is the maximum amount of PSUs that may be issued.
Further detailed breakdown of the Directors' interest is included in Note 10 Payroll and related benefits in Notes to the Consolidated Financial Statements.
Subsidiary undertakings
The information required by the Companies Act in relation to subsidiary undertakings is presented in Note 30 Subsidiary undertakings in Notes to the Consolidated Financial Statements.
Political donations
The Group made no disclosable political donations in the period.
Directors’ Report (continued)
Going concern
The time period that the Directors have considered in evaluating the appropriateness of the going concern basis in preparing the 31 December 2025 Consolidated Financial Statements is a period of at least twelve months from the date of approval of these financial statements (the “period of assessment”).
The Group has considerable financial resources and a large number of customers across different geographic areas. Having assessed the relevant business risks (see Appendix A: Risk Factors) the Directors believe that the Group is well placed to manage these risks successfully and they have a reasonable expectation that ICON plc, and the Group as a whole, has adequate financial and other resources to continue in operational existence for the period of assessment with no material uncertainties. For this reason, the Group continues to adopt the going concern basis in preparing the consolidated financial statements.
Accounting records
The Directors are responsible for ensuring that adequate accounting records as outlined in Section 281-285 of the Companies Act, are kept by the Company. The Directors are also responsible for the preparation of the Annual Report. The Directors have appointed professionally qualified accounting personnel with appropriate expertise and have provided adequate resources to the finance function in order to ensure that those requirements are met. The accounting records of the Company are maintained at the Group’s principal executive offices at its registered office at South County Business Park, Leopardstown, Dublin 18.
Statement of relevant audit information
The Directors believe that they have taken all steps necessary to make themselves aware of any relevant audit information and have established that the Company's statutory auditor is aware of that information. In so far as they are aware, there is no relevant audit information of which the Company's statutory auditors are unaware.
Disclosure of non-financial information
The European Union (Disclosure of Non-Financial and Diversity Information by certain large undertakings and groups) Regulations 2017 require disclosure of certain non-financial information by certain large undertakings and groups.
We have sought to address the requirements of the legislation in the sections following.
Business Model
Our mission is to improve the lives of patients by accelerating the development of our customers’ drugs and devices through innovative solutions. We are passionate about providing innovative solutions for customers. ICON is a values-driven company. We focus on agility, collaboration, inclusion and integrity in our work and interactions with our colleagues, suppliers, customers and patients. We are advancing clinical research while offering customers broader and deeper experience, scale, and focus, complemented by continuity of delivery and speed to market. Our business model is described in the “Principal activities, business review and future developments” section of the Directors’ Report. Consistent with our values, we seek to not only operate in compliance with applicable laws but also to positively influence our global workforce, the communities that we operate in, the environment and society as a whole. Doing so makes us a stronger, more resilient organisation by every measure.
Our core values underpin our mission and drive a culture and mind-set of ownership at ICON. “Own it at ICON”, is a statement of values that has remained at the very heart of ICON’s culture, encouraging our people to seize the opportunity and bring flexibility, innovation, and determination to every situation. We believe our culture of ownership personifies who we are as a company - it also helps us apply our expertise, collaborate to get things done, and succeed at our mission. Our values also underpin how we work together to deliver on our mission to improve the lives of patients by accelerating the development of our customers’ drugs and devices through innovative solutions. These values and our Code of Ethical Conduct, which underpins these values, form the core of what we do, and how we do it. It applies to all of our officers, directors, employees, consultants and agents globally. All employees and temporary workers are mandated to complete annual global ethics training and confirm they have read and understood the Code of Ethical Conduct.
At ICON, we care about conducting business sustainably. We care about our people, patients, and the communities in which we live. We care about doing the right thing and we are committed to working to the highest ethical standards and demonstrating our commitment to honesty, transparency, and quality. As a testament to our commitment, we launched our “ICON Cares” programme at the start of 2023 which incorporates all our Environment, Social and Governance (“ESG”) initiatives into one programme. ICON’s Environment, Social, and Governance Committee (“ESG Committee”) brings together all these initiatives and efforts under one umbrella to ensure consistency, enhance monitoring, reveal areas for development and facilitate reporting to the Board.
Directors’ Report (continued)
The Nominating, Sustainability, and Governance Committee of the ICON plc Board has oversight responsibilities in respect to ESG-related strategies and initiatives. The Chief Administrative Officer and General Counsel (“CAO”) chairs the ESG Committee and reports on ESG matters to the Nominating, Sustainability and Governance Committee regularly and reports to the Board at least annually whilst also providing periodic ESG updates to the executive leadership team. ICON’s ESG programme office reports to the CAO and delivers centralised reporting and tracking of ESG initiatives. The Audit Committee has oversight responsibilities in respect to ESG-related reporting in the ICON financial statements. The Chief Financial Officer (“CFO”) reports to the Audit Committee on ESG-related reporting matters.
The ESG Committee is focused on developing our strategy and initiatives relating to the environment, social matters, health and safety, community engagement, corporate governance, sustainability, and other public policy matters relevant to the Company. The ESG Committee is a cross-functional management committee of the Company including representation from facilities, health and safety, corporate communications, finance, legal, investor relations, procurement, commercial, marketing, and human resources departments. The Committee meets regularly to assist and support executive management and the Board and its committees in:
•determining and setting the strategy relating to ESG matters;
•developing, implementing and monitoring initiatives and policies based on that strategy;
•managing ESG related impacts, risks and opportunities; and
•communicating these strategies, initiatives, and their results.
We are committed to building and developing our ESG strategies and reporting. We maintain an ESG page on the external ICON website and have an internal ICON Cares ESG page on our MyICON intranet portal to engage with employees and provide information and updates relating to ESG matters and our commitment to sustainability. In 2021, as a testament to our commitment to managing ICON responsibly and sustainably, we became a participant in the United Nations Global Compact (“UNGC”), a set of Ten Principles covering the areas of human rights, labour, environment, and anti-corruption. In our 2024 ESG report, released in 2025, we reported under the Global Reporting Initiative (“GRI, 2021”) standards, the International Financial Reporting Standards (“IFRS”) S2 index and the Sustainability Accounting Standards Board (“SASB”) index. The report also outlines several ways in which ICON contributes to selected 2030 United Nations Sustainable Development Goals (“SDGs”) and associated targets. The ICON Cares Report summarises our current policies, priorities, commitments, achievements, and progress in respect to ESG matters. In 2026, ICON was awarded a Platinum medal by EcoVadis, achieving a score of 87/100. This represents an improvement on the Silver medal and score of 72/100 received in 2025 in recognition of our environmental, social and governance performance and management efforts across the organisation.
The global landscape in respect to regulatory and legislative requirements relating to ESG reporting and disclosure requirements is rapidly evolving, and we are monitoring potential requirements so that we are positioned to adhere to any additional requirements in due course. This includes mandatory reporting under the Corporate Sustainability Reporting Directive (“CSRD”) from the EU and under the International Financial Reporting Standards (“IFRS”) S1 and S2 standards.
Building a sustainable future – our commitment to the United Nations Sustainable Development Goals
As a global company, we maintain an ethical and sustainable presence in hundreds of locations worldwide. At its core, ICON’s mission is to improve health and lives. We are also committed to contributing to the 2030 United Nations SDGs and are proud that our work contributes to their advancement.
Our research, our work with customers and patients and our on-the-ground efforts to meet the needs across our communities align with the SDGs. We focus these efforts on a subset of themes where we have identified the greatest opportunity to effect change:
•SDG 3 – Good health and well-being
•SDG 9 – Industry, innovation and infrastructure
•SDG 10 – Reduced inequalities
•SDG 12 – Responsible consumption and production
•SDG 13 – Climate action
•SDG 17 – Partnerships for the goals
Further details on the ways ICON contributes to these SDGs and their targets are set out in our ICON Cares Report.
Directors’ Report (continued)
Environment: Conducting business sustainably
ICON is committed to delivering excellence in care to our communities. To improve our overall sustainability, this commitment means tracking and improving our environmental performance across all business activities. We achieve this by pursuing sustainability strategies that recognise the impact of our operations as a CRO on the environment, addressing greenhouse gas (“GHG”) emissions, energy use, waste generation and procurement-related activities. Our employees, directors, officers, contractors, temporary workers, and suppliers are expected to support our sustainability objectives. Similarly, ICON endeavours to support our customers’ sustainability objectives.
Our Global Environmental Management Policy and Environmental Management Plan are part of our ICON Cares programme for managing environmental sustainability initiatives. They define our approach to managing environmental impacts and set goals and targets to reduce energy use and carbon emissions throughout the business. Our Global Environmental Management Policy articulates ICON’s commitment to environmental stewardship, regulatory compliance and climate action across our operations and supply chain. It establishes ICON’s ambition to achieve net‑zero carbon emissions by 2050 and outlines focus areas including energy efficiency, waste reduction, sustainable travel, responsible Policy mandate Risk assessment Targets Measurement procurement, renewable energy adoption and Scope 1, 2 and 3 emissions tracking, aligned with leading reporting frameworks. The implementation of the policy and plan is led by our facilities team, reporting to our CAO. The CAO is responsible for reporting on the ICON Cares programme and environmental initiatives and progress to the ICON executive leadership team and Nominating, Sustainability and Governance Committee and the Board.
ICON established environmental targets in 2019 focused on renewable energy usage and energy consumption reduction. These targets included achieving 100% renewable electricity by 2025 and a 20% reduction in electricity consumption (kWh) by 2030. In 2025, ICON achieved 97% renewable electricity usage. The remaining 3% reflects limitations in procuring credible Energy Attribute Certificates (“EACs”) due to geopolitical disruptions and regional market constraints in certain jurisdictions, specifically Russia, Belarus, Ukraine, Georgia, and Estonia.
In October 2024, the Science Based Target initiative (“SBTi”) validated ICON’s near- and long-term science-based emissions reduction targets. The SBTi has also verified ICON’s net-zero science-based target (“SBT”) by 2050. The SBTi is a corporate climate action organisation that enables companies and financial institutions worldwide to play their part in combating the climate crisis. ICON’s SBTi validated targets:
Near-term targets:
•Reduce absolute scope 1 and 2 GHG emissions 61.2% by FY2028 from a FY2019 base year.
•Reduce absolute scope 3 GHG emissions 20.0% by FY2028 from a FY2022 base year.
Long-term targets:
•Reduce absolute scope 1 and 2 GHG emissions 90.0% by FY2050 from a FY2019 base year.
•Reduce absolute scope 3 GHG emissions 90.0% by FY2050 from a FY2022 base year.
Net-zero target:
•Reach net-zero greenhouse gas emissions across the value chain by FY2050.
We have programmes in place to manage and minimise climate impacts of business activities. To continue to improve processes and reduce our environmental impact, we track, calculate, and report our Scope 1, Scope 2 and Scope 3 GHG footprint. We apply the GHG Protocol Corporate Accounting and Reporting Standard, which is the global corporate accounting and reporting standard for calculating carbon emissions. External verification of our 2025 Scope 1, 2 and 3 GHG emissions data is currently in progress. During 2024, we began our 2022 and 2023 Scope 3 emissions foot printing, incorporating this into our annual emissions reporting.
In respect to ICON’s carbon emissions for the year ended 2025, ICON’s combined Scope 1 and 2 GHG emissions have decreased since 2019, and our scope 3 GHG emissions have decreased since 2022.
In 2020, following pandemic-related closures and a reduction in business travel, our Scope 3, business travel GHG emissions declined significantly. Since 2021 up to the year ended 2025, as more normal business travel operations resumed, we have seen an overall increase in our total GHG emissions driven by an increase in business travel (Scope 3).
Moving forward, ICON expects to see further emission reductions relative to revenue and the number of employees due to a reduction in offices, strategic energy efficiency projects and a flexible work policy that allows eligible employees to work from home 40% of the time.
Directors’ Report (continued)
ICON participates annually in the CDP (formerly the Carbon Disclosure Project), a globally recognised platform that enables companies to assess and manage their environmental impacts. For 2025, ICON received a B score from CDP for its Climate Change response on 2024 activity, representing an improvement from the B‑ score received in the prior year.
We are focused on reducing energy use and increasing renewable energy across our global operations as part of our environmental goals. In 2025, 97% of our electricity consumption came from renewable sources, achieved through a combination of switching direct tariffs and purchasing EAC’s. Waste reduction is embedded into our environmental policies and practices and is one of the objectives of ICON’s Environmental Management Policy.
ICON leases most of our offices and facilities, and therefore we work closely with our landlords and leasing agents to implement measures to ensure we operate in an environmentally sustainable manner. In 2025, we continued with our real estate harmonisation efforts and aligning ourselves to new working styles & business needs. This resulted in downsizing or closing 19 locations overall, helping to reduce our environmental footprint. Experts from our real estate team factor environmental considerations into decisions around new office locations or building improvements. We have also implemented a series of measures globally to reduce the local footprint of our offices while promoting comfort and efficiency. These include:
•Installing energy-efficient LED lighting.
•Using motion detectors.
•Purchasing recycled office supplies.
•Reducing paper consumption by promoting paperless office processes and defaulting double-sided output.
•Building recycling areas into business centres and kitchens/canteens.
•Planting green spaces to improve internal air quality.
•Selecting building materials and vendors for their low environmental impact.
As part of our onboarding process, we require our suppliers to abide by our Global Supplier Code of Conduct which outlines our expectations around conducting business in a sustainable manner. The code requires suppliers to comply with all applicable environmental laws and regulations and to have systems in place with regards to waste management and sustainable use of resources.
For further details on risks relating to environmental, social and governance matters refer to Appendix A: Risk Factors.
Social: The power of our people
Oversight of social and employee-related policies and initiatives is embedded within our governance framework, with responsibility shared across the Board and its committees, including the Compensation and Organisation Committee in respect of human capital matters and the Nominating, Sustainability and Governance Committee in respect of broader ESG oversight.
Community
We are dedicated to making a positive impact on the communities where we work and live. Our community efforts are aligned with a broader vision for social impact and we are committed to furthering the United Nations Sustainable Development Goals (“SDGs”).
Our community engagement activities are focused on two core areas:
•Supporting education and building closer ties between industry and academia; and
•Improving the welfare of people in the communities in which we live.
Supporting education and building closer ties between industry and academia
A core area of community support includes building ties between industry and academia to inspire the next generation of leaders in business and science. To help achieve this, ICON provides university scholarships to students in Ireland and America. An example of one of our partnerships is:
•Partnership with Junior Achievement to inspire schoolchildren. Junior Achievement encourages young people to remain in education and teaches them the skills they need to succeed in a changing world. ICON volunteers take time out of their working day to deliver Junior Achievement programmes, teaching primary and secondary-level students valuable business, STEM (Science, Technology, Engineering & Mathematics) and entrepreneurship skills that will serve them throughout their professional lives. Our strong partnership with Junior Achievement Ireland has been in place since 2018 and we continued our Junior Achievement partnership in India for 2025.
Directors’ Report (continued)
Improving the welfare of people in the communities in which we live
Through volunteering, donations and other charitable initiatives, our employees across the world are making a positive difference to their communities. We support causes that are important to our employees and have several programmes that support the welfare of people in our local communities. Since 2012, ICON’s annual employee-nominated charity donation programme has supported over 130 charities worldwide, donating $10,000 to each organisation. These charities address a range of critical issues, such as fostering a more inclusive society, improving child welfare, and supporting patients battling chronic diseases. The chosen organisations reflect ICON’s corporate mission, aligning with our ICON Cares programme. In 2025, we also donated $20,000 to UNICEF, providing support for its year-round humanitarian relief efforts. Through ICON’s Charity Matching Programme, which bolsters our colleagues’ fundraising efforts and fosters partnership across and within teams, 22 organisations were supported during 2025. This programme aligns with the ICON Cares social pillar, as well as our company values of integrity, collaboration, agility and inclusion.
Talent and People
Our people are core to our ability to deliver our services and drive better patient outcomes. Through industry-leading talent management practices, a sincere attention to our employees’ needs, well-being and health and safety, we continue to power the potential of together.
The Chief Human Resources Officer (“CHRO”) is responsible for the development and implementation of the Company’s human capital strategies, policies and initiatives, including those relating to talent development, culture and employee experience. The CHRO supports management oversight of employee-related matters and reports regularly to the leadership team, the Compensation and Organisation Committee and the Board on human capital strategy, performance and related risks.
At the core of our strategy is our people
People have long been central to our mission to improve the lives of patients by accelerating the development of our customers’ drugs and devices through innovative solutions. We encourage our people to bring flexibility, innovation, and determination to every situation. By doing so, our people can build exciting and rewarding careers, and deliver results to bring life-changing medicines to market and to maintain our success as an industry leader.
Learning and development of our staff is a key focus for us
Our leadership and talent programmes contribute to the enhanced retention of our employees, better project deliverables for our customers and the enhanced financial performance of the business.
We aim to be an industry leader where talented people come to do important work and where our employees can shape the future of healthcare, grow their careers, and reach their full potential. We have long held a deep commitment to cultivating strong people practices. This includes competitive total rewards packages along with a focus on continuous learning. We nurture a culture of development and aim to boost engagement by supporting our people’s growth, both personally and professionally. We are dedicated to finding opportunities for our employees to grow and develop.
Our success depends on the knowledge, capabilities, and quality of our people. To improve their skills, we are committed to providing continuous learning. This commitment is underpinned by clearly defined competencies, which offer employees a clear path along which to develop skills and advance their careers.
To support employees at every stage of their career journeys, training and development programmes are aimed at advancing scientific, technical, and business knowledge as well as behavioural competencies. Programmes include Corporate and Functional Onboarding for all ICON employees; tailored Clinical Research Associate (“CRA”) academies; Data Management and Biostats & Programming Academies; a Commercial Skills Academy; a range of project management curricula, therapeutic-focused programmes, and People Leader development programmes.
We are focused on retaining the best talent by ensuring employees are aware of what career opportunities exist at ICON. We have invested in our career platforms to ensure employees understand the career opportunities that are available across the organisation, providing them with a platform in our HR system to share and capture their skills, interests and career aspirations which enables People Leaders and employees to have better conversations on careers as part of our performance management process. This allows us to get a better understanding of the skills that exist today across the organisation, within service lines and teams so we can better serve our customers.
Our People Leader development programme focuses on providing our People Leaders with the relevant skills to effectively manage themselves, their team and their business, including leveraging psychometrics to raise awareness of their behavioural preferences and the preference of others. ICON also invests in Harvard Manage Mentor, an online learning platform providing People Leaders with access to learning available at any time with topics ranging from change management, retaining employees and developing employees.
Directors’ Report (continued)
We provide our people with a personalised and flexible learning experience, delivered through a combination of in-person and technology-driven programmes that suit their learning styles and can flex to suit their schedules. Through our industry leading Career Hub, ICON employees are encouraged to broaden their scientific, technical, leadership, and business knowledge. By tapping into development programmes and partnerships with leading academic institutions, team members can use the hub to develop competencies that advance their careers. We also collaborate with UCD Smurfit School Executive Development to deliver customised leadership development programmes for global employees.
As an organisation we are keen to hear directly from our employees
To attract and retain the best talent, we must listen and respond to employees’ needs. This extends to every aspect of our work, from recruitment and onboarding, to training, engagement, enablement, and reward. We pursue best-in-class approaches to building employee engagement and these include, among others:
•Comprehensive global employee surveys, which measure how people feel about their work and whether they feel they have the tools to do their jobs well. Feedback from these studies informs detailed action plans at the Group, function, and team level.
•Pulse check surveys, which are smaller-scale studies designed to measure employee sentiment on specific topics and initiatives.
•Fostering an environment of inclusion and belonging where everyone is valued.
•Stay interviews to help managers understand why staff stay and to uncover what might put them at risk of departing.
•Skip-level meetings to develop trust and rapport between senior leaders and employees.
Our listening strategy supports our efforts to reduce employee turnover, which we monitor closely through analytics. Qualitative information is collected through formal exit interviews and, where we believe they’ll make an impact, we intervene via retention plans and related efforts.
Employee well-being
ICON’s commitment to improving health and enriching lives extends beyond the work we do with our customers. Employees worldwide have access to tools and resources designed to support all facets of their well-being, from physical to financial to psychological and beyond.
Our global Employee Assistance Programme (“EAP”) ensures that all employees, and their families, have access to professional mental health, financial and relationship support on a confidential basis. Employees can also access a wide range of tools, information and support services online in local languages.
Health and safety
At ICON, the health and safety of our employees, customers and clinical trial patients are our most important priorities. We take guidance from global and regional health authorities and governments to protect the safety and welfare of employees, as well as abide by government directives. Our global health and safety management system ensures we deliver on all local and national requirements. Our priority objectives are the safety of our staff, clinical trial patients, protecting the environment, maintaining business continuity, and ensuring all sensitive health and safety data is protected.
We are committed to providing a safe working environment for our people. We achieve this goal by working in ways that protect the safety, health, and welfare of all our employees, clinical trial patients, and visitors. Risk assessment is the basis of the safety management system, and we work to identify, mitigate, and monitor existing and emerging health or environment risks that may be associated with our business activities.
Fair employment practices
We are committed to being a workplace where all employees are included and feel a sense of belonging. As a global, values-driven organisation, we acknowledge and celebrate our differences. Respecting viewpoints and experiences is foundational to our interactions with each other and with our patients, customers and suppliers. Moreover, we strive to build teams that reflect the various geographies and communities in which we live and work and the patients we serve.
We have a strong focus on talent management, succession planning and talent development to ensure we work towards building strong talent pipelines with the best candidate appointed, based on a fair and unbiased selection process where merit, experience and performance form the basis for hiring and promotion decisions.
Establishing a truly inclusive workplace requires offering fair pay. As part of these efforts, we use best-in-class methodology to regularly review salary ranges. We adhere to a pay-for-performance philosophy and framework that enables us to continuously track fair-pay practices and analyse and audit global pay equity on a regular basis. We have structured our pay principles in such a way that individual differences beyond tenure, experience or performance criteria do not factor into how we provide rewards. ICON has invested in organisational design structures, tools and education to uphold these principles.
Directors’ Report (continued)
We are committed to ensuring fair employment practices. For every jurisdiction in which we operate, we act in compliance with relevant laws relating to labour rights and labour relations as well as market competitive benefits. We believe in fair and equal treatment for all our people, without regard to gender, race, ethnicity, sexual orientation, marital status, physical or mental disability, age, pregnancy, veteran status, nationality, religion, or any other legally protected status. We do not tolerate our employees being subjected to physical, sexual, racial, psychological, verbal, or any other form of harassment. We encourage our employees to report any issues of harassment or discrimination. We prohibit retaliation against any employee who rejects, protests, or complains about unlawful discrimination or harassment.
For further details on risks relating to employee matters refer to Appendix A: Risk Factors.
Human rights
ICON is committed to human rights. ICON’s ESG Committee provides management-level oversight of human rights policies and practices. The Board’s NSG Committee has primary oversight of human rights matters. Since 2021, ICON has been a signatory of the UN Global Compact (“UNGC”), demonstrating our commitment to upholding the UNGC’s Ten Principles, including those related to human rights across our global operations. Our business model and our policies, including our Global Code of Ethical Conduct and Global Supplier Code of Conduct, are intended to fully comply with applicable human rights legislation in the countries where we operate. Our zero-tolerance policy on forced labour, slavery, and human trafficking is defined clearly in these policies, which are available to employees, suppliers, customers, and the public.
We are opposed to forced labour, slavery, and human trafficking. We will not knowingly support or conduct business with any organisation involved in such activities. We do not employ anyone below the minimum employment age in the jurisdictions in which we operate.
Our Global Supplier Code of Conduct incorporates the Pharmaceutical Supply Chain Initiative (“PSCI”) principles for responsible supply chain management, including for labour. Before doing business with ICON, suppliers must certify that they will comply with the ICON Global Supplier Code of Conduct or their own materially equivalent internal code, which includes human rights protections. We perform pre-engagement due diligence on our suppliers, including in relation to labour issues, which we support through periodic re-screening. We hold our suppliers accountable for meeting their contractual obligations. Contract non-compliance can result in termination of the business relationship with the supplier and exclusion from future business.
For further details on risks relating to environmental, social and governance matters refer to Appendix A: Risk Factors.
Ethics and Compliance
ICON’s commitment to ethics and integrity is embedded in our company values. We require all directors, employees, consultants, agents and third parties acting on ICON's behalf to act with integrity and integrate ethical principles into our business practices and culture. ICON’s Global Code of Ethical Conduct (“the Code”) establishes our core principles and standards for honest, fair, and ethical behaviour. This Code addresses the core values expected of all personnel in our internal interactions with each other as well as in external dealings with patients, customers, healthcare professionals, regulators, investors, vendors and other third parties.
Our Ethics and Compliance programme is designed to protect the interests of the company and its shareholders by preventing, detecting, investigating and responding to potential misconduct and violations.
The Ethics & Compliance team provides day-to-day independent oversight for the programme. The team works collaboratively with risk and compliance functions and leadership across the business to align on and optimise its reach and impact. The programme is overseen by the CAO, who reports on the programme to ICON’s executive leadership team, the Nominating, Sustainability and Governance Committee and the Board. The programme supports all functional areas globally and is dedicated to the implementation of standardised global policies, procedures, training, guidance, communications, monitoring, investigations, issue management, assessing compliance-related risk and mitigations, and reporting to ensure the overall compliance programme is effectively functioning. Where appropriate, the programme also implements regional and/or country specific policies, procedure, training and guidance.
ICON uses Ethics Line, a system for employees and third parties to confidentially report ethics and compliance questions, as well as concerns, and to track reports through follow-up and resolution. An independent company administers this hotline, which is available all hours of every day and can accommodate reports in over 75 languages. These tools also provide visibility into our risks while highlighting opportunities to address them. ICON’s Ethics and Compliance programme will continue to grow and evolve in response to changes in our business and in the global business climate.
All personnel are required to complete ethics and compliance training during initial onboarding and complete annual refresher sessions. Training modules explain the channels available for reporting suspected unethical or illegal practices.
Directors’ Report (continued)
The training supports our values and our ways of working and incorporates the key principles of our policies and codes and includes interactive scenarios where applicable.
At ICON, we promote a Speak Up culture that encourages compliance, openness, and accountability without retaliation. The Speak Up Policy aims to support our culture and values and seeks to encourage the prompt reporting or surfacing of concerns or violations about values, ethics or other standards without fear of retaliation. Reported ethics concerns and other ethics and compliance-related data are reported via the CAO to the Board as appropriate.
For further details on risks relating to ethics and compliance refer to Appendix A: Risk Factors.
Anti-bribery and Corruption
ICON is guided by the foundational principle that we do not tolerate bribery or any other form of corruption or fraud. Our anti-bribery and anti-corruption (“ABAC”) programme is a core element of our Ethics and Compliance programme. ICON and all ICON directors, employees, consultants, agents and all third parties acting on ICON's behalf must act in compliance with international laws and regulations relating to bribery, corruption, and illicit payments, including but not limited to the US Foreign Corrupt Practices Act and the UK Bribery Act 2010.
ICON maintains the ISO 37001:2016 certification for our Anti-Bribery Management System, which establishes the framework for the controls that prevent, detect and mitigate the risk of bribery. Our programme is designed to ensure our compliance with anti-corruption laws, including due diligence, training, policies, procedures, and internal controls.
Bribery and corruption remain a business risk as we conduct our business across the globe and enter partnerships and collaborations. There is no certainty that all employees and third-party business partners (including our vendors, suppliers, agents, contractors, and other partners) will comply with anti-bribery laws. When working with third parties, we are committed to working with only those who embrace high standards of ethical behaviour consistent with our own. Bribery and corruption risks are a focus of our third-party diligence and management process. We hold our suppliers accountable for meeting their contractual obligations with ICON, including commitments that are made with regard to our Global Supplier Code of Conduct and regulatory compliance. Contract non-compliance can result in termination of the business relationship with the supplier and exclusion from future business with ICON.
ICON's Internal Audit teams conduct ABAC programme audits. Internal Audit focuses on testing for compliance and design effectiveness of the overall ABAC programme. Internal Audit incorporates an assessment of ABAC measures in audits, as appropriate. In this approach, bribery and corruption risks are incorporated into the risk assessment and scoping process of each audit.
For further details on risks relating to Anti-bribery and Corruption refer to Appendix A: Risk Factors.
Privacy and Information Security
Data privacy and information security are fundamental to our business and key to retaining customers, building investors’ trust, protecting data subjects who entrust their personal information to us, and complying with global and regional regulations. We recognise and respect that our customers, employees, participants, and all those who do business with us expect that we will protect their personal information in accordance with our legal obligations and policy commitments. ICON´s commitment to privacy and information security is demonstrated through the implementation of robust privacy and information security programmes.
ICON’s Global Data Protection programme is overseen by the CAO. This programme governs ICON’s and its employees’ obligations concerning the processing of personal data. The programme consists of a Global Data Protection Officer (“DPO”), a team of privacy lawyers and specialists and corporate policies and procedures regulating how we address our data protection obligations in the countries we operate in, including our obligations under the EU General Data Protection Regulation (“GDPR”) e.g. fulfilment of data subject rights, data protection impact assessments, our obligations to maintain records of processing activities (“ROPAs”) and management of personal data incidents and breaches in accordance with data protection laws. ICON´s Global Data Protection programme supports compliance with fundamental data protection principles including transparency, data minimisation, accountability and security. ICON has embedded privacy by design considerations in product and process development and implements a robust set of technical and organisational measures to protect personal information processed by ICON.
ICON’s Personal Data Incident and Breach Response Policy and Process governs the management of personal data incidents and breaches within ICON. The policy requires incidents to be reported to ICON’s DPO and Privacy Team, who manage them in collaboration with relevant internal stakeholders (e.g., IT Security, Quality & Compliance), to ensure we comply with our legal and contractual obligations, including our reporting obligations. ICON’s data protection policies and procedures are independently audited as part of ICON maintaining an ISO 27701 certification that it initially achieved in 2023.
Directors’ Report (continued)
Our people and partners play a critical role in safeguarding data. ICON has training in place for all employees and contingent workers on information security and privacy practices so that they understand their responsibilities with respect to data security and privacy. ICON has also established a robust Privacy and Security Champion (“PSC”) network. The PSC network acts as an extension of the Privacy and Information Security teams. In line with the PSC charter, champions provide a key touch point in relevant business units, bolster awareness of ICON’s respective privacy and security programmes and provide direct support in response to priorities dictated by ICON’s Privacy and Security Council (chaired by ICON’s DPO and the Vice President of Cyber & Information Security).
For further details on risks relating to information security and privacy refer to Appendix A: Risk Factors.
Responsible Use of Artificial Intelligence
ICON is committed to the responsible and ethical use of artificial intelligence (“AI”) across our operations. Our approach to AI is guided by a framework of governance, regulatory compliance and respect for client confidentiality and intellectual property. Human judgment and oversight remain integral to the design, deployment and monitoring of AI-enabled solutions. We have structured governance mechanisms and key oversight provisions to comply with the EU AI Act and other laws and support the goals of our AI Ethical Principles.
We have implemented an Artificial Intelligence Governance Policy and a set of AI Ethical Principles which are supported by existing policies relating to data protection and information security, intellectual property, IT governance and supplier management, which apply to the development and use of AI tools.
AI governance is overseen by an AI Governance Committee comprising representatives from IT Digital Operations, Enterprise AI & AI Centre of Excellence (“CoE”) team, Legal, Global Data Protection, Operations and IT Information Security functions and other relevant functions. It operates under the direction of, and reports to, the Chief Information Officer (“CIO”) and the CAO. The AI Screening Committee, a sub-committee of the AI Governance Committee, reviews proposals for AI deployment. AI governance processes are integrated into our overall risk management process, which is monitored by the executive leadership team and reported to the Board. The CIO and CAO provide the Board with AI governance updates as required.
ICON has expanded its IT trainings and digital literacy programmes to include AI education, providing training and resources to enhance AI literacy across our workforce in support of responsible AI adoption. We also maintain an internal AI Champions Network to promote best practices across the organisation.
For further details on risks relating to Artificial Intelligence matters refer to Appendix A: Risk Factors.
Sustainable procurement
ICON maintains policies and processes to support responsible, sustainable, and ethical business practices. Our goal is to source from suppliers whose values align with our own, and who are socially and environmentally responsible and conscious. In 2024 we launched a Sustainable Procurement Policy that outlines our expectations for suppliers relating to sustainability. This policy applies to all suppliers and aims to ensure ICON maintains a responsible and sustainable supply chain.
We manage our suppliers through our Global Procurement department. The onboarding of all new suppliers is completed through a robust centrally managed due diligence process. Environmental sustainability, bribery, and corruption risks are a focus of our third-party assessment and management process.
ICON performs pre-engagement due diligence on our suppliers. This includes screening of sanctions lists, debarment, and adverse media. Suppliers are continuously monitored against sanctions and debarment lists and are periodically re-screened. Suppliers deemed higher risk are subject to enhanced due diligence and controls, which may include periodic training, auditing, and assessments.
As part of our onboarding process, we require our suppliers to abide by our Global Supplier Code of Conduct which incorporates the Pharmaceutical Supply Chain Initiative (“PSCI”) principles for Responsible Supply Chain Management and sets out our standards and expectations regarding:
•Ethics and compliance
•Labour and human rights
•Health and safety
•Environmental stewardship
Directors’ Report (continued)
Our Global Supplier Code of Conduct also outlines channels to report concerns or grievances related to our suppliers, such as our Ethics Line. We operate a strict anti-retaliation policy and expect suppliers to do the same. We hold our suppliers accountable for meeting their contractual obligations, including commitments relating to the Global Supplier Code of Conduct and regulatory compliance. Contract non-compliance can result in termination of the business relationship and exclusion from future business with our company.
To further support the development of our sustainable procurement programme, ICON has continued to engage with suppliers via Watershed and EcoVadis to assess data about sustainability maturity and greenhouse gas (GHG) emissions. With this data, we can factor sustainability-related criteria into our supplier selection process and build sustainability into our procurement practices.
For further details on risks relating to sustainable procurement refer to Appendix A: Risk Factors.
Directors’ compliance statement
The Directors, in accordance with Section 225(2) of the Companies Act, acknowledge that they are responsible for securing the Company’s compliance with its relevant obligations as defined within the Companies Act, (hereinafter called the relevant obligations).
The Directors confirm that:
•a compliance policy statement has been drawn up setting out the Company’s policies with regard to such compliance;
•appropriate arrangements and structures that, in their opinion, are designed to secure material compliance with the Company’s relevant obligations, have been put in place; and
•a review has been conducted, during the financial year, of the arrangements and structures that have been put in place to secure the Company’s compliance with the relevant obligations.
Auditor
In 2023, the Audit Committee of the Group conducted a competitive audit tender process for the position of statutory auditor. Based on the results of this process, the Audit Committee recommended that Ernst & Young be appointed as statutory auditor and independent registered public accounting firm to the Group in respect of the financial year ending 31 December 2025. Ernst & Young were engaged on 20 March 2025, and their appointment was confirmed by the passing of an ordinary resolution at the Company's 2025 Annual General Meeting.
Our previous independent registered public accounting firm, KPMG, resigned as of 29 April 2025.
In accordance with Section 383(2) of the Companies Act 2014, the auditor, Ernst & Young will continue in office.
On behalf of the Board
| | | | | | | | |
| Barry Balfe | Rónán Murphy | 25 June 2026 |
Chief Executive Officer | Director | |
Statement of Directors’ Responsibilities in respect of the Directors’ report and the financial statements
The directors are responsible for preparing the annual report and the financial statements in accordance with applicable law and regulations.
Irish Company law requires the directors to prepare Group and Company financial statements for each financial year. Under that law, the directors are required to prepare the Group financial statements in accordance with IFRS as adopted by the European Union. The directors have elected to prepare the Company financial statements in accordance with FRS 101 Reduced Disclosure Framework and applicable law.
Under company law the directors must not approve the Group and Company financial statements unless they are satisfied that they give a true and fair view of the assets, liabilities and financial position of the Group and Company and of the Group’s profit or loss for that year.
In preparing the Group and Company financial statements, the directors are required to:
•select suitable accounting policies and then apply them consistently;
•make judgements and estimates that are reasonable and prudent;
•state whether applicable Accounting Standards have been followed, subject to any material departures disclosed and explained in the financial statements;
•assess the Group and Company’s ability to continue as a going concern, disclosing, as applicable, matters related to going concern; and
•use the going concern basis of accounting unless they either intend to liquidate the Group or Company or to cease operations, or have no realistic alternative but to do so.
The directors are responsible for keeping adequate accounting records which disclose with reasonable accuracy at any time the assets, liabilities, financial position of the Group and Company and the profit and loss of the Group and which enable them to ensure that the financial statements comply with the provision of the Companies Act 2014. The directors are also responsible for taking all reasonable steps to ensure such records are kept by its subsidiaries which enable them to ensure that the financial statements of the Group comply with the provisions of the Companies Act 2014. They are responsible for such internal controls as they determine are necessary to enable the preparation of financial statements that are free from material misstatement, whether due to fraud or error, and have a responsibility for safeguarding the assets of the Company and the Group, and hence for taking reasonable steps for the prevention and detection of fraud and other irregularities. The directors are also responsible for preparing a directors’ report that complies with the requirements of the Companies Act 2014.
The directors are responsible for the maintenance and integrity of the corporate and financial information included on the Group’s and Company’s website www.iconplc.com. Legislation in the Republic of Ireland concerning the preparation and dissemination of financial statements may differ from legislation in other jurisdictions.
On behalf of the Board
| | | | | | | | |
| Barry Balfe | Rónán Murphy | |
Chief Executive Officer | Director | |
INDEPENDENT AUDITOR’S REPORT TO THE MEMBERS OF ICON PLC
Report on the audit of the financial statements
Opinion
We have audited the financial statements of ICON plc (‘the Company’) and its subsidiaries (‘the Group’) for the year ended 31 December 2025, which comprise the Consolidated Statement of Profit and Loss, Consolidated Statement of Comprehensive Income, Consolidated Statement of Financial Position, Consolidated Statement of Changes in Equity, Consolidated Statement of Cash Flows, the Company Statement of Financial Position, Company Statement of Changes in Equity and the notes to the financial statements, including the material accounting policy information set out in Note 1. The financial reporting framework that has been applied in their preparation is Irish Law and International Financial Reporting Standards (IFRS) as adopted by the European Union and, as regards the Company financial statements, Accounting Standards including FRS 101 Reduced Disclosure Framework issued in the United Kingdom by the Financial Reporting Council.
In our opinion:
•the Group financial statements give a true and fair view of the assets, liabilities and financial position of the Group as at 31 December 2025 and of its profit for the year then ended;
•the Company financial statements give a true and fair view of the assets, liabilities and financial position of the Company as at 31 December 2025;
•the Group financial statements have been properly prepared in accordance with IFRS as adopted by the European Union;
•the Company financial statements have been properly prepared in accordance with FRS 101 Reduced Disclosure Framework; and
•the Group and Company financial statements have been properly prepared in accordance with the requirements of the Companies Act 2014.
Basis for opinion
We conducted our audit in accordance with International Standards on Auditing (Ireland) (ISAs (Ireland)) and applicable law. Our responsibilities under those standards are further described in the Auditor's Responsibilities for the Audit of the Financial Statements section of our report. We are independent of the Group and Company in accordance with ethical requirements that are relevant to our audit of financial statements in Ireland, including the Ethical Standard as applied to listed entities issued by the Irish Auditing and Accounting Supervisory Authority (IAASA), and we have fulfilled our other ethical responsibilities in accordance with these requirements.
We believe that the audit evidence we have obtained is sufficient and appropriate to provide a basis for our opinion.
INDEPENDENT AUDITOR’S REPORT TO THE MEMBERS OF ICON PLC (continued)
Report on the audit of the financial statements (continued)
Conclusions relating to going concern
In auditing the financial statements, we have concluded that the directors’ use of the going concern basis of accounting in the preparation of the financial statements is appropriate. Our evaluation of the directors’ assessment of the Group and Company’s ability to continue to adopt the going concern basis of accounting included:
•In conjunction with our walkthrough of the financial reporting process, we confirmed our understanding of management’s going concern assessment process and also engaged with management to ensure all key factors were considered in their assessment.
•We obtained management’s going concern assessment including the cash forecast for the going concern period which covers a year from the date of signing this audit opinion.
•We considered the appropriateness of the methods used to calculate the cash forecasts and determined through inspection and testing of the methodology and calculations that the methods utilised were appropriately designed to be able to make an assessment for the Group.
•We reviewed the Group’s non-operating cash outflows and evaluated the Company’s ability to control these outflows as mitigating actions if required. We also reviewed the credit facilities available to the Group.
•We have performed reverse stress testing in order to identify what factors would lead to the Group utilising all liquidity during the going concern period.
•We reviewed the Group’s going concern disclosures included in the annual report in order to assess that the disclosures were appropriate and in conformity with the reporting standards.
Conclusion
Based on the work we have performed, we have not identified any material uncertainties relating to events or conditions that, individually or collectively, may cast significant doubt on the Group or the Company’s ability to continue as a going concern for a period of at least twelve months from when the financial statements are authorised for issue.
Our responsibilities and the responsibilities of the directors with respect to going concern are described in the relevant sections of this report. However, because not all future events or conditions can be predicted, this statement is not a guarantee as to the Group’s ability to continue as a going concern.
INDEPENDENT AUDITOR’S REPORT TO THE MEMBERS OF ICON PLC (continued)
Report on the audit of the financial statements (continued)
Key audit matters
Key audit matters are those matters that, in our professional judgment, were of most significance in our audit of the financial statements of the current period and include the most significant assessed risks of material misstatement (whether or not due to fraud) that we identified, including those which had the greatest effect on: the overall audit strategy, the allocation of resources in the audit; and directing the efforts of the engagement team. These matters were addressed in the context of our audit of the financial statements as a whole, and in forming our opinion thereon, and we do not provide a separate opinion on these matters.
| | | | | | | | |
| Risk | Our response to the risk | Key observations communicated to the Audit Committee |
Management override of internal controls, and related prior period restatements (Group financial statements)
As described in Note 1, following concerns reporting to the Audit Committee through Company management with respect to certain accounting practices and controls, the Audit Committee engaged outside legal counsel, who were supported by forensic and technical accounting firms, to conduct an investigation (the “Investigation”).
As detailed in Note 1, the Investigation identified a number of significant findings which resulted in the restatement of the 2024 financial statements.
Due to the significance of these matters, the judgement involved, and the audit effort required, we identified Management override of internal controls, and related prior period restatements, as a key audit matter. | To address the matter, the most experienced audit team members were involved throughout the audit to apply their judgement in assessing changes required to the originally planned audit scope and approach, including as it pertains to the nature, timing and extent of incremental audit procedures. These incremental procedures included, among others: –engaging our forensic specialists to examine the scope and results of the work carried out through the Investigation by holding discussions with outside legal counsel and forensic and technical accounting firms, reviewing their supporting evidence, performing additional procedures which included considering the sufficiency and appropriateness of the investigation performed and the competency and objectivity of individuals undertaking it; –changes to our audit scope, testing incremental accounts, lowering our testing thresholds, increasing sample sizes, and –involving additional experienced audit team members to evaluate the audit judgements made and evidence obtained. We performed procedures on the prior period adjustments determined by Management to assess the completeness, accuracy, and timing of these adjustments.
| Our observations included an overview of the risk, an outline of the audit procedures performed, the judgements we focused on and the results of our testing.
Our planned audit procedures in respect of the risk of management override of internal controls, and related prior period adjustments were completed without exception. |
INDEPENDENT AUDITOR’S REPORT TO THE MEMBERS OF ICON PLC (continued)
Report on the audit of the financial statements (continued)
Key audit matters (continued)
| | | | | | | | |
| Risk | Our response to the risk | Key observations communicated to the Audit Committee |
Management override of internal controls, and related prior period restatements (Group financial statements) (continued)
| We assessed the judgements and assumptions used by reference to evidence obtained through the findings of the Investigation, our knowledge of the matters, our understanding of the business and our other audit procedures. We audited the disclosures of the prior period adjustments as reflected in Note 1 to the Group financial statements for compliance with the requirements of IAS 8 Accounting Policies, Changes in Accounting Estimates and Errors. We read all disclosures in the Annual Report and Accounts associated with these matters, including the description of the implications they had on the Board of Directors' Report on their review of the effectiveness of the Group's risk management and internal control systems, and considered whether the other information is materially inconsistent with the financial statements, our knowledge obtained in the audit or otherwise appears to be materially misstated.
| |
INDEPENDENT AUDITOR’S REPORT TO THE MEMBERS OF ICON PLC (continued)
Report on the audit of the financial statements (continued)
Key audit matters (continued)
| | | | | | | | |
| Risk | Our response to the risk | Key observations communicated to the Audit Committee |
Revenue recognition for clinical trial service contracts (2025: US$8,251.3 million, 2024: US$8,189.0 million (restated))
As described in Notes 1 and 3 to the consolidated financial statements, the Company’s revenue for the year ended 31 December 2025, was US$8,251.3 million. A material portion of the Company’s revenue relates to clinical trial service contracts that represent a single performance obligation. The Company recognises revenue for these contracts over time using a cost-based input method, whereby revenue is recognised based on progress towards completion of the performance obligation. Revenue recognition requires management to make estimates of the transaction price and costs to complete for its projects on an ongoing basis.
Auditing revenue recognition for clinical trial service contracts was especially challenging, due to the significant management judgment required to measure progress towards complete satisfaction of the performance obligation for clinical trial service contracts over time. The significant assumptions used to estimate revenue recognition included total forecast project costs and realisable contract values.
Refer to the Accounting policies (page 46) and Note 3 of the Consolidated Financial Statements (page 68). | To test the revenue recognition for clinical trial service contracts, as well as determining, executing and evaluating the incremental audit procedures described in the key audit matter above, our procedures included, among others, understanding management’s process for determining the total forecast project costs and realizable contract values.
For a sample of clinical trial service contracts, through an inspection of contracts and agreed scope changes, we evaluated whether management’s calculation of contract revenue appropriately reflected contract terms and assessed the reasonableness of management’s estimate of total forecast project costs by evaluating the completeness and accuracy of the underlying cost and labour inputs, analysing the appropriateness of changes to total forecast project costs over time, and comparing forecast costs to actual costs incurred to date and to contracted terms. We also tested actual direct and third-party costs incurred, by inspecting source documentation, such as internal payroll records and third-party invoices.
For certain contracts, we interviewed operational personnel of the Company to assess progress to date and compared the realisable contract value to the consideration expected to be received based on current rights and obligations under the related clinical trial service contracts and any pricing modifications and scope changes that were agreed upon with the customers. | Our observations included an overview of the risk, outline of the audit procedures performed, the judgements we focused on and the results of our testing.
Our planned audit procedures in respect of revenue recognition were completed without exception. |
INDEPENDENT AUDITOR’S REPORT TO THE MEMBERS OF ICON PLC (continued)
Report on the audit of the financial statements (continued)
Our application of materiality
We apply the concept of materiality in planning and performing the audit, in evaluating the effect of identified misstatements on the audit and in forming our audit opinion.
Materiality
Materiality is the magnitude of an omission or misstatement that, individually or in the aggregate, could reasonably be expected to influence the economic decisions of the users of the financial statements. Materiality provides a basis for determining the nature and extent of our audit procedures.
We determined materiality for the Group to be US$35.6 million, which is 5% of profit before taxation adjusted for certain non-recurring exceptional items. Profit before taxation adjusted for certain non-recurring exceptional items is a key performance indicator for the Group and is also a key metric used by the Group in the assessment of the performance of management. We therefore considered the Group’s profit before taxation adjusted for certain non-recurring exceptional items to be the most appropriate performance metric on which to base our materiality calculation as we consider it to be the most relevant performance measure to the stakeholders of the Group.
We determined materiality for the Company to be US$74 million, which is 1% of total equity.
During the course of our audit, we reassessed initial materiality and considered that no further changes to materiality were necessary.
Performance materiality
Performance materiality is the application of materiality at the individual account or balance level. It is set at an amount to reduce to an appropriately low level the probability that the aggregate of uncorrected and undetected misstatements exceeds materiality.
On the basis of our risk assessments, together with our assessment of the Group’s overall control environment, our judgement was that performance materiality was 50% of our planning materiality, namely US$17.8 million. We determined performance materiality for the Company to be US$37 million, which is 50% of planning materiality. We have set performance materiality at this percentage based on our assessment of the risk of misstatements, both corrected and uncorrected.
Reporting threshold
Reporting threshold is an amount below which identified misstatements are considered as being clearly trivial.
We agreed with the Audit Committee that we would report to them all uncorrected audit differences in excess of US$1.8 million for the Group, and US$3.7 million for the Company, which is set at 5% of planning materiality, as well as differences below that threshold that, in our view, warranted reporting on qualitative grounds.
We evaluate any uncorrected misstatements against both the quantitative measures of materiality discussed above and in light of other relevant qualitative considerations in forming our opinion.
An overview of the scope of our audit
Tailoring the scope
Our audit was undertaken to the materiality and performance materiality levels specified above and we applied materiality to assist us in determining what risks were significant and the procedures to be performed.
As part of establishing the overall Group audit strategy and plan, we conducted risk assessment procedures, and we have determined for the purpose of the Group Audit that the entire Group is considered to be one component. We tailored the scope of our audit to ensure that we performed sufficient audit procedures to be able to give an opinion on the financial statements as a whole. All audit work performed for the purposes of the audit was undertaken by the Group audit team.
Other information
The directors are responsible for the other information. The other information comprises the information included in the annual report other than the financial statements and our auditor’s report thereon. Our opinion on the financial statements does not cover the other information and, except to the extent otherwise explicitly stated in our report, we do not express any form of assurance conclusion thereon.
INDEPENDENT AUDITOR’S REPORT TO THE MEMBERS OF ICON PLC (continued)
Report on the audit of the financial statements (continued)
Other information (continued)
Our responsibility is to read the other information and, in doing so, consider whether the other information is materially inconsistent with the financial statements or our knowledge obtained in the audit or otherwise appears to be materially misstated. If we identify such material inconsistencies or apparent material misstatements, we are required to determine whether there is a material misstatement in the financial statements or a material misstatement of the other information. If, based on the work we have performed, we conclude that there is a material misstatement of this other information, we are required to report that fact.
We have nothing to report in this regard.
Opinions on other matters prescribed by the Companies Act 2014
In our opinion, based solely on the work undertaken in the course of the audit:
•the information given in the Directors’ Report, other than those parts dealing with the non-financial statement pursuant to the requirements of S.I. No. 360/2017 on which we are not required to report in the current year, is consistent with the financial statements; and
•the Directors’ Report, other than those parts relating to sustainability reporting where required by Part 28 of the Companies Act 2014, and those parts dealing with the non-financial statement pursuant to the requirements of S.I. No. 360/2017 on which we are not required to report in the current year, has been prepared in accordance with applicable legal requirements.
We have obtained all the information and explanations which, to the best of our knowledge and belief, are necessary for the purposes of our audit.
In our opinion the accounting records of the Company were sufficient to permit the financial statements to be readily and properly audited and the Company statement of financial position is in agreement with the accounting records.
Matters on which we are required to report by exception
Based on the knowledge and understanding of the Group and the Company and its environment obtained in the course of the audit, we have not identified material misstatements in the directors' report.
The Companies Act 2014 requires us to report to you if, in our opinion, the disclosures required by sections 305 to 312 of the Act, which relate to disclosures of directors’ remuneration and transactions, are not complied with by the Company. We have nothing to report in this regard.
We have nothing to report in respect of section 13 of the European Union (Disclosure of Non-Financial and Diversity Information by certain large undertakings and groups) Regulations 2017, which require us to report to you if, in our opinion, the Company has not provided in the non-financial statement the information required by Section 5(2) to (7) of those Regulations, in respect of 31 December 2024.
Respective responsibilities
Responsibilities of directors for the financial statements
As explained more fully in the directors’ responsibilities statement set out on page 30, the directors are responsible for the preparation of the financial statements in accordance with the applicable framework that give a true and fair view, and for such internal control as they determine is necessary to enable the preparation of financial statements that are free from material misstatement, whether due to fraud or error.
In preparing the financial statements, the directors are responsible for assessing the Group and Company’s ability to continue as going concerns, disclosing, as applicable, matters related to going concern and using the going concern basis of accounting unless management either intends to liquidate the Group or the Company or to cease operations, or has no realistic alternative but to do so.
INDEPENDENT AUDITOR’S REPORT TO THE MEMBERS OF ICON PLC (continued)
Report on the audit of the financial statements (continued)
Auditor’s responsibilities for the audit of the financial statements
Our objectives are to obtain reasonable assurance about whether the financial statements as a whole are free from material misstatement, whether due to fraud or error, and to issue an auditor's report that includes our opinion. Reasonable assurance is a high level of assurance, but is not a guarantee that an audit conducted in accordance with ISAs (Ireland) will always detect a material misstatement when it exists. Misstatements can arise from fraud or error and are considered material if, individually or in the aggregate, they could reasonably be expected to influence the economic decisions of users taken on the basis of these financial statements.
Explanation as to what extent the audit was considered capable of detecting irregularities, including fraud
Irregularities, including fraud, are instances of non-compliance with laws and regulations. We design procedures in line with our responsibilities, outlined above, to detect irregularities, including fraud, that could reasonably be expected to have a material effect on the financial statements. The risk of not detecting a material misstatement due to fraud is higher than the risk of not detecting one resulting from error, as fraud may involve deliberate concealment by, for example, forgery or intentional misrepresentations, or through collusion. In addition, the further removed any non-compliance is from the events and transactions reflected in the financial statements, the less likely it is that our procedures will identify such non-compliance. The extent to which our procedures are capable of detecting irregularities, including fraud is detailed below. However, the primary responsibility for the prevention and detection of fraud rests with both those charged with governance of the Company and management.
Our approach was as follows:
•We obtained an understanding of the legal and regulatory frameworks that are applicable to the Company and determined that the most significant are those that relate to the form and content of external financial reporting including company law, tax legislation, employment law and regulatory compliance;
•We understood how the Group is complying with those frameworks by making enquiries of management, internal audit, those responsible for legal and compliance procedures and the Company Secretary. We corroborated our enquiries through our review of the Group’s compliance policies, board minutes, and papers provided to the Audit Committee;
•We assessed the susceptibility of the Company’s financial statements to material misstatement, including how fraud might occur, by meeting with management, including within various parts of the business, to understand where they considered there was susceptibility to fraud. We also considered performance targets and the potential for management to influence earnings or the perceptions of analysts. Where this risk was considered to be higher, we performed audit procedures to address each identified fraud risk. These procedures included testing manual journals and were designed to provide reasonable assurance that the financial statements were free from fraud or error; and
•Based on this understanding we designed our audit procedures to identify non-compliance with such laws and regulations. Our procedures included a review of board minutes to identify any non-compliance with laws and regulations, a review of reporting to the Audit Committee on compliance with regulations, and enquiries of internal and external legal counsel and management.
•Our additional audit procedures included:
◦engaging our forensic specialists to examine the scope and results of the Investigation carried out by the Audit Committee and outside legal counsel, including forensic and technical accounting firms, by holding discussions with these team members, reviewing their supporting evidence and, performing additional procedures which included considering the sufficiency, appropriateness of the investigation performed and the competency and objectivity of individuals undertaking it;
INDEPENDENT AUDITOR’S REPORT TO THE MEMBERS OF ICON PLC (continued)
Report on the audit of the financial statements (continued)
Explanation as to what extent the audit was considered capable of detecting irregularities, including fraud (continued)
◦discussing the Investigation with the Audit Committee and the Board of Directors, to understand their views on the matters identified, and their understanding of the background to these matters and how they originated. We challenged Management, the Audit Committee and the Board of Directors as to how they had satisfied themselves that there were no similar occurrences elsewhere in the Group;
◦performing procedures on the prior period adjustments identified by Management to assess the completeness, accuracy and timing of these adjustments. We challenged the judgements and assumptions used by reference to evidence obtained through the findings in the Investigation, our knowledge of the matters, our understanding of the business and our other audit procedures;
◦reviewing the disclosures of the prior period restatements as reflected in Note 1 to the Group financial statements for compliance with the requirements of IAS 8 ‘Accounting Policies, Changes in Accounting Estimates and Errors’. We read the disclosures in the Annual Report associated with these matters, including the description of the implications they had on the Board of Directors’ report on their review of the effectiveness of the Group's risk management and internal control systems, and considered whether the other information is materially inconsistent with the financial statements, or our knowledge obtained in the audit or otherwise appears to be materially misstated.
A further description of our responsibilities for the audit of the financial statements is located on the IAASA's website at: https://iaasa.ie/wp-content/uploads/docs/media/IAASA/Documents/audit-standards/Description_of_auditors_responsibilities_for_audit.pdf. This description forms part of our auditor's report.
The purpose of our audit work and to whom we owe our responsibilities
Our report is made solely to the Company’s members, as a body, in accordance with section 391 of the Companies Act 2014. Our audit work has been undertaken so that we might state to the Company’s members those matters we are required to state to them in an auditor’s report and for no other purpose. To the fullest extent permitted by law, we do not accept or assume responsibility to anyone other than the Company and the Company’s members, as a body, for our audit work, for this report, or for the opinions we have formed.
Vincent Bergin
for and on behalf of
Ernst & Young Chartered Accountants and Statutory Audit Firm
Office: Dublin
Date: 25 June 2026
Consolidated Statement of Profit and Loss
for the year ended 31 December 2025
| | | | | | | | | | | | | | | | | | | | | | | |
| Note | 31 December 2025 | 31 December 2024
(As Restated) |
| | Pre-exceptional | Exceptional
(Note 9) | Total | Pre-exceptional | Exceptional
(Note 9) | Total |
| | $’000 | $’000 | $’000 | $’000 | $’000 | $’000 |
| | | | | | | |
| Revenue | 3 | 8,251,340 | | — | | 8,251,340 | | 8,188,990 | | — | | 8,188,990 | |
| | | | | | | |
| Direct costs | | (6,076,286) | | — | | (6,076,286) | | (5,817,764) | | — | | (5,817,764) | |
| Other operating expenses | | (1,163,024) | | (584,952) | | (1,747,976) | | (1,212,972) | | (121,697) | | (1,334,669) | |
| | | | | | | |
| | | | | | | |
| Operating profit | | 1,012,030 | | (584,952) | | 427,078 | | 1,158,254 | | (121,697) | | 1,036,557 | |
| | | | | | | |
| | | | | | | |
| Finance income | 4 | 7,109 | | — | | 7,109 | | 8,609 | | — | | 8,609 | |
| Finance costs | 5 | (203,674) | | — | | (203,674) | | (242,616) | | — | | (242,616) | |
| | | | | | | |
| Profit before taxation | 6 | 815,465 | | (584,952) | | 230,513 | | 924,247 | | (121,697) | | 802,550 | |
| Income tax expense | 7 | (57,966) | | 41,491 | | (16,475) | | (96,749) | | 21,276 | | (75,473) | |
| | | | | | | |
| Profit for the financial year | | 757,499 | | (543,461) | | 214,038 | | 827,498 | | (100,421) | | 727,077 | |
| | | | | | | |
| Earnings per share | | | | $ | | | $ |
| Basic | 8 | | | 2.73 | | | | 8.81 | |
| Diluted | 8 | | | 2.71 | | | | 8.75 | |
In the year ended 31 December 2025, the Group restated the prior year financial information. Details of the restatements are contained in Note 1 to the Consolidated Financial Statements.
On behalf of the Board
| | | | | | | | |
| Barry Balfe | Rónán Murphy | |
Chief Executive Officer | Director | |
Consolidated Statement of Comprehensive Income
for the year ended 31 December 2025
| | | | | | | | | | | |
| Note | 31 December
2025 | 31 December
2024
(As Restated) |
| | $’000 | $’000 |
| | | |
| Profit for the financial year | | 214,038 | | 727,077 | |
| | | |
| Other comprehensive income / (loss) | | | |
| Items that will not be reclassified to profit or loss, net of tax: | | | |
| Re-measurement of defined benefit liability | | 4,684 | | (6,338) | |
| | 4,684 | | (6,338) | |
| | | |
| Items that are or may be reclassified subsequently to profit or loss, net of tax: | | | |
| Currency translation differences | 23 | 159,451 | | (84,927) | |
| Movement on cash flow hedge | 23 | (2,420) | | 4,581 | |
| | 157,031 | | (80,346) | |
| | | |
| Other comprehensive income / (loss) for the year, net of tax | | 161,715 | | (86,684) | |
| | | |
| Total comprehensive income for the financial year | | 375,753 | | 640,393 | |
In the year ended 31 December 2025, the Group restated the prior year financial information. Details of the restatements are contained in Note 1 to the Consolidated Financial Statements.
On behalf of the Board
| | | | | | | | |
| Barry Balfe | Rónán Murphy | |
Chief Executive Officer | Director | |
Consolidated Statement of Financial Position
as at 31 December 2025
| | | | | | | | | | | | | | |
| Note | 31 December
2025 | 31 December
2024
(As Restated) | 1 January
2024
(As Restated) |
| ASSETS | | $’000 | $’000 | $’000 |
| Non-current assets | | | | |
| Property, plant and equipment | 12 | 196,512 | | 169,124 | | 166,850 | |
| Right-of-use assets | 25 | 123,119 | | 143,305 | | 137,264 | |
| Goodwill | 13 | 8,781,158 | | 9,104,218 | | 9,074,884 | |
| Intangible assets | 13 | 3,446,330 | | 3,773,547 | | 4,050,199 | |
| Other non-current assets | 17 | 75,707 | | 72,796 | | 78,470 | |
| Financial assets | 18 | 82,050 | | 57,948 | | 46,804 | |
| Non-current taxes receivable | | — | | 11,395 | | — | |
| Deferred tax assets | 7 | 126,370 | | 85,875 | | 104,422 | |
| Total non-current assets | | 12,831,246 | | 13,418,208 | | 13,658,893 | |
| Current assets | | | | |
| Inventories | 15 | 8,675 | | 8,414 | | 8,442 | |
| Trade receivables | 16 | 1,474,898 | | 1,392,764 | | 1,764,404 | |
| Unbilled revenue (contract assets) | 16 | 1,096,592 | | 1,040,174 | | 853,581 | |
| Other current assets | 17 | 213,387 | | 211,508 | | 189,460 | |
| Current taxes receivable | | 60,824 | | 83,523 | | 91,254 | |
| Current asset investments | | — | | — | | 1,954 | |
| Cash and cash equivalents | 19 | 647,295 | | 538,785 | | 378,102 | |
| Total current assets | | 3,501,671 | | 3,275,168 | | 3,287,197 | |
| Total assets | | 16,332,917 | | 16,693,376 | | 16,946,090 | |
| EQUITY | | | | |
| Share capital | 22 | 6,305 | | 6,586 | | 6,699 | |
| Share premium | 23 | 569,507 | | 559,804 | | 523,646 | |
| Other undenominated capital | 23 | 1,606 | | 1,304 | | 1,162 | |
| Share-based payment reserve | 23 | 384,001 | | 331,838 | | 354,183 | |
| Other reserve | 23 | 11,799 | | 16,454 | | 10,183 | |
| Foreign currency reserve | 23 | (74,320) | | (233,771) | | (148,844) | |
| Merger reserve | 23 | 5,656,195 | | 5,656,195 | | 5,656,195 | |
| Retained earnings | 23 | 2,691,827 | | 3,162,570 | | 2,890,294 | |
| Total equity | | 9,246,920 | | 9,500,980 | | 9,293,518 | |
| LIABILITIES | | | | |
| Non-current liabilities | | | | |
| Non-current bank credit lines and loan facilities | 21 | 2,872,616 | | 3,396,398 | | 3,665,439 | |
| Non-current lease liabilities | 25 | 117,122 | | 140,085 | | 126,321 | |
| Non-current other liabilities | 20 | 69,721 | | 80,364 | | 43,198 | |
| Non-current provisions | 9 | 2,142 | | 2,354 | | 2,048 | |
| Deferred tax liabilities | 7 | 712,970 | | 810,159 | | 897,543 | |
| Total non-current liabilities | | 3,774,571 | | 4,429,360 | | 4,734,549 | |
| Current liabilities | | | | |
| Accounts payable | | 192,117 | | 173,025 | | 131,584 | |
| Unearned revenue (contract liabilities) | 16 | 1,550,471 | | 1,467,671 | | 1,566,464 | |
| Accrued and other liabilities | 20 | 894,443 | | 880,656 | | 903,200 | |
| Provisions | 9 | 22,383 | | 29,120 | | 4,951 | |
| Current tax payable | | 122,250 | | 182,802 | | 201,674 | |
| Bank credit lines and loan facilities | 21 | 529,762 | | 29,762 | | 110,150 | |
| Total current liabilities | | 3,311,426 | | 2,763,036 | | 2,918,023 | |
| Total liabilities | | 7,085,997 | | 7,192,396 | | 7,652,572 | |
| Total equity and liabilities | | 16,332,917 | | 16,693,376 | | 16,946,090 | |
| | | | |
| | | | |
| | | | |
| | | | |
| | | | |
| | | | |
| | | | |
| | | | |
| | | | |
| | | | |
| | | | |
| | | | |
| | | | |
| | | | |
| | | | |
| | | | |
| | | | |
| | | | |
In the year ended 31 December 2025, the Group restated the prior year financial information. Details of the restatements are contained in Note 1 to the Consolidated Financial Statements.
On behalf of the Board
| | | | | | | | |
| Barry Balfe | Rónán Murphy | |
Chief Executive Officer | Director | |
Consolidated Statement of Changes in Equity
for the year ended 31 December 2025
| | | | | | | | | | | | | | | | | | | | | | | | | | | | | | | | |
| Number
of shares | Share
Capital | Share
Premium | Merger Reserve | Other
Undenominated
Capital | Share-Based
Payment Reserve | Other
Reserve | Foreign Currency
Reserve | Retained
Earnings | Total |
| | $’000 | $’000 | $’000 | $’000 | $’000 | $’000 | $’000 | $’000 | $’000 |
| Balance at 1 January 2025 (as restated) | 80,756,860 | | 6,586 | | 559,804 | | 5,656,195 | | 1,304 | | 331,838 | | 16,454 | | (233,771) | | 3,162,570 | | 9,500,980 | |
| Profit for the year attributable to the Group | — | | — | | — | | — | | — | | — | | — | | — | | 214,038 | | 214,038 | |
| Other Comprehensive Income | | | | | | | | | | |
| Foreign currency translation | — | | — | | — | | — | | — | | — | | — | | 159,451 | | — | | 159,451 | |
| Re-measurement of defined benefit liability | — | | — | | — | | — | | — | | — | | — | | — | | 4,684 | | 4,684 | |
| Movement on cash flow hedge | — | | — | | — | | — | | — | | — | | (2,420) | | — | | — | | (2,420) | |
| Total other comprehensive Income | — | | — | | — | | — | | — | | — | | (2,420) | | 159,451 | | 4,684 | | 161,715 | |
| Total comprehensive income for the year | — | | — | | — | | — | | — | | — | | (2,420) | | 159,451 | | 218,722 | | 375,753 | |
| Transactions with owners, recorded directly in equity | | | | | | | | | | |
| Share-based payment | — | | — | | — | | — | | — | | 107,746 | | — | | — | | — | | 107,746 | |
| Exercise of share options | 86,434 | | 6 | | 9,703 | | — | | — | | — | | — | | — | | — | | 9,709 | |
| Transfer of exercised and expired share–based awards | — | | — | | — | | — | | — | | (58,769) | | — | | — | | 58,769 | | — | |
| Issue of restricted share units / performance share units | 228,361 | | 15 | | — | | — | | — | | — | | — | | — | | — | | 15 | |
| Share issue costs | — | | — | | — | | — | | — | | — | | — | | — | | (19) | | (19) | |
| Repurchase of ordinary shares | (4,504,330) | | (302) | | — | | — | | 302 | | — | | — | | — | | (750,000) | | (750,000) | |
| Share repurchase costs | — | | — | | — | | — | | — | | — | | — | | — | | (450) | | (450) | |
| Tax benefit excess on exercise of options | — | | — | | — | | — | | — | | (961) | | — | | — | | — | | (961) | |
| Deferred tax movement on unexercised options | — | | — | | — | | — | | — | | 4,147 | | — | | — | | — | | 4,147 | |
| Non-distributable reserve | — | | — | | — | | — | | — | | — | | (2,235) | | — | | 2,235 | | — | |
| Total contributions by and distributions to owners | (4,189,535) | | (281) | | 9,703 | | — | | 302 | | 52,163 | | (2,235) | | — | | (689,465) | | (629,813) | |
| Balance at 31 December 2025 | 76,567,325 | | 6,305 | | 569,507 | | 5,656,195 | | 1,606 | | 384,001 | | 11,799 | | (74,320) | | 2,691,827 | | 9,246,920 | |
Further details of the reserves above are detailed in Note 23 Capital and reserves in Notes to the Consolidated Financial Statements
Consolidated Statement of Changes in Equity (continued)
for the year ended 31 December 2025
| | | | | | | | | | | | | | | | | | | | | | | | | | | | | | | | |
| Number
of shares | Share
Capital | Share
Premium | Merger Reserve | Other
Undenominated
Capital | Share-Based
Payment Reserve | Other
Reserve | Foreign Currency
Reserve | Retained
Earnings | Total |
| | $’000 | $’000 | $’000 | $’000 | $’000 | $’000 | $’000 | $’000 | $’000 |
| Balance at 1 January 2024 (as reported) | 82,495,086 | | 6,699 | | 523,646 | | 5,656,195 | | 1,162 | | 354,183 | | 10,183 | | (148,844) | | 2,919,591 | | 9,322,815 | |
| Prior year Restatements (Note 1) | — | | — | | — | | — | | — | | — | | — | | — | | (29,297) | | (29,297) | |
| Balance at 1 January 2024 (as restated) | 82,495,086 | | 6,699 | | 523,646 | | 5,656,195 | | 1,162 | | 354,183 | | 10,183 | | (148,844) | | 2,890,294 | | 9,293,518 | |
| Profit for the year attributable to the Group (as restated) | — | | — | | — | | — | | — | | — | | — | | — | | 727,077 | | 727,077 | |
| Other Comprehensive Income | | | | | | | | | | |
| Foreign currency translation | — | | — | | — | | — | | — | | — | | — | | (84,927) | | — | | (84,927) | |
| Re-measurement of defined benefit liability | — | | — | | — | | — | | — | | — | | — | | — | | (6,338) | | (6,338) | |
| Movement on cash flow hedge | — | | — | | — | | — | | — | | — | | 4,581 | | — | | — | | 4,581 | |
| Total other comprehensive income | — | | — | | — | | — | | — | | — | | 4,581 | | (84,927) | | (6,338) | | (86,684) | |
| Total comprehensive income for the year (as restated) | — | | — | | — | | — | | — | | — | | 4,581 | | (84,927) | | 720,739 | | 640,393 | |
| Transactions with owners, recorded directly in equity | | | | | | | | | | |
| Share-based payment | — | | — | | — | | — | | — | | 41,665 | | — | | — | | — | | 41,665 | |
| Exercise of share options | 311,040 | | 20 | | 36,158 | | — | | — | | — | | — | | — | | — | | 36,178 | |
| Transfer of exercised and expired share–based awards | — | | — | | — | | — | | — | | (53,635) | | — | | — | | 53,635 | | — | |
| Issue of restricted share units / performance share units | 130,433 | | 9 | | — | | — | | — | | — | | — | | — | | — | | 9 | |
| Share issue costs | — | | — | | — | | — | | — | | — | | — | | — | | (22) | | (22) | |
| Repurchase of ordinary shares | (2,179,699) | | (142) | | — | | — | | 142 | | — | | — | | — | | (499,998) | | (499,998) | |
| Share repurchase costs | — | | — | | — | | — | | — | | — | | — | | — | | (388) | | (388) | |
| Tax benefit excess on exercise of options | — | | — | | — | | — | | — | | 3,596 | | — | | — | | — | | 3,596 | |
| Deferred tax movement on unexercised options | — | | — | | — | | — | | — | | (13,971) | | — | | — | | — | | (13,971) | |
| Non-distributable reserve | — | | — | | — | | — | | — | | — | | 1,690 | | — | | (1,690) | | — | |
| Total contributions by and distributions to owners | (1,738,226) | | (113) | | 36,158 | | — | | 142 | | (22,345) | | 1,690 | | — | | (448,463) | | (432,931) | |
| Balance at 31 December 2024 (as restated) | 80,756,860 | | 6,586 | | 559,804 | | 5,656,195 | | 1,304 | | 331,838 | | 16,454 | | (233,771) | | 3,162,570 | | 9,500,980 | |
Further details of the reserves above are detailed in Note 23 Capital and reserves in Notes to the Consolidated Financial Statements
Consolidated Statement of Cash Flows
for the year ended 31 December 2025
| | | | | | | | | | | |
| Note | 31 December
2025 | 31 December
2024
(As Restated) |
| | $’000 | $’000 |
| Profit for the financial year | | 214,038 | | 727,077 | |
| Adjustments to reconcile net income to net cash generated from operating activities | | | |
| Depreciation of property, plant and equipment | 12 | 52,882 | | 47,780 | |
| Depreciation of right-of-use assets | 25 | 37,648 | | 41,014 | |
| Impairment of long lived assets | 9 | 3,683 | | 15,731 | |
| Impairment of non-financial assets | 9 | 101,027 | | — | |
| Goodwill Impairment | 9 | 367,587 | | — | |
| Amortisation of intangible assets | 13 | 330,114 | | 440,720 | |
| Share-based payment | 11 | 107,746 | | 46,108 | |
| | | |
| Finance income | 4 | (7,109) | | (8,609) | |
| Finance costs | 5 | 203,674 | | 242,616 | |
| | | |
| Income tax expense | 7 | 16,475 | | 75,473 | |
| Unrealised foreign exchange movements | | 26,464 | | 6,911 | |
| Other non-cash items | | 23,333 | | 31,900 | |
| Operating cash inflow before changes in working capital | | 1,477,562 | | 1,666,721 | |
| Accounts receivable | | (108,213) | | 332,616 | |
| Unbilled revenue | | (61,109) | | (192,176) | |
| Unearned revenue | | 68,516 | | (96,787) | |
| Other net assets | | 59,012 | | (47,261) | |
| Cash provided by operations | | 1,435,768 | | 1,663,113 | |
| Income taxes paid | | (165,787) | | (140,718) | |
| | | |
| Interest received | 4 | 7,109 | | 8,609 | |
| Interest and similar cost paid | | (198,896) | | (196,622) | |
| Net cash inflow from operating activities | | 1,078,194 | | 1,334,382 | |
| Investing activities | | | |
| Purchase of property, plant and equipment | 12 | (69,787) | | (56,804) | |
| Purchase of intangible assets | 13 | (104,427) | | (111,256) | |
| Purchase of subsidiary undertakings (net of cash acquired) | 14 | (2,537) | | (84,159) | |
| | | |
| Proceeds from sale of financial assets | 18 | 9,089 | | 2,690 | |
| Purchase of financial assets | 18 | (19,871) | | (17,261) | |
| Net cash used in investing activities | | (187,533) | | (266,790) | |
| Financing activities | | | |
| Debt issue costs | | (750) | | (12,679) | |
| Drawdown of credit lines and loan facilities | 21 | 50,000 | | 2,317,480 | |
| Repayment of credit lines and loan facilities | 21 | (79,762) | | (2,677,763) | |
| Repayments of obligations under lease liabilities | | (41,989) | | (47,730) | |
| | | |
| Proceeds from exercise of share options, RSUs and PSUs | | 9,724 | | 36,187 | |
| Share issue costs | | (19) | | (22) | |
| Repurchase of ordinary shares | | (750,000) | | (499,998) | |
| Share repurchase costs | | (450) | | (388) | |
| Net cash used in financing activities | | (813,246) | | (884,913) | |
| Net increase in cash and cash equivalents | | 77,415 | | 182,679 | |
| Effect of exchange rate movements on cash | | 31,095 | | (21,996) | |
| Cash and cash equivalents at start of year | | 538,785 | | 378,102 | |
| Cash and cash equivalents at end of year | | 647,295 | | 538,785 | |
Notes to Consolidated Financial Statements
for the year ended 31 December 2025
1. Basis of preparation and statement of accounting policies
Statement of accounting policies
ICON public limited company (“ICON plc” and the “Company”) is a public company limited by shares, incorporated, domiciled and registered in the Republic of Ireland. The Company’s registered office is South County Business Park, Leopardstown, Dublin 18, D18 X5R3, Ireland. The Company’s registered number is 145835.
The Group Financial Statements have been prepared in accordance with International Financial Reporting Standards (“IFRS”) issued by the International Accounting Standards Board (“IASB”) as adopted by the European Union (“EU”) that are effective for financial year ending 31 December 2025, and with those parts of the Companies Act applicable to companies reporting under IFRS. IFRS adopted by the EU differs in certain respects from IFRS issued by the IASB. Reference to IFRS hereafter refers to IFRS adopted by the EU.
The Company Financial Statements are prepared under the historical cost convention, in accordance with Financial Reporting Standard 101 Reduced Disclosure Framework (“FRS 101”) and the Companies Act 2014. The Company meets the definition of a qualifying entity under Financial Reporting Standard (FRS) 100 issued by the Financial Reporting Council (FRC). Accordingly, the Company prepares its Financial Statements in accordance with FRS 101 Reduced Disclosure Framework as issued by the FRC.
In preparing the Company Financial Statements, the Company applies the recognition, measurement and disclosure requirements of IFRS as adopted by the EU, but makes amendments where necessary in order to comply with the Companies Act 2014 and has set out below where advantage of the FRS 101 disclosure exemptions has been taken. The Company has taken advantage of the following disclosure exemptions under FRS 101:
•A cash flow statement and related notes;
•Comparative period reconciliation for share capital;
•Disclosures in respect of transactions with wholly owned subsidiaries;
•Disclosures in respect of capital management;
•The effects of new but not yet effective IFRS; and
•Disclosures in respect of the compensation of key management personnel.
As the consolidated financial statements of the Group are prepared in accordance with IFRS as adopted by the EU and include the equivalent disclosures, the Company has also taken the exemptions under FRS 101 available in respect of the following disclosures:
•Certain disclosures required by IFRS 2 Share-Based Payments;
•Certain disclosures required by IFRS 13 Fair Value Measurement; and
•The disclosures required by IFRS 7 Financial Instruments: Disclosures.
In accordance with Section 304(2) of the Companies Act 2014, the Company is availing of the exemption from presenting its individual income statement to the Annual General Meeting and from filing it with the Companies Registration Office. The Company’s profit for the financial year is $703.9 million (2024: $425.3 million).
Basis of preparation
The Group and Company Financial Statements are presented in United States dollars (“U.S. dollars”) and all values are rounded to the nearest thousand ($‘000), except where otherwise indicated. They are prepared on a going concern and historical cost basis, except for the measurement at fair value on date of grant of share based payments, net pension plan assets, derivative financial instruments and certain financial asset investments. Other than the amended standards adopted by the Group, accounting policies are applied consistently with the prior year.
The principal accounting policies adopted in the Company Financial Statements are the same as those set out for the Group financial statements except as noted below. The accounting policies for the Group and Company Financial Statements have, unless otherwise stated, been applied consistently to all periods presented in these financial statements.
Notes to Consolidated Financial Statements (continued)
for the year ended 31 December 2025
1. Basis of preparation and statement of accounting policies (continued)
Restatement due to prior year adjustments
In October 2025, the Audit Committee initiated an investigation into certain accounting practices and controls, following concerns reported to the Audit Committee through Group management. The Audit Committee promptly engaged outside legal counsel, who were supported by forensic and technical accounting firms, to conduct the investigation (the “Investigation”) and notified the Group’s independent auditors. The Group has also self-reported the matter to the SEC and other relevant agencies. The Investigation primarily focused on revenue recognition practices, and, in connection with the Investigation, the Group has determined that improper adjustments were made to the clinical trial services revenue of the Group in 2023 and 2024. The Group also identified errors in determining the estimated cost to complete, the assessment of realizable value, and certain manual adjustments in respect of clinical trial services revenue contracts during 2023 and 2024.
In preparing these financial statements, management have restated the comparative financial information as of and for the year ended 31 December 2024 to correct errors (the “Restatement Items”) that were concluded to be material. The Restatement Items reflect adjustments to correct errors in revenue recognition for the year ended 31 December 2024 arising from improper adjustments to revenue on long-term clinical trial contracts, and inaccuracies in certain inputs to revenue recognition for long-term clinical trial contracts among other adjustments described below. In addition to the Restatement Items, the restatement also includes adjustments to correct certain other immaterial errors, (the “Other Adjustments”). The Group has also presented a restated opening balance sheet as at 1 January 2024, which has been restated to correct the cumulative effect of these matters for periods prior to 2024.
Revenue
1.The Investigation identified improper adjustments recorded to recognise revenue outside of normal system processes for long-term clinical services revenue contracts. In addition, errors in determining the estimated cost to complete, the assessment of realisable value and certain manual adjustments in respect of certain long-term clinical services revenue contracts were identified. These errors amount to a $73.6 million decrease in revenue for the year ended 31 December 2024 and an adjustment to decrease retained earnings as at 1 January 2024 of $68.9 million.
2.An error related to rebates was identified for the year ended 31 December 2024. Correcting this error reduced revenue by $20.7 million with a corresponding reduction in direct costs.
3.An error was identified in the recognition of revenue provisions in 2023. The release of these provisions resulted in an increase to retained earnings as at 1 January 2024 of $23.3 million.
4.An error was identified in the calculation of estimated revenue attributable to the impact of cost accruals on the measure of progress at period end, resulting in additional revenue of $1.6 million for the year ended 31 December 2024. A $12.0 million adjustment was also recorded to increase retained earnings as at 1 January 2024 with respect to this accrual.
The correction of these errors resulted in a decrease in revenue of $92.7 million for the year ended 31 December 2024 and a decrease in retained earnings of $33.6 million as at 1 January 2024.
Consolidated Statement of Financial Position
1.Errors were identified in unbilled revenue and unearned revenue whereby certain contract assets and liabilities with a legal right of offset were not identified. The correction of these errors resulted in a reduction of unbilled revenue and unearned revenue of $192.4 million as at 31 December 2024 and $100.8 million as at 1 January 2024.
2.Errors were identified between unbilled revenue, unearned revenue and accounts receivable as at 31 December 2024. As at 31 December 2024 a $12.6 million understatement was identified in unbilled revenue, a $3.4 million understatement was identified in unearned revenue and a $9.2 million overstatement was identified in accounts receivable. As at 1 January 2024 a $25.9 million understatement was identified in unbilled revenue with a corresponding overstatement identified in accounts receivable.
The correction of the above errors in addition to the impact of the revenue restatement items resulted in a net decrease in unbilled revenue of $246.1 million and $98.4 million as at 31 December 2024 and 1 January 2024, respectively, a net decrease in accounts receivable of $9.2 million and $25.9 million as at 31 December 2024 and 1 January 2024, respectively and a net decrease in unearned revenue of $147.1 million and $88.0 million as at 31 December 2024 and 1 January 2024, respectively.
Notes to Consolidated Financial Statements (continued)
for the year ended 31 December 2025
1. Basis of preparation and statement of accounting policies (continued)
Restatement due to prior year adjustments (continued)
Income Taxation
As a result of the Restatement Items and the Other Adjustments discussed below, the Group’s income tax expense decreased by $13.1 million for the year ended 31 December 2024. Corresponding adjustments were recorded to increase the Group’s non-current income tax receivable, non-current deferred tax asset and current income tax payable as at 31 December 2024 by $11.4 million, $1.1 million and $1.7 million respectively, and to decrease non-current deferred liabilities by $1.3 million. Adjustments were recorded to decrease the Group’s non-current deferred tax asset and non-current deferred tax liability as at 1 January 2024 by $0.8 million and $0.8 million respectively and to increase current income tax payable by $1.1 million.
Other Adjustments
In addition to the Restatement Items described above, the Group has corrected other adjustments. While these other adjustments are quantitatively and qualitatively immaterial, individually and in the aggregate, because we are correcting for the Restatement items, we have decided to correct these other adjustments as well.
In addition, other immaterial adjustments of a $5.4 million net increase were recorded to opening retained earnings. A tax charge of $1.1 million was also recorded to opening retained earnings.
The net impact of all the Restatement items to opening retained earnings as at 1 January 2024 was a reduction of $29.3 million.
Company Financial Statements
There were no restatements of prior year balances in the Company financial statements. Accordingly, the comparatives presented are unchanged from those previously reported.
Notes to Consolidated Financial Statements (continued)
for the year ended 31 December 2025
1. Basis of preparation and statement of accounting policies (continued)
Restatement due to prior year adjustments (continued)
The impact of the restatements on the Consolidated Statement of Profit and Loss for the year ended 31 December 2024 is summarised below:
| | | | | | | | | | | | | | | | | | | | | | | | | | | | | | | | | | | |
| 31 December 2024 |
| As Reported | | Adjustments | | As Restated |
| Pre-exceptional | Exceptional | Total | | Pre-exceptional | Exceptional | Total | | Pre-exceptional | Exceptional | Total |
| $’000 | $’000 | $’000 | | $’000 | $’000 | $’000 | | $’000 | $’000 | $’000 |
| | | | | | | | | | | |
| Revenue | 8,281,676 | | — | | 8,281,676 | | | (92,686) | | — | | (92,686) | | | 8,188,990 | | — | | 8,188,990 | |
| | | | | | | | | | | |
| Direct costs | (5,845,022) | | — | | (5,845,022) | | | 27,258 | | | 27,258 | | | (5,817,764) | | — | | (5,817,764) | |
| Other operating expenses | (1,212,972) | | (121,697) | | (1,334,669) | | | — | | — | | — | | | (1,212,972) | | (121,697) | | (1,334,669) | |
| Operating profit | 1,223,682 | | (121,697) | | 1,101,985 | | | (65,428) | | — | | (65,428) | | | 1,158,254 | | (121,697) | | 1,036,557 | |
| | | | | | | | | | | |
| | | | | | | | | | | |
| Finance income | 8,609 | | — | | 8,609 | | | — | | — | | — | | | 8,609 | | — | | 8,609 | |
| Finance costs | (242,616) | | — | | (242,616) | | | — | | — | | — | | | (242,616) | | — | | (242,616) | |
| | | | | | | | | | | |
| Profit before taxation | 989,675 | | (121,697) | | 867,978 | | | (65,428) | | — | | (65,428) | | | 924,247 | | (121,697) | | 802,550 | |
| Income tax expense | (109,829) | | 21,276 | | (88,553) | | | 13,080 | | | 13,080 | | | (96,749) | | 21,276 | | (75,473) | |
| | | | | | | | | | | |
| Profit for the financial year | 879,846 | | (100,421) | | 779,425 | | | (52,348) | | — | | (52,348) | | | 827,498 | | (100,421) | | 727,077 | |
| | | | | | | | | | | |
| Earnings per share | | | $ | | | | $ | | | | $ |
| Basic | | | 9.45 | | | | | (0.64) | | | | | 8.81 | |
| Diluted | | | 9.38 | | | | | (0.63) | | | | | 8.75 | |
Notes to Consolidated Financial Statements (continued)
for the year ended 31 December 2025
1. Basis of preparation and statement of accounting policies (continued)
Restatement due to prior year adjustments (continued)
The impact of the restatements on the Consolidated Statement of Comprehensive Income for the year ended 31 December 2024 is summarised below:
| | | | | | | | | | | | | | | |
| 31 December 2024 | | |
| As Reported | Adjustments | As Restated | | | | |
| $’000 | $’000 | $’000 | | | | |
| | | | | | | |
| Profit for the financial year | 779,425 | | (52,348) | | 727,077 | | | | | |
| | | | | | | |
| Other comprehensive (loss) / income | | | | | | | |
| Items that will not be reclassified to profit or loss, net of tax: |
| Re-measurement of defined benefit liability | (6,338) | | — | | (6,338) | | | | | |
| (6,338) | | — | | (6,338) | | | | | |
| | | | | | | |
| Items that are or may be reclassified subsequently to profit or loss, net of tax: |
| Currency translation differences | (84,927) | | — | | (84,927) | | | | | |
| Movement on cash flow hedge | 4,581 | | — | | 4,581 | | | | | |
| (80,346) | | — | | (80,346) | | | | | |
| | | | | | | |
| Other comprehensive loss for the year, net of tax | (86,684) | | — | | (86,684) | | | | | |
| | | | | | | |
| Total comprehensive income for the financial year | 692,741 | | (52,348) | | 640,393 | | | | | |
Notes to Consolidated Financial Statements (continued)
for the year ended 31 December 2025
1. Basis of preparation and statement of accounting policies (continued)
Restatement due to prior year adjustments (continued)
The impact of the restatements on the Consolidated Statement of Financial Position as at 31 December 2024 and 1 January 2024 is summarised below:
| | | | | | | | | | | | | | | | | | | | | | | |
| 31 December 2024 | | 1 January 2024 |
| As Reported | Adjustments | As Restated | | As Reported | Adjustments | As Restated |
| ASSETS | $’000 | $’000 | $’000 | | $’000 | $’000 | $’000 |
| Non-current assets | | | | | | | |
| Property, plant and equipment | 150,520 | | 18,604 | | 169,124 | | | 161,970 | | 4,880 | | 166,850 | |
| Right-of-use assets | 143,305 | | — | | 143,305 | | | 137,264 | | — | | 137,264 | |
| Goodwill | 9,104,218 | | — | | 9,104,218 | | | 9,074,884 | | — | | 9,074,884 | |
| Intangible assets | 3,792,151 | | (18,604) | | 3,773,547 | | | 4,055,079 | | (4,880) | | 4,050,199 | |
| Other non-current assets | 72,796 | | — | | 72,796 | | | 78,470 | | — | | 78,470 | |
| Financial assets | 57,948 | | — | | 57,948 | | | 46,804 | | — | | 46,804 | |
| Non-current taxes receivable | — | | 11,395 | | 11,395 | | | — | | — | | — | |
| Deferred tax assets | 84,801 | | 1,074 | | 85,875 | | | 105,229 | | (807) | | 104,422 | |
| Total non-current assets | 13,405,739 | | 12,469 | | 13,418,208 | | | 13,659,700 | | (807) | | 13,658,893 | |
| Current assets | | | | | | | |
| Inventories | 8,414 | | — | | 8,414 | | | 8,442 | | — | | 8,442 | |
| Trade receivables | 1,401,989 | | (9,225) | | 1,392,764 | | | 1,790,322 | | (25,918) | | 1,764,404 | |
| Unbilled revenue (contract assets) | 1,286,274 | | (246,100) | | 1,040,174 | | | 951,936 | | (98,355) | | 853,581 | |
| Other current assets | 211,508 | | — | | 211,508 | | | 189,460 | | — | | 189,460 | |
| Current taxes receivable | 83,523 | | — | | 83,523 | | | 91,254 | | — | | 91,254 | |
| Current asset investments | — | | — | | — | | | 1,954 | | — | | 1,954 | |
| Cash and cash equivalents | 538,785 | | — | | 538,785 | | | 378,102 | | — | | 378,102 | |
| Total current assets | 3,530,493 | | (255,325) | | 3,275,168 | | | 3,411,470 | | (124,273) | | 3,287,197 | |
| Total assets | 16,936,232 | | (242,856) | | 16,693,376 | | | 17,071,170 | | (125,080) | | 16,946,090 | |
| EQUITY | | | | | | | |
| Share capital | 6,586 | | — | | 6,586 | | | 6,699 | | — | | 6,699 | |
| Share premium | 559,804 | | — | | 559,804 | | | 523,646 | | — | | 523,646 | |
| Other undenominated capital | 1,304 | | — | | 1,304 | | | 1,162 | | — | | 1,162 | |
| Share-based payment reserve | 331,838 | | — | | 331,838 | | | 354,183 | | — | | 354,183 | |
| Other reserve | 16,454 | | — | | 16,454 | | | 10,183 | | — | | 10,183 | |
| Foreign currency reserve | (233,771) | | — | | (233,771) | | | (148,844) | | — | | (148,844) | |
| Merger reserve | 5,656,195 | | — | | 5,656,195 | | | 5,656,195 | | — | | 5,656,195 | |
| Retained earnings | 3,244,215 | | (81,645) | | 3,162,570 | | | 2,919,591 | | (29,297) | | 2,890,294 | |
| Total equity | 9,582,625 | | (81,645) | | 9,500,980 | | | 9,322,815 | | (29,297) | | 9,293,518 | |
| LIABILITIES | | | | | | | |
| Non-current liabilities | | | | | | | |
| Non-current bank credit lines and loan facilities | 3,396,398 | | — | | 3,396,398 | | | 3,665,439 | | — | | 3,665,439 | |
| Non-current lease liabilities | 140,085 | | — | | 140,085 | | | 126,321 | | — | | 126,321 | |
| Non-current other liabilities | 81,116 | | (752) | | 80,364 | | | 43,950 | | (752) | | 43,198 | |
| Non-current provisions | 2,354 | | — | | 2,354 | | | 2,048 | | — | | 2,048 | |
| Deferred tax liabilities | 811,414 | | (1,255) | | 810,159 | | | 898,335 | | (792) | | 897,543 | |
| Total non-current liabilities | 4,431,367 | | (2,007) | | 4,429,360 | | | 4,736,093 | | (1,544) | | 4,734,549 | |
| Current liabilities | | | | | | | |
| Accounts payable | 173,025 | | — | | 173,025 | | | 131,584 | | — | | 131,584 | |
| Unearned revenue (contract liabilities) | 1,614,758 | | (147,087) | | 1,467,671 | | | 1,654,507 | | (88,043) | | 1,566,464 | |
| Accrued and other liabilities | 894,483 | | (13,827) | | 880,656 | | | 910,448 | | (7,248) | | 903,200 | |
| Provisions | 29,120 | | — | | 29,120 | | | 4,951 | | — | | 4,951 | |
| Current tax payable | 181,092 | | 1,710 | | 182,802 | | | 200,622 | | 1,052 | | 201,674 | |
| Bank credit lines and loan facilities | 29,762 | | — | | 29,762 | | | 110,150 | | — | | 110,150 | |
| Total current liabilities | 2,922,240 | | (159,204) | | 2,763,036 | | | 3,012,262 | | (94,239) | | 2,918,023 | |
| Total liabilities | 7,353,607 | | (161,211) | | 7,192,396 | | | 7,748,355 | | (95,783) | | 7,652,572 | |
| Total equity and liabilities | 16,936,232 | | (242,856) | | 16,693,376 | | | 17,071,170 | | (125,080) | | 16,946,090 | |
Notes to Consolidated Financial Statements (continued)
for the year ended 31 December 2025
1. Basis of preparation and statement of accounting policies (continued)
Restatement due to prior year adjustments (continued)
The impact of the restatements on the Consolidated Statements of Cash Flows for the year ended 31 December 2024 is summarised below:
| | | | | | | | | | | | | | | |
| 31 December 2024 | | |
| As Reported | Adjustments | As Restated | | | | |
| $’000 | $’000 | $’000 | | | | |
| Profit for the financial year | 779,425 | | (52,348) | | 727,077 | | | | | |
| Adjustments to reconcile net income to net cash generated from operating activities | | | | |
| Depreciation of property, plant and equipment | 44,878 | | 2,902 | | 47,780 | | | | | |
| Depreciation of right-of-use assets | 41,014 | | — | | 41,014 | | | | | |
| Impairment of long lived assets | 15,731 | | — | | 15,731 | | | | | |
| Amortisation of intangible assets | 443,622 | | (2,902) | | 440,720 | | | | | |
| | | | | | | |
| Share-based payment | 46,108 | | — | | 46,108 | | | | | |
| | | | | | | |
| Finance income | (8,609) | | — | | (8,609) | | | | | |
| Finance costs | 242,616 | | — | | 242,616 | | | | | |
| | | | | | | |
| Income tax expense | 88,553 | | (13,080) | | 75,473 | | | | | |
| Unrealised foreign exchange movements | 6,911 | | — | | 6,911 | | | | | |
| Other non-cash items | 31,900 | | — | | 31,900 | | | | | |
| Operating cash inflow before changes in working capital | 1,732,149 | | (65,428) | | 1,666,721 | | | | | |
| Accounts receivable | 349,309 | | (16,693) | | 332,616 | | | | | |
| Unbilled revenue | (339,921) | | 147,745 | | (192,176) | | | | | |
| Unearned revenue | (37,743) | | (59,044) | | (96,787) | | | | | |
| Other net assets | (44,277) | | (2,984) | | (47,261) | | | | | |
| Cash provided by operations | 1,659,517 | | 3,596 | | 1,663,113 | | | | | |
| Income taxes paid | (140,718) | | — | | (140,718) | | | | | |
| | | | | | | |
| Interest received | 8,609 | | — | | 8,609 | | | | | |
| Interest and similar costs paid | (196,622) | | — | | (196,622) | | | | | |
| Net cash inflow from operating activities | 1,330,786 | | 3,596 | | 1,334,382 | | | | | |
| Investing activities | | | | | | | |
| Purchase of property, plant and equipment | (39,804) | | (17,000) | | (56,804) | | | | | |
| Purchase of intangible assets | (128,256) | | 17,000 | | (111,256) | | | | | |
| Purchase of subsidiary undertakings (net of cash acquired) | (84,159) | | — | | (84,159) | | | | | |
| | | | | | | |
| Proceeds from sale of financial assets | 2,690 | | — | | 2,690 | | | | | |
| Purchase of financial assets | (17,261) | | — | | (17,261) | | | | | |
| Net cash used in investing activities | (266,790) | | — | | (266,790) | | | | | |
| Financing activities | | | | | | | |
| Debt issue costs | (12,679) | | — | | (12,679) | | | | | |
| Drawdown of credit lines and loan facilities | 2,317,480 | | — | | 2,317,480 | | | | | |
| Repayment of credit lines and loan facilities | (2,677,763) | | — | | (2,677,763) | | | | | |
| Repayments of obligations under lease liabilities | (47,730) | | — | | (47,730) | | | | | |
| Tax benefit from the exercise of share options | 3,596 | | (3,596) | | — | | | | | |
| Proceeds from exercise of share options, RSUs and PSUs | 36,187 | | — | | 36,187 | | | | | |
| Share issue costs | (22) | | — | | (22) | | | | | |
| Repurchase of ordinary shares | (499,998) | | — | | (499,998) | | | | | |
| Share repurchase costs | (388) | | — | | (388) | | | | | |
| Net cash used in financing activities | (881,317) | | (3,596) | | (884,913) | | | | | |
| Net increase in cash and cash equivalents | 182,679 | | — | | 182,679 | | | | | |
| Effect of exchange rate movements on cash | (21,996) | | — | | (21,996) | | | | | |
| Cash and cash equivalents at start of year | 378,102 | | — | | 378,102 | | | | | |
| Cash and cash equivalents at end of year | 538,785 | | — | | 538,785 | | | | | |
Notes to Consolidated Financial Statements (continued)
for the year ended 31 December 2025
1. Basis of preparation and statement of accounting policies (continued)
New standards and interpretations
The following relevant standards and interpretations became effective for the Group during the financial year but do not have a material effect on the results or financial position of the Group:
•Amendments to IAS 21 - Lack of Exchangeability (effective date: 1 January 2025)
The following standards are not yet effective for the Group. The Group is currently evaluating the impact of these standards on its consolidated financial statements and disclosures.
•Amendments to IFRS 7 and IFRS 9- Classification and Measurement of Financial Instruments (effective date: 1 January 2026)
•IFRS 18 Presentation and Disclosure in Financial Statements (effective date: 1 January 2027)
•IFRS 19 Subsidiaries without Public Accountability: Disclosures (effective date: 1 January 2027)
•Amendments to IAS 21 - Translation to a Hyperinflationary Presentation Currency (effective date: 1 January 2027)
•Annual Improvements to IFRS Accounting Standards - Volume 11 (effective date: 1 January 2026)
•Contracts Referencing Nature-dependent Electricity – Amendments to IFRS 9 and IFRS 7 (effective date: 1 January 2026)
Critical accounting judgements and key sources of estimation uncertainty
The preparation of consolidated financial statements requires management to make estimates and judgments that affect the reported amounts of assets and liabilities at the date of the financial statements and the reported amounts of revenues and expenses during the reported period.
We base our estimates and judgments on historical experience and on the other factors that we believe are reasonable under current circumstances. Actual results may differ from these estimates if these assumptions prove to be incorrect or if conditions develop other than as assumed for the purposes of such estimates. The following is a discussion of the accounting policies used by us, which we believe are critical in that they require estimates and judgements by management. The application of these critical accounting policies and estimates is discussed with the Audit Committee of the Board of Directors.
Revenue recognition
Significant management judgments and estimates must be made and used in connection with the recognition of revenue in any accounting period. Material differences in the amount of revenue in any given period may result if these judgments or estimates prove to be incorrect or if management’s estimates change on the basis of development of the business or market conditions. We earn revenues by providing a number of different services to our clients. These services, which are integral elements of the clinical development process, include clinical trials management, contract staffing, consulting and laboratory services. The criteria for revenue recognition is based on five steps: (1) identify the contract(s) with a customer; (2) identify the performance obligation in the contract; (3) determine the transaction price; (4) allocate the transaction price to the performance obligations in the contract; and (5) recognise revenue when (or as) the entity satisfies the performance obligation.
Clinical trial services revenue represents the full-service obligation for a clinical trial, including services performed by investigators and other parties, and is treated as a single performance obligation. Promises offered to the customer are not distinct within the context of the contract. We have concluded that ICON is the contract principal in respect of both direct services and in the use of third parties (principally investigator services) that support the clinical research projects. The transaction price is determined by reference to the contract or change order value (total service revenue and pass-through/ reimbursable expenses) adjusted to reflect a realisable contract value. An assessment of the realisable contract value is judgmental in nature. The realisable value assessment is updated at each reporting period, having regard to (i) contract terms and (ii) customer experience.
Revenue is recognised on a percentage completion basis as the single performance obligation is satisfied. The progress towards completion for clinical service contracts is measured based on an input measure being total project costs (inclusive of third party costs) at each reporting period. Measurement of the progress towards completion involves judgment and estimation.
Assessment of completion requires an evaluation of labour and related time cost incurred at the reporting date and third party costs incurred at the reporting date. The assessment of third party costs incurred (principally investigator costs) requires a review of activity performed and recorded by the third party services providers. The timing of payments to third parties in respect of cost incurred reflects invoicing by third parties. The timing difference between the activity performed and receipt of invoices from third parties may result in significant accrued amounts at reporting periods.
Notes to Consolidated Financial Statements (continued)
for the year ended 31 December 2025
1. Basis of preparation and statement of accounting policies (continued)
Revenue recognition (continued)
The assessment of progress towards completion also requires an up to date evaluation of the forecast costs to complete in respect of these projects. Given the long-term nature of the clinical trials, and the complex nature of those trials, the forecast costs to complete (being internal direct costs and costs that will be incurred by third parties (principally investigators)) is judgmental. Forecast time (and related costs) is determined by reference to (i) contract terms and (ii) past experience. Forecast third party costs to complete are determined by project by reference to (i) contract terms and (ii) past experience.
The Company provides data services to customers based on agreed-upon specifications, including the timing of delivery, which is typically either weekly, monthly, or quarterly. If a customer requests more than one type of data report or series of data reports within a contract, each distinct type of data report is a separate performance obligation. The contracts provide for the Company to be compensated for the value of each deliverable. The transaction price is determined using list prices, discount agreements, if any, and negotiations with the customers, and generally includes any out-of-pocket expenses.
The Company enters into contracts with some of its larger data suppliers that involve non-monetary terms. The Company issues purchase credits to be used toward the data supplier's purchase of the Company's services based on the fair value of the data obtained. In exchange, the Company receives monetary discounts on the data received from the data suppliers. The fair value of the revenue earned from the customer purchases is recognised as services are delivered as described above. At the end of the contract year, any unused customer purchase credits may be forfeited or carried over to the next contract year based on the terms of the data supplier contract. The calculation of the fair value of certain non-monetary terms involves management judgement and estimation.
Goodwill, and Intangible assets acquired in a business combination
Significant management judgments and estimates must be made and used in connection with the recognition of intangible assets associated with a business combination and assessing the carrying value of goodwill.
The cost of a business combination is measured as the aggregate of the fair values at the date of exchange of assets given, liabilities incurred or assumed and equity instruments issued in exchange for control. The assets, liabilities and contingent liabilities of businesses acquired are generally measured at their fair values at the date of acquisition. When the initial accounting for a business combination is determined provisionally, any subsequent adjustments to the provisional values allocated to the identifiable assets, liabilities and contingent liabilities are made within twelve months of the acquisition date and presented as adjustments to goodwill in the reporting period in which the adjustments are determined.
Measurement of intangible assets involves the use of estimates for determining the fair value at the acquisition date. The determination of the fair values of assets and liabilities, as well as of the useful lives of the assets is based on management’s judgment. The valuation of intangible assets required management to develop discounted cash flow models which required the use of reasonable and supportable inputs such as customer attrition data, discount rates developed from various weighted average cost of capital assumptions, growth rates, margin forecasting and assessment of useful lives. Management utilised external valuation experts, where necessary, to ensure the valuation process was sufficiently detailed and robust to develop reliable valuations.
Goodwill is subject to impairment testing on an annual basis, or more frequently if there are indicators of impairment. These assets are allocated to groups of cash generating units (CGUs). The recoverable amount of each of the CGUs is determined based on the higher of fair value less cost of disposal and value-in-use calculations. Goodwill acquired through business combinations has been allocated to the Group’s three CGUs. See Note 13 Goodwill and intangible assets in Notes to the Consolidated Financial Statements for further details.
The impairment review of goodwill which requires cash flow forecasts are for a ten year period and a terminal value. The Group believes a ten year forecast is appropriate to use for the impairment test, due to the cyclical nature of the business in which the Group operates and the long-term lives of its contracts and assets. The terminal value reflects the discounted value of the cash flows beyond year ten which is based on the weighted average long-term growth rates for each CGU. Management’s estimates of future cash flows are based upon current budgets and strategic plans and are reflective of anticipated growth rates within the CRO industry, expected growth in the Group’s market share and reflective of past experience. Key assumptions applied in determining expected future cash flows for these plans include management’s estimate of future profitability, replacement capital expenditure requirements, trade working capital investment needs and tax considerations (see Note 13 Goodwill and intangible assets in Notes to the Consolidated Financial Statements). The Group’s cash flow projections are adjusted each year for actual and expected changes in performance. Management utilised external valuation experts, where necessary, to ensure the review process was sufficiently detailed and robust to develop reliable valuations.
Notes to Consolidated Financial Statements (continued)
for the year ended 31 December 2025
1. Basis of preparation and statement of accounting policies (continued)
Taxation
Given the global nature of our business and the multiple taxing jurisdictions in which the Group operates, the determination of the Group’s provision for income taxes requires significant judgments and estimates, the ultimate tax outcome of which may not be certain. Although we believe our estimates are reasonable, the final outcome of these matters may be different than those reflected in our historical income tax provisions and accruals.
Taxable profit differs from net profit as reported in the Consolidated Statement of Profit and Loss because it excludes items of income or expense that are taxable or deductible in other years and further excludes items that are not taxable or deductible. The Group’s liability for income tax is calculated using rates that have been enacted or substantively enacted at the reporting date. Income tax is recognised in the Consolidated Statement of Profit and Loss except to the extent that it relates to items recognised directly in equity.
Deferred income tax is provided, using the liability method, on all differences between the carrying amounts of assets and liabilities for financial reporting purposes and the amounts used for taxation purposes except those arising from non-deductible goodwill or on initial recognition of an asset or liability which affects neither accounting nor taxable profit and does not give rise to equal taxable and deductible temporary differences. Deferred income tax assets and liabilities are measured at the tax rates that are expected to apply in the year when the asset is expected to be realised or the liability to be settled.
Recognition of deferred tax assets is based on management’s belief that it is probable that the income tax benefit associated with certain temporary differences, income tax operating loss, capital loss carryforwards, and income tax credits, would be realised. The carrying amount of deferred income tax assets is reviewed at each reporting date and reduced to the extent that it is no longer probable that sufficient taxable profit would be available to allow all or part of the deferred income tax asset to be utilised. The Group accounts for the impact of GILTI (“global intangible low-taxed income”) in the period it arises and therefore has not provided for deferred taxes in respect of this item. The Group recognises the effect of income tax positions only if those positions will more likely than not be sustained. If the estimate of future taxable income or tax strategies changes at any time in the future, the Group would record an adjustment to the deferred tax asset. Recording such an adjustment could have a material effect on the Group's financial condition or results of operations.
Material Accounting Policy Information
The following accounting policies have been applied consistently in dealing with items which are considered material in relation to the Group’s Financial Statements.
Basis of consolidation
The Group’s Financial Statements consolidate the financial statements of ICON plc and its subsidiaries. Subsidiaries are consolidated from the date on which control is transferred to the Group and cease to be consolidated from the date on which control is transferred out of the Group. The Group controls an entity when it is exposed to, or has rights to, variable returns from its involvement with the entity and has the ability to affect those returns through its power over the entity. Financial statements of subsidiaries are prepared for the same reporting year as the Company and where necessary, adjustments are made to the results of subsidiaries to bring their accounting policies into line with those used by the Group. The Group will continue to prepare the individual statutory financial statements of subsidiary companies under GAAP applicable in their country of incorporation but adjustments have been made to the results and financial position of such companies to bring their accounting policies into line with those of the Group.
All intercompany balances and transactions, including unrealised profits arising from inter-group transactions, have been eliminated in full. Unrealised losses are eliminated in the same manner as unrealised gains except to the extent that there is evidence of impairment.
Foreign currency translation
The presentation and functional currency of the Company is US dollars ($). The presentation currency of the Group is US dollars ($). The determination of the USD as the functional currency of the Company reflects consideration of the primary and secondary indicators as set out in IAS 21. The directors considered in particular the currency in which funds from financing activities are generated (debt and equity) and the currency in which receipts from operating activities are usually retained. This assessment is consistent with the assessment that the functional currencies of the main subsidiary trading entities are USD. The Company Financial Statements are presented in US dollars. Results and cash flows of non-dollar denominated undertakings are translated into dollars at the actual exchange rates at the transaction dates or average exchange rates for the year where this is a reasonable approximation.
Notes to Consolidated Financial Statements (continued)
for the year ended 31 December 2025
1. Basis of preparation and statement of accounting policies (continued)
Foreign currency translation (continued)
The related statements of financial position are translated at the rates of exchange ruling at the reporting date. Goodwill and fair value adjustments arising on acquisition of a foreign operation are regarded as assets and liabilities of the foreign operation, are expressed in the functional currency of the foreign operation and are recorded at the exchange rate at the date of the transaction, and subsequently retranslated at the applicable closing rates. Adjustments arising on translation of the results of non-dollar undertakings at average rates, and on the restatement of the opening net assets at closing rates, are recorded in the foreign currency reserve within equity.
Transactions in currencies different to the functional currencies of operations are recorded at the rate of exchange ruling at the date of the transaction. Monetary assets and liabilities denominated in foreign currencies are retranslated into the functional currency at the rate of exchange at the reporting date.
On disposal of a foreign operation, accumulated currency translation differences, together with any exchange differences on foreign currency borrowings that provide a hedge of the net investment are recognised in the Consolidated Statement of Profit and Loss as part of the overall gain or loss on disposal.
The principal exchange rates used for the translation of results, cash flows and statements of financial position into US dollars were as follows:
| | | | | | | | | | | | | | |
| Average | Year end |
| 31 December 2025 | 31 December 2024 | 31 December 2025 | 31 December 2024 |
Euro 1:$ | 1.1222 | 1.0854 | 1.1746 | 1.0354 |
Pound Sterling 1:$ | 1.3150 | 1.2809 | 1.3475 | 1.2516 |
Property, plant and equipment
Items of property, plant and equipment are stated at cost less accumulated depreciation and any provisions for impairment losses. Depreciation is calculated to write off the original cost of property, plant and equipment less its estimated residual value over its expected useful life on a straight line basis. Residual values and useful lives of property, plant and equipment are reviewed and adjusted if appropriate at each reporting date. At present it is estimated that all items of property, plant and equipment have no residual value. The estimated useful lives applied in determining the charge to depreciation are as follows:
| | | | | |
| Years |
Buildings | 40 |
Computer equipment | 2-8 |
Office furniture and fixtures | 8 |
Laboratory equipment | 5 |
Motor vehicles | 5 |
Leasehold improvements are amortised using the straight-line method over the estimated useful life of the asset or the lease term, whichever is shorter.
On disposal of property, plant and equipment the cost and related accumulated depreciation and impairments are removed from the financial statements and the net amount, less any proceeds, is taken to the Consolidated Statement of Profit and Loss.
The carrying amounts of the Group’s property, plant and equipment are reviewed at each reporting date to determine whether there is any indicator of impairment. Where such an indicator exists an impairment review is carried out. An impairment loss is recognised whenever the carrying amount of an asset or its cash-generating unit exceeds its recoverable amount. Impairment losses are recognised in the Consolidated Statement of Profit and Loss.
Notes to Consolidated Financial Statements (continued)
for the year ended 31 December 2025
1. Basis of preparation and statement of accounting policies (continued)
Property, plant and equipment (continued)
Subsequent costs are included in an asset’s carrying amount or recognised as a separate asset, as appropriate, only when it is probable that future economic benefits associated with the item will flow to the Group and the cost of the replaced item can be measured reliably. All other repair and maintenance costs are charged to the Consolidated Statement of Profit and Loss during the financial period in which they are incurred.
Right-of-use assets and lease liabilities
ICON determines if an arrangement is a lease at inception and recognises the rights and obligations on the Consolidated Statements of Financial Position as right-of-use (ROU) assets with corresponding lease liabilities.
The right-of-use assets comprise the initial measurement of the corresponding lease liability, plus lease payments made at or before the commencement day and any initial direct costs, less any lease incentives received. They are subsequently measured at cost less accumulated depreciation and impairment losses. Right-of-use assets are depreciated over the lease term.
The right-of-use assets are presented as a separate line in the Consolidated Statement of Financial Position. The Group applies IAS 36 to determine whether a right-of-use asset is impaired and accounts for any identified impairment loss as described in the ‘Property, Plant and Equipment’ policy.
Lease liabilities are recognised based on the present value of future minimum lease payments over the lease term at commencement date or date of transition with the interest element of the lease charged to finance costs. As most of ICON's leases do not provide an implicit rate, the discount rate used is based on the Group's incremental borrowing rate derived from the rate of traded corporate bonds available at the commencement date adjusted for country risk, liquidity and lease term.
Current lease liabilities are included in accrued and other liabilities in the Consolidated Statement of Financial Position and non-current lease liabilities are presented as a separate line. The lease liability is subsequently measured by increasing the carrying amount to reflect interest on the lease liability (using the effective interest method) and by reducing the carrying amount to reflect the lease payments made.
Lease terms may also include options to extend or terminate. Such options are actively reviewed and adjustments to the ROU asset and lease liability are made when it is reasonably certain the option will be exercised.
The Group accounts for lease and non-lease components separately with the exception of motor vehicle leases for which lease and non-lease components are accounted as a single lease component. Lease components are reflected in the Consolidated Statements of Financial Position and non-lease components expensed directly to the Consolidated Statements of Profit and Loss.
The Group has elected to apply the recognition exemption for short-term leases. Instead of recognising a right-of-use asset and lease liability, the payments in relation to these are recognised as an expense in the Consolidated Statement of Profit and Loss on a straight-line basis over the lease term.
In some cases, ICON enters into sublease agreements and becomes both a lessee and a lessor for the same underlying asset. When the Group is an intermediate lessor, it accounts for the head lease and the sub-lease as two separate contracts. Subleases are accounted for in the same way as other leases. The sub-lease is classified as a finance or operating lease by reference to the right-of-use asset arising from the head lease.
Business combinations
Business combinations are accounted for using the acquisition method when control is transferred to the Group. The consideration transferred is measured at fair value, as are the identifiable assets acquired and liabilities assumed. Where a business combination agreement provides for an adjustment to the cost of the acquisition which is contingent upon future events, the amount of the estimated adjustment is recognised on the acquisition date at the acquisition date fair value of this contingent consideration. The accounting treatment of any changes to this estimate in subsequent periods will depend on the classification of the contingent consideration. If the contingent consideration is classified as equity it shall not be re-measured and the settlement shall be accounted for within equity. If the contingent consideration is classified as a liability any adjustments to the assessment of contingent consideration determined as at acquisition date will be accounted for through the Consolidated Statement of Profit and Loss, as the liability is measured at fair value at each reporting date.
Notes to Consolidated Financial Statements (continued)
for the year ended 31 December 2025
1. Basis of preparation and statement of accounting policies (continued)
Business combinations (continued)
The assets, liabilities and contingent liabilities of businesses acquired are measured at their fair values at the date of acquisition. In the case of a business combination which is completed in stages, the fair values of the identifiable assets, liabilities and contingent liabilities are re-determined at the date of each transaction until control is obtained. When the initial accounting for a business combination is determined provisionally, any subsequent adjustments to the provisional values allocated to the identifiable assets, liabilities and contingent liabilities are made within twelve months of the acquisition date and presented as adjustments to the original acquisition accounting. Acquisition costs are expensed as incurred.
Goodwill
The Group measures goodwill at the acquisition date as the fair value of the consideration transferred plus the recognised amount of any non controlling interests in the acquiree, if the business combination is achieved in stages, the fair value of the pre-existing equity interest in the acquiree, less the net recognised amount (generally fair value) of the identifiable assets acquired and liabilities assumed. Goodwill on the acquisition of subsidiaries is included in Note 13 Goodwill and intangible assets in Notes to the Consolidated Financial Statements.
At the acquisition date, any goodwill acquired is allocated to the cash-generating units expected to benefit from the combination's synergies. Impairment is determined by assessing the recoverable amount of the cash-generating unit to which the goodwill relates. Where goodwill forms part of a cash-generating unit and part of the operation within that unit is disposed of, the goodwill associated with the operation disposed of is included in the carrying amount of the operation when determining the gain or loss on disposal of the operation. Goodwill disposed of in this circumstance is measured on the basis of the relative values of the operation disposed of and the proportion of the cash-generating unit retained.
Following initial recognition, goodwill is measured at cost less any accumulated impairment losses. Goodwill is reviewed for impairment annually or more frequently if events or changes in circumstances indicate that the carrying value may be impaired. Impairment losses in respect of goodwill are not reversed.
Intangible assets
Other intangible assets are stated at cost less accumulated amortisation and impairment losses. Useful lives of intangibles are reviewed and adjusted if appropriate at each reporting date. Amortisation is charged to the Consolidated Statement of Profit and Loss on a straight-line basis over the estimated useful lives of intangible assets, currently estimated as follows:
| | | | | |
| Years |
| Computer software | 2-8 |
| Customer relationships | 8-23 |
| Order backlog | 3-5 |
| Tradenames | 3 | |
| Technology asset | 5 | |
| Non-compete arrangements | 5 | |
| Patient database | 7 | |
The Group assesses at the end of each reporting period whether there is objective evidence that an intangible asset is impaired. An intangible asset is impaired and impairment losses are incurred only if there is objective evidence of impairment as a result of one or more events that occur after the initial recognition of the intangible asset (a 'loss event') and that loss event (or events) has an impact on the estimated future cash flows of the intangible asset that can be reliably estimated.
Impairment losses in respect of intangible assets are reversed if there has been a change in the estimates used to determine recoverable amount. Impairment losses are reversed only to the extent that the carrying amount of the intangible asset does not exceed the carrying value that would have been determined, net of amortisation, if no impairment loss had been recognised.
Inventories
Inventories, which comprise laboratory inventories, are stated at the lower of cost and net realisable value. Cost is based on the first-in, first-out principle and includes all expenditure incurred in acquiring the inventories and bringing them to their present location and condition. Cost in the case of raw materials comprises the purchase price and attributable costs, less trade discounts. Net realisable value is the estimated selling price in the ordinary course of business, less selling expenses.
Notes to Consolidated Financial Statements (continued)
for the year ended 31 December 2025
1. Basis of preparation and statement of accounting policies (continued)
Accounts payable
Trade and other payables are presented as current liabilities unless payment is not due within 12 months after the reporting period. They are recognised initially at fair value and subsequently measured at amortised cost using the effective interest rate method.
Government grants
Government grants received that compensate the Group for the cost of an asset are recognised in the Consolidated Statement of Financial Position initially as deferred income when there is reasonable assurance that it will be received and that the Group will comply with the conditions attaching to it. Such grants are recognised in the Consolidated Statement of Profit and Loss over the useful economic life of the asset which is consistent with the depreciation policy of the relevant asset.
Grants that compensate the Group for expenses incurred are recognised in the Consolidated Statement of Profit and Loss in the same periods in which the expenditure to which they relate is charged. Under grant agreements, amounts received may become repayable in full or in part should certain circumstances specified within the grant agreements occur, including downsizing by the Group, disposing of the related assets, ceasing to carry on its business or the appointment of a receiver over any of its assets. The Group has not recognised any such loss contingency having assessed as remote the likelihood of these events arising.
Provisions
A provision is recognised in the Consolidated Statement of Financial Position when the Group has a present or legal or constructive obligation as a result of a past event, and it is probable that an outflow of economic benefits will be required to settle the obligation. If the effect of the time value of money is material, provisions are determined by discounting the expected future cash flows at a pre-tax rate that reflects the time value of money and, where appropriate, the risks specific to the liability. Where discounting is used, the increase in the provision due to the passage of time is recognised as a finance cost.
A provision for restructuring is recognised when the Group has approved a detailed and formal restructuring plan, and the restructuring has either commenced or has been announced publicly. Future operating costs are not provided for.
Financial instruments
Financial assets and financial liabilities are recognised on the Consolidated Statement of Financial Position when the Group becomes party to the contractual provisions of the instrument.
Financial assets are recognised and derecognised on a trade date basis, being the date the Group commits to purchase or sell the asset under a contract.
Financial assets and liabilities are offset and presented on a net basis in the Consolidated Statement of Financial Position, only if the Group holds an enforceable legal right of set off for such amounts and there is an intention to settle on a net basis or to realise an asset and settle the liability simultaneously. In all other instances they are presented gross in the Consolidated Statement of Financial Position.
At initial recognition, the Group measures a financial asset at its fair value plus, in the case of a financial asset not at fair value through profit or loss (FVPL), transaction costs that are directly attributable to the acquisition of the financial asset. Transaction costs of financial assets carried at FVPL are expensed in profit or loss.
For assets measured at fair value, gains and losses will either be recorded in profit or loss or OCI. The classification depends on the entity's business model for managing financial assets and the contractual terms of the cash flows. For investments in equity instruments that are not held for trading, this will depend on whether the Group has made an irrevocable election at the time of initial recognition to account for the equity investment at fair value through other comprehensive income (FVOCI).
Notes to Consolidated Financial Statements (continued)
for the year ended 31 December 2025
1. Basis of preparation and statement of accounting policies (continued)
Financial instruments (continued)
Subsequent measurement of debt instruments depends on the Group's business model for managing the asset and the cash flow characteristics of the asset. There are three measurement categories into which the Group classifies its financial instruments:
•Amortised cost: Assets that are held for collection of contractual cash flows where those cash flows represent solely payments of principal and interest are measured at amortised cost. Interest income from these financial assets is included in finance income using the effective interest rate method. Any gain or loss arising on derecognition is recognised directly in profit or loss and presented in other gains/(losses) together with foreign exchange gains and losses.
•FVOCI: Assets that are held for collection of contractual cash flows and for selling the financial assets, where the assets' cash flows represent solely payments of principal and interest, are measured at FVOCI. Movements in the carrying amount are taken through OCI, except for the recognition of impairment losses. When the financial asset is derecognised, the cumulative gain or loss previously recognised in OCI is reclassified from equity to profit or loss and recognised in other gains/(losses). Interest income from these financial assets is included in finance income using the effective interest rate method.
•FVPL: Assets that do not meet the criteria for amortised cost or FVOCI are measured at FVPL. A gain or loss on a debt investment that is subsequently measured at FVPL is recognised in profit or loss.
The Group assesses on a forward-looking basis the expected credit losses associated with its debt instruments carried at amortised cost.
The Group reclassifies debt investments when and only when its business model for managing those assets changes.
(a) Cash and cash equivalents
Cash and cash equivalents include cash and highly liquid investments with original maturities of three months or less and are stated at fair value on initial recognition followed by amortised cost, which approximates fair value.
(b) Trade receivables
Trade receivables are amounts due from customers for services performed in the ordinary course of business. Trade receivables are recognised initially at the amount of consideration that is unconditional unless they contain significant financing components. The amount of consideration that is unconditional approximates to fair value. The Group holds the trade receivables with the objective to collect the contractual cash flows and therefore measures them subsequently at amortised cost using the effective interest method.
Where the Group enters into arrangements to sell certain trade receivables, such arrangements are accounted for in accordance with IFRS 9, Financial Instruments (“IFRS 9”). The underlying trade receivables are derecognised to the extent that substantially all of the risks and rewards of ownership of the trade receivables are transferred, under the terms of the arrangements. Cash proceeds received from such sales are included in operating cash flows.
(c) Interest bearing loans and borrowings
Borrowings are initially recognised at fair value, net of transaction costs incurred. Borrowings are subsequently measured at amortised cost. Subsequent to initial recognition, current and non-current interest bearing loans and borrowings are measured at amortised cost with any difference between cost and redemption value being recognised in the Consolidated Statement of Profit and Loss over the period of the borrowings on an effective interest rate basis. Fees paid on the establishment of loan facilities are recognised as transaction costs of the loan to the extent that it is probable that some or all of the facility will be drawn down. In this case, the fee is deferred until draw down will occur. Where there is no evidence that it is probable that some or all of the facility will be drawn down, the fee is capitalised as a prepayment and amortised over the period of the facility to which it relates.
Debt issuance costs relating to the Group’s long-term debt are recorded as a direct reduction of long-term debt; these costs are deferred and amortised to interest expense using the effective interest method, over the respective terms of the related debt. Debt issuance costs relating to the Group’s revolving credit facilities are recorded as an asset; these costs are deferred and amortised to interest expense using the straight-line method. Early repayment of debt facilities can result in modification of the debt and the acceleration of the amortisation of debt issuance costs.
Borrowings are classified as current liabilities unless the Group has a right to defer settlement of the liability for at least 12 months after the reporting date.
Notes to Consolidated Financial Statements (continued)
for the year ended 31 December 2025
1. Basis of preparation and statement of accounting policies (continued)
Financial instruments (continued)
Borrowings are removed from the Consolidated Statement of Financial Position when the obligation specified in the contract is discharged, cancelled or expired. The difference between the carrying amount of a financial liability that has been extinguished or transferred to another party and the consideration paid, including any non-cash assets transferred or liabilities assumed, is recognised in profit or loss as other income or finance costs.
(d) Equity instruments
The Group entered into subscription agreements with a number of funds. The Group subsequently measures all equity investments, including fund subscriptions, at FVPL. Changes in the fair value of equity investments and fund subscriptions measured at FVPL are recognised in the Consolidated Statement of Profit and Loss. Dividends or interest from such investments continue to be recognised in the Consolidated Statement of Profit and Loss when the Group’s right to receive payments is established.
(e) Current financial assets
The Group classifies short term investments as current financial assets. Short-term investments comprise highly liquid investments with maturities of greater than three months. Current financial assets are subsequently measured at fair value through OCI.
(f) Impairment of financial assets
The Group's financial assets measured at amortised cost, the most significant of which are trade receivables and unbilled receivables, are subject to IFRS 9's expected credit loss model.
For trade receivables and unbilled revenue, the Group applies the simplified approach permitted by IFRS 9, which requires expected lifetime losses to be recognised from initial recognition of the receivables. See Notes 16 and 24 for further details. The expected credit losses on these financial assets are estimated based on the Group’s historical credit loss experience, adjusted for factors that are specific to the debtors, general economic conditions and an assessment of both the current, as well as the forecast direction of conditions, at the reporting date.
The Group writes off a financial asset when there is information indicating that the debtor is in severe financial difficulty and there is no realistic prospect of recovery, e.g. when the debtor has been placed under liquidation or has entered into bankruptcy proceedings. Financial assets written off may still be subject to enforcement activities under the Group’s recovery procedures, taking into account legal advice where appropriate. Any recoveries made are recognised in profit or loss.
(g) Derivative financial instruments and hedging
Derivatives are initially recognised at fair value on the date a derivative contract is entered into and are subsequently remeasured to their fair value at the end of each reporting period. The accounting for subsequent changes in fair value depends on whether the derivative is designated as a hedging instrument, and if so, the nature of the item being hedged. The Group designates certain derivatives as either:
•hedges of the fair value of recognised assets or liabilities or a firm commitment (fair value hedges)
•hedges of a particular risk associated with the cash flows of recognised assets and liabilities and highly probable forecast transactions (cash flow hedges), or
•hedges of a net investment in a foreign operation (net investment hedges).
At inception of the hedge relationship, the Group documents the economic relationship between hedging instruments and hedged items including whether changes in the cash flows of the hedging instruments are expected to offset changes in the cash flows of hedged items. The Group documents its risk management objective and strategy for undertaking its hedge transactions.
The fair value of derivative financial instruments designated in hedge relationships are disclosed in Note 24 Financial instruments in Notes to the Consolidated Financial Statements. Movements in the hedging reserve are shown in shareholders' equity. The full fair value of a hedging derivative is classified as a non-current asset or liability when the remaining maturity of the hedged item is more than 12 months. It is classified as a current asset or liability when the remaining maturity of the hedged item is less than 12 months.
Notes to Consolidated Financial Statements (continued)
for the year ended 31 December 2025
1. Basis of preparation and statement of accounting policies (continued)
Financial instruments (continued)
Cash flow hedges that qualify for hedge accounting
The effective portion of changes in the fair value of derivatives that are designated and qualify as cash flow hedges is recognised in the other reserve within equity. The gain or loss relating to the ineffective portion is recognised immediately in profit or loss, within other gains/(losses).
When a hedging instrument expires or is sold or terminated, or when a hedge no longer meets the criteria for hedge accounting, any cumulative deferred gain or loss and deferred costs of hedging in equity at that time remains in equity until the forecast transaction occurs. Changes in the fair value of any derivative instrument that does not qualify for hedge accounting are recognised immediately in profit or loss.
Fair value hierarchy
The Group reports using the fair value hierarchy in relation to its assets and liabilities which are measured at fair value expect for those which are exempt as defined under IFRS 13, Fair Value Measurement. The fair value hierarchy categorises the inputs to valuation techniques to measure fair value into three levels:
•Level 1: Inputs are based upon unadjusted quoted prices for identical instruments traded in active markets.
•Level 2: Inputs are based upon quoted prices for similar instruments in active markets, quoted prices for identical or similar instruments in markets that are not active and model-based valuation techniques for which all significant assumptions are observable in the market or can be corroborated by observable market data for substantially the full term of the assets or liabilities.
•Level 3: Inputs are generally unobservable and typically reflect management’s estimates of assumptions that market participants would use in pricing the asset or liability.
Share capital
Ordinary shares are classified as equity. Incremental costs directly attributable to the issue of new shares or options are shown in equity as a deduction, net of tax, from the proceeds.
Where ordinary shares are re-purchased by the Company they are cancelled and the nominal value of the shares is transferred to other undenominated capital within equity.
Equity method investments
The Company’s investments that are not consolidated are accounted for under the equity method if the Company exercises significant influence that is considered to be greater than minor. The Company records its pro rata share of the earnings/losses of these investments in Share of equity method investments in the Consolidated Statements of Profit and Loss. The Company reviews these for impairment whenever events or changes in circumstances indicate that the carrying amounts may not be recoverable.
Employee benefits
(a) Share-based payments
Share-based payments comprise options to acquire ordinary shares in the Company, Restricted Share Units ('RSUs') and Performance Share Units ('PSUs') in the form of ordinary share entitlements after a certain period of time. These are awarded to certain key employees and Directors of the Group based on service conditions such as term of employment and individual performance. The fair value of options, RSUs and PSUs granted is recognised as an employee expense with a corresponding increase in equity. The fair value is measured at grant date and spread over the period during which the Directors and other employees become unconditionally entitled to the options, RSUs or PSUs. The fair value of options granted is measured using a model taking into account the terms and conditions upon which the options were granted. The fair value of RSUs and PSUs is equal to the market price of a share at date of grant. The total amount to be expensed is determined by reference to the fair value of the options, RSUs or PSUs granted. The amount recognised as an expense is adjusted to reflect the assumption of the number of share options, RSUs or PSUs that vest.
Forfeitures are estimated on the date of grant and revised if actual or expected forfeiture activity differs materially from original estimates.
Share-based payment expense is recognised over the requisite service period for awards of equity instruments to employees based on the grant date fair value of those awards expected to ultimately vest.
Notes to Consolidated Financial Statements (continued)
for the year ended 31 December 2025
1. Basis of preparation and statement of accounting policies (continued)
Employee benefits (continued)
Replacement awards
In connection with the completion of the Merger (See note 14 Business combinations in Notes to the Consolidated Financial Statements for definition of ‘Merger’), the Company issued replacement awards to the holders of PRA equity awards on 1 July 2021. An exchange of share-based compensation awards in a business combination is treated as a modification under IFRS 2. The replacement awards and the original acquiree awards are measured at fair value at the acquisition date and calculated using the fair-value-based measurement principles in IFRS 2. Amounts attributable to pre-combination vesting are accounted for as part of the consideration transferred for the acquiree. Amounts attributable to post-combination vesting are accounted for separate from the business combination and are recognised as compensation cost in the post-combination period.
(b) Share-based payments – Company
The Company operates a number of share-based payment plans the details of which are presented in Note 11 Share-based payments in Notes to the Consolidated Financial Statements. The share-based payment expense associated with the share-based payment plans is recognised by the entity which receives services in exchange for the share-based compensation.
The Statement of Profit and Loss of the Company is charged with the expense related to the services received by the Company. The remaining portions of the share-based payments represent a contribution to Company’s subsidiaries and are added to the carrying amount of those investments. Under an agreement, with certain subsidiaries, on the date of exercise the Company is paid an amount equal to the fair value of the ordinary shares issued that is in excess of the award exercise price with such amount reducing the Company’s investment in its subsidiaries. The net effect of the grant date fair value of the Company’s share-based compensation to employees of the Company’s subsidiaries and recharges received from those subsidiaries is presented as a movement in financial fixed assets (see Note 2 Investment in subsidiaries, in Notes to the Company financial statements).
Revenue recognition
The Group primarily earns revenues by providing a number of different services to its customers. These services, which are integral elements of the clinical development process, include clinical trials management, consulting, contract staffing, data services and laboratory services. These services, which are described below, can be purchased collectively or individually as part of a clinical trial contract. There is not significant variability in how economic factors affect these services. Contracts range in duration from a number of months to several years.
Clinical trial service revenue
Under IFRS 15 Revenue from Contracts with Customers ('IFRS 15'), a clinical trial service is a single performance obligation satisfied over time. It represents the full service obligation in respect of a clinical trial (including those services performed by investigators and other parties) and is considered a single performance obligation. Promises offered to the customer are not distinct within the context of the contract. ICON is the contract principal in respect of both direct services and in the use of third parties (principally investigator services) that support the clinical research projects. The transaction price is determined by reference to the contract or change order value (total service revenue and pass-through/reimbursable expenses) adjusted downwards to reflect a realisable contract value. Revenue is recognised as the single performance obligation is satisfied. The progress towards completion for clinical service contracts is measured based on an input measure being project costs incurred as a proportion of total project costs (inclusive of third-party costs) at each reporting period.
Contracting services revenue
The Group has availed of the practical expedient which results in recognition of revenue on a right to invoice basis. Application of the practical expedient reflects the right to consideration from the customer in an amount that corresponds directly with the value to the customer of the performance completion to date. This reflects hours performed by contract staff.
Consulting services revenue
Consulting services contracts represent a single performance obligation satisfied over time. The transaction price is determined by reference to contract or change order value. Revenue is recognised as the performance obligation is satisfied. The progress towards completion for consulting contracts is measured based on total project inputs (time) at each reporting period as a percentage of forecasted total project inputs.
Notes to Consolidated Financial Statements (continued)
for the year ended 31 December 2025
1. Basis of preparation and statement of accounting policies (continued)
Revenue recognition (continued)
Laboratory services revenue
Revenue is recognised when, or as, obligations under the terms of a contract are satisfied, which occurs when control of the products or services is transferred to the customer. Revenue for laboratory services is measured as the amount of consideration we expect to receive in exchange for transferring products or services. Where contracts with customers contain multiple performance obligations, the transaction price is allocated to each performance obligation based on the estimated relative selling price of the promised good or service.
Service revenue is recognised over time as the services are delivered to the customer based on the extent of progress towards completion of the performance obligation. The determination of the methodology to measure progress requires judgement and is based on the nature of services provided. This requires an assessment of the transfer of value to the customer. The right to invoice measure of progress is generally related to rate per unit contracts, as the extent of progress towards completion is measured based on discrete service or time-based increments, such as samples tested or labour hours incurred. Revenue is recorded in the amount invoiced since those amounts corresponds to the value of the Company's performance and the transfer of value to the customer.
Data services revenue
The Company provides data reports and analytics to customers based on agreed-upon specifications, including the timing of delivery, which is typically either weekly, monthly, or quarterly. If a customer requests more than one type of data report or series of data reports within a contract, each distinct type of data report is a separate performance obligation. The contracts provide for the Company to be compensated for the value of each deliverable. The transaction price is determined using list prices, discount agreements, if any, and negotiations with the customers, and generally includes any out-of-pocket expenses. Typically, the Company bills in advance of services being provided with the amount being recorded as unearned revenue.
When multiple performance obligations exist, the transaction price is allocated to performance obligations on a relative standalone selling price basis. In cases where the Company contracts to provide a series of data reports, or in some cases data, the Company recognises revenue over time using the “units delivered” output method as the data or reports are delivered. Expense reimbursements are recorded to revenue as the expenses are incurred as they relate directly to the services performed.
Certain arrangements include upfront customisation or consultative services for customers. These arrangements often include payments based on the achievement of certain contractual milestones. Under these arrangements, the Company contracts with a customer to carry out a specific study, ultimately resulting in delivery of a custom report or data product. These arrangements are a single performance obligation given the integrated nature of the service being provided. The Company typically recognises revenue under these contracts over time, using an appropriate measure of progress, generally time elapsed, to measure progress and transfer of control of the performance obligation to the customer. Expense reimbursements are recorded to revenue as the expenses are incurred as they relate directly to the service performed.
The Company enters into contracts with some of its larger data suppliers that involve non-monetary terms. The Company issues purchase credits to be used toward the data supplier's purchase of the Company's services based on the fair value of the data obtained. In exchange, the Company receives monetary discounts on the data received from the data suppliers. The fair value of the revenue earned from the customer purchases is recognised as services are delivered as described above. At the end of the contract year, any unused customer purchase credits may be forfeited or carried over to the next contract year based on the terms of the data supplier contract.
Commissions
Incremental costs of obtaining a contract are recognised as an asset on the Consolidated Statement of Financial Position in respect of those contracts that exceed one year. Where commission costs relate to contracts that are less than one year, the practical expedient is applied as the amortisation period of the asset which would arise on deferral would be one year or less.
Reimbursable expenses
Reimbursable expenses comprise investigator payments and certain other costs which are reimbursed by clients under terms specific to each contract. The Company includes reimbursed expenses in revenue and direct costs as the Company is primarily responsible for fulfilling the promise to provide the specified service, including integration of the related services into a combined output to the customer.
Notes to Consolidated Financial Statements (continued)
for the year ended 31 December 2025
1. Basis of preparation and statement of accounting policies (continued)
Direct costs
Direct costs consist of compensation, associated employee benefits and share-based payments for project-related employees and other direct project-related costs. Reimbursable expenses are presented within direct costs. This presentation is to align the presentation of costs with our assessment that our clinical trial service is a single performance obligation satisfied over time. Reimbursable expenses are recorded once the activity which forms the basis for the cost has occurred. Payments are made based on predetermined contractual arrangements. Timing of payments may differ from the timing of the expense.
Other operating expenses
Other operating expenses consist of compensation, associated employee benefits and share-based payments for non-project-related employees and other indirect costs associated with the business. Other operating expenses also include depreciation expense and the amortisation of intangible assets.
Exceptional items
The Company has used the term “exceptional” to describe certain items which, in management’s view, warrant separate disclosure by virtue of their size or incidence, or due to the fact that certain gains or losses are determined to be non-recurring in nature. Exceptional items may include restructuring, transaction and integration-related expenses, significant impairments (Goodwill and non financial assets) and related resulting provisions, and material changes in estimates.
Transaction and integration-related expenses
Transaction and integration-related expenses are the incremental costs directly attributable to completion and integration activities associated with the Group’s recent acquisitions. The costs consist of investment banking fees, advisory costs, professional fees, legal costs, retention agreements with employees, and ongoing business combination and integration activities offset by the remeasurement of liability-classified contingent consideration. The Group accounts for these transaction and integration-related costs as expenses in the period in which the costs are incurred and the services are received.
Restructuring
Restructuring charges reflect certain one-time and associated unavoidable costs arising from reorganisation programmes announced by Group management. These programmes generally result in asset impairments and workforce reductions in order to optimise the Group’s structure and facilitate improved long-term performance. Impairment charges are taken when the value-in-use of the asset is less than the asset’s carrying value. Workforce related charges are taken when an approved reorganisation programme is communicated to the relevant employee groups.
Research and development credits
Research and development credits are available to the Group under the tax laws in certain jurisdictions, based on qualifying research and development spend as defined under those tax laws. Research and development credits may be recognised as a reduction of income tax expense. However, certain tax jurisdictions provide refundable credits that are not wholly dependent on the Group's ongoing income tax status or income tax position. In these circumstances the benefit of these credits is not recorded as a reduction to income tax expense, but rather as a reduction of operating expenditure.
Finance income
Interest income is recognised in the Consolidated Statement of Profit and Loss as it accrues using the effective interest rate method and includes interest receivable on investments.
Finance costs
Finance costs comprises interest payable on borrowings calculated using the effective interest rate method, finance charges on leases, foreign exchange gains and losses on bank loans and gains and losses on hedging instruments that are recognised in the Consolidated Statement of Profit and Loss.
Financing expense also includes fees paid on the establishment of loan facilities which are recognised as transaction costs of the loan to the extent that it is probable that some or all of the facility will be drawn down. These fees are deferred and recognised in the Statement of Financial Position and are then amortised to the Consolidated Statement of Profit and Loss over the term the facility is available to the Group.
Notes to Consolidated Financial Statements (continued)
for the year ended 31 December 2025
1. Basis of preparation and statement of accounting policies (continued)
Income tax
Income tax expense in the Consolidated Statement of Profit and Loss represents the sum of income tax currently payable and deferred income tax.
Income tax currently payable is based on taxable profit for the year. Taxable profit differs from net profit as reported in the Consolidated Statement of Profit and Loss because it excludes items of income or expense that are taxable or deductible in other years and further excludes items that are not taxable or deductible. The Group’s liability for income tax is calculated using rates that have been enacted or substantively enacted at the reporting date. Income tax is recognised in the Consolidated Statement of Profit and Loss except to the extent that it relates to items recognised directly in equity.
Deferred income tax is provided, using the liability method, on all differences between the carrying amounts of assets and liabilities for financial reporting purposes and the amounts used for taxation purposes except those arising from non-deductible goodwill or on initial recognition of an asset or liability which affects neither accounting nor taxable profit and does not give rise to equal taxable and deductible temporary differences. Deferred income tax assets and liabilities are measured at the tax rates that are expected to apply in the year when the asset is expected to be realised or the liability to be settled.
Deferred tax assets are recognised for all deductible differences, carry forward of unused tax credits and unused tax losses, to the extent that it is probable that taxable profit will be available against which the deductible temporary differences and the carry forward of unused tax credits and unused tax losses can be utilised. The carrying amount of deferred income tax assets is reviewed at each reporting date and reduced to the extent that it is no longer probable that sufficient taxable profit would be available to allow all or part of the deferred income tax asset to be utilised.
The Group offsets deferred tax assets and deferred tax liabilities only if it has a legally enforceable right to set off current tax assets and current tax liabilities and the deferred tax assets and deferred tax liabilities relate to income taxes levied by the same taxation authority on either the same taxable entity or different taxable entities which intend either to settle current tax liabilities and assets on a net basis, or to realise the assets and settle the liabilities simultaneously, in each future period in which significant amounts of deferred tax liabilities or assets are expected to be settled or recovered.
The Group has determined that the global minimum top-up tax – which it is required to pay under Pillar Two legislation – is an income tax in scope of IAS 12. The Group has applied a temporary mandatory relief from deferred tax accounting for the impacts of the top-up tax and accounts for it as current tax when it is incurred.
Earnings per ordinary share
Basic earnings per share is computed by dividing the profit for the financial year attributable to ordinary shareholders of the Company by the weighted average number of ordinary shares outstanding during the financial period.
Diluted net income per ordinary share is computed by adjusting the weighted average number of ordinary shares outstanding during the period for all potentially dilutive ordinary shares outstanding during the period and adjusting net income for any changes in income or loss that would result from the conversion of such potential ordinary shares. There is no difference in net income used for basic and diluted net income per ordinary share.
Segment reporting
An operating segment is a component of the Group that engages in business activities from which it may earn revenues and incur expenses, including revenues and expenses that relate to transactions with any of the Group’s other components. The Group determines and presents operating segments based on the information that internally is provided to the Chief Executive Officer (CEO), Chief Financial Officer (CFO) and the former Chief Operating Officer (now the current Chief Executive Officer) who together are considered the Group’s chief operating decision makers, the ‘CODM’. An operating segment’s operating results are reviewed regularly by the CODM to make decisions about resources to be allocated to the segment and assess its performance, and for which discrete financial information is available.
Segment results that are reported to the CODM include items directly attributable to a segment as well as those that can be allocated on a reasonable basis. Segment capital expenditure is the total cost incurred during the period to acquire property, plant and equipment and right-of-use assets.
Investments in subsidiaries - Company
Investments in subsidiary undertakings are stated at cost less any accumulated impairment and are reviewed for impairment if there are indicators that the carrying value may not be recoverable.
Intercompany receivable and payable - Company
Intercompany loans receivable and payable are initially recognised at fair value. These are subsequently measured at amortised cost, less any expected credit loss, calculated on an expected credit loss basis (simplified approach).
Notes to Consolidated Financial Statements (continued)
for the year ended 31 December 2025
1. Basis of preparation and statement of accounting policies (continued)
Dividend income - Company
Dividend income is recognised when the right to receive payment is established.
2. Segmental information
The Company is a CRO providing outsourced services on a global basis to pharmaceutical, biotechnology, medical device and government and public health organisations. It specialises in the strategic development, management and analysis of programmes that support all stages of the clinical development process - from compound selection to Phase I-IV clinical studies. The Company has the expertise and capability to conduct clinical trials in most major therapeutic areas on a global basis and has the operational flexibility to provide development services on a stand-alone basis or as part of an integrated “full-service” or “blended-service” solution. The Company has expanded through internal growth, together with a number of strategic acquisitions to enhance its expertise and capabilities in certain areas of the clinical development process.
The Company operates as one reportable segment, which is the provision of outsourced development services on a global basis to the pharmaceutical, biotechnology and medical devices industries. The Company determines and presents operating segments based on the information that is internally provided to the chief operating decision maker (“CODM”) in accordance with IFRS 8 Operating Segments.
During the year ended 31 December 2025, the Company determined that Chief Operating Decision Maker (“CODM”) was comprised of the Chief Executive Officer, the Chief Financial Officer and the former Chief Operating Officer (now the current Chief Executive Officer). For the year ended 31 December 2024 the Company determined that Chief Operating Decision Maker (“CODM”) was comprised of the Chief Executive Officer and the Chief Financial Officer. As the Company is managed on a consolidated basis, the CODM evaluates performance and allocates resources based on consolidated net income.
The Group’s listing for its shares is the NASDAQ market in the United States. Consequently, information reviewed by the chief operating decision makers is prepared in accordance with US generally accepted accounting principles (“U.S. GAAP”) however, the information presented below is prepared in accordance with IFRS reporting standards. Reconciliations of the Group’s profit for the financial year and shareholders’ equity from U.S. GAAP to IFRS are set out on pages 151 to 155 of this report.
Revenues are allocated to individual entities based on where the work is performed in accordance with the Company's global transfer pricing model. Revenues and income from operations in Ireland are a function of our global contracting model and the Group’s transfer pricing model.
ICON Clinical Research Limited and Accellacare Limited (collectively “ICON Ireland”) acts as the Group entrepreneur under the Company’s global transfer pricing model given its role in the development and management of the Group, its ownership of key intellectual property and customer relationships, its key role in the mitigation of risks faced by the Group and its responsibility for maintaining the Company’s global network. ICON Ireland enters into the majority of the Company’s customer contracts.
ICON Ireland remunerates other operating entities in the Group on the basis of an arm’s length return, in accordance with the 2022 OECD transfer pricing guidelines, for the services they perform in each of their local territories. The arm’s length return for each ICON entity is established to ensure that each of ICON Ireland and the ICON entities that are involved in the conduct of services for customers, earn an appropriate return having regard to their respective functions performed, assets owned, and risks assumed in these intercompany transactions. The arm’s length return is reviewed annually.
The geographic split of revenue disclosed for each region outside Ireland is the arm’s length revenue attributable to these entities under the policies outlined above. The residual revenues of the Group, once each ICON entity has been paid its respective intercompany service fee, generally fall to be retained by ICON Ireland. As such, revenues and income from operations in Ireland are a function of this global transfer pricing model and comprise revenues of the Group after deducting the arm’s length revenues attributable to the activities performed outside Ireland.
There have been no changes to the overall basis of segmentation or the measurement basis for the segment results since the prior year.
In the year ended 31 December 2025, the Group restated the prior year financial information. Details of the restatements are contained in Note 1 to the Consolidated Financial Statements.
Notes to Consolidated Financial Statements (continued)
for the year ended 31 December 2025
2. Segmental information (continued)
Geographical segment information
| | | | | | | | |
| 31 December
2025 | 31 December
2024
(As Restated) |
| $’000 | $’000 |
| Revenue | | |
| Ireland | 3,183,637 | | 2,703,765 | |
| Rest of Europe | 1,590,867 | | 1,559,532 | |
| United States | 2,524,938 | | 2,983,052 | |
| Rest of World | 951,898 | | 942,641 | |
| Total | 8,251,340 | | 8,188,990 | |
| | | | | | | | |
| 31 December
2025 | 31 December
2024
(As Restated) |
| $’000 | $’000 |
| Property, plant and equipment and right-of-use assets | | |
| Ireland | 63,526 | | 51,986 | |
| Rest of Europe | 90,260 | | 85,876 | |
| United States | 112,328 | | 114,464 | |
| Rest of World | 53,517 | | 60,103 | |
| Total | 319,631 | | 312,429 | |
3. Revenue
In the year ended 31 December 2025, the Group restated the prior year financial information. Details of the restatements are contained in Note 1 to the Consolidated Financial Statements.
Revenue disaggregated by customer concentration is as follows:
| | | | | | | | | | | |
| 31 December
2025 | 31 December
2024
(As Restated) | | | |
| $’000 | $’000 | | |
| Top client | 576,265 | | 641,655 | | | | |
| Clients 2-5 | 1,469,978 | | 1,421,972 | | | | |
| Clients 6-10 | 1,164,937 | | 1,288,951 | | | | |
| Clients 11-25 | 2,072,282 | | 1,759,121 | | | | |
| Other | 2,967,878 | | 3,077,291 | | | | |
| Total revenue | 8,251,340 | | 8,188,990 | | | | |
There was no revenue from individual customers greater than 10% of consolidated revenue in the respective years. Our customers have similar profiles and economic characteristics, and therefore have similar degrees of risk and growth opportunities.
Notes to Consolidated Financial Statements (continued)
for the year ended 31 December 2025
4. Finance income
| | | | | | | | |
| 31 December
2025 | 31 December
2024 |
| $’000 | $’000 |
| Interest receivable | 7,109 | | 8,609 |
| | |
| Total finance income | 7,109 | | 8,609 |
All of the above relate to items not at fair value through profit and loss.
5. Finance costs
| | | | | | | | |
| 31 December
2025 | 31 December
2024 |
| $’000 | $’000 |
| Interest expense on drawn facilities | 188,109 | | 206,198 | |
| Interest on lease liabilities | 6,184 | | 5,379 | |
| Amortisation of merger related financing fees | 5,980 | | 23,533 |
| Other financing costs* | 3,401 | | 7,506 | |
| Total finance expense | 203,674 | | 242,616 |
*includes costs associated with the senior secured revolving loan facility.
The Company incurred interest costs from various financing arrangements during the years ended 31 December 2025 and 31 December 2024 as set out in the table above. These costs have been charged in the finance costs line of the Consolidated Statement of Profit and Loss. All of the above relate to items not at fair value through profit and loss.
6. Profit before taxation
Profit before taxation is stated after charging the following:
Auditor's remuneration
For the year ended 31 December 2025, the Company’s statutory auditor was Ernst & Young. The table below summarises the fees for professional services rendered by Ernst & Young for the year ended 31 December 2025.
| | | | | | | | | | | |
| 31 December 2025 |
| Statutory auditor | Affiliated firms | Total |
| $’000 | $’000 | $’000 |
Audit fees (1) | 12,753 | | 370 | | 13,123 | |
| Audit related fees | — | | — | | — | |
| Total audit and audit related fees | 12,753 | | 370 | | 13,123 | |
| | | |
Tax fees (2) | — | | 603 | | 603 | |
Other fees (3) | 41 | | — | | 41 | |
| Total non-audit fees | 41 | | 603 | | 644 | |
| | | |
| Total fees | 12,794 | | 973 | | 13,767 | |
| | | |
(1)Audit fees include annual audit and review fees in respect of certain quarterly review services for the Company and its subsidiaries. Of the above audit fee of $13.1 million, $4.2 million is expensed at 31 December 2025. The balance will be recorded in our Consolidated Statement of Profit and Loss for the year ended 31 December 2026 as incurred.
(2)Tax fees represent services across a number of areas including International tax advisory services, tax compliance and indirect tax advisory services and other ad hoc tax advisory and planning.
(3)Other fees primarily consist of permissible services in relation to environment, social and governance reporting advice.
Notes to Consolidated Financial Statements (continued)
for the year ended 31 December 2025
6. Profit before taxation (continued)
For the year ended 31 December 2024, the Company’s statutory auditor was KPMG. The table below summarises the fees for professional services rendered by KPMG for the year ended 31 December 2024
| | | | | | | | | | | |
| 31 December 2024 |
| Statutory auditor | Affiliated firms | Total |
| $’000 | $’000 | $’000 |
Audit fees (1) | 3,103 | | 59 | | 3,162 | |
Other assurance fees: audit related fees (2) | 822 | | 180 | | 1,002 | |
| Other Non-audit fees: Tax compliance and the preparation of tax returns and refund claims | 404 | | 352 | | 756 | |
| Total audit, audit related and tax compliance fees | 4,329 | | 591 | | 4,920 | |
| | | |
Other tax planning and consulting services (3) | 2,094 | | 20 | | 2,114 | |
Tax advice relating to integration of ICON and PRA (4) | 1,036 | | — | | 1,036 | |
Other fees (5) | 193 | | — | | 193 | |
| Total non-audit service fee / tax advisory fees | 3,323 | | 20 | | 3,343 | |
| | | |
| Total fees | 7,652 | | 611 | | 8,263 | |
| | | |
(1)Audit fees include annual audit and quarterly review fees for ICON Plc.
(2)Audit related fees principally consist of fees for assurance and related services, such as financial due diligence services, fees for the audit of employee benefit plans, fees for pension reviews and audit fees of Company subsidiaries and services provided in connection with statutory and regulatory filings.
(3)Other tax planning and consulting services represent services across a number of areas including in relation to the Group's financing facilities and other ad hoc tax advisory and planning.
(4)Tax advice relating to the integration of ICON and PRA including integration of business activities and the elimination of legal entities.
(5)Other fees primarily consist of permissible services in relation to environment, social and governance reporting advice.
Not included in the above table are billed fees by KPMG for their restatement audits of the U.S. GAAP results for the years ended 31 December 2024 and 31 December 2023 included in the 20-F filing in an amount of $4.5 million. This amount will be recorded in our Consolidated Statement of Profit and Loss for the year ended 31 December 2026 as incurred.
The Audit Committee pre-approves all audit and non-audit services provided to the Company by its auditors.
Depreciation and amortisation
| | | | | | | | |
| 31 December
2025 | 31 December
2024
(As Restated) |
| $’000 | $’000 |
| Depreciation of property, plant and equipment (Note 12) | 52,882 | | 47,780 | |
| Depreciation of right-of-use assets (Note 25) | 37,648 | | 41,014 | |
| Amortisation of intangible assets (Note 13) | 330,114 | | 440,720 | |
| Total depreciation and amortisation | 420,644 | | 529,514 | |
Notes to Consolidated Financial Statements (continued)
for the year ended 31 December 2025
6. Profit before taxation (continued)
Directors’ remuneration
| | | | | | | | |
| 31 December
2025 | 31 December
2024 |
| $’000 | $’000 |
| Emoluments | 2,663 | | 2,433 | |
Benefits under long-term incentive schemes (1) | 10,703 | | 2,807 | |
| Gain on exercise of share options | 801 | | 4,873 | |
| Compensation for loss of office | 1,299 | | — | |
Pension contributions (defined contribution) (2) | 148 | | 130 | |
Directors' remuneration disclosures as required by Section 305 of the Companies Act are set out above. Further details regarding Directors’ shareholdings, share options and compensation are shown in Note 10 Payroll and related benefits in Notes to the Consolidated Financial Statements .
(1) Included in the benefits under long-term incentive scheme are amounts relating to Restricted Share Unit and Performance Share Unit entitlements, the calculation of which was based on the share-based payment charge calculated under IFRS 2 Share-Based Payments.
(2) Retirement benefits accrued to two Directors (2024: one Director) under a defined contribution scheme.
Notes to Consolidated Financial Statements (continued)
for the year ended 31 December 2025
7. Income tax expense
In the year ended 31 December 2025, the Group restated the prior year financial information. Details of the restatements are contained in Note 1 to the Consolidated Financial Statements.
The components of the current and deferred tax expense for the years ended 31 December 2025 and 2024 were as follows:
| | | | | | | | |
| 31 December
2025 | 31 December
2024
(As Restated) |
| $’000 | $’000 |
| Current tax expense | | |
Current year | | |
- Ireland | 88,232 | | 108,031 | |
- Other | 93,006 | | 52,912 | |
| 181,238 | | 160,943 | |
| Deferred tax credit | | |
| Origination and reversal of temporary differences | (161,611) | | (90,702) | |
| | |
| (Over) / under provided in prior years | | |
Current tax | (30,154) | | 10,169 | |
Deferred tax | 27,002 | | (4,937) | |
| (Over) / under provided in prior years | (3,152) | | 5,232 | |
| Total income tax expense in profit and loss | 16,475 | | 75,473 | |
| | |
| Tax recognised directly in equity | | |
| Deferred tax recognised directly in equity | (4,147) | | 13,971 | |
| Current tax recognised directly in equity | 961 | | (3,596) | |
| Total tax recognised in equity | (3,186) | | 10,375 | |
| | |
| Income tax recognised in other comprehensive income | | |
| Fair value of cash flow hedge | (346) | 647 |
| Tax on currency impact on long-term funding | (7,048) | 1,728 |
| Tax impact of pension contributions | 2,818 | (895) | |
| Total income tax recognised in other comprehensive income | (4,576) | 1,480 |
The total tax expense of $16.5 million and $75.5 million for the years ended 31 December 2025 and 31 December 2024 respectively, reflects tax at standard rates on taxable profits in the jurisdictions in which the Group operates, foreign withholding tax and the availability of tax losses.
The deferred tax credit of $161.6 million for the year ended 31 December 2025 and the deferred tax credit of $90.7 million for the year ended 31 December 2024, is mainly driven by an increase in Net Operating Loss carry forwards, the timing of tax deductions available relating to the Group’s share-based compensation schemes, the timing of certain intangible asset amortisation primarily on US acquisitions and the temporary differences associated with investments in foreign subsidiaries where the Company does not consider the earnings to be indefinitely reinvested.
Notes to Consolidated Financial Statements (continued)
for the year ended 31 December 2025
7. Income tax expense (continued)
A reconciliation of the expected tax expense, computed by applying the standard Irish tax rate to income before tax to the actual tax expense was as follows:
| | | | | | | | |
| 31 December
2025 | 31 December
2024
(As Restated) |
| $’000 | $’000 |
| Profit before tax | 230,513 | | 802,550 | |
| Irish standard tax rate | 12.5 | % | 12.5 | % |
| | |
Taxes at Irish standard tax rate | 28,814 | | 100,319 | |
| | |
| (Over) / under provision in respect to prior years | (3,152) | | 5,232 | |
| Foreign and other income taxed at higher rates | 56,164 | | 44,912 | |
| Rate differential from amortisation of intangible assets | (49,828) | | (48,240) | |
| Effect of change in tax rates | — | | 25,691 | |
| Decrease in unrecognised tax benefits | (25,952) | | (61,679) | |
| | |
| Losses for which no benefit previously recognised | (474) | | (5,279) | |
| | |
| Research and development tax incentives | (4,153) | | (3,041) | |
| Impact of stock compensation | (8,851) | | 1,733 | |
| Investor tax credit on foreign subsidiaries earnings | (30,496) | | (7,995) | |
| | |
| Global minimum tax | 12,475 | | 16,719 | |
| Non‑deductible impairment losses | 57,807 | | — | |
| Other | (15,879) | | 7,101 | |
| Tax expense on profit for the year | 16,475 | | 75,473 | |
The net deferred tax asset at 31 December 2025 and 31 December 2024 was as follows:
| | | | | | | | |
| 31 December
2025 | 31 December
2024
(As Restated) |
| $’000 | $’000 |
| Deferred taxation assets | | |
| Net operating losses carried forward | 140,895 | | 125,960 | |
| Accrued and other liabilities | 82,356 | | 78,417 | |
| Property, plant and equipment | 14,538 | | 7,869 | |
| Deferred revenue | 862 | | 10,364 | |
| Share-based payment | 34,935 | | 24,355 | |
| Other | 7,832 | | 14,358 | |
| Total deferred taxation assets | 281,418 | | 261,323 | |
| Less: offset against deferred tax liabilities | (155,048) | | (175,448) | |
| Deferred tax asset disclosed on Consolidated Statement of Financial Position | 126,370 | | 85,875 | |
Notes to Consolidated Financial Statements (continued)
for the year ended 31 December 2025
7. Income tax expense (continued)
| | | | | | | | |
| 31 December
2025 | 31 December
2024
(As Restated) |
| $’000 | $’000 |
| Deferred taxation liabilities | | |
| Property, plant and equipment | 3,703 | | 2,869 | |
| Goodwill and related assets | 43,150 | | 43,390 | |
| Other intangible assets | 803,600 | | 901,733 | |
| Investments in foreign subsidiaries | 4,487 | | 34,983 | |
| Other | 13,078 | | 2,632 | |
| Total deferred taxation liabilities | 868,018 | | 985,607 | |
| Less: offset against deferred tax assets | (155,048) | | (175,448) | |
| Deferred tax liability disclosed on Consolidated Statement of Financial Position | 712,970 | | 810,159 | |
| Net deferred taxation liability | (586,600) | | (724,284) | |
The movement in temporary differences during the year ended 31 December 2025 was as follows:
| | | | | | | | | | | | | | | |
| 1 January 2025 | Recognised in Income | | Recognised in Equity | 31 December 2025 |
| $’000 | $’000 | | $’000 | $’000 |
| Deferred taxation assets | | | | | |
| Net operating loss carry forwards | 125,960 | | 14,935 | | | — | | 140,895 | |
| Accrued and other liabilities | 78,417 | | 3,939 | | | — | | 82,356 | |
| Property, plant and equipment | 7,869 | | 6,669 | | | — | | 14,538 | |
| Share-based payment | 24,355 | | 6,433 | | | 4,147 | | 34,935 | |
| Deferred revenue | 10,364 | | (9,502) | | | — | | 862 | |
| Other | 14,358 | | (6,526) | | | — | | 7,832 | |
Total deferred taxation assets | 261,323 | | 15,948 | | | 4,147 | | 281,418 | |
| | | | | |
| Deferred taxation liabilities | | | | | |
Property, plant and equipment | 2,869 | | 834 | | | — | | 3,703 | |
| Goodwill and related assets | 43,390 | | (240) | | | — | | 43,150 | |
| Investments in Foreign subsidiaries | 34,983 | (30,496) | | | — | 4,487 |
| Other | 2,632 | | 9,374 | | | 1,072 | * | 13,078 | |
| Other intangible assets | 901,733 | | (98,133) | | | — | | 803,600 | |
Total deferred taxation liabilities | 985,607 | | (118,661) | | | 1,072 | | 868,018 | |
| Net deferred taxation liability | (724,284) | | 134,609 | | | 3,075 | | (586,600) | |
* These adjustments relate to foreign currency translation on the deferred tax liabilities.
Notes to Consolidated Financial Statements (continued)
for the year ended 31 December 2025
7. Income tax expense (continued)
The movement in temporary differences during the year ended 31 December 2024 was as follows:
| | | | | | | | | | | | | | | | | | | | | | | |
| 1 January
2024
(As
Reported) | Prior Year Restatements
(Note 1) | 1 January
2024
(As Restated) | Recognised in Income | Acquired | Recognised in Equity | 31 December
2024
(As Restated) |
| | | $’000 | $’000 | $’000 | $’000 | $’000 |
| Deferred taxation assets | | | | | | |
| Net operating loss carry forwards | 81,362 | | 1,636 | | 82,998 | | 42,962 | | — | | — | | 125,960 | |
| Accrued and other liabilities | 84,748 | | — | | 84,748 | | (6,331) | | — | | — | | 78,417 | |
| Property, plant and equipment | 9,082 | | — | | 9,082 | | (1,213) | | — | | — | | 7,869 | |
| Share-based payment | 49,530 | | — | | 49,530 | | (11,204) | | — | | (13,971) | | 24,355 | |
| Deferred revenue | 23,748 | | — | | 23,748 | | (13,384) | | — | | — | | 10,364 | |
| Other | 15,433 | | (2,443) | | 12,990 | | 1,368 | | — | | — | | 14,358 | |
| Total deferred taxation assets | 263,903 | | (807) | | 263,096 | | 12,198 | | — | | (13,971) | | 261,323 | |
| | | | | | | |
| Deferred taxation liabilities | | | | | | |
| Property, plant and equipment | 7,547 | | — | | 7,547 | | (4,678) | | — | | — | | 2,869 | |
| Goodwill and related assets | 39,014 | | — | | 39,014 | | 4,376 | | — | | — | | 43,390 | |
| Investments in Foreign subsidiaries | 52,408 | | — | | 52,408 | | (17,425) | | — | | — | | 34,983 | |
| Other | 7,985 | | (792) | | 7,193 | | (6,400) | | — | | 1,839 | * | 2,632 | |
| Other intangible assets | 950,055 | | — | | 950,055 | | (59,314) | | 10,992 | | — | | 901,733 | |
| Total deferred taxation liabilities | 1,057,009 | | (792) | | 1,056,217 | | (83,441) | | 10,992 | | 1,839 | | 985,607 | |
| Net deferred taxation liability | (793,106) | | (15) | | (793,121) | | 95,639 | | (10,992) | | (15,810) | | (724,284) | |
* These adjustments relate to foreign currency translation on the deferred tax liabilities.
Unrecognised deferred tax assets
Deferred tax assets relating to the following net operating losses have not been recognised to the extent that it is considered unlikely that a benefit will be received in the future.
At 31 December 2025, non-US subsidiaries had operating loss carry-forwards for income tax purposes that may be carried forward indefinitely, available to offset against future taxable income, if any, of approximately $45.3 million (31 December 2024: $42.4 million). At 31 December 2025, those subsidiaries also had additional operating loss carryforwards of $1.8 million which are due to expire between 2026 and 2045. In addition, at 31 December 2025 those subsidiaries had tax credit carryforwards for income tax purposes that may be carried forward for up to 18 years, available to offset against future tax liabilities, if any, of $4.9 million.
In total, the Company has unrecognised deferred tax assets of $44.5 million at 31 December 2025 and $39.0 million at 31 December 2024. The Company has not recognised these remaining deferred tax assets because it believes that it is probable that the losses and other deferred tax assets will not be utilised given their history of operating losses.
Unrecognised deferred tax liabilities
The Group has recognised a deferred tax liability of $4.5 million (31 December 2024: $35.0 million) for investments in foreign subsidiaries where the Company does not consider the earnings to be indefinitely reinvested. For the deferred tax liability not recognised in respect of temporary differences related to investments in foreign subsidiaries which are considered to be indefinitely reinvested, it is not practicable to calculate the exact unrecognised deferred tax liability, however, it is not expected to be material as Ireland has implemented a participation exemption in respect of distributions from foreign subsidiaries in EEA/treaty countries, in addition to the foreign tax credit regime at the statutory tax rate in the jurisdiction of the subsidiary, so that no material tax liability would be expected to arise in Ireland in the event these earnings
Notes to Consolidated Financial Statements (continued)
for the year ended 31 December 2025
7. Income tax expense (continued)
were ever remitted. In addition, withholding taxes applicable to remittances from foreign subsidiaries would not be expected to be material given Ireland’s tax treaty network and the EU parent subsidiary directive.
The Group is subject to the global minimum tax under Pillar Two legislation. The tax is payable in Ireland, France and other Group jurisdictions, relating to lower tax rates and certain incentives received in these countries. The Group recognised a current tax expense of $12.5 million related to global minimum tax (2024: $16.7 million).
The Group has applied a temporary mandatory relief from deferred tax accounting for the impacts of the global minimum tax and accounts for it as a current tax when it is incurred.
8. Earnings per share
In the year ended 31 December 2025, the Group restated the prior year financial information. Details of the restatements are contained in Note 1 to the Consolidated Financial Statements.
The following table sets forth the computation for basic and diluted net earnings per share for the years ended 31 December 2025 and 31 December 2024:
| | | | | | | | | | | | | | | | | | | | |
| 31 December 2025 | 31 December 2024
(As Restated) |
| Pre-exceptional | Exceptional
(Note 9) | Total | Pre-exceptional | Exceptional
(Note 9) | Total |
| Numerator ($'000) | | | | | | |
| Profit attributable to equity holders | 757,499 | | (543,461) | | 214,038 | | 827,498 | | (100,421) | | 727,077 | |
| | | | | | |
| Denominator (Number of shares) | | | | | | |
| Basic weighted average ordinary shares outstanding | 78,423,675 | | 78,423,675 | | 78,423,675 | | 82,482,764 | | 82,482,764 | | 82,482,764 | |
| Effect of dilutive potential ordinary shares | 663,345 | | 663,345 | | 663,345 | | 574,357 | | 574,357 | | 574,357 | |
| Diluted weighted average ordinary shares outstanding | 79,087,020 | | 79,087,020 | | 79,087,020 | | 83,057,121 | | 83,057,121 | | 83,057,121 | |
| | | | | | |
| Earnings per Share ($ per share) | | | | | | |
| Basic earnings per ordinary share | 9.66 | | (6.93) | | 2.73 | | 10.03 | | (1.22) | | 8.81 | |
| Diluted earnings per ordinary share | 9.58 | | (6.87) | | 2.71 | | 9.96 | | (1.21) | | 8.75 | |
The Company had 390,158 anti-dilutive potential shares at 31 December 2025 (31 December 2024: 58,996) comprised of 344,697 options (31 December 2024: 58,996) and 45,461 RSUs (31 December 2024: nil).
Notes to Consolidated Financial Statements (continued)
for the year ended 31 December 2025
9. Exceptional items
Exceptional items are comprised of transaction and integration related, restructuring charges, goodwill impairment, impairment of non-financial assets, provision for onerous contracts, and the corresponding income tax credit in relation to the exceptional items.
| | | | | | | | |
| 31 December 2025 | 31 December 2024 |
| | $'000 | $'000 |
| Transaction and integration related | 25,269 | | 29,574 | |
| Restructuring charges | 79,069 | | 92,123 | |
| Goodwill impairment | 367,587 | | — | |
| Provision for onerous contracts | 12,000 | | — | |
| Impairment of non-financial assets | 101,027 | | — | |
| Other operating expenses | 584,952 | | 121,697 | |
| Income tax credit | (41,491) | | (21,276) | |
| Exceptional items (net) | 543,461 | | 100,421 | |
The Group had the following provision balance as at 31 December 2025 and 31 December 2024:
| | | | | | | | |
| 31 December
2025 | 31 December
2024 |
| $’000 | $’000 |
| Non-current provisions | | |
| Restructuring provision | 2,142 | | 2,354 | |
| | | | | | | | |
| | |
| | |
| Current provisions | | |
| Restructuring provision | 10,383 | | 29,120 | |
| Onerous provision | 12,000 | | — | |
| Total | 22,383 | | 29,120 | |
Transaction and integration related
In the years ended 31 December 2025 and 31 December 2024, the Company incurred $25.3 million and $29.6 million, respectively, of transaction and integration related costs which are expensed as incurred within the “Other operating expenses” line item of the Consolidated Statement of Profit and Loss. The costs consist of advisory costs, professional fees, legal costs, ongoing business combination and integration activities.
Restructuring charges
A restructuring charge of $79.1 million was recognised during the year ended 31 December 2025 (2024: $92.1 million) under a restructuring plan adopted following a review of operations and are included within the “Other operating expenses” line item of the Consolidated Statement of Profit and Loss.
The restructuring programme is aimed at realigning the Group's workforce as well as reviewing its global footprint and optimising its locations to best fit the requirements of the Group. The restructuring plan reflects a workforce reduction of $74.6 million (31 December 2024: $74.5 million) and an office consolidation programme to optimise the Company's office footprint of $4.5 million (31 December 2024: $17.6 million) being the impairment of operating right-of-use assets of $3.7 million (31 December 2024: $13.8 million), the impairment of related property plant and equipment of $nil (31 December 2024: $1.9 million) and onerous contract costs of $0.8 million (31 December 2024: $1.9 million).
Notes to Consolidated Financial Statements (continued)
for the year ended 31 December 2025
9. Exceptional items (continued)
| | | | | | | | |
| 31 December 2025 | 31 December 2024 |
| $'000 | $'000 |
| Opening liability | 31,474 | | 6,999 | |
| Additional charges in the year* | 75,386 | | 76,392 | |
| Utilisation | (94,335) | | (51,917) | |
| Ending liability | 12,525 | | 31,474 | |
*The charge for the year ended 31 December 2025 reflects the workforce reduction of $74.6 million (31 December 2024: $74.5 million) and onerous contract costs of $0.8 million (31 December 2024: $1.9 million).
The closing provision of $12.5 million (31 December 2024: $31.5 million) reflects:
(1) $9.1 million (31 December 2024: $27.7 million) of personnel related liabilities as a result of the workforce reduction; all of which have been classified within Current Liabilities - Provisions, and
(2) $3.4 million (31 December 2024: $3.8 million) of facilities related liabilities of which $1.3 million (31 December 2024: $1.4 million) is classified within Current Liabilities - Provisions and $2.1 million (31 December 2024: $2.4 million) is classified within Non-Current Liabilities - Provisions.
Goodwill impairment, Provision for onerous contracts & Impairment of non-financial assets
During 2025, an impairment indicator was identified specific to the Group's Data Solutions reporting unit that indicated the carrying amount of the Data Solutions reporting unit may not be recoverable. This indicator related to the Group’s revised expectations on the future performance of the reporting unit considering specific external market participant factors.
As a result, the Group,
(1) recorded a goodwill impairment charge of $367.6 million, being the entire balance of goodwill attributed to the Data Solutions reporting unit (31 December 2024: $nil) (see Note 13 Goodwill and intangible assets in Notes to the Consolidated Financial Statements);
(2) recognised an onerous contract provision in the amount of $12.0 million (31 December 2024: $nil); and
(3) recognised an non financial asset impairment charge of $101.0 million (31 December 2024: $nil) (see Note 12 Property, Plant and Equipment & Note 13 Goodwill and intangible assets in Notes to the Consolidated Financial Statements).
These amounts are included within the “Other operating expenses” line item of the Consolidated Statement of Profit and Loss.
Income tax credit
The income tax credit in the year, in relation to the above exceptional items, amounted to a credit of $41.5 million (31 December 2024: $21.3 million).
Notes to Consolidated Financial Statements (continued)
for the year ended 31 December 2025
10. Payroll and related benefits
Payroll costs
The aggregate payroll costs of employees of the Group for the year ended 31 December 2025 and 31 December 2024 were as follows:
| | | | | | | | | | | |
| Note | 31 December 2025 | 31 December 2024 |
| | $’000 | $’000 |
| Wages and salaries | | 2,841,006 | | 2,985,991 | |
| Social welfare costs | | 554,185 | | 547,550 | |
| Pension costs | | 129,897 | | 123,771 | |
| Termination benefits | 9 | 74,544 | | 74,517 | |
| Share-based payment | 11 | 110,235 | | 46,108 | |
| Total charge to income | | 3,709,867 | | 3,777,937 | |
| Re-measurement of defined benefit liability | | (4,684) | | 6,338 | |
| Total payroll and related benefit costs | | 3,705,183 | | 3,784,275 | |
Average employee numbers
The average number of employees, including executive Directors, employed by the Group during the year ended 31 December 2025 and 31 December 2024 was as follows:
| | | | | | | | |
| 31 December 2025 | 31 December 2024 |
Marketing | 549 | | 559 | |
| Administration | 3,501 | | 3,681 | |
| Clinical research | 32,752 | | 33,582 | |
| Laboratory | 3,170 | | 3,038 | |
| Total | 39,972 | | 40,860 | |
Notes to Consolidated Financial Statements (continued)
for the year ended 31 December 2025
10. Payroll and related benefits (continued)
Directors’ remuneration
Remuneration policy
The Compensation and Organisation Committee oversees our compensation programmes and is responsible for approving compensation for our executive officers and non-executive directors. The Committee seeks to achieve the following goals with the Company’s executive compensation programmes: to attract, motivate and retain key executives and to reward executives for value creation. In discharging its responsibilities, the Committee reviews and considers market practices, pay‑for‑performance alignment, internal equity and the long‑term interests of the Company, its shareholders and other stakeholders.
The Company’s executive compensation programme has three main elements: base salary, a bonus plan and equity incentives in the form of share related awards granted under the Company’s equity incentive plans. All elements of key executives’ compensation are determined by the Compensation and Organisation Committee based on the achievement of the Group’s and individual performance objectives and the CEO makes recommendations to the Committee regarding the performance assessment and the compensation package of the other key executives. Base salary, bonus awards and Directors’ fees were determined by the Compensation and Organisation Committee in U.S. dollars, euro or British pound sterling.
Non-Executive Directors’ remuneration
Non-Executive Directors are remunerated by way of directors’ fees and are also eligible for participation in the share equity incentive schemes. During 2025, each Non-Executive Director (excluding the Board Chairman) was paid an annual retainer of $100,000 and additional fees for Board Committee service. Director fees are denominated in U.S. dollars. Directors who elect to receive their fees in euros are paid using a fixed U.S. dollar–euro exchange rate determined annually.
Mr. Murray’s Executive Chairman term expired on 12 May 2018 and he transitioned to the Non-Executive Director role of Chair. During the prior year and up until 1 April 2025, the arrangement with the Chair provided for payment of €330,000 annually. With effect from 1 April 2025, this payment changed and was re-denominated to $400,000 annually.
Mr. Rónán Murphy was appointed as Lead Independent Director with effect from 1 January 2019 and receives an additional annual fee of $40,000 for this role.
Non-Executive Directors are not eligible for performance related bonuses and no pension contributions are made on their behalf. The Compensation and Organisation Committee sets Non-Executive Directors' remuneration.
Executive Directors’ and Key Executive Officers’ remuneration
Total cash compensation comprised of a base salary and a bonus incentive. The Committee targets total cash compensation with regard to healthcare / biopharmaceutical companies of similar market capitalisation and peer CRO companies, adjusted upward or downward based on individual performance and experience and level of responsibility. The Compensation and Organisation Committee believes that the higher the executive’s level of responsibility within the Company, the greater the percentage of the executive’s compensation that should be tied to the Company’s performance. Target bonus incentives for executive officers range between 85% and 135% of salary, based on Group and individual performance.
No bonus was awarded to Mr. Barry Balfe, Chief Executive Officer, Mr. Nigel Clerkin, Chief Financial Officer, or Dr. Steve Cutler, former Chief Executive Officer for the year ended 31 December 2025. This was approved by the Compensation and Organisation Committee.
The Company’s executives are eligible to receive equity incentives, including stock options, Restricted Share Units and Performance Share Units, granted under the Company’s equity incentive plans. If executives receive equity incentive grants, they are normally approved annually at the first scheduled meeting of the Committee in the fiscal year. The grant date and value is determined by the Committee and the number of units granted is determined based on the closing price of the Company's shares on the day of grant. Newly hired executives may receive sign-on grants. In addition, the Committee may, at its discretion, issue additional equity incentive awards to executives if the Committee determines such awards are necessary to ensure appropriate incentives are in place. The equity awards granted to each participant are determined by the Committee at the start of each year based on peer group data, advice from independent compensation consultants, and Committee judgment.
During 2025, Performance Share Units (“PSUs”) which were awarded in 2022, subject to vesting, vested for Dr. Steve Cutler, former Chief Executive Officer, in the amount of 4,648 from a potential grant of 21,130. The percentage vested reflects service and the Company's achievements of diluted non-GAAP specified EPS targets over the three year period from 2022 - 2024.
Notes to Consolidated Financial Statements (continued)
for the year ended 31 December 2025
10. Payroll and related benefits (continued)
During 2025, Performance Share Units (“PSUs”) which were awarded in 2022, subject to vesting, vested for Mr. Barry Balfe, then Chief Operating Officer, in the amount of 735 from a potential grant of 1,671. The percentage vested reflects service and the Company's achievements of diluted non-GAAP specified EPS targets over the three year period from 2022 - 2024. Subsequent to the year end, Performance Share Units (“PSUs”) which were awarded in 2023, subject to vesting, for Mr. Barry Balfe, Chief Executive Officer, did not vest from a potential grant of 2,053. The awards did not vest as the diluted non-GAAP specified EPS targets over the three year period from 2023 - 2025 were not achieved.
All executive officers are eligible to participate in applicable pension plans. The Company’s contributions are generally a fixed percentage of their annual compensation, supplementing contributions by the executive. The Company has the discretion to make additional contributions if deemed appropriate by the Committee. The Company’s contributions are determined at the peer group median of comparable Irish companies and peer CRO companies. Contributions to this plan are recorded as an expense in the Consolidated Statements of Profit and Loss.
Recovery of Erroneously Awarded Compensation
Our Clawback Policy applies to incentive‑based compensation that is based on the attainment of financial reporting measures and that is received by current or former executive officers on or after 2 October 2023, the effective date of the Clawback Policy. On 27 April 2026, the Company’s Audit Committee concluded that a restatement was required. The aggregate dollar amount of erroneously awarded compensation attributed to the Restatement has not yet been determined. The Compensation and Organisation Committee is reviewing and evaluating whether any incentive‑based compensation received by current or former executive officers covered by the Clawback Policy during the relevant recovery periods was erroneously awarded as a result of the incorrect financial statements.
Directors’ interests
The Directors, Executive Officers and Company Secretary have the following interests, all of which are beneficial, in the shares and share options of the Company or other Group companies at 31 December 2025 and 31 December 2024 (or date of appointment if later):
| | | | | | | | | | | | | | | | | | | | |
| | | Interest at | Interest at |
| | | 31 December 2025 | 31 December 2024 |
| Name | Name of company and description of shares | | Number of shares | Options | Number of shares | Options |
| Ciaran Murray | ICON plc | | | | | |
| Ordinary Shares €0.06 | | 20,452 | | — | | 20,000 | | — | |
Barry Balfe (1) | ICON plc | | | | | |
| Ordinary Shares €0.06 | | 1,428 | | 31,144 | | — (1) | 15,816 (1) |
| Nigel Clerkin | ICON plc | | | | | |
| Ordinary Shares €0.06 | | 3,855 | | 9,241 | | — | | — | |
| Rónán Murphy | ICON plc | | | | | |
| Ordinary Shares €0.06 | | 2,956 | | 5,005 | | 2,596 | | 8,084 | |
| Dr. John Climax | ICON plc | | | | | |
| Ordinary Shares €0.06 | | 287,657 | | 5,005 | | 427,297 | | 12,698 | |
| Dr. Steve Cutler | ICON plc | | | | | |
| Ordinary Shares €0.06 | | 79,278 | | 293,813 | | 44,128 | | 239,822 | |
| Eugene McCague | ICON plc | | | | | |
| Ordinary Shares €0.06 | | 2,920 | | 3,255 | | 2,560 | | 3,255 | |
| Julie O'Neill | ICON plc | | | | | |
| Ordinary Shares €0.06 | | 2,698 | | — | | 2,367 | | — | |
| Dr. Linda Grais | ICON plc | | | | | |
| Ordinary Shares €0.06 | | 5,271 | | — | | 4,911 | | — | |
| Anne Whitaker | ICON plc | | | | | |
| Ordinary Shares €0.06 | | — | | — | | — | | — | |
| Diarmaid Cunningham | ICON plc | | | | | |
| Ordinary Shares €0.06 | | 4,055 | | 25,974 | | 3,000 | | 18,445 | |
(1) Mr. Barry Balfe was appointed Chief Operating Officer effective 1 January 2025 and then Chief Executive Officer effective 1 October 2025. The ordinary shares and share options disclosed above as at 31 December 2025 are unchanged from those outstanding on the date of Mr. Barry Balfe’s appointment to the Board of Directors on 3 September 2025.
Notes to Consolidated Financial Statements (continued)
for the year ended 31 December 2025
10. Payroll and related benefits (continued)
Further details regarding the above share options are as follows:
| | | | | | | | | | | | | | |
| Name | No. of Options (1) | Exercise price | Grant date | Expiry date |
| Barry Balfe | 886 | | $159.33 | | 3 March 2020 | 3 March 2028 |
| 2,131 | | $174.96 | | 3 March 2021 | 3 March 2029 |
| 3,405 | | $231.68 | | 3 March 2022 | 3 March 2030 |
| 4,480 | | $233.88 | | 3 March 2023 | 3 March 2031 |
| 4,914 | | $325.51 | | 3 March 2024 | 3 March 2032 |
| 15,328 | | $185.18 | | 6 March 2025 | 6 March 2033 |
| Nigel Clerkin | 9,241 | | $185.18 | | 6 March 2025 | 6 March 2033 |
| Rónán Murphy | 5,005 | | $125.74 | | 18 May 2018 | (2) |
| Dr. John Climax | 5,005 | | $125.74 | | 18 May 2018 | (2) |
| Dr. Steve Cutler | 29,613 | | $115.11 | | 3 March 2018 | 3 March 2026 |
| 32,272 | | $140.38 | | 3 March 2019 | 3 March 2027 |
| 42,386 | | $159.33 | | 3 March 2020 | 3 March 2028 |
| 37,461 | | $174.96 | | 3 March 2021 | 3 March 2029 |
| 35,869 | | $231.68 | | 3 March 2022 | 3 March 2030 |
| 29,116 | | $233.88 | | 3 March 2023 | 3 March 2031 |
| 30,321 | | $325.51 | | 3 March 2024 | 3 March 2032 |
| 56,775 | | $185.18 | | 6 March 2025 | 6 March 2033 |
| Eugene McCague | 3,255 | | $125.74 | | 18 May 2018 | (2) |
| Diarmaid Cunningham | 1,149 | | $159.33 | | 3 March 2020 | 3 March 2028 |
| 2,213 | | $174.96 | | 3 March 2021 | 3 March 2029 |
| 6,194 | | $231.68 | | 3 March 2022 | 3 March 2030 |
| 4,865 | | $233.88 | | 3 March 2023 | 3 March 2031 |
| 4,024 | | $325.51 | | 3 March 2024 | 3 March 2032 |
| 7,529 | | $185.18 | | 6 March 2025 | 6 March 2033 |
(1) The title of securities covered by all of the above options are non-qualified.
(2) These share options were scheduled to expire on May 18, 2026. Pursuant to an amendment to the Consultants Share Option Plan 2008, the exercise period for these options was extended to permit exercise for up to 30 open trading window days in accordance with the terms of the amended plan.
Notes to Consolidated Financial Statements (continued)
for the year ended 31 December 2025
10. Payroll and related benefits (continued)
The Directors, Executive Officer and Company Secretary held the following Restricted Share Units (“RSUs”) and Performance Share Units (“PSUs”) awards as at 31 December 2025:
| | | | | | | | | | | | | | | | | | | | |
| Name | RSUs | Award date | Vesting Date | PSUs(1) | Award Date | Vesting date |
| Ciaran Murray | 2,677 | | 22 May 2025 | (3) | | | |
| Barry Balfe | 587 | | 3 March 2023 | 3 March 2026 | 2,053 | | 3 March 2023 | (2) |
| 499 | | 3 March 2024 | 3 March 2026 | 1,747 | | 3 March 2024 | 3 March 2027 |
| 1,523 | | 6 March 2025 | 6 March 2026 | 5,332 | | 6 March 2025 | 6 March 2028 |
| 3,849 | | 22 May 2025 | 6 March 2026 | | | |
| 728 | | 7 August 2023 | 7 August 2026 | | | |
| 9,662 | | 31 October 2025 | 31 October 2026 | | | |
| 500 | | 3 March 2024 | 3 March 2027 | | | |
| 1,664 | | 3 March 2024 | 3 March 2027 | | | |
| 1,523 | | 6 March 2025 | 6 March 2027 | | | |
| 3,849 | | 22 May 2025 | 6 March 2027 | | | |
| 9,662 | | 31 October 2025 | 31 October 2027 | | | |
| 1,524 | | 6 March 2025 | 6 March 2028 | | | |
| 3,850 | | 22 May 2025 | 6 March 2028 | | | |
| 9,662 | | 31 October 2025 | 31 October 2028 | | | |
| Nigel Clerkin | 918 | | 6 March 2025 | (3) | 3,214 | | 6 March 2025 | 6 March 2028 |
| 3,375 | | 22 May 2025 | (3) | | | |
| 2,778 | | 31 October 2024 | 31 October 2026 | | | |
| 918 | | 6 March 2025 | 6 March 2027 | | | |
| 3,375 | | 22 May 2025 | 6 March 2027 | | | |
| 2,780 | | 31 October 2024 | 31 October 2027 | | | |
| 919 | | 6 March 2025 | 6 March 2028 | | | |
| 3,377 | | 22 May 2025 | 6 March 2028 | | | |
| Rónán Murphy | 1,732 | | 22 May 2025 | (3) | | | |
| Dr. John Climax | 1,732 | | 22 May 2025 | (3) | | | |
| Eugene McCague | 1,732 | | 22 May 2025 | (3) | | | |
| Julie O'Neill | 1,732 | | 22 May 2025 | (3) | | | |
| Dr. Linda Grais | 1,732 | | 22 May 2025 | (3) | | | |
| Anne Whitaker | 1,732 | | 22 May 2025 | (3) | | | |
| Diarmaid Cunningham | 510 | | 3 March 2023 | 3 March 2026 | 1,783 | | 3 March 2023 | (2) |
| 408 | | 3 March 2024 | 3 March 2026 | 1,431 | | 3 March 2024 | 3 March 2027 |
| 748 | | 6 March 2025 | (3) | 2,619 | | 6 March 2025 | 6 March 2028 |
| 3,025 | | 22 May 2025 | (3) | | | |
| 410 | | 3 March 2024 | 3 March 2027 | | | |
| 1,635 | | 3 March 2024 | 3 March 2027 | | | |
| 748 | | 6 March 2025 | 6 March 2027 | | | |
| 3,025 | | 22 May 2025 | 6 March 2027 | | | |
| 749 | | 6 March 2025 | 6 March 2028 | | | |
| 3,026 | | 22 May 2025 | 6 March 2028 | | | |
(1) Of the issued PSUs, performance conditions will determine how many vest. If performance targets are exceeded, additional PSUs will be issued and will vest in accordance with the terms of the relevant PSU award. The PSUs vest based on service and specified EPS targets over the periods 2023 – 2025, 2024 – 2026 and 2025 - 2027. Depending on the actual amount of diluted EPS from 2023 to 2027, as at 31 December 2025, up to a maximum of 18,179 additional PSUs could also be granted to Mr. Barry Balfe, Mr. Nigel Clerkin and Mr. Diarmaid Cunningham.
(2) These PSUs, which were awarded in 2023, were scheduled to vest 3 March 2026. However, subsequent to the year end, these PSUs did not vest, as the diluted non-GAAP specified EPS targets over the three year period from 2023 - 2025 were not achieved.
(3) These RSUs were granted on 6 March 2025 / 22 May 2025 and are scheduled to vest on the first trading day of the next open trading window, in accordance with the Share Trading Policy.
Notes to Consolidated Financial Statements (continued)
for the year ended 31 December 2025
10. Payroll and related benefits (continued)
Details of transactions entered into by the Directors, Executive Officers and Company Secretary in shares and share options of the Company during the year ended 31 December 2025 were as follows:
Share options exercised and sold
| | | | | | | | | | | |
| Name | Number of Share Options | Average
Exercise
price | Average
Sales
price |
| Rónán Murphy | 3,079 | | $90.03 | | $158.56 | |
| John Climax | 7,693 | | $90.03 | | $130.04 | |
Share options exercised and held
| | | | | | | | |
| Name | Number of Shares
Options | Average
Exercise
Price |
| Dr. Steve Cutler | 2,784 | | $83.47 | |
RSUs and PSUs vested
| | | | | | | | |
| Name | Number
of Shares | Average
Vest
Price |
| Ciaran Murray | 946 | | $126.99 | |
| Barry Balfe | 3,025 | | $178.33 | |
| Nigel Clerkin | 2,778 | | $171.82 | |
| Rónán Murphy | 694 | | $126.99 | |
| Dr. John Climax | 694 | | $126.99 | |
| Dr. Steve Cutler | 56,763 | | $190.49 | |
| Eugene McCague | 694 | | $126.99 | |
| Julie O'Neill | 694 | | $126.99 | |
| Dr. Linda Grais | 694 | | $126.99 | |
| Diarmaid Cunningham | 2,240 | | $184.81 | |
Shares purchased
| | | | | | | | |
| Name | Number
of Shares | Average
Purchase
Price |
| Nigel Clerkin | 2,550 | | $131.06 | |
Shares sold
| | | | | | | | |
| Name | Number
of Shares | Average
Sales
Price |
| Ciaran Murray | 494 | | $126.90 | |
| Barry Balfe | 1,597 | | $176.47 | |
| Nigel Clerkin | 1,473 | | $169.24 | |
| Rónán Murphy | 334 | | $126.90 | |
| Dr. John Climax | 140,334 | | $141.44 | |
| Dr. Steve Cutler | 24,397 | | $188.44 | |
| Eugene McCague | 334 | | $126.90 | |
| Julie O'Neill | 363 | | $126.90 | |
| Dr. Linda Grais | 334 | | $126.90 | |
| Diarmaid Cunningham | 1,185 | | $182.43 | |
The price of the Company’s ordinary shares during the year ended 31 December 2025 moved in the range of $125.10 to $228.29 (year ended 31 December 2024: in the range of $183.38 to $347.72). The closing share price at 31 December 2025 was $182.22 (31 December 2024: $209.71).
Notes to Consolidated Financial Statements (continued)
for the year ended 31 December 2025
10. Payroll and related benefits (continued)
Summary compensation table - Year ended 31 December 2025
| | | | | | | | | | | | | | | | | | | | | | | | | | | | | |
| Name | Year | Salary | Company pension contribution | Performance related compensation | All other compensation | Subtotal | Share-based payments (1) | Directors’ fees | Total
compensation |
| | $’000 | $’000 | $’000 | $’000 | $’000 | $’000 | $’000 | $’000 |
| Ciaran Murray | 2025 | — | | — | | — | | — | | — | | 324 | | 386 | | 710 | |
Barry Balfe (2) | 2025 | 851 | | 106 | | — | | 28 | | 985 | | 2,992 | | — | | 3,977 | |
| Nigel Clerkin | 2025 | 640 | | — | | — | | 101 | | 741 | | 2,236 | | — | | 2,977 | |
| Rónán Murphy | 2025 | — | | — | | — | | — | | — | | 220 | | 178 | | 398 | |
| Dr. John Climax | 2025 | — | | — | | — | | — | | — | | 220 | | 100 | | 320 | |
Dr. Steve Cutler (3) | 2025 | 1,030 | | 101 | | — | | 1,323 | | 2,454 | | 18,666 | | 58 | | 21,178 | |
| Eugene McCague | 2025 | — | | — | | — | | — | | — | | 220 | | 133 | | 353 | |
| Julie O'Neill | 2025 | — | | — | | — | | — | | — | | 220 | | 125 | | 345 | |
| Dr. Linda Grais | 2025 | — | | — | | — | | — | | — | | 220 | | 133 | | 353 | |
| Anne Whitaker | 2025 | — | | — | | — | | — | | — | | 135 | | 113 | | 248 | |
| Total | 2025 | 2,521 | | 207 | | — | | 1,452 | | 4,180 | | 25,453 | | 1,226 | | 30,859 | |
| | | | | | | | | |
(1) Share-based payments is the IFRS 2 expense related to share options, RSUs and PSUs. The aggregate amount of the gains earned by the Directors on the exercise of share options during the financial year is disclosed in Note 6 Profit before taxation under ‘Directors’ emoluments’ in Notes to the Consolidated Financial Statements.
(2) Mr. Barry Balfe succeeded Dr. Steve Cutler as Chief Executive Officer effective 1 October 2025 having served as Chief Operating Officer from 1 January 2025.
(3) Dr. Steve Cutler retired from his role as Chief Executive Officer effective 1 October 2025. On retirement, all unvested Share Options and Restricted Share Units were accelerated resulting in an accelerated share based compensation charge of $13.9 million. Unvested Performance Share Units were forfeited. These accelerated Share Options and previous vested Share Options will continue until their normal expiration date. As recorded within “All other compensation” above, Dr. Cutler will continue to receive, from his retirement date through to August 2026, his current monthly salary, in total $1.1 million as notice period entitlements. In addition, Dr. Cutler will continue to receive, from his retirement date for 2 years a monthly non-compete payment, in total $1.2 million of which $0.2 million is accrued and disclosed within “All other compensation” above. The Company will also pay the employer portion of Dr. Cutler’s health insurance premium until October 1, 2026. Dr. Cutler resigned from the Board effective 21 May 2026.
Notes to Consolidated Financial Statements (continued)
for the year ended 31 December 2025
10. Payroll and related benefits (continued)
Summary compensation table - Year ended 31 December 2024
| | | | | | | | | | | | | | | | | | | | | | | | | | | | | |
| Name | Year | Salary | Company pension contribution | Performance related compensation | All other compensation | Subtotal | Share-based payments (1) | Directors’ fees | Total
compensation |
| | $’000 | $’000 | $’000 | $’000 | $’000 | $’000 | $’000 | $’000 |
| Ciaran Murray | 2024 | — | | — | | — | | — | | — | | 300 | | 358 | | 658 | |
| Dr. Steve Cutler | 2024 | 1,234 | | 130 | | — | | 31 | | 1,395 | | 4,232 | | 44 | | 5,671 | |
Nigel Clerkin (2) | 2024 | 124 | | — | | — | | 18 | | 142 | | 192 | | — | | 334 | |
Brendan Brennan (3) | 2024 | 619 | | 77 | | — | | 27 | | 723 | | (1,150) | | — | | (427) | |
| Rónán Murphy | 2024 | — | | — | | — | | — | | — | | 213 | | 174 | | 387 | |
| Dr. John Climax | 2024 | — | | — | | — | | — | | — | | 213 | | 98 | | 311 | |
Joan Garahy (4) | 2024 | — | | — | | — | | — | | — | | 78 | | 72 | | 150 | |
| Eugene McCague | 2024 | — | | — | | — | | — | | — | | 213 | | 130 | | 343 | |
| Julie O'Neill | 2024 | — | | — | | — | | — | | — | | 213 | | 123 | | 336 | |
| Dr. Linda Grais | 2024 | — | | — | | — | | — | | — | | 213 | | 119 | | 332 | |
Anne Whitaker (5) | 2024 | — | | — | | — | | — | | — | | — | | 50 | | 50 | |
| Total | 2024 | 1,977 | | 207 | | — | | 76 | | 2,260 | | 4,717 | | 1,168 | | 8,145 | |
(1) Share-based payments is the IFRS 2 expense related to share options, RSUs and PSUs. The aggregate amount of the gains earned by the Directors on the exercise of share options during the financial year is disclosed in Note 6 Profit before taxation under ‘Directors’ emoluments’ in Notes to the Consolidated Financial Statements.
(2) Mr. Nigel Clerkin commenced employment with the Company in October 2024 and effective 31 October 2024 took over from Mr. Brendan Brennan as CFO.
(3) Mr. Brendan Brennan resigned on 31 October 2024. All unvested options, Restricted Share Units and Performance Share Units were forfeited on Mr. Brennan ceasing to be an ICON plc employee on 31 October 2024 resulting in a credit to share based compensation of $1.2 million. Included within this credit, is a charge of $0.1 million related to awards which vested during the period.
(4) Ms. Joan Garahy retired from the Board on 23 July 2024.
(5) Ms. Anne Whitaker was appointed to the Board on 23 July 2024.
11. Share-based payments
Share Options
On 21 July 2008 the Company adopted the Employee Share Option Plan 2008 (the “2008 Employee Plan”) pursuant to which the Compensation and Organisation Committee of the Company’s Board of Directors may grant options to any employee, or any Director holding a salaried office or employment with the Company or a Subsidiary for the purchase of ordinary shares. On the same date, the Company also adopted the Consultants Share Option Plan 2008 (the “2008 Consultants Plan”), pursuant to which the Compensation and Organisation Committee of the Company’s Board of Directors may grant options to any consultant, adviser or Non-Executive Director retained by the Company or any Subsidiary for the purchase of ordinary shares.
On 14 February 2017 both the 2008 Employee Plan and the 2008 Consultants Plan (together the “2008 Option Plans”) were amended and restated in order to increase the number of options that can be issued under the 2008 Consultants Plan from 0.4 million to 1.0 million and to extend the date for options to be granted under the 2008 Option Plans. An aggregate of 6.0 million ordinary shares have been reserved under the 2008 Employee Plan, as reduced by any shares issued or to be issued pursuant to options granted under the 2008 Consultants Plan, under which a limit of 1.0 million shares applies. Further, the maximum number of ordinary shares with respect to which options may be granted under the 2008 Employee
Notes to Consolidated Financial Statements (continued)
for the year ended 31 December 2025
11. Share-based payments (continued)
Option Plan, during any calendar year to any employee shall be 0.4 million ordinary shares. There is no individual limit under the 2008 Consultants Plan. On 14 May 2026, the 2008 Consultants Plan was amended to extend the expiration dates of options that would otherwise expire during periods when the sale of shares is prohibited, for a period equal to 30 open trading days following the reopening of the trading window in accordance with the Share Trading Policy. No options may be granted under the 2008 Option Plans after 14 February 2027.
Each grant of an option under the 2008 Option Plans will be evidenced by a Stock Option Agreement between the optionee and the Company. The exercise price will be specified in each Stock Option Agreement, however, option prices will not be less than 100% of the fair market value of an ordinary share on the date the option is granted.
Share option awards are granted with an exercise price equal to the market price of the Company's shares at date of grant. Share options typically vest over a period of four to five years from date of grant and expire eight years from date of grant. Share options granted to Non-Executive Directors during 2018 vested over 12 months and expire eight years from the date of grant.
Legacy PRA Equity Incentive Plans
The following represent the legacy PRA equity incentive plans, which still have equity outstanding but have been terminated as of 1 July 2021, as to grants of future awards.
Pursuant to the Merger Agreement, effective on 1 July 2021, each outstanding stock option and restricted stock unit under the PRA Plans was assumed by the Company and converted into a stock option or Restricted Share Unit exercisable for or payable in Ordinary Shares based on the ratio of the average trading price per Ordinary Share for the ten days prior to 1 July 2021, and the corresponding value of the merger consideration for each PRA Share. Accordingly, the plans as detailed below were assumed by the Company.
PRA Health Sciences, Inc. 2020 Stock Incentive Plan (the “2020 Plan”), 2018 Stock Incentive Plan (the “2018 Plan”) and 2014 Omnibus Incentive Plan (the “2014 Plan”) were amended and restated and assumed by the Registrant effective as of 1 July 2021.
The 2020 Stock Incentive Plan was approved by the PRA stockholders at their annual meeting on 18 May 2020. The 2020 Plan allowed for the issuance of stock options, stock appreciation rights, restricted shares and restricted stock units, other stock-based awards, and performance compensation awards as permitted by applicable laws. The 2020 Plan authorised the issuance of 2.5 million shares of common stock plus all shares that remained available under the prior plan on 18 May 2020.
The 2018 Stock Incentive Plan was approved by the PRA stockholders at their annual meeting on 31 May 2018. The 2018 Plan allowed for the issuance of stock options, stock appreciation rights, restricted shares and restricted stock units, other stock-based awards, and performance compensation awards as permitted by applicable laws. The 2018 Plan authorised the issuance of 2.0 million shares of common stock plus all shares that remained available under the 2014 Plan on 31 May 2018 (which included shares carried over from the 2013 Plan).
On 23 November 2014, the PRA Health Sciences, Inc. Board of Directors approved the formation of the 2014 Plan for key PRA Employees. The 2014 Plan allowed for the issuance of stock options, stock appreciation rights, restricted shares and stock units, other stock-based awards, and performance compensation awards as permitted by applicable laws.
Overall
Share option awards are granted with an exercise price equal to the market price of the Company’s ordinary shares at date of grant. Share options typically vest over a period of four to five years from date of grant and expire eight to ten years from date of grant. Share options granted to Non-Executive Directors during 2018 vest over 12 months and expire eight years from the date of grant. The maximum contractual term of options outstanding at 31 December 2025 is ten years.
Set out below is a summary of the total number of options outstanding and number of options available to grant under each plan as at 31 December 2025:
| | | | | | | | | | | | | | |
| Outstanding | Available to Grant |
| 31 December
2025 | 31 December
2024 | 31 December
2025 | 31 December
2024 |
| | | | |
| 2008 Option Plans | 639,184 | | 622,292 | | 2,653,835 | | 2,757,161 | |
| Total | 639,184 | | 622,292 | | 2,653,835 | | 2,757,161 | |
Notes to Consolidated Financial Statements (continued)
for the year ended 31 December 2025
11. Share-based payments (continued)
The total number of share options outstanding and exercisable at 31 December 2025 is as follows:
| | | | | | | | |
| Number of
Options | Weighted Average
Exercise Price |
| | |
| Outstanding at 31 December 2023 | 902,806 | | $142.96 | |
| | |
| Granted | 68,380 | | $325.51 | |
| Exercised | (311,040) | | $116.31 | |
| Forfeited / expired | (37,854) | | $238.51 | |
| | |
| Outstanding at 31 December 2024 | 622,292 | | $170.52 | |
| | |
| Granted | 118,902 | | $185.18 | |
| Exercised | (86,434) | | $112.32 | |
| Forfeited / expired | (15,576) | | $252.40 | |
| | |
| Outstanding at 31 December 2025 | 639,184 | | $179.12 | |
| | |
| Vested and exercisable at 31 December 2024 | 426,497 | | $135.39 | |
| Vested and exercisable at 31 December 2025 | 523,267 | | $170.26 | |
The weighted average share price of the Company’s shares on date of exercise of share options during the year ended 31 December 2025 was $178.80 (31 December 2024: $300.81).
At 31 December 2025, the range of exercise prices and weighted average remaining contractual life of outstanding and exercisable options was as follows:
| | | | | | | | | | | | | | | | | | |
| Options Outstanding | Options Exercisable | |
Range Exercise
Price | Number of
Shares | Weighted
Average
Remaining
Contractual Life | Weighted Average
Exercise
Price | Number of
Shares | Weighted Average
Exercise
Price | |
| $54.88 - 129.92 | 162,631 | | 1.74 | | 162,631 | | | |
| $131.01 - 159.33 | 129,064 | | 2.31 | | 129,064 | | | |
| $166.51 - 185.18 | 169,368 | | 5.91 | | 104,823 | | | |
| $215.91 - 325.51 | 178,121 | | 5.13 | | 126,749 | | | |
| $54.88 - 325.51 | 639,184 | | 3.90 | $179.12 | | 523,267 | | $170.26 | | |
Share option fair values 2025
The weighted average grant date fair value of share options granted by the Company during the year ended 31 December 2025 was $64.98 based on the following grants:
| | | | | | | | |
| Grant Date | Number of Shares | Weighted Average Exercise Price |
| 6 March 2025 | 118,902 | | $185.18 | |
| 118,902 | | $185.18 | |
Notes to Consolidated Financial Statements (continued)
for the year ended 31 December 2025
11. Share-based payments (continued)
Share option fair values 2024
The weighted average grant date fair value of share options granted by the Company during the year ended 31 December 2024 was $112.68 based on the following grants:
| | | | | | | | |
| Grant Date | Number of Shares | Weighted Average Exercise Price |
| 3 March 2024 | 68,380 | | $325.51 | |
| 68,380 | | $325.51 | |
Fair value of share options – Assumptions
The fair values of options granted during the year ended 31 December 2025 and 31 December 2024 were calculated using the Black-Scholes option pricing-model utilising the following assumptions:
| | | | | | | | |
| 31 December 2025 | 31 December 2024 |
| Annual Awards | Annual Awards |
| Weighted average grant date fair value | $64.98 | | $112.68 | |
Expected volatility (1) | 35.5 | % | 34.5 | % |
| Expected dividend yield | — | | — | |
Risk-free rate (2) | 4.00 | % | 4.19 | % |
Expected life (3) | 4.4 years | 4.3 years |
(1) Expected volatility has been determined based upon the historic volatility of the Company’s share price over a period which is commensurate with the expected term of the options granted.
(2) Risk-free rate is dependent on the grant date and term of the award.
(3) Expected life represents the weighted average period of time that options granted are expected to be outstanding given consideration to vesting schedules and the Company's historical experience of past vesting and termination patterns.
Restricted Share Units and Performance Share Units
On 23 April 2013 the Company adopted the 2013 Employees Restricted Share Unit Plan (the “2013 RSU Plan”) pursuant to which the Compensation and Organisation Committee of the Company’s Board of Directors may select any employee, or any Director holding a salaried office or employment with the Company, or a Subsidiary to receive an award under the plan. On 11 May 2015 the 2013 RSU Plan was amended and restated in order to increase the number of shares that can be issued under the RSU Plan by 2.5 million shares. Further, on 25 October 2024, the 2013 RSU Plan was amended and restated effective as of 6 November 2024 in order to increase the number of ordinary shares that can be issued under the 2013 RSU Plan by a further 2.5 million shares. Accordingly, an aggregate of 6.6 million ordinary shares have been reserved for issuance under the 2013 RSU Plan. The shares are awarded at par value and vest over a service period. Awards under the 2013 RSU Plan may be settled in cash or shares at the option of the Company. No awards may be granted under the 2013 RSU Plan after 6 November 2034.
On 30 April 2019 the Company approved the 2019 Consultants and Directors Restricted Share Unit Plan (the “2019 Consultants RSU Plan”), which was effective as of 16 May 2019, pursuant to which the Compensation and Organisation Committee of the Company’s Board of Directors may select any consultant, adviser or Non-Executive Director retained by the Company, or a Subsidiary to receive an award under the plan. 250,000 ordinary shares have been reserved for issuance under the 2019 Consultants RSU Plan. The awards are at par value and vest over a service period. Awards granted to Non-Executive Directors vest over twelve months. No awards may be granted under the 2019 Consultants RSU Plan after 16 May 2029.
Notes to Consolidated Financial Statements (continued)
for the year ended 31 December 2025
11. Share-based payments (continued)
The Company has awarded RSUs and PSUs to certain key individuals of the Group. The fair value of RSUs is based on the share price at the date of grant, with the expense spread over the vesting period. The following table summarises RSU and PSU activity for the year ended 31 December 2025:
| | | | | | | | | | | | | | |
| PSU Outstanding
Number of Shares | PSU
Weighted Average
Grant Date
Fair Value | RSU Outstanding
Number
of Shares | RSU
Weighted Average
Grant Date Fair Value |
| Outstanding at 31 December 2023 | 105,256 | | $ | 226.29 | | 621,011 | | $ | 218.27 | |
| Granted | 48,626 | | $ | 325.51 | | 258,345 | | $ | 313.41 | |
| Shares vested | (9,975) | | $ | 177.38 | | (120,458) | | $ | 223.29 | |
| Forfeited | (124,186) | | $ | 260.42 | | (111,309) | | $ | 241.13 | |
| Outstanding at 31 December 2024 | 19,721 | | $ | 280.76 | | 647,589 | | $ | 251.36 | |
| Granted | 41,359 | | $ | 185.18 | | 1,204,477 | | $ | 132.32 | |
| Shares vested | (9,228) | | $ | 229.93 | | (219,133) | | $ | 226.24 | |
| Shares vested and settled in cash | — | | — | | (2,966) | | $ | 216.10 | |
| Forfeited | (35,378) | | $ | 226.79 | | (153,798) | | $ | 208.15 | |
| Outstanding at 31 December 2025 | 16,474 | | $ | 185.18 | | 1,476,169 | | $ | 162.53 | |
The PSUs vest based on service and specified EPS targets over the period 2023 – 2025, 2024 – 2026 and 2025 – 2027. Depending on the actual amount of EPS from 2023 to 2027, up to an additional 41,602 PSUs may also be granted.
Share-based payment expense
Operating profit for the year ended 31 December 2025 is stated after charging $110.2 million in respect of share-based payment expense. Share-based payment expense has been allocated as follows:
| | | | | | | | |
| 31 December
2025 | 31 December 2024 |
| $’000 | $’000 |
| Direct costs | 57,524 | | 25,749 | |
| Other operating expenses | 52,711 | | 20,359 | |
| Total | 110,235 | | 46,108 | |
Notes to Consolidated Financial Statements (continued)
for the year ended 31 December 2025
12. Property, Plant and Equipment
| | | | | | | | | | | | | | | | | | | | | | | | | | |
| Land | Buildings | Leasehold
improvements | Computer
equipment | Office
furniture &
fixtures | Laboratory
equipment | Motor
vehicles | Total |
| $’000 | $’000 | $’000 | $’000 | $’000 | $’000 | $’000 | $’000 |
| Cost | | | | | | | | |
| At 1 January 2025 (as restated) | 3,724 | | 66,132 | | 62,034 | | 112,747 | | 51,849 | | 55,111 | | 65 | | 351,662 | |
| Additions | — | | 9,560 | 8,070 | | 28,051 | | 5,080 | | 19,026 | | — | | 69,787 | |
| Disposals / Reclassification | — | | — | | (1,734) | | (6,760) | | (209) | | (14,791) | | (19) | | (23,513) | |
| | | | | | | | |
| Foreign exchange movement | — | | 7,577 | | 3,905 | | 5,106 | | 3,897 | | 2,305 | | 30 | | 22,820 | |
| At 31 December 2025 | 3,724 | | 83,269 | | 72,275 | | 139,144 | | 60,617 | | 61,651 | | 76 | | 420,756 | |
| | | | | | | | |
| Depreciation | | | | | | | | |
| At 1 January 2025 (as restated) | — | | 29,954 | | 30,039 | | 58,566 | | 27,086 | | 36,828 | | 65 | | 182,538 | |
| Charge for year | — | | 1,576 | | 8,676 | | 26,612 | | 6,831 | | 9,187 | | — | | 52,882 | |
| Impairment charge | — | | — | | — | | 272 | | — | | — | | — | | 272 | |
| Disposals / Reclassification | — | | — | | (2,913) | | (6,432) | | (209) | | (14,791) | | (19) | | (24,364) | |
| Foreign exchange movement | — | | 3,565 | | 1,306 | | 2,982 | | 2,894 | | 2,139 | | 30 | | 12,916 | |
| At 31 December 2025 | — | | 35,095 | | 37,108 | | 82,000 | | 36,602 | | 33,363 | | 76 | | 224,244 | |
| | | | | | | | |
| Net book value | | | | | | | | |
| At 31 December 2025 | 3,724 | | 48,174 | | 35,167 | | 57,144 | | 24,015 | | 28,288 | | — | | 196,512 | |
| | | | | | | | |
| At 31 December 2024 (as restated) | 3,724 | | 36,178 | | 31,995 | | 54,181 | | 24,763 | | 18,283 | | — | | 169,124 | |
Depreciation expense of $52.9 million has been charged to “other operating expenses” in the Consolidated Statement of Profit and Loss.
Notes to Consolidated Financial Statements (continued)
for the year ended 31 December 2025
12. Property, Plant and Equipment (continued)
| | | | | | | | | | | | | | | | | | | | | | | | | | |
| Land | Buildings | Leasehold
improvements | Computer
equipment | Office
furniture &
fixtures | Laboratory
equipment | Motor
vehicles | Total |
| $’000 | $’000 | $’000 | $’000 | $’000 | $’000 | $’000 | $’000 |
| Cost | | | | | | | | |
| At 1 January 2024 (as reported) | 3,724 | | 70,072 | | 55,000 | | 77,108 | | 45,856 | | 56,217 | | 79 | | 308,056 | |
| Prior year Restatements (Note 1) | — | | — | | — | | 5,522 | | — | | — | | — | | 5,522 | |
| At 1 January 2024 (as restated) | 3,724 | | 70,072 | | 55,000 | | 82,630 | | 45,856 | | 56,217 | | 79 | | 313,578 | |
| Additions (as restated) | — | | — | | 7,422 | | 33,376 | | 8,919 | | 7,087 | | — | | 56,804 | |
| Disposals / Reclassification | — | | — | | (122) | | (451) | | — | | (4,123) | | — | | (4,696) | |
| | | | | | | | |
| Acquisition | — | | — | | 247 | | 195 | | — | | 39 | | — | | 481 | |
| Foreign exchange movement (as restated) | — | | (3,940) | | (513) | | (3,003) | | (2,926) | | (4,109) | | (14) | | (14,505) | |
| At 31 December 2024 (as restated) | 3,724 | | 66,132 | | 62,034 | | 112,747 | | 51,849 | | 55,111 | | 65 | | 351,662 | |
| | | | | | | | |
| Depreciation | | | | | | | | |
| At 1 January 2024 (as reported) | — | | 29,380 | | 19,746 | | 37,545 | | 22,567 | | 36,772 | | 76 | | 146,086 | |
| Prior year Restatements (Note 1) | — | | — | | — | | 642 | | — | | — | | — | | 642 | |
| At 1 January 2024 (as restated) | — | | 29,380 | | 19,746 | | 38,187 | | 22,567 | | 36,772 | | 76 | | 146,728 | |
| Charge for year (as restated) | — | | 1,719 | | 8,904 | | 22,198 | | 7,223 | | 7,733 | | 3 | | 47,780 | |
| Impairment charge | — | | — | | 1,863 | | — | | — | | — | | — | | 1,863 | |
| Disposals / Reclassification | — | | — | | (122) | | (451) | | — | | (4,673) | | — | | (5,246) | |
| Foreign exchange movement (as restated) | — | | (1,145) | | (352) | | (1,368) | | (2,704) | | (3,004) | | (14) | | (8,587) | |
| At 31 December 2024 (as restated) | — | | 29,954 | | 30,039 | | 58,566 | | 27,086 | | 36,828 | | 65 | | 182,538 | |
| | | | | | | | |
| Net book value | | | | | | | | |
| At 31 December 2024 (as restated) | 3,724 | | 36,178 | | 31,995 | | 54,181 | | 24,763 | | 18,283 | | — | | 169,124 | |
| | | | | | | | |
| At 1 January 2024 (as restated) | 3,724 | | 40,692 | | 35,254 | | 44,443 | | 23,289 | | 19,445 | | 3 | | 166,850 | |
Depreciation expense of $47.8 million has been charged to “other operating expenses” in the Consolidated Statement of Profit and Loss.
Notes to Consolidated Financial Statements (continued)
for the year ended 31 December 2025
13. Goodwill and intangible assets
| | | | | | | | | | | | | | | | | | | | | | | | | | | | | |
| Computer Software | Customer Relationships | Volunteer List | Order Backlog | Technology Asset | Trade Name and Non-Competes | Patient Database | Goodwill | Total |
| $’000 | $’000 | $’000 | $’000 | $’000 | $’000 | $’000 | $’000 | $’000 |
| Cost | | | | | | | | | |
| At 1 January 2025 (as restated) | 577,232 | | 4,134,897 | | 1,325 | | 544,539 | | 149,056 | | 204,876 | | 170,467 | | 9,104,218 | | 14,886,610 | |
| Additions | 104,427 | | — | | — | | — | | — | | — | | — | | — | | 104,427 | |
| Disposals / Reclassification | (3,296) | | — | | — | | — | | — | | — | | — | | — | | (3,296) | |
| Acquisition | — | | — | | — | | — | | — | | — | | — | | 5,109 | | 5,109 | |
| Foreign exchange movement | 71 | | 4,972 | | — | | 2,121 | | 1,096 | | 133 | | 189 | | 39,418 | | 48,000 | |
| At 31 December 2025 | 678,434 | | 4,139,869 | | 1,325 | | 546,660 | | 150,152 | | 205,009 | | 170,656 | | 9,148,745 | | 15,040,850 | |
| | | | | | | | | |
| Amortisation and impairment | | | | | | | | | |
| At 1 January 2025 (as restated) | 363,477 | | 722,023 | | 1,325 | | 538,373 | | 92,789 | | 204,876 | | 85,982 | | — | | 2,008,845 | |
| Amortised in the year | 102,895 | | 178,874 | | — | | 3,533 | | 26,440 | | — | | 18,372 | | — | | 330,114 | |
| Impairment charge | 14,016 | | 15,489 | | — | | — | | 5,250 | | — | | 66,000 | | 367,587 | | 468,342 | |
| Disposals | (1,950) | | — | | — | | — | | — | | — | | — | | — | | (1,950) | |
| Foreign exchange movement | 784 | | 3,860 | | — | | 2,018 | | 1,096 | | 133 | | 120 | | — | | 8,011 | |
| At 31 December 2025 | 479,222 | | 920,246 | | 1,325 | | 543,924 | | 125,575 | | 205,009 | | 170,474 | | 367,587 | | 2,813,362 | |
| | | | | | | | | |
| Net book value | | | | | | | | | |
| At 31 December 2025 | 199,212 | | 3,219,623 | | — | | 2,736 | | 24,577 | | — | | 182 | | 8,781,158 | | 12,227,488 | |
| | | | | | | | | |
| At 31 December 2024 (as restated) | 213,755 | | 3,412,874 | | — | | 6,166 | | 56,267 | | — | | 84,485 | | 9,104,218 | | 12,877,765 | |
Amortisation expense of $330.1 million has been charged to ‘other operating expenses’ in the Consolidated Statement of Profit and Loss for the year ended 31 December 2025.
Notes to Consolidated Financial Statements (continued)
for the year ended 31 December 2025
13. Goodwill and intangible assets (continued)
| | | | | | | | | | | | | | | | | | | | | | | | | | | | | |
| Computer Software | Customer Relationships | Volunteer List | Order Backlog | Technology Asset | Trade Name and Non-Competes | Patient Database | Goodwill | Total |
| $’000 | $’000 | $’000 | $’000 | $’000 | $’000 | $’000 | $’000 | $’000 |
| Cost | | | | | | | | | |
| At 1 January 2024 (as reported) | 473,010 | | 4,095,786 | | 1,325 | | 541,909 | | 139,655 | | 204,943 | | 170,509 | | 9,074,884 | | 14,702,021 | |
| Prior year Restatements (Note 1) | (5,522) | | — | | — | | — | | — | | — | | — | | — | | (5,522) | |
| At 1 January 2024 (as restated) | 467,488 | | 4,095,786 | | 1,325 | | 541,909 | | 139,655 | | 204,943 | | 170,509 | | 9,074,884 | | 14,696,499 | |
| Additions (as restated) | 111,256 | | — | | — | | — | | — | | — | | — | | — | | 111,256 | |
| Disposals / Reclassification | (1,147) | | — | | — | | — | | — | | — | | — | | — | | (1,147) | |
| Acquisition | 52 | | 41,394 | | — | | 3,663 | | 9,940 | | — | | — | | 46,126 | | 101,175 | |
| Foreign exchange movement (as restated) | (417) | | (2,283) | | — | | (1,033) | | (539) | | (67) | | (42) | | (16,792) | | (21,173) | |
| At 31 December 2024 (as restated) | 577,232 | | 4,134,897 | | 1,325 | | 544,539 | | 149,056 | | 204,876 | | 170,467 | | 9,104,218 | | 14,886,610 | |
| | | | | | | | | |
| Amortisation | | | | | | | | | |
| At 1 January 2024 (as reported) | 273,796 | | 545,974 | | 1,325 | | 452,898 | | 65,141 | | 171,276 | | 61,648 | | — | | 1,572,058 | |
| Prior year Restatements (Note 1) | (642) | | — | | — | | — | | — | | — | | — | | — | | (642) | |
| At 1 January 2024 (as restated) | 273,154 | | 545,974 | | 1,325 | | 452,898 | | 65,141 | | 171,276 | | 61,648 | | — | | 1,571,416 | |
| Amortised in the year (as restated) | 90,431 | | 177,767 | | — | | 86,307 | | 28,188 | | 33,666 | | 24,361 | | — | | 440,720 | |
| | | | | | | | | |
| Foreign exchange movement (as restated) | (108) | | (1,718) | | — | | (832) | | (540) | | (66) | | (27) | | — | | (3,291) | |
| At 31 December 2024 (as restated) | 363,477 | | 722,023 | | 1,325 | | 538,373 | | 92,789 | | 204,876 | | 85,982 | | — | | 2,008,845 | |
| | | | | | | | | |
| Net book value | | | | | | | | | |
| At 31 December 2024 (as restated) | 213,755 | | 3,412,874 | | — | | 6,166 | | 56,267 | | — | | 84,485 | | 9,104,218 | | 12,877,765 | |
| | | | | | | | | |
| At 1 January 2024 (as restated) | 194,334 | | 3,549,812 | | — | | 89,011 | | 74,514 | | 33,667 | | 108,861 | | 9,074,884 | | 13,125,083 | |
Amortisation expense of $440.7 million has been charged to ‘other operating expenses’ in the Consolidated Statement of Profit and Loss for the year ended 31 December 2024.
Notes to Consolidated Financial Statements (continued)
for the year ended 31 December 2025
13. Goodwill and intangible assets (continued)
On 19 August 2024, the Group acquired KCR. The acquisition resulted in the recognition of intangible assets of $45.1 million, comprising customer relationships of $41.4 million and order backlog of $3.7 million. These assets will be amortised over their expected useful lives of 13 years and 5 years respectively.
On 9 January 2024, the Group acquired HumanFirst. The acquisition resulted in the recognition of a developed technology intangible asset of $9.9 million which will be amortised over its expected useful life of 5 years.
Impairment review of goodwill
Goodwill is subject to impairment testing on an annual basis, or more frequently if there are indicators of impairment. These assets are allocated to groups of cash generating units (CGUs). The recoverable amount of each of the CGUs is determined based on the higher of fair value less cost of disposal and value-in-use calculations. Goodwill acquired through business combinations has been allocated to the Group’s three CGUs. The CGUs identified represent the lowest level within the Group at which goodwill is monitored and are not larger than the operating segment determined in accordance with IFRS 8 Operating Segments.
The Group has identified three CGUs in accordance with the provisions of IAS 36 Impairment of Assets. A summary of the allocation of the carrying value of goodwill by CGU, is as follows:
| | | | | | | | |
| 31 December
2025 | 31 December 2024 |
| $’000 | $’000 |
| Clinical Research | 7,408,510 | 7,363,983 | |
| Strategic Solutions | 1,372,648 | 1,372,648 | |
| Data Solutions | — | 367,587 | |
| Total Goodwill | 8,781,158 | 9,104,218 | |
Impairment testing methodology and results
Cash flow forecasts employed are for a ten year period approved by management and a terminal value which is applied to the year ten cash flows. The Group believes a ten year forecast is appropriate to use for the impairment test, due to the cyclical nature of the business in which the Group operates and the long-term lives of its contracts and assets. The terminal value reflects the discounted value of the cash flows beyond year ten which is based on the weighted average long-term growth rates for each CGU.
Management’s estimates of future cash flows are based upon current budgets and strategic plans and are reflective of anticipated growth rates within the CRO industry, expected growth in the Group’s market share and reflective of past experience. Key assumptions applied in determining expected future cash flows for these plans include management’s estimate of future profitability, replacement capital expenditure requirements, trade working capital investment needs and tax considerations. The Group’s cash flow projections are adjusted each year for actual and expected changes in performance.
The following assumptions were applied in determining the ten year projected cash flows for the Clinical Research and Strategic Solutions CGUs as at 31 December 2025 and 31 December 2024:
| | | | | | | | | | | | | | | | |
| 31 December 2025 | 31 December 2024 | | |
| Clinical Research | Strategic Solutions | Clinical Research | Strategic Solutions | | |
| Weighted average expected revenue growth rate | 3.3% | 3.4% | 7.1% | 8.0% | | |
| Weighted average expected growth rate for operating costs | 2.9% | 3.4% | 6.1% | 7.1% | | |
| Expected effective tax rate | 16.5% | 16.5% | 16.5% | 16.5% | | |
| Discount rate | 9.9% | 9.9% | 9.8% | 9.8% | | |
| Long term growth | 2.5% | 2.5% | 2.5% | 2.5% | | |
Notes to Consolidated Financial Statements (continued)
for the year ended 31 December 2025
13. Goodwill and intangible assets (continued)
For the Data Solutions CGU the Group utilised a probability-weighted discounted cash flow method and considered external market participant factors to reflect revised expectations of the future performance of this business. During the year ended 31 December 2025, an impairment indicator was identified specific to the Group's Data Solutions reporting unit that indicated the carrying amount of the Data Solutions reporting unit may not be recoverable. This indicator related to the Group’s revised expectations on the future performance of the reporting unit considering specific external market participant factors.
As a result of the impairment testing during the year ended 31 December 2025, the Company recorded a total goodwill impairment charge of $367.6 million (2024: $nil), which represented the entire balance of goodwill attributed to the Data Solutions CGU. No impairment charge was recognised in relation to Clinical Research and Strategic Solutions CGUs which identified headroom in the recoverable amount of the related CGUs as compared to their carrying value.
On 8 May 2026, ICON completed the disposition of Symphony Health Solutions Corporation (“Symphony”) pursuant to a merger agreement, by and among HealthVerity, Inc. (“HealthVerity”), Symphony, Pharmaceutical Research Associates, Inc. and HealthVerity Merger Sub, Inc. (“HV Merger Sub”), a wholly owned subsidiary of HealthVerity. Pursuant to the merger agreement, HV Merger Sub merged with and into Symphony, with Symphony surviving the merger as a wholly owned subsidiary of HealthVerity. The consideration payable by HealthVerity in connection with the merger consisted of shares of stock in HealthVerity, subject to customary adjustments as set forth in the merger agreement. In connection with the merger, ICON also purchased additional shares of stock in HealthVerity for an aggregate purchase price of $37.5 million. As a result, ICON holds a minority equity interest in HealthVerity. As of 8 May 2026, the Company’s investment in HealthVerity has been recorded at a carrying value of $nil.
Expected revenue growth and the expected growth in operating costs are determined based upon the expected growth rates used in preparing the Group’s budgets and strategic plans. In estimating budget revenue, consideration is given to current levels of backlog (i.e. the value of new business awards not yet recognised in revenue) and the estimated timeframe over which this is expected to be recognised within revenue, together with an estimate of revenue expected to be generated from new awards not currently within backlog. In estimating revenue from new awards, consideration is given to current RFP (request for proposals) volumes, expected growth rates in both the CRO industry and the Group’s market share, and of past experience. In estimating budgeted operating costs, consideration is given to required staffing levels, project related costs, facility and information technology costs and other costs. Staff costs and project related costs generally increase in line with revenue and are therefore estimated based on revenue growth expectations, while facility and IT costs and other costs are relatively fixed and are therefore projected based upon a lower growth rate. An expected long-term average tax rate of 16.5% (2024: 16.5%) has been applied in determining the projected after tax cash flows for Clinical Research and Strategic Solutions CGUs.
Expected annual working capital growth and expected capital expenditure growth are based upon the expected growth rates used in preparing the Group’s budgets and strategic plans. Long term growth rates were based on global macroeconomic data.
A discount rate of 9.9% (2024: 9.8%) has been applied to the projected cash flows of the Clinical Research and Strategic Solutions CGUs. This rate is reflective of both the time value of money and risks specific to the CGUs. The discount rate is based upon the Group’s weighted average cost of capital which has been determined by applying the Group’s long-term optimal capital structure to its costs of debt and cost of equity. The Group’s cost of debt has been calculated by applying an appropriate margin over the risk-free interest rate. The Group’s cost of equity has been calculated using the capital asset pricing model and includes an appropriate equity risk premium over the available risk-free interest rate. The Group’s weighted average cost of capital is adjusted to reflected additional risk premiums associated with each CGU.
Sensitivity Analysis
A sensitivity analysis to determine if reasonable changes in key assumptions could lead to an impairment was conducted at 31 December 2025 and 31 December 2024. The table below identifies the amounts by which each of the specified assumptions may either decline or increase to arrive at a zero excess of the present value of future cash flows over the carrying value of goodwill in the Clinical Research and Strategic Solutions CGUs:
| | | | | | | | | | | | | | | | |
| | |
| 31 December 2025 | 31 December 2024 | | |
| Clinical Research | Strategic Solutions | Clinical Research | Strategic Solutions | | |
Expected revenue growth rate decreased by* | 3.9 | % | 5.3 | % | 6.3 | % | 10.0 | % | | |
Discount rate increased by | 430 bps | 640 bps | 720 bps | 1,290 bps | | |
*With cost of sales assumed to reflect lower revenue and operating expenses unchanged.Management believes that the assumptions originally used in the fair value and value-in-use models are sufficiently prudent to ensure no reasonable change, in normal circumstances, in any of the above key assumptions would cause the carrying value of any CGU to exceed its recoverable amount.
Notes to Consolidated Financial Statements (continued)
for the year ended 31 December 2025
14. Business combinations
There were no business combinations in the year ended 31 December 2025.
KCR S.A. Group Acquisition
On 19 August 2024, the Company acquired the KCR S.A. Group (“KCR”), a CRO offering full service and functional services provision clinical trial services, in exchange for consideration of $92.5 million.
The net cash outflow in 2024 was $76.4 million comprising cash payments of $88.1 million, net of cash acquired of $11.7 million. The fair value of contingent consideration was initially measured at the date of acquisition at $4.3 million and subsequently remeasured at $1.1 million. Deferred consideration of $1.3 million was paid during the year ended 31 December 2025.
The purchase price allocation resulted in the recognition of goodwill of $43.4 million and intangible assets of $45.1 million. In finalising the goodwill on acquisition of KCR in the twelve month period from acquisition, fair value adjustments were made which resulted in an increase to Goodwill of $5.1 million during the year ended 31 December 2025. Goodwill arising in connection with the acquisition is primarily attributable to the assembled workforce of KCR and the expected synergies of the acquisition. The goodwill recognised is not deductible for income tax purposes.
HumanFirst, Inc.
On 9 January 2024, the Company acquired HumanFirst, Inc. (“HumanFirst”), a life sciences technology company in exchange for consideration of $13.3 million.
The net cash outflow in 2024 was $7.8 million comprising initial cash payments of $11.8 million, net of cash acquired of $4.0 million. Deferred consideration of $1.2 million was paid during the year ended 31 December 2025.
The final purchase price allocation resulted in the recognition of goodwill of $2.7 million and a developed technology intangible asset of $9.9 million. Goodwill arising in connection with the acquisition is primarily attributable to the assembled workforce of HumanFirst. The goodwill recognised is not deductible for income tax purposes.
PRA Health Sciences, Inc. Acquisition
On 1 July 2021 (the “Merger Date”), the Company completed the acquisition of PRA by means of a merger whereby Indigo Merger Sub, Inc., a Delaware corporation and subsidiary of ICON, merged with and into PRA Health Sciences, Inc., the parent of PRA Health Sciences (“the Acquisition” and “the Merger”).
In the years ended 31 December 2025 and 31 December 2024, the Company incurred approximately $6.0 million and $23.5 million of Merger-related finance costs which are included in the “finance costs” line item in the Consolidated Statement of Profit and Loss.
15. Inventories
| | | | | | | | |
| 31 December
2025 | 31 December
2024 |
| $’000 | $’000 |
| Laboratory inventories | 8,675 | | 8,414 | |
The cost of inventories is recognised as an expense and included in direct costs in the Consolidated Statement of Profit and Loss. For the year ended 31 December 2025, $97.1 million (2024: $85.4 million) was charged to the Consolidated Statement of Profit and Loss. There was no material difference between the Consolidated Statement of Financial Position value of inventories and their replacement costs.
Notes to Consolidated Financial Statements (continued)
for the year ended 31 December 2025
16. Accounts receivable, unbilled services (contract assets) and unearned revenue (contract liabilities)
In the year ended 31 December 2025, the Group restated the prior year financial information. Details of the restatements are contained in Note 1 to the Consolidated Financial Statements.
Accounts receivables and unbilled revenue are as follows:
| | | | | | | | |
| 31 December
2025 | 31 December
2024
(As Restated) |
| $’000 | $’000 |
| Billed services (accounts receivable) | 1,517,217 | | 1,428,428 |
| Allowance for credit losses | (42,319) | (35,664) |
| Accounts receivable net | 1,474,898 | 1,392,764 |
| Unbilled services (unbilled revenue) | 1,096,592 | 1,040,174 |
| Trade accounts receivable and unbilled revenue, net | 2,571,490 | | 2,432,938 | |
Accounts receivables are amounts due from customers for services performed in the ordinary course of business. They are generally due for settlement within 30-90 days and therefore are all classified as current. Accounts receivable are recognised initially at the amount of consideration that is unconditional. Accounts receivable balances do not contain significant financing components. The Group holds the accounts receivable with the objective to collect the contractual cash flows and therefore measures them subsequently at amortised cost.
All receivables are due within twelve months of the year ended 31 December 2025. Due to the short-term nature of the current receivables, their carrying amount is considered to be the same as their fair value.
Unbilled services and unearned revenue (contract assets and liabilities) were as follows:
| | | | | | | | | | | | | | |
| 31 December
2025 | 31 December
2024
(As Restated) | Change | % Change |
| $’000 | $’000 | $’000 | |
| Unbilled services (unbilled revenue) | 1,096,592 | | 1,040,174 | | 56,418 | | 5.4 | % |
| Unearned revenue (payments on account) | (1,550,471) | | (1,467,671) | | (82,800) | | 5.6 | % |
| | | | |
Timing may differ between the satisfaction of performance obligations and the invoicing and collection of amounts related to our contracts with customers. We record assets for amounts related to performance obligations that are satisfied but not yet billed and/or collected. These assets are recorded as unbilled revenue and therefore contract assets rather than accounts receivable when receipt of the consideration is conditional on something other than the passage of time. Liabilities are recorded for amounts that are collected in advance of the satisfaction of performance obligations or billed in advance of the revenue being earned.
Unbilled services/revenue balances arise where invoicing or billing is based on the timing of agreed milestones related to service contracts for clinical research. Contractual billing arrangements in respect of certain reimbursable expenses (principally investigators) require billing by the investigator to the Company prior to billing by the Company to the customer. As there is no contractual right of set-off between unbilled services (contract assets) and unearned revenue (contract liabilities), each are separately presented gross on the Consolidated Statement of Financial Position.
The Company is the contract principal in respect of both direct services and in the use of third parties (principally investigator services) that support a clinical trial. The progress towards completion for clinical service contracts is measured based on total project costs (including reimbursable costs). Amounts owed to investigators and others in respect of reimbursable expenses were $427.1 million at 31 December 2025 and $369.2 million at 31 December 2024 (see Note 20 Other liabilities in Notes to the Consolidated Financial Statements ).
Unbilled services as at 31 December 2025 increased by $56.4 million as compared to 31 December 2024. Unearned revenue increased by $82.8 million over the same period. These fluctuations are primarily due to the timing of payments and invoicing related to the Company's clinical trial management contracts. Billings and payments are established by contractual provisions on the delivery of units/milestones including predetermined payment schedules which may or may not correspond to the timing of the transfer of control of the Company's services under the contract. Unbilled services arise from long-term contracts when a cost-based input method of revenue recognition is applied and revenue recognised exceeds the amount billed to the customer.
Notes to Consolidated Financial Statements (continued)
for the year ended 31 December 2025
16. Accounts receivable, unbilled services (contract assets) and unearned revenue (contract liabilities) (continued)
As of 31 December 2025 approximately $14.9 billion (2024: $15.9 billion) of revenue is expected to be recognised in the future in respect of unsatisfied performance obligations. The Company expects to recognise revenue on approximately 48% (2024: 47%) of the unsatisfied performance obligation over the next 12 months, with the remainder recognised thereafter over the duration of the customer contracts. We believe that our unsatisfied performance obligation as of any date is not necessarily a meaningful predictor of future results due to the potential for cancellation or delay of the projects included in the unsatisfied performance obligation, and no assurances can be given on the extent to which we will be able to realize this unsatisfied performance obligation as revenue.
Impairment of financial assets
At 31 December 2025, the Group maintained an impairment provision of $42.3 million (2024: $35.7 million). The credit loss expense recognised on the Group's receivables and unbilled services was $25.1 million and $28.4 million for the twelve months ended 31 December 2025 and 2024, respectively.
The Group's estimate of expected credit losses considers historical credit loss information that is adjusted, where necessary, for current conditions and reasonable and supportable forecasts. Historical credit loss experience provides the basis for the estimation of expected credit losses. The Group's receivables and unbilled services are predominantly due from large and mid-tier pharmaceutical and biotechnology companies that share similar risk characteristics. The Group monitors their portfolio of receivables and unbilled services for any deterioration in current or expected credit quality (for example expected delinquency level), and adjusts the allowance for credit losses as required. Receivables for which an impairment provision was recognised were written off against the provision when there was no expectation of recovering additional cash.
The Group considered that there was evidence of impairment if any of the following indicators were present:
•significant financial difficulties of the debtor
•probability that the debtor will enter a financial restructuring process
•default or late payment
The closing expected credit loss for trade receivables and contract assets as at 31 December 2025 and 31 December 2024 reconciles to the opening expected credit loss as follows:
| | | | | | | | |
| 31 December
2025 | 31 December
2024 |
| $’000 | $’000 |
| Balance at start of year | 35,664 | | 31,533 | |
| Receivables written off during the year as uncollectible | (20,956) | | (24,887) | |
| Increase in expected credit loss recognised in profit or loss during the year | 25,104 | | 28,417 | |
Foreign currency translation | 2,507 | | 601 | |
| Balance at end of year | 42,319 | | 35,664 | |
Further analysis of the Group’s accounts receivable balances at 31 December 2025 and 31 December 2024 is as follows:
| | | | | | | | | | | | |
| 31 December
2025 | | | 31 December
2024
(As Restated) | | |
| $’000 | | | $’000 | | |
| Gross accounts receivable | | | | | | |
| Not past due | 1,191,226 | | | | 1,059,476 | | | |
| Past due 0 to 30 days | 135,481 | | | | 149,702 | | | |
| Past due 31 to 60 days | 54,340 | | | | 37,424 | | | |
| Past due 61+ days | 136,170 | | | | 181,826 | | | |
| Accounts receivable | 1,517,217 | | | | 1,428,428 | | | |
Notes to Consolidated Financial Statements (continued)
for the year ended 31 December 2025
16. Accounts receivable, unbilled services (contract assets) and unearned revenue (contract liabilities) (continued)
The carrying amounts of the Group’s accounts receivables are denominated in the following currencies:
| | | | | | | | |
| 31 December
2025 | 31 December
2024
(As Restated) |
| $’000 | $’000 |
Currency | | |
| US Dollar | 1,154,230 | | 1,083,285 | |
| Euro | 272,310 | | 242,070 | |
| Sterling | 34,038 | | 23,792 | |
| Other currencies | 56,639 | | 79,281 | |
| Total | 1,517,217 | | 1,428,428 | |
17. Other assets
| | | | | | | | |
| 31 December
2025 | 31 December
2024 |
| $’000 | $’000 |
| Other non-current assets | | |
| Lease deposits | 9,438 | | 16,780 | |
| Deferred employee savings scheme assets | 24,128 | | 24,836 | |
| Other receivables | 42,141 | | 31,180 | |
| Total | 75,707 | | 72,796 | |
Lease deposits paid in respect of certain premises leased by the Group are refundable on expiry of the related leases. Discounting of the non-current element has not been applied because the discount would be immaterial. However, discounting may apply in the future if the non-current element becomes significant such that the discounting impact would be material. Other non current assets do not contain any impaired assets.
| | | | | | | | |
| 31 December
2025 | 31 December
2024 |
| $’000 | $’000 |
| Other current assets | | |
| Personnel related prepayments | 2,586 | | 1,492 | |
| Facility and information system related prepayments | 43,102 | | 69,763 | |
| General overhead prepayments | 55,595 | | 43,186 | |
| Sales tax recoverable | 47,290 | | 36,489 | |
| Other receivables | 64,814 | | 60,578 | |
| Total | 213,387 | | 211,508 | |
Other current assets do not contain any impaired assets. The maximum exposure to credit risk at the reporting date is the carrying value of each receivable, other than prepayments which do not have credit risk. The Group does not hold any collateral as security.
Notes to Consolidated Financial Statements (continued)
for the year ended 31 December 2025
18. Financial asset investments
| | | | | | | | |
| 31 December
2025 | 31 December
2024 |
| $’000 | $’000 |
Financial asset investments | 82,050 | | 57,948 | |
The Company entered into subscription agreements with a number of funds. Interests in funds meet the definition of financial assets and are measured at fair value through profit or loss. Inputs are generally unobservable as the funds are not traded on an exchange and data is not published in respect of the funds. The fair value of interests in the funds are therefore Level 3 fair value measurements.
During the year ended 31 December 2025, net capital totalling $10.8 million had been advanced under the terms of the subscription agreements (2024: $13.1 million).
During the year ended 31 December 2025, there was a increase in fair value of $13.9 million (2024: decrease in fair value of $3.3 million) recognised in the Consolidated Statement of Profit and Loss bringing the carrying value of the subscriptions at 31 December 2025 to $79.5 million (2024: $54.4 million). The Company has committed to future investments of $137.1 million (2024: $102.2 million) in respect of these funds.
Financial asset investments also include equity investments of $2.5 million (2024: $3.5 million) of which $nil (2024: $1.5 million) was invested during the year. During the year ended 31 December 2025 an impairment charge of $1.0 million was recorded in respect of equity investments (2024: $nil).
19. Cash and cash equivalents
| | | | | | | | |
| 31 December
2025 | 31 December
2024 |
| $’000 | $’000 |
| Cash and cash equivalents | 647,295 | | 538,785 | |
Notes to Consolidated Financial Statements (continued)
for the year ended 31 December 2025
20. Other liabilities
In the year ended 31 December 2025, the Group restated the prior year financial information. Details of the restatements are contained in Note 1 to the Consolidated Financial Statements.
| | | | | | | | |
| 31 December
2025 | 31 December
2024
(As Restated) |
| $’000 | $’000 |
Non-current other liabilities | | |
| | |
| Deferred government grants | 606 | | 602 | |
| Deferred employee savings scheme liabilities | 14,338 | | 16,012 | |
| Other liabilities | 54,777 | | 63,750 | |
| Total | 69,721 | | 80,364 | |
Deferred employee savings scheme liabilities included above are payable greater than one year from the reporting date (see Note 24 Financial instruments in Notes to the Consolidated Financial Statements). Discounting of the non-current element has not been applied because the impact would be immaterial. However, discounting may apply in the future if the non-current element becomes significant such that the discounting impact would be material.
Amounts received under government grant agreements may become repayable in full or in part should certain circumstances specified within the grant agreements occur, including downsizing by the Group, disposing of the related assets, ceasing to carry on its business or the appointment of a receiver over any of its assets.
| | | | | | | | |
| 31 December
2025 | 31 December
2024
(As Restated) |
| $’000 | $’000 |
| Current accrued and other liabilities | | |
| General trade and overhead liabilities* | 588,733 | | 524,981 | |
| Personnel related liabilities | 240,222 | | 218,574 | |
| Lease liabilities (Note 25) | 36,282 | | 36,783 | |
| Facility related liabilities | 8,033 | | 8,547 | |
| Other liabilities | 21,098 | | 91,730 | |
| Short-term government grants | 75 | | 41 | |
| Total | 894,443 | | 880,656 | |
*includes amounts due to third parties in respect of accrued reimbursable investigator expenses of $427.1 million at 31 December 2025 and $369.2 million at 31 December 2024.
Notes to Consolidated Financial Statements (continued)
for the year ended 31 December 2025
21. Bank credit lines and loan facilities
The Group had the following debt outstanding as at 31 December 2025 and 31 December 2024:
| | | | | | | | | | | | | | | | | |
| | Interest rate as of | Principal amount |
| Maturity Date | 31 December 2025 | 31 December 2024 | 31 December 2025 | 31 December 2024 |
| | | | $'000 | $'000 |
| Senior Secured Term Loan | July 2028 | 5.672 | % | 6.329 | % | 916,688 | | 946,450 | |
| Senior Secured Notes (the “2026 Notes”) | July 2026 | 2.875 | % | 2.875 | % | 500,000 | | 500,000 | |
| | | | | |
| Senior Secured Notes (the “2027 Notes”)* | May 2027 | 5.809 | % | 5.809 | % | 750,000 | | 750,000 | |
| Senior Secured Notes (the “2029 Notes”)* | May 2029 | 5.849 | % | 5.849 | % | 750,000 | | 750,000 | |
| Senior Secured Notes (the “2034 Notes”)* | May 2034 | 6.000 | % | 6.000 | % | 500,000 | | 500,000 | |
| Total debt | | | | 3,416,688 | | 3,446,450 | |
| Less current portion of debt | | | | (529,762) | | (29,762) | |
| Total long-term debt | | | | 2,886,926 | | 3,416,688 | |
| Less debt issuance costs and debt discount | | | | (14,310) | | (20,290) | |
| Total long-term debt, net | | | | 2,872,616 | | 3,396,398 | |
*Issued 8 May 2024
As of 31 December 2025, the contractual maturities of the Company's debt obligations were as follows:
| | | | | | | | | | | |
| Current maturities of debt: | $'000 |
| 2026 | | | 529,762 | |
| 2027 | | | 779,762 | |
| 2028 | | | 857,164 | |
| 2029 | | | 750,000 | |
| 2030 and thereafter | | | 500,000 | |
| Total | | | 3,416,688 | |
| | | |
| | | |
| | | |
The Company's primary financing arrangements are its senior secured credit facilities (the “Senior Secured Credit Facilities”), which consists of a senior secured term loan and a revolving credit facility; the 2026 Notes and the New Notes.
The New Notes
On 8 May 2024, ICON Investments Six Designated Activity Company (the “Issuer”), a wholly-owned subsidiary of ICON plc, issued $2 billion senior secured notes (“the New Notes”). The New Notes were issued in aggregate principal amounts of: $750 million 5.809% Senior Secured Notes due 2027 (the “2027 Notes”), $750 million 5.849% Senior Secured Notes due 2029 (the “2029 Notes”) and $500 million 6.000% Senior Secured Notes due 2034 (the “2034 Notes”).
The Company paid an underwriting discount of $6.8 million on the New Notes being: 0.250% of the principal amount of the 2027 Notes, 0.350% of the principal amount of the 2029 Notes and 0.450% of the 2034 Notes. Further, the 2034 Notes were issued at a discount of $0.5 million (issued at 99.896% of par).
The proceeds from the issuance were used to repay a portion of the senior secured term loan outstanding under the Senior Secured Credit Facilities and to pay fees, costs and expenses related to the offering.
Interest on the New Notes is payable on the 8th of May and 8th of November of each year, having commenced on 8 November 2024. Unless previously redeemed, the 2027 Notes will mature on 8 May 2027, the 2029 Notes will mature on 8 May 2029 and the 2034 Notes will mature on 8 May 2034.
Notes to Consolidated Financial Statements (continued)
for the year ended 31 December 2025
21. Bank credit lines and loan facilities (continued)
The New Notes are guaranteed on a senior secured basis by ICON and its existing and future wholly owned subsidiaries, in each case that guarantee the obligations under our Senior Secured Credit Facilities and the 2026 Notes. The New Notes are the senior secured obligation of the Issuer and the Guarantors and rank equally in right of payment to all of the Issuer’s and Guarantors’ existing and future senior debt and senior in right of payment to all of the Issuer's and Guarantors' existing and future subordinated debt. The New Notes and the guarantees are secured on a first-lien basis by substantially all of the existing and future assets of the Issuer and the Guarantors that also secure the Issuer’s and the Guarantors’ obligations under the Senior Secured Credit Facilities and the 2026 Notes on a pari passu basis, subject to permitted liens, and the liens on the collateral securing the New Notes rank equally in priority with the liens on the collateral securing borrowings and guarantees under the Senior Secured Credit Facilities, the 2026 Notes and any other future pari passu first lien indebtedness.
Senior Secured Credit Facilities
On 1 July 2021, the Company completed the acquisition of PRA Health Sciences, Inc. (“PRA”) by means of a merger whereby Indigo Merger Sub, Inc., a Delaware corporation and subsidiary of ICON, merged with and into PRA, the parent of PRA Health Sciences (the “Merger”). In conjunction with the completion of the Merger, on 1 July 2021, ICON entered into a credit agreement (the “Credit Agreement”) providing for a senior secured term loan facility of $5,515 million and a senior secured revolving loan facility in an initial aggregate principal amount of $300 million (the “Senior Secured Credit Facilities”). On 2 May 2023, the Company agreed with its lenders to increase the aggregate principal amount of the senior secured revolving loan facility from $300 million to $500 million. The Senior Secured Credit Facilities and the 2026 Notes were issued at a discount of $27.6 million.
Borrowings under the senior secured term loan facility amortise in equal quarterly installments in an amount equal to 1.00% per annum of the principal amount, with the remaining balance due at final maturity. The interest rate margin applicable to borrowings under the senior secured term loan facility is USD Term SOFR plus an applicable margin which is dependent on the Company's net leverage ratio. At 31 December 2025, the applicable margin is 2.0% (which reflects the Third Amendment). The senior secured term loan facility is subject to a floor of 0.50%.
On 26 November 2025, the parties to the Credit Agreement entered into a Fourth Amendment (the “Fourth Amendment”) to reprice and extend the senior secured revolving credit facility.
As a result of the Fourth Amendment, the maturity was extended from a five-year term to a seven-year term ending 1 July 2028. Reflecting the Fourth Amendment, the interest rate margin applicable to borrowings under the revolving loan facility will be, at the option of the borrower, either (i) the applicable base rate plus an applicable margin of 0.35% or 0.00%, based on the Company’s current corporate family rating assigned by S&P of BB (or lower) or BB+ (or higher), respectively, or (ii) Term SOFR plus an applicable margin of 1.35%, 1.00%, 0.75%, 0.55%, or 0.40% based on the Company’s current corporate family rating assigned by S&P of BB (or lower), BB+, BBB-, BBB or BBB+ (or higher), respectively. In addition, lenders under the revolving loan facility are entitled to commitment fees as a percentage of the applicable margin at the time of drawing and utilisation fees dependent on the proportion of the facility drawn.
The Borrowers’ (as defined in the Senior Secured Credit Facility) obligations under the Senior Secured Credit Facilities are guaranteed by ICON and the subsidiary guarantors. The Senior Secured Credit Facilities are secured by a lien on substantially all of ICON’s, the Borrowers’ and each of the subsidiary guarantor’s assets (subject to certain exceptions), and the Senior Secured Credit Facilities will have a first-priority lien on such assets, which will rank pari passu with the lien securing the 2026 Notes and the New Notes subject to other permitted liens. The Company is permitted to make prepayments on the senior secured term loan without penalty.
The Senior Secured Credit Facilities contain customary negative covenants, including, but not limited to, restrictions on the ability of ICON and its subsidiaries to merge and consolidate with other companies, incur indebtedness, grant liens or security interests on assets, pay dividends or make other restricted payments, sell or otherwise transfer assets or enter into transactions with affiliates.
The Senior Secured Credit Facilities provide that, upon the occurrence of certain events of default, the obligations thereunder may be accelerated. Such events of default will include payment defaults to the lenders thereunder, material inaccuracies of representations and warranties, covenant defaults, cross-defaults to other material indebtedness, voluntary and involuntary bankruptcy proceedings, material money judgments, material pension-plan events, change of control and other customary events of default.
Notes to Consolidated Financial Statements (continued)
for the year ended 31 December 2025
21. Bank credit lines and loan facilities (continued)
Principal repayments, comprising mandatory and voluntary repayments, during the year ended 31 December 2025 and 31 December 2024 were as follows:
| | | | | | | | |
| Principal repayments | 31 December 2025 | 31 December 2024 |
| $'000 | $'000 |
| Quarter 1 | (7,440) | | (275,000) | |
| Quarter 2 | (7,441) | | (2,014,882) | |
| Quarter 3 | (7,440) | | (7,441) | |
| Quarter 4 | (7,441) | | (7,440) | |
| Total | (29,762) | | (2,304,763) | |
There have been no voluntary repayments made during the year ended 31 December 2025. For the year ended 31 December 2024, voluntary repayments resulted in an accelerated charge associated with previously capitalised fees of $16.9 million
During the year ended 31 December 2025, the Company drew down $50.0 million (31 December 2024: $318.0 million) of the senior secured revolving loan facility and repaid $50.0 million (31 December 2024: $373.0 million) as shown below. As at 31 December 2025, $nil (31 December 2024: $nil) was drawn under the senior secured revolving loan facility.
| | | | | | | | | | | |
| Drawdown | Repayment | Closing Balance |
| $'000 | $'000 | $'000 |
| Balance at January 1, 2024 | | | 55,000 | |
| Quarter 1, 2024 | 50,000 | | (55,000) | | 50,000 | |
| Quarter 2, 2024 | 143,000 | | (193,000) | | — | |
| Quarter 3, 2024 | 50,000 | | (50,000) | | — | |
| Quarter 4, 2024 | 75,000 | | (75,000) | | — | |
| Total drawdown / (repayments) in 2024 | 318,000 | | (373,000) | | |
| Quarter 1, 2025 | 50,000 | | (50,000) | | — | |
| Quarter 2, 2025 | — | | — | | — | |
| Quarter 3, 2025 | — | | — | | — | |
| Quarter 4, 2025 | — | | — | | — | |
| Total drawdown / (repayments) in 2025 | 50,000 | | (50,000) | | |
2026 Notes
In addition to the Senior Secured Credit Facilities, on 1 July 2021, a subsidiary of the Company issued $500 million in aggregate principal amount of 2.875% senior secured notes (the “2026 Notes”) in a private offering (the “Offering”). The 2026 Notes will mature on 15 July 2026.
Fair Value of Debt
The estimated fair value of the Company’s debt as at 31 December 2025 was $3,500.1 million (31 December 2024: $3,469.2 million). The fair values of the senior secured term loan facility, the 2026 Notes and the New Notes were determined based on Level 2 inputs, which are based on rates at which the debt is traded among financial institutions.
Derivatives
The Company previously entered into interest rate cap and swap agreements for purposes of managing its exposure to interest rate fluctuations. These financial derivative agreements were designated as Cash Flow Hedges.
During the year ended 31 December 2024, the Company’s exposure to interest rate fluctuations significantly reduced with the voluntary and mandatory repayments of the senior secured term loan facility. Given this reduction and the repricing of the Senior Secured Credit facilities, the Company closed the interest rate cap and swap agreements. Refer to Note 24 Financial instruments in Notes to the Consolidated Financial Statements for related information and disclosures.
Notes to Consolidated Financial Statements (continued)
for the year ended 31 December 2025
21. Bank credit lines and loan facilities (continued)
Net Debt
The movement in net debt by category is as follows:
| | | | | | | | | | | | | | | | | |
| 1 Jan
2025 | Net cash inflow/ (outflow) | Other non-cash adjustments | Effects of exchange rates | 31 Dec 2025 |
| $'000 | $'000 | $'000 | $'000 | $'000 |
| Net cash and cash equivalents | 538,785 | | 77,415 | | — | | 31,095 | | 647,295 | |
| | | | | |
| Total cash and cash equivalents | 538,785 | | 77,415 | | — | | 31,095 | | 647,295 | |
| | | | | | | | | | | | | | | | | | | | |
| 1 Jan
2025 | (Drawn
down)/
repaid | Net cash (inflow)/ outflow | Other non-cash adjustments | Effect of exchange rates | 31 Dec 2025 |
| $'000 | $'000 | $'000 | $'000 | $'000 | $'000 |
| Lease liabilities | (176,868) | | 41,989 | | 6,184 | | (21,383) | | (3,326) | | (153,404) | |
| Senior Secured Credit Facilities, 2026 Notes & New Notes | (3,426,160) | | 29,762 | | — | | (5,980) | | — | | (3,402,378) | |
| Total borrowings and lease liabilities | (3,603,028) | | 71,751 | | 6,184 | | (27,363) | | (3,326) | | (3,555,782) | |
22. Share capital
Group and Company
| | | | | |
| Authorised share capital: | No. of Ordinary Shares |
| Ordinary shares of par value €0.06 | 100,000,000 |
| | | | | | | | |
| 31 December
2025 | 31 December
2024 |
| $’000 | $’000 |
| | |
| Allotted, called up and fully paid | | |
| 76,567,325 (31 December 2024: 80,756,860) ordinary shares of €0.06 each | 6,305 | | 6,586 | |
| | |
| Issued, fully paid share capital | | |
| At beginning of year | 6,586 | | 6,699 | |
| Employee share options exercised | 6 | | 20 | |
| Restricted share units / performance share units | 15 | | 9 | |
| Repurchase of ordinary shares | (302) | | (142) | |
| At end of year | 6,305 | | 6,586 | |
Holders of ordinary shares are entitled to receive such dividends as may be recommended by the Board of Directors of the Company and approved by the shareholders and/or such interim dividends as the Board of Directors of the Company may decide. On liquidation or a winding up of the Company, the par value of the ordinary shares are repaid out of the assets available for distribution among the holders of the ordinary shares of the Company. Holders of ordinary shares have no conversion or redemption rights. On a show of hands, every holder of an ordinary share present in person or proxy at a general meeting of shareholders shall have one vote, for each ordinary share held with no individual having more than one vote.
Notes to Consolidated Financial Statements (continued)
for the year ended 31 December 2025
22. Share capital (continued)
(a) Employee share based payments
During the year ended 31 December 2025, 86,434 options were exercised by employees at an average exercise price of $112.32 per share for total proceeds of $9.7 million. During the year ended 31 December 2025, 219,133 ordinary shares were issued in respect of certain RSUs and 9,228 ordinary shares were issued in respect of PSUs previously awarded by the Company.
During the year ended 31 December 2024, 311,040 options were exercised at an average exercise price of $116.31 per share for total proceeds of $36.2 million. During the year ended 31 December 2024, 120,458 ordinary shares were issued in respect of certain RSUs and 9,975 ordinary shares were issued in respect of PSUs previously awarded by the Company.
(b) Share repurchase programme
On 18 February 2025, the Company's Board of Directors authorised an additional share repurchase programme under which the Company may repurchase up to $750.0 million of the outstanding ordinary shares of the Company by way of redemption. On 22 July 2025, the Company's Board of Directors authorised a further additional repurchase programme under which the Company could repurchase up to $500.0 million of the outstanding ordinary shares of the Company by way of redemption.
During the year ended 31 December 2025, 4,504,330 ordinary shares were redeemed by the Company at an average price of $166.51 per share for a total consideration of $750.0 million.
As of 31 December 2025, the Company had remaining authorization (which includes unutilized amounts from previous authorizations) to repurchase up to $750.0 million of ordinary shares under the repurchase programme.
All ordinary shares that were redeemed under the repurchase programmes were cancelled in accordance with the Constitution of the Company and the nominal value of these shares transferred to other undenominated capital as required under Irish Company law.
| | | | | | | | | | | | | | |
| Total number
of shares purchased | Average price paid per share | Total number
of shares purchased as part of publicly announced programme | Approximate dollar value of shares that may yet be purchased under the programme
(in millions) |
| March 12/03/2025 - 19/03/2025 | 1,360,537 | | $183.75 | | 1,360,537 | | $750.0 | |
| June 13/06/2025 - 23/06/2025 | 1,717,181 | | $145.59 | | 1,717,181 | | $500.0 | |
| August 15/08/2025 - 20/08/2025 | 560,100 | | $178.20 | | 560,100 | | $900.2 | |
| September 10/09/2025 - 19/09/2025 | 866,512 | | $173.33 | | 866,512 | | $750.0 | |
| 4,504,330 | | $166.51 | | 4,504,330 | | |
During the year ended 31 December 2024, 2,179,699 ordinary shares were redeemed by the Company at an average price of $229.39 per share for a total consideration of $500.0 million.
| | | | | | | | | | | | | | |
| Total number
of shares purchased | Average price paid per share | Total number
of shares purchased as part of publicly announced programme | Approximate dollar value of shares that may yet be purchased under the programme
(in millions) |
| September 18/09/2024 - 25/09/2024 | 337,070 | | $296.67 | | 337,070 | | $400.0 | |
| October 28/10/2024 - 31/10/2024 | 409,512 | | $228.57 | | 409,512 | | $556.4 | |
| November 01/11/2024 - 07/11/2024 | 479,524 | | $221.87 | | 479,524 | | $450.0 | |
| December 02/12/2024 - 19/12/2024 | 953,593 | | $209.73 | | 953,593 | | $250.0 | |
| 2,179,699 | | $229.39 | | 2,179,699 | | |
Notes to Consolidated Financial Statements (continued)
for the year ended 31 December 2025
22. Share capital (continued)
Under the repurchase programme, a broker purchased or may purchase the Company's shares from time to time on the open market or in privately negotiated transactions in accordance with agreed terms and limitations. The programme was and may be in the future designed to allow share repurchases during periods when the Company would ordinarily not be permitted to do so because it may be in possession of material non-public or price-sensitive information or due to applicable insider trading laws or self-imposed trading blackout periods. The Company's instructions to the broker in such cases were or may in the future be irrevocable and the trading decisions in respect of the repurchase programme were made or will be made independently of and uninfluenced by the Company. The Company confirms that on entering the share repurchase programmes it had no material non-public, price-sensitive or inside information regarding the Company or its securities. Furthermore, the Company will not enter into additional repurchase programmes whilst in possession of such information. The timing and actual number of shares repurchased by way of the redemption will be dependent on market conditions, legal and regulatory requirements and the other terms and limitations contained in the programme. In addition, repurchases under the programme may be suspended or discontinued in certain circumstances in accordance with the agreed terms. Therefore, there can be no assurance as to the timing or number of shares that may be repurchased under the programme.
23. Capital and reserves
In the year ended 31 December 2025, the Group restated the prior year financial information. Details of the restatements are contained in Note 1 to the Consolidated Financial Statements.
| | | | | | | | |
| 31 December
2025 | 31 December
2024
(As Restated) |
| $’000 | $’000 |
| Share premium | 569,507 | | 559,804 | |
| Other undenominated capital | 1,606 | | 1,304 | |
| Share-based payment reserve | 384,001 | | 331,838 | |
| Other reserve | 11,799 | | 16,454 | |
| Foreign currency reserve | (74,320) | | (233,771) | |
| Merger reserve | 5,656,195 | | 5,656,195 | |
| Retained earnings | 2,691,827 | | 3,162,570 | |
| Total | 9,240,615 | | 9,494,394 | |
Other undenominated capital
Other undenominated capital comprises the nominal value of shares repurchased and cancelled by the Company and transferred from share capital to other undenominated capital as required under Irish Company Law. During the year ended 31 December 2025, 4,504,330 ordinary shares were repurchased and cancelled by the Group (2024: 2,179,699).
Share-based payment reserve
The share-based payment reserve is used to account for share-based payments. The fair value of share-based payments is expensed to the Consolidated Statement of Profit and Loss over their respective period the related services are received, with a corresponding increase in equity. Details of options, RSU's and PSU's granted under their respective plans and the terms attaching thereto are provided in Note 11 Share-based payments in Notes to the Consolidated Financial Statements .
Notes to Consolidated Financial Statements (continued)
for the year ended 31 December 2025
23. Capital and reserves (continued)
Other reserve
The Group has recognised a non-distributable reserve of $5.7 million in accordance with agreements made between the Group and Enterprise Ireland, an Irish government agency. The requirement for these non-distributable reserves will expire between the period 2028 and 2030. In addition, in 2005 the Group also recognised a capital contribution of $6.1 million being the fair value of outstanding ordinary shares transferred to Mr Peter Gray, formerly Vice Chair of the Board of Directors and formerly Chief Executive Officer, by founding Directors, Dr. John Climax and Dr. Ronan Lambe.
The Group entered into two interest rate cap agreements and an interest rate swap agreement to limit its exposure to changes in the variable interest rate on its Senior Secured Credit Facilities. The interest rate caps and swap are accounted for as cash flow hedges and were considered effective hedges on application of the provisions of IFRS 9. The Group closed the interest rate cap and swap agreements during 2024. The remaining effective portion of the hedges were released to the Consolidated Statement of Profit and Loss during the year ended 31 December 2025 in the amount of $2.4 million.
Foreign currency reserve
The currency reserve comprises all foreign exchange differences arising from the translation of the financial statements of foreign currency denominated operations of the Group. As at 31 December 2025, this amounted to a cumulative loss of $74.3 million (2024: $233.8 million).
Merger reserve
On 1 July 2021, the Company completed the Acquisition of PRA by means of a merger whereby Indigo Merger Sub, Inc., a Delaware corporation and subsidiary of the Company, merged with and into PRA, the parent of the PRA Health Sciences Group. Upon completion of the Merger, pursuant to the terms of the Merger Agreement, PRA became a wholly owned subsidiary of the Company. The transaction resulted in the issuance of 27,372,427 shares to the former stockholders of PRA. The Company issued these shares at the prevailing market price and recognised the premium of $5,656.2 million on issuance of these shares as a merger reserve as required under Irish Company Law.
Retained earnings
In addition to the profit for the financial year the Group has also recognised the re-measurement of the defined benefit liabilities in this reserve. In 2025, the Group recognised a re-measurement gain on the defined benefit liabilities of $4.7 million (2024: a re-measurement loss of $6.3 million). The Group has recognised a credit of $58.8 million (2024: $53.6 million) in respect of exercised and expired share-based awards that have been transferred from the share-based payment reserve. Further during the year ended 31 December 2025, 4,504,330 (2024: 2,179,699) ordinary shares were redeemed by the Company under the buyback programme for a total consideration of $750.0 million (2024: $500.0 million) which was recorded within retained earnings.
Notes to Consolidated Financial Statements (continued)
for the year ended 31 December 2025
24. Financial instruments
In the year ended 31 December 2025, the Group restated the prior year financial information. Details of the restatements are contained in Note 1 to the Consolidated Financial Statements.
The table below categorises the carrying value of financial assets and liabilities into the categorisations as presented by IFRS 9 as of 31 December 2025:
| | | | | | | | | | | | | | |
| Amortised Cost | FVOCI | FVTPL | Total |
| $’000 | $’000 | $’000 | $’000 |
| Financial assets | | | | |
| Financial assets | — | | — | | 82,050 | | 82,050 | |
| Trade receivables | 1,474,898 | | — | | — | | 1,474,898 | |
| Unbilled revenue (contract assets) | 1,096,592 | | — | | — | | 1,096,592 | |
| Cash and cash equivalents | 647,295 | | — | | — | | 647,295 | |
| Other receivables | 46,163 | | — | | — | | 46,163 | |
| Total | 3,264,948 | | — | | 82,050 | | 3,346,998 | |
| | | | |
| Financial liabilities | | | | |
| Bank credit lines and loan facilities | 3,402,378 | | — | | — | | 3,402,378 | |
| Interest on bank credit lines and loan facilities | 24,062 | | — | | — | | 24,062 | |
| Lease liabilities | 153,404 | | — | | — | | 153,404 | |
| Accounts payable | 192,117 | | — | | — | | 192,117 | |
| Unearned revenue (contract liabilities) | 1,550,471 | | — | | — | | 1,550,471 | |
| Accrued and other liabilities* | 834,099 | | — | | — | | 834,099 | |
| Total | 6,156,531 | | — | | — | | 6,156,531 | |
The table below categorises the carrying value of financial assets and liabilities into the categorisations as presented by IFRS 9 as of 31 December 2024:
| | | | | | | | | | | | | | |
| Amortised Cost
(As Restated) | FVOCI | FVTPL | Total
(As Restated) |
| $’000 | $’000 | $’000 | $’000 |
| Financial assets | | | | |
| Financial assets | — | | — | | 57,948 | | 57,948 | |
| Trade receivables | 1,392,764 | | — | | — | | 1,392,764 | |
| Unbilled revenue (contract assets) | 1,040,174 | | — | | — | | 1,040,174 | |
| Cash and cash equivalents | 538,785 | | — | | — | | 538,785 | |
| Other receivables | 43,124 | | — | | — | | 43,124 | |
| Total | 3,014,847 | | — | | 57,948 | | 3,072,795 | |
| | | | |
| Financial liabilities | | | | |
| Bank credit lines and loan facilities | 3,426,160 | | — | | — | | 3,426,160 | |
| Interest on bank credit lines and loan facilities | 24,084 | | — | | — | | 24,084 | |
| Lease liabilities | 176,868 | | — | | — | | 176,868 | |
| Accounts payable | 173,025 | | — | | — | | 173,025 | |
| Unearned revenue (contract liabilities) | 1,467,671 | | — | | — | | 1,467,671 | |
| Accrued and other liabilities* | 819,789 | | — | | — | | 819,789 | |
| Total | 6,087,597 | | — | | — | | 6,087,597 | |
*Accrued and other liabilities excludes interest on bank credit lines and loan facilities and short term lease liabilities, all of which are presented separately above.
Notes to Consolidated Financial Statements (continued)
for the year ended 31 December 2025
24. Financial instruments (continued)
The Board of Directors have overall responsibility for the establishment and oversight of the Group’s risk management framework. The Group is exposed to various financial risks in the normal course of its business. The principal financial risks to which it is exposed include credit risks related to the creditworthiness of its customers and counterparties, with which it invests surplus cash funds, liquidity risk associated with the availability of sufficient financial resources to meet liabilities as they fall due, foreign currency risks, including both translation and transaction risk, and interest rate risk.
The Group’s risk management policies are established to identify and analyse the risks faced by the Group, to set appropriate risk limits and controls, and to monitor risks and adherence to limits. Risk management policies and systems are reviewed regularly to reflect changes in market conditions and the Group’s activities. The Group, through its training and management standards and procedures, aims to develop a disciplined and constructive control environment in which all employees understand their roles and obligations. The Audit Committee of the Board oversees how management monitors compliance with the Group’s risk management policies and procedures and reviews the adequacy of the risk management framework in relation to the risks faced by the Group.
Credit risk
Credit risk arises from cash and cash equivalents, deposits with banks and financial institutions, as well as credit exposures to customers, including outstanding accounts receivable, unbilled receivables and other receivables.
Credit risk is managed on a group basis. The ratings required for banks and financial institutions are a minimum rating of BBB+ for overnight maturities and a minimum of A- for any bank deposits greater than overnight and up to three months.
The Group’s exposure to credit risk arises predominately in respect of the credit risk assessment of customers. Customer credit risk is managed through application of credit procedures, in particular through risk assessment of new customers, through assessment of credit quality, taking into account their financial position, past experience and other factors. The compliance with credit terms is regularly monitored by line management.
Revenues on long term contracts are recognised based on an assessment of progress towards completion. Payment terms usually provide either for payments based on the delivery of certain identified milestones, units delivered or monthly payments, according to a contracted payment schedule over the life of the contract. Where there are changes in the scope of a trial or in the services to be provided by us, a change order or amendment is issued which may result either in an increase or decrease in the contract value. The Group also contracts on a “fee-for-service” or “time and materials” basis.
Contract periods may range from several weeks to several years depending on the nature of the work to be performed. In many cases, an upfront portion of the contract fee is paid at the time the study or trial is started. The balance of the contract fee is generally payable in instalments over the study or trial duration and may be based on the completion of certain performance targets or “milestones”, on units delivered, or on a fixed monthly payment schedule. Instalment payments may be based on key metrics for example target patient enrolment progress or delivery of the study database.
The progress towards completion for clinical service contracts is measured based on total project costs (fees are therefore inclusive of third party costs). Reimbursable costs include payments to investigators, travel and accommodation costs and various other expenses incurred over the course of the clinical trial which are fully reimbursable by the client. Reimbursable expenses are included within the contract and are invoiced on a monthly basis based on actual expenses incurred. Expenses incurred are determined by reference to activity.
While no customers individually contributed more than 10% of our revenues during the years ended 31 December 2025 and 31 December 2024, our top five customers represented 24.8% and 25.2% (as Restated) of our revenues respectively, our largest customer represented 7.0% and 7.8% (as Restated) of our revenues, respectively, and our top twenty five customers represented 64.0% and 62.4% (as Restated) of our revenues, respectively. The addition of new customer accounts, particularly large and mid-tier pharma customers and biotech customers have resulted in a reduction in the concentration of revenues from our top five customers.
Notes to Consolidated Financial Statements (continued)
for the year ended 31 December 2025
24. Financial instruments (continued)
The maximum exposure of credit risk pertaining to customers is the carrying value of accounts receivable and unbilled revenue balances. The gross value of accounts receivable and unbilled revenue balances, by geographic region, at 31 December 2025 and 31 December 2024 was as follows:
| | | | | | | | | | | | | | |
| Accounts Receivable | Unbilled Revenue |
| 31 December
2025 | 31 December
2024
(As Restated) | 31 December
2025 | 31 December
2024
(As Restated) |
| $’000 | $’000 | $’000 | $’000 |
| Europe | 1,347,954 | | 1,151,056 | | 620,192 | | 506,757 | |
| United States | 131,876 | | 230,019 | | 462,584 | | 507,141 | |
| Rest of World | 37,387 | | 47,353 | | 13,816 | | 26,276 | |
| Gross balance | 1,517,217 | | 1,428,428 | | 1,096,592 | | 1,040,174 | |
| Allowance for credit losses | (42,319) | | (35,664) | | — | | — | |
| Total, net of allowance for credit losses | 1,474,898 | | 1,392,764 | | 1,096,592 | | 1,040,174 | |
The Group has four types of financial assets that are subject to the expected credit loss model:
•trade receivables (billed amounts) for services provided to customers
•unbilled receivables (contract assets) for services provided to customers
•other receivables
•cash and cash equivalents
Trade receivables, contract assets and other receivables
The Group applies the IFRS 9 simplified approach to measuring expected credit losses which uses a lifetime expected credit loss for all trade receivables and contract assets.
To measure the expected credit losses, trade receivables and contract assets have been grouped based on shared credit risk characteristics and the days past due. The contract assets relate to unbilled work in progress and have substantially the same risk characteristics as the trade receivables for the same types of contracts. The Group has therefore concluded that the expected loss rates for trade receivables are a reasonable approximation for the loss rates for the contract assets.
The expected loss rates are based on the payment profiles of revenue over a period before 31 December 2025. The historical loss rates are adjusted to reflect current and forward-looking information on macroeconomic factors affecting the ability of the customers to settle receivables. See Note 16 Accounts receivable, unbilled services (contract assets) and unearned revenue (contract liabilities) in Notes to the Consolidated Financial Statements for assessment of the allowance for credit losses for both trade receivables and contract assets.
Trade receivables, other receivables and contract assets are written off when there is no reasonable expectation of recovery. Indicators that there is no reasonable expectation of recovery include, amongst others, the failure of a debtor to engage in a repayment plan with the group, and a failure to make contractual payments for a period of greater than 120 days past due. Impairment losses on trade receivables, other receivables and contract assets are presented as net impairment losses within operating profit. Subsequent recoveries of amounts previously written off are credited against the same line item.
Liquid and capital resources
The Group’s liquid and capital resources at 31 December 2025 were as follows:
| | | | | | | | |
| 31 December
2025 | 31 December
2024
(As Restated) |
| $’000 | $’000 |
| Cash and cash equivalents (Note 19) | 647,295 | | 538,785 | |
| Total liquid resources | 647,295 | | 538,785 | |
| Shareholders’ equity | 9,246,920 | | 9,500,980 | |
The principal operating cash requirements of the Group include payment of salaries, office rents, travel expenditures and payments to investigators. Other cash requirements include capital expenditures for facilities and information system enhancements and cash required to fund acquisition, other growth opportunities and share buy backs. The CRO industry is generally not capital intensive. The Group primarily finances its operations and growth through cash flows from operations, together with amounts drawn under negotiated facilities as required.
Notes to Consolidated Financial Statements (continued)
for the year ended 31 December 2025
24. Financial instruments (continued)
The Group’s primary objectives in managing its liquid and capital resources are as follows:
•to maintain adequate resources to fund its continued operations,
•to ensure availability of sufficient resources to sustain future development and growth of the business,
•to maintain sufficient resources to mitigate risks and unforeseen events which may arise.
The Group manages risks associated with liquid and capital resources through ongoing monitoring of actual and forecast cash balances and by reviewing the existing and future cash requirements of the business. It ensures that sufficient headroom is available under the Group’s existing negotiated facilities and negotiates additional facilities as required. Details of the Group’s negotiated facilities are set out in Note 21 Bank credit lines and loan facilities in Notes to the Consolidated Financial Statements.
Financing
On 1 July 2021, the Group completed the acquisition of PRA Health Sciences, Inc. (“PRA”) by means of a merger whereby Indigo Merger Sub, Inc., a Delaware corporation and subsidiary of ICON, merged with and into PRA, the parent of PRA Health Sciences (the “Merger”). In conjunction with the completion of the merger, ICON entered into a credit agreement (the “Credit Agreement”) providing for a senior secured term loan facility of $5,515 million and a senior secured revolving loan facility in an initial aggregate principal amount of $300 million (the “Senior Secured Credit Facilities”).
In addition to the Senior Secured Credit Facilities, the Group issued $500 million in aggregate principal amount of 2.875% senior secured notes in a private offering (the “2026 Notes”). On 2 May 2023, the Group agreed with its lenders to increase the aggregate principal amount of the senior secured revolving loan facility from $300 million to $500 million.
The New Notes
On 8 May 2024, ICON Investments Six Designated Activity Company (the “Issuer”), a wholly-owned subsidiary of ICON plc, issued $2 billion senior secured notes (“the New Notes”). The New Notes were issued in aggregate principal amounts of: $750 million 5.809% Senior Secured Notes due 2027 (the “2027 Notes”), $750 million 5.849% Senior Secured Notes due 2029 (the “2029 Notes”) and $500 million 6.000% Senior Secured Notes due 2034 (the “2034 Notes”). The proceeds from the issuance were used to repay a portion of the senior secured term loan outstanding under the Senior Secured Credit Facilities and to pay fees, costs and expenses related to the offering.
Repricing - senior secured term loan facility
On 14 March 2024, the parties to the Credit Agreement entered into a Third Amendment to the Credit Agreement (the “Third Amendment”) in connection with the repricing of the senior secured term loan facility and the senior secured revolving credit facility (The Third Amendment in relation to the senior secured revolving credit facility was further amended by the Fourth Amendment as referred to below).
With respect to the senior secured term loan facility, the repricing culminated in a margin reduction of 25 basis points, from 2.25% (based on the then-current first lien net leverage ratio) to 2.0%; and the elimination of the credit adjustment spread. The combination of the above resulted in an overall reduction of 51 basis points on the senior secured term loan facility (assuming quarterly refixing).
Repricing and extension - senior secured revolving credit facility
On 26 November 2025, the parties to the Credit Agreement entered into a Fourth Amendment (the “Fourth Amendment”) to reprice and extend the senior secured revolving credit facility.
As a result of the Fourth Amendment, the maturity was extended from a five-year term to a seven-year term ending 1July 2028. Reflecting the Fourth Amendment, the interest rate margin applicable to borrowings under the revolving loan facility will be, at the option of the borrower, either (i) the applicable base rate plus an applicable margin of 0.35% or 0.00%, based on the Company’s current corporate family rating assigned by S&P of BB (or lower) or BB+ (or higher), respectively, or (ii) Term SOFR plus an applicable margin of 1.35%, 1.00%, 0.75%, 0.55%, or 0.40% based on the Company’s current corporate family rating assigned by S&P of BB (or lower), BB+, BBB-, BBB or BBB+ (or higher), respectively. In addition, lenders under the revolving loan facility are entitled to commitment fees as a percentage of the applicable margin at the time of drawing and utilization fees dependent on the proportion of the facility drawn.
Notes to Consolidated Financial Statements (continued)
for the year ended 31 December 2025
24. Financial instruments (continued)
Senior Secured Credit Facilities repayment
During the year ended 31 December 2025, the Group made mandatory principal repayments of $29.8 million (31 December 2024: mandatory and voluntary principal repayments of $2,304.8 million) of the senior secured term loan facility. There have been no voluntary repayments made during the year ended 31 December 2025. For the year ended 31 December 2024, voluntary repayments resulted in an accelerated charge associated with previously capitalised fees of $16.9 million.
In addition, during the year ended 31 December 2025, the Group drew $50.0 million (31 December 2024: $318.0 million) of the senior secured revolving loan facility and repaid $50.0 million (31 December 2024: $373.0 million). At 31 December 2025, $nil was drawn under the senior secured revolving loan facility (31 December 2024: $nil). Refer to Note 21 Bank credit lines and loan facilities in Notes to the Consolidated Financial Statements for further details on the Company's Senior Secured Credit Facilities.
The following table sets out details of the maturity of the Group’s financial liabilities into the relevant maturity groupings based on the remaining period from the financial year end date to contractual maturity date:
Year ended 31 December 2025
| | | | | | | | | | | | | | | | | | | | |
| Carrying
amount | Contractual cash flows | Less than
1 year | 1-2 years | 2-5 years | More than
5 years |
| $’000 | $’000 | $’000 | $’000 | $’000 | $’000 |
| Bank credit lines and loan facilities | (3,402,378) | | (3,416,688) | | (529,762) | | (779,762) | | (1,607,164) | | (500,000) | |
| Interest on bank credit lines and loan facilities | (24,062) | | (587,892) | | (175,407) | | (138,492) | | (173,410) | | (100,583) | |
| Lease liabilities | (153,404) | | (170,404) | | (41,377) | | (35,918) | | (60,104) | | (33,005) | |
| Non-current other liabilities* | (69,115) | | (69,115) | | — | | (4,934) | | (15,671) | | (48,510) | |
| Accounts payable | (192,117) | | (192,117) | | (192,117) | | — | | — | | — | |
| Accrued and other liabilities** | (834,024) | | (834,024) | | (834,024) | | — | | — | | — | |
| (4,675,100) | | (5,270,240) | | (1,772,687) | | (959,106) | | (1,856,349) | | (682,098) | |
Year ended 31 December 2024
| | | | | | | | | | | | | | | | | | | | |
| Carrying
amount
(As Restated) | Contractual cash flows
(As Restated) | Less than
1 year
(As Restated) | 1-2 years
(As Restated) | 2-5 years
(As Restated) | More than
5 years
(As Restated) |
| $’000 | $’000 | $’000 | $’000 | $’000 | $’000 |
| Bank credit lines and loan facilities | (3,426,160) | | (3,446,450) | | (29,762) | | (529,762) | | (2,386,926) | | (500,000) | |
| Interest on bank credit lines and loan facilities | (24,084) | | (793,683) | | (191,319) | | (180,918) | | (290,863) | | (130,583) | |
| Lease liabilities | (176,868) | | (199,674) | | (42,931) | | (38,445) | | (73,251) | | (45,047) | |
| Non-current other liabilities* | (79,762) | | (79,762) | | — | | (5,195) | | (15,583) | | (58,984) | |
| Accounts payable | (173,025) | | (173,025) | | (173,025) | | — | | — | | — | |
| Accrued and other liabilities** | (819,748) | | (819,748) | | (819,748) | | — | | — | | — | |
| (4,699,647) | | (5,512,342) | | (1,256,785) | | (754,320) | | (2,766,623) | | (734,614) | |
*Non-current other liabilities above excludes deferred government grants (2025: $0.6 million and 2024: $0.6 million).
**Accrued and other liabilities excludes interest on senior notes presented separately above, deferred government grants (2025: $0.08 million and 2024: $0.04 million) and current lease liabilities (2025: $36.3 million and 2024: $36.8 million).
Foreign currency risk
The Group is subject to a number of foreign currency risks given the global nature of its operations. The principal foreign currency risks to which the business is subject to include both foreign currency translation risk and foreign currency transaction risk.
Although domiciled in Ireland, the Group reports its results in U.S. dollars. As a consequence, the results of our non-U.S. based operations, when translated into U.S. dollars, could be affected by fluctuations in exchange rates between the U.S. dollar and the currencies of those operations.
Notes to Consolidated Financial Statements (continued)
for the year ended 31 December 2025
24. Financial instruments (continued)
The Group is also subject to foreign currency transaction exposures as the currency in which its contracts are priced can be different from the currencies in which costs relating to those contracts are incurred. The Group's operations in the United States are not materially exposed to such currency differences as the majority of revenues and costs are in U.S. dollars. However, outside the United States the multinational nature of our activities means that contracts may be priced in a single currency, most often U.S. dollars, or euro, while costs arise in a number of currencies, depending, among other things, on which of our offices provide staff for the contract and the location of investigator sites. Although many such contracts benefit from some degree of natural hedging due to the matching of contract revenues and costs in the same currency, where costs are incurred in currencies other than those in which contracts are priced, fluctuations in the relative value of those currencies could have a material effect on our results of operations. The Group regularly reviews its foreign currency exposures and usually negotiates currency fluctuation clauses in its contracts which allow for price negotiation if certain exchange rate triggers occur. We had no open foreign currency contracts as at 31 December 2025 or 31 December 2024.
The following significant exchange rates applied during the year:
| | | | | | | | | | | | | | |
| Average Rate | Closing Rate |
| 2025 | 2024 | 2025 | 2024 |
| Euro:USD | 1.1222 | 1.0854 | 1.1746 | 1.0354 |
| Pound Sterling:USD | 1.3150 | 1.2809 | 1.3475 | 1.2516 |
A simultaneous ten percent strengthening or weakening of the US Dollar, Euro and Sterling against all other currencies (which remained constant) would have increased or decreased profit before tax by $30.8 million, $22.7 million and $43.6 million respectively (31 December 2024: $71.0 million, $6.8 million and $86.5 million respectively) as a consequence of the retranslation of foreign currency denominated financial assets and liabilities at those dates.
Interest rate risk
The Group is exposed to interest rate risk in respect of its cash and cash equivalents. The Group's treasury function actively manages its available cash resources and invests surplus cash balances to ensure optimum returns for the Company. Funds may be invested in the form of floating rate notes and medium term minimum “A-” rated corporate securities. The Group may be subject to interest rate risk in respect of interest rate changes on amounts invested. Interest rate risk is managed by monitoring the composition of the Company’s investment portfolio on an ongoing basis having regard to current market interest rates and future trends.
As the Group has variable rate debt, fluctuations in interest rates affect its business. The Group attempts to minimise interest rate risk by issuing fixed term debt to provide a mix of fixed and floating rate debt in the Group's debt portfolio. At 31 December 2025, 73% of the Group's outstanding debt is at a fixed interest rate (31 December 2024: 73%).
During the year ended 31 December 2024, the Group's exposure to interest rate fluctuations significantly reduced with the voluntary and mandatory repayments of the senior secured term loan facility (refer to Note 21 Bank credit lines and loan facilities in Notes to the Consolidated Financial Statements). Given this reduction and the repricing of the Senior Secured Credit facilities, the Company closed the 2022 Caps and 2022 Swap agreements at that time.
The Group regularly evaluates its debt arrangements, as well as market conditions, and explores the opportunity to modify its existing arrangements or pursue additional financing arrangements that may result in the issuance of new debt securities.
The sensitivity analysis below represents the hypothetical change in the net interest payable of a 1% movement in market interest rates.
| | | | | | | | | | | | | | |
| Interest Income | Interest Costs* |
| 2025 | 2024 | 2025 | 2024 |
| $’000 | $’000 | $’000 | $’000 |
| As reported | 7,109 | | 8,609 | | 197,490 | | 237,237 | |
| 1% Increase | 12,253 | | 13,639 | | 206,998 | | 254,987 | |
| 1% Decrease | 1,965 | | 3,579 | | 187,982 | | 219,487 | |
*At 31 December 2025, 73% of the interest costs fixed due to the 2026 Notes and New Notes. $6.0 million financing fees have been allocated to interest cost which are not impacted by a change in interest rate. Interest costs above excludes interest on lease liabilities.
Notes to Consolidated Financial Statements (continued)
for the year ended 31 December 2025
24. Financial instruments (continued)
Derivatives
The Group previously entered into interest rate cap and swap agreements for purposes of managing its exposure to interest rate fluctuations.
On 29 November 2022, the Group entered into two interest rate cap agreements (“2022 Caps”) with an initial total notional value of $2,101 million to limit its exposure to changes in the variable interest rate on its Senior Secured Credit Facilities. Interest on the 2022 Caps began accruing on 30 December 2022 and the interest rate caps were due to expire on 31 December 2024. Under the terms of the interest rate caps, the Group had paid a fixed rate of 0.42% and received a variable rate equal to the amount that the three-month SOFR rate exceeds 4.75%.
On 29 November 2022, the Group entered into an interest rate swap agreement (“2022 Swap”) with an initial notional value of $1,101 million to limit its exposure to changes in the variable interest rate on its Senior Secured Credit Facilities. Interest on the 2022 Swap was due to begin accruing on 31 December 2024 and the interest rate swap was due to expire on 30 September 2026. Under the terms of the interest rate swap, the Group would have paid a fixed rate of 3.4% and would have received a variable rate of interest equal to the three-month SOFR on the 2022 Swap.
The 2022 Caps and the 2022 Swap were designated as cash flow hedges. Gains and losses were initially reported as a component of other comprehensive income/loss and subsequently recognised in net income.
During the year ended 31 December 2024, the Group’s exposure to interest rate fluctuations significantly reduced with the voluntary and mandatory repayments of the senior secured term loan facility (refer to Note 21 Bank credit lines and loan facilities in Notes to the Consolidated Financial Statements). Given this reduction and the repricing of the Senior Secured Credit facilities (in March 2024), the Group closed the 2022 Caps and 2022 Swap agreements at that time.
The Group held no derivative financial instruments as at 31 December 2025 and 31 December 2024.
At 31 December 2025, 73% of the Company's outstanding debt is at a fixed interest rate (31 December 2024: 73%).
During the year ended 31 December 2025, the Company recognised a gain of $nil (31 December 2024: $5.0 million) within other comprehensive income / loss after a reclassification of $2.4 million (31 December 2024: $13.9 million) from other comprehensive income / loss to the Consolidated Statement of Profit and Loss.
Fair values
Certain financial instruments are measured in the Statement of Financial Position at fair value using a fair value hierarchy of valuation inputs. The fair value of financial assets together with the carrying amounts shown in the Statement of Financial Position is as follows:
| | | | | | | | | | | | | | | | | | | | | | | | | | |
| 31 December 2025 | 31 December 2024 |
| Carrying
Amount | Level 1 | Level 2 | Level 3 | Carrying
Amount | Level 1 | Level 2 | Level 3 |
| $’000 | $’000 | $’000 | $'000 | $’000 | $’000 | $’000 | $’000 |
| Financial assets measured at fair value | | | | |
| | | | | | | | |
Financial assets at fair value through profit and loss1 | 79,550 | | — | | — | | 79,550 | | 54,448 | | — | | — | | 54,448 | |
| | | | | | | | |
| Total Assets | 79,550 | | — | | — | | 79,550 | | 54,448 | | — | | — | | 54,448 | |
| | | | | | | | |
| | | | |
| | | | | | | | |
| | | | | | | | |
| | | | | | | | |
1Relates to investments in equity excluding investments in equity securities recorded at cost, net of impairment of $2.5 million (31 December 2024: $3.5 million) .
The carrying values of accounts receivable (less provision for loss), unbilled revenue (contract assets), other current assets, cash and cash equivalents and other non-current assets are carried at amortised cost and assumed to be approximate to their fair values due to the short-term nature of these balances. As such their fair values have not been disclosed.
Long-term financial assets carried at fair value result in gains or losses being recognised in the Consolidated Statement of Profit and Loss. The fair value of long-term financial assets meet the definition of equity securities without readily determinable fair values and are measured on the basis of level 3 inputs as the funds are not traded on an exchange and data is not published in respect of the funds. The valuation model is based on the net asset value of the fund as prepared by an independent appraiser.
The carrying values of accounts payable, accrued and other liabilities and provisions and other non-current liabilities are carried at amortised cost and assumed to be approximate to their fair values.
Notes to Consolidated Financial Statements (continued)
for the year ended 31 December 2025
24. Financial instruments (continued)
Each category of asset and liability has remained within the same level of hierarchy as the prior year as there has been no change in the extent to which the inputs used in measuring fair value are or are not observable within the market.
The following table shows reconciliation from the opening balances to the closing balances for Level 3 fair values:
| | | | | | | | |
| 31 December 2025 | 31 December 2024 |
| $’000 | $’000 |
| Opening balance | 54,448 | | 46,804 | |
| Additions / (payments) / other movements during the year | 11,218 | | 10,971 | |
Increase / (decrease) in fair value recognised in profit and loss | 13,884 | | (3,327) | |
| Closing balance | 79,550 | | 54,448 | |
There have been no transfers between level 1/2 financial instruments and level 3 financial instruments during the current or prior financial year.
25. Leases
Right-of-use assets
The Group has recorded the following for right-of-use assets:
| | | | | | | | | | | | | | |
| Premises | Equipment | Motor vehicles | Total |
| $'000 | $'000 | $'000 | $'000 |
Depreciation charge for 2025 | 31,940 | | 78 | | 5,630 | | 37,648 | |
| Right-of-use assets at 31 December 2025 | 113,003 | | 75 | | 10,041 | | 123,119 | |
| Depreciation charge for 2024 | 33,933 | | 119 | | 6,962 | | 41,014 | |
| Right-of-use assets at 31 December 2024 | 133,640 | | 84 | | 9,581 | | 143,305 | |
Additions to right-of-use assets during 2025 were $18.4 million (2024: $64.8 million).
The weighted average remaining lease term at 31 December 2025 was 5.96 years (2024: 6.56 years ).
During the year ended 31 December 2025, as a result of office consolidations, certain Right-of-use assets have been impaired to the extent they are considered onerous and an impairment loss of $3.7 million was recorded (2024: $13.8 million) - see Note 9 Exceptional items in Notes to the Consolidated Financial Statements.
Lease liabilities
Set out below are the carrying amounts of lease liabilities at each reporting date. Current lease liabilities have been included in accrued and other liabilities in the Consolidated Statement of Financial Position.
| | | | | | | | | | |
| 31 December 2025 | | | 31 December 2024 |
| $’000 | | | $’000 |
| Current | 36,282 | | | | 36,783 | |
| Non-Current | 117,122 | | | | 140,085 | |
| Total | 153,404 | | | | 176,868 | |
Total lease payments for the year ended 31 December 2025 were $48.2 million (2024: $47.7 million).
Notes to Consolidated Financial Statements (continued)
for the year ended 31 December 2025
25. Leases (continued)
Future minimum lease payments under non-cancelable leases as of 31 December 2025 were as follows:
| | | | | |
| 31 December 2025 |
| $'000 |
| 2026 | 41,377 | |
| 2027 | 35,918 | |
| 2028 | 27,618 | |
| 2029 | 20,106 | |
| 2030 | 12,380 | |
| Thereafter | 33,005 | |
| Total future minimum lease payments | 170,404 | |
| Lease imputed interest | (17,000) | |
| Total | 153,404 | |
Amounts recognised in profit or loss
The following amounts were recognised in profit and loss:
| | | | | | | | |
| 31 December 2025 | 31 December 2024 |
| $'000 | $'000 |
| Depreciation of right-of-use assets | 37,648 | | 41,014 | |
| Interest on lease liabilities | 6,184 | | 5,379 | |
Of the total cost of $43.8 million incurred in the year ended 31 December 2025, $31.5 million is recorded within other operating expenses, $6.1 million is recorded within direct costs and $6.2 million is recorded within finance costs. During 2025, the Group had income from sub-leases of $2.9 million.
Of the total cost of $46.4 million incurred in the year ended 31 December 2024, $33.3 million is recorded within other operating expenses, $7.7 million is recorded within direct costs and $5.4 million is recorded within finance costs. During 2024, the Group had income from sub-leases of $1.6 million.
Notes to Consolidated Financial Statements (continued)
for the year ended 31 December 2025
26. Commitments and contingencies
a) Capital commitments
The following capital commitments for the purchase of property, plant, equipment and computer software were authorised by the Group at 31 December 2025 and 31 December 2024:
| | | | | | | | |
| 31 December
2025 | 31 December
2024 |
| $’000 | $’000 |
| Contracted for | 172,627 | 128,639 |
| Total | 172,627 | 128,639 |
(b) Contractual obligations
The following represents Group contractual obligations and commercial commitments as at 31 December 2025:
| | | | | | | | | | | | | | |
| Payments due by period |
| Total | Less than
1 year | 1 to 5
years | More than
5 years |
| $’000 | $’000 | $’000 | $’000 |
| Capital commitments | 172,627 | | 150,192 | | 22,435 | | — | |
| Total contractual obligations | 172,627 | | 150,192 | | 22,435 | | — | |
The Group believes that it will be able to fund additional foreseeable cash needs for the next twelve months from cash flow from operations and existing cash balances. In the future, the Group may consider acquiring businesses to enhance service offerings and global presence. Any such acquisitions may require additional external financing and the Group may, from time to time, seek to obtain funds from public or private issues of equity or debt securities. There can be no assurance that such financing will be available on terms acceptable to the Group.
The Group entered into subscription agreements with a number of funds (see Note 18 Financial asset investments in Notes to the Consolidated Financial Statements). During the year ended 31 December 2025, net capital totalling $10.8 million had been advanced under the terms of the subscription agreements (2024: $13.1 million). The Group had committed to future investments of $137.1 million (2024: $102.2 million) in respect of these funds (In addition to the capital commitments included in the table above). The timing of the commitment is not specified in the subscription agreements.
(c) Guarantees
(i) Guarantees in respect of borrowings of subsidiaries
ICON plc and certain other subsidiaries within the Group have guaranteed the Senior Secured Credit Facilities and Senior Secured Notes as set out in Note 21 Bank credit lines and loan facilities in Notes to the Consolidated Financial Statements. The Group does not expect any material loss to arise from these guarantees.
(ii) Section 357 Guarantees
The Company has guaranteed all of the commitments and liabilities referred to in Section 357(1) (b) of the Companies Act in respect of the whole of the financial year ending 31 December 2025 for the subsidiary companies listed below. These subsidiaries are availing of the exemption under Section 357 of the Companies Act not to file statutory financial statements.
•ICON Clinical Research Limited
•ICON Holdings Unlimited Company
•ICON Clinical Research Property Holdings (Ireland) Limited
•ICON Clinical Research Property Development (Ireland) Limited
•ICON Holdings Clinical Research International Limited
•Accellacare Limited
•ICON Global Treasury Unlimited Company
•ICON Clinical Global Holdings Unlimited Company
•ICON Operational Financing Unlimited Company
•ICON Operational Holdings Unlimited Company
•ICON Clinical Research Holdings (Ireland) Unlimited Company
•ICON Investments Six Designated Activity Company
Notes to Consolidated Financial Statements (continued)
for the year ended 31 December 2025
27. Litigation
Other than as described below, we do not expect any current litigation to have a materially adverse effect on our financial condition or results of operations. However, from time to time, we may become involved in various lawsuits and legal proceedings which arise in the ordinary course of business. Litigation is subject to inherent uncertainties, and an adverse result in these or other matters may arise from time to time that may harm our business, and one or more unfavourable outcomes could adversely affect us for the period in which they are resolved. In addition, regardless of their merits or their ultimate outcomes, lawsuits and legal proceedings are costly, divert management attention, and may adversely affect our reputation, even if they are resolved in our favour.
The Company, its former Chief Executive Officer, and its former Chief Financial Officer were named as defendants in two class action lawsuits involving similar claims, filed in the United States District Court for the Eastern District of New York on 10 February 2025 (Shing v. ICON plc, et al.) and 2 April 2025 (Police and Fire Retirement System of the City of Detroit v. ICON plc), respectively, alleging that defendants made misleading statements regarding the Company’s financial performance and future business prospects in violation of Sections 10(b) and 20(a) of the Securities Exchange Act of 1934. The two cases have been consolidated and are proceeding under the caption In re ICON plc Securities Litigation, No. 2:25-cv-00763 (the “Putative Class Action”). Lead plaintiffs and lead counsel for the putative class were appointed on 10 June 2025. On 12 September 2025, the lead plaintiffs filed an amended complaint that names the Company’s current Chief Executive Officer in addition to the original defendants.
On 12 November 2025, the defendants filed a motion to dismiss the amended complaint. Lead plaintiffs filed an opposition on 13 January 2026. On 13 February 2026, the parties filed a stipulation that the lead plaintiffs may file a further amended complaint within 30 days after the Company publicly reports full-year 2025 results. Given the preliminary stage of the litigation and inherent uncertainties in light of the forthcoming further amended complaint, we are unable at this time to form a view as to whether an adverse outcome is either probable or remote or to estimate the amount or range of potential loss in the event of an adverse outcome.
28. Related parties
(i) Transactions with Directors and Executive Officers
The total compensation of the Directors and Executive Officers being CEO and CFO (key management remuneration) for the years ended 31 December 2025 and 2024 was as follows:
| | | | | | | | |
| 31 December
2025 | 31 December
2024 |
| $’000 | $’000 |
| Salary and fees | 3,747 | | 3,145 | |
| | |
| All other compensation | 1,452 | | 76 | |
| Pension contributions | 207 | | 207 | |
| Share-based payment expense | 25,453 | | 4,717 | |
| Total | 30,859 | | 8,145 | |
Details of ordinary shares, share options, RSUs and PSUs held by the Directors and Executive Officers and details of transactions entered into by Directors and Key Executive Officers in shares and share options of the Company during the year ended 31 December 2025 are set out in Note 10 Payroll and related benefits in Notes to the Consolidated Financial Statements.
(ii) Other related party transactions
During the year, subsidiaries of the Group earned revenue of $0.4 million (31 December 2024: $0.3 million) from Corvus Pharmaceuticals. Dr. Linda Grais serves as a Director and shareholder of Corvus Pharmaceuticals. At 31 December 2025, $0.1 million (31 December 2024: $0.1 million) was noted as due from Corvus Pharmaceuticals .
During the year, subsidiaries of the Group earned revenue of $nil (31 December 2024: $nil) from Afimmune Limited. Dr. John Climax is the Chief Executive Officer and a Director and shareholder of Afimmune Limited. At 31 December 2025, $0.1 million was noted as due from Afimmune Limited (31 December 2024: $0.1 million).
Notes to Consolidated Financial Statements (continued)
for the year ended 31 December 2025
29. Subsequent events
The Group has evaluated subsequent events from 31 December 2025 through 25 June 2026, the date at which the consolidated financial statements were available to be issued.
Bridge Secured Credit Facility
On 27 April 2026, ICON Global Treasury Unlimited Company (the “Bridge Facility Borrower”) entered into a bridge facility credit agreement for an aggregate principal amount of $500 million (the "Bridge Secured Credit Facility"). The proceeds of the Bridge Secured Credit Facility may be used to discharge and repay in full $500 million aggregate principal amount of 2.875% Senior Secured Notes (the “2026 Notes”) issued by a subsidiary of the Group in July 2021. The Bridge Secured Credit Facility will mature on 26 April 2027.
The borrowings under the Bridge Secured Credit Facility do not amortise and are due at final maturity. The interest rate margin applicable to borrowings under the Bridge Secured Credit Facility is USD Term SOFR plus a fixed calendared applicable margin ranging from 1.00% to 2.25%. At 25 June 2026 , the applicable margin was 1.00%.
The Bridge Facility Borrower’s obligations under the Bridge Secured Credit Facility are guaranteed by ICON and the subsidiary guarantors party thereto. The Bridge Secured Credit Facility is secured by a lien on substantially all of the assets (subject to certain exceptions) of ICON, the Bridge Facility Borrower and each of the subsidiary guarantors, and the Bridge Secured Credit Facility will have a first-priority lien on such assets which will rank pari passu with the lien securing ICON’s other first lien secured indebtedness and is subject to other permitted liens. The Company is permitted to make voluntary prepayments under the Bridge Secured Credit Facility without premium or penalty (subject to customary break funding payments).
The Bridge Secured Credit Facility contains customary negative covenants, including, but not limited to, restrictions on the ability of ICON and its subsidiaries to merge and consolidate with other companies, incur indebtedness, grant liens or security interests on assets, pay dividends or make other restricted payments, sell or otherwise transfer assets or enter into transactions with affiliates.
The Bridge Secured Credit Facility provides that, upon the occurrence of certain events of default, the obligations under the credit agreement may be accelerated. Such events of default will include payment defaults to the lenders thereunder, material inaccuracies of representations and warranties, covenant defaults, cross-defaults to other material indebtedness, voluntary and involuntary bankruptcy proceedings, material monetary judgments, material pension-plan events, change of control and other customary events of default.
Disposal of Symphony Health Solutions Corporation
On 8 May 2026, ICON completed the disposition of Symphony Health Solutions Corporation (“Symphony”) pursuant to a merger agreement, by and among HealthVerity, Inc. (“HealthVerity”), Symphony, Pharmaceutical Research Associates, Inc. and HealthVerity Merger Sub, Inc. (“HV Merger Sub”), a wholly owned subsidiary of HealthVerity. Pursuant to the merger agreement, HV Merger Sub merged with and into Symphony, with Symphony surviving the merger as a wholly owned subsidiary of HealthVerity. The consideration payable by HealthVerity in connection with the merger consisted of shares of stock in HealthVerity, subject to customary adjustments as set forth in the merger agreement. In connection with the merger, ICON also purchased additional shares of stock in HealthVerity for an aggregate purchase price of $37.5 million. As a result, ICON holds a minority equity interest in HealthVerity. As of 8 May 2026, the Company’s investment in HealthVerity has been recorded at a carrying value of $nil.
Waivers to the debt agreements
On 27 April 2026, the parties (limited to the borrowers and revolving lenders under the senior secured revolving loan facility only) to the Credit Agreement (as defined below) entered into a Consent to Credit Agreement pursuant to which such revolving lenders agreed to provide a limited and temporary waiver of the requirement to deliver certain financial statements under the senior secured revolving credit facility in connection with the borrowings thereunder. The waiver applied solely for the specified consent period ending 31 May 2026.
On 18 May 2026, the Company launched a consent and waiver to the Credit Agreement (applicable to all facilities thereunder) in order to request that the requisite lenders thereunder agree to (i) waive the technical default caused by the Company’s late delivery of its Annual Report on Form 20-F for the fiscal year ending 31 December 2025, (ii) provide an extension of the delivery of the Company’s Annual Report on Form 20-F for the fiscal year ending 31 December 2025 to 16 July 2026 and (iii) provide an extension of the delivery of the Company’s quarterly financial statements for the fiscal quarter ending 31 March 2026 to 31 July 2026. Consent to the waiver was received on 22 May 2026.
The Company filed its Annual Report on Form 20-F for the year ended 31 December 2025 on 27 May 2026. On 29 May 2026, the Annual Report on Form 20-F that was subject to the 27 April 2026 and 18 May 2026 waivers was delivered to the requisite parties under the Credit Agreement.
The Group has determined that there are no other items to disclose.
Notes to Consolidated Financial Statements (continued)
for the year ended 31 December 2025
30. Subsidiary undertakings
As at 31 December 2025 the Group had the following principal subsidiary undertakings:
| | | | | | | | | | | | |
| Name | Registered Office1 | Nature of business | Proportion held by
Group | |
| ICON Clinical Research S.A. | Cecilia Grierson 255, Floor 6°
City of Buenos Aires
C1107CPE
Argentina | Clinical research services | 100% | |
| RPS Research S.A. | Cecilia Grierson 255, Floor 6°
City of Buenos Aires
C1107CPE
Argentina | Clinical research services | 100% | |
| ICON Clinical Research PTY Limited | Suite 201,
Level 2, 2-4 Lyon Park Road,
Macquarie Park
NSW 2113
Australia | Clinical research services | 100%2 | |
| KCR CRO Pty Ltd | Suite 104, Level 1,
109 Oxford Street, Bondi Junction,
NSW 2022, Sydney,
Australia | Clinical research services | 100% | |
| Medpass International Pty Ltd | Level 2,
Pier 8, Shop 9,
23 Hickson Road,
Millers Point,
NSW 2000
Australia | Clinical research services | 100% | |
| Pharmaceutical Research Associates Pty Limited | C/- ICON Clinical Research Pty Ltd.
Suite 201, Level 2
2-4 Lyon Park Road
Macquarie Park
NSW 2113
Australia | Clinical research services | 100% | |
| ICON Clinical Research Austria GmbH | Pyrkergasse 10/6
1190 Vienna
Austria | Clinical research services | 100% | |
| RPS Research Austria GmbH | Tegetthoffstraße 7
1010 Vienna, Austria | Clinical research services | 100% | |
IMP-Logistics Bel, FLLC
| 28, Malinina st. bld.4,
Liter A 1-2/k,
Office #3,
Minsk
Republic of Belarus 220101 | Clinical research services | 100% | |
| ICON Clinical Research Belgium B.V. | Kardinaal Mercierplein 2
2800 Mechelen
Belgium | Clinical research services | 100% | |
| RPS Bermuda, Ltd. | Victoria Place, 5th Floor
31 Victoria Street
Hamilton HM 10 Bermuda | Holding company | 100% | |
| ICON Pesquisas Clínicas Ltda. | Av. Ibirapuera 2332,
Torre II 4º Andar,
São Paulo, SP,
Brazil,
CEP 04028-003 | Clinical research
services | 100%2 | |
| Pharmaceutical Research Associates Ltda. | Av. Ibirapuera 2332,
Torre II 4º Andar,
São Paulo, SP,
Brazil,
CEP 04028-003 | Clinical research services | 100% | |
| RPS do Brasil Serviços de Pesquisas Ltda. | Av. Ibirapuera 2332,
Torre II 4º Andar,
São Paulo, SP,
Brazil,
CEP 04028-003 | Clinical research services | 100% | |
Notes to Consolidated Financial Statements (continued)
for the year ended 31 December 2025
30. Subsidiary undertakings (continued)
| | | | | | | | | | | | |
| Name | Registered Office1 | Nature of business | Proportion held by
Group | |
| RPS China Inc. | c/o Vistra Corporate Services Centre, Wickhams Cay II, Road Town, Tortola, VG1110, British Virgin Islands | Holding company | 100% | |
| ICON Clinical Research EOOD | 2A, Saborna Str.,
4th floor, Sofia – 1000,
Republic of Bulgaria | Clinical research services | 100% | |
| KCR CRO Ltd. | 17 Henrik Ibsen Street, EM Building, Floor 3, Sofia, Bulgaria, 1407, Bulgaria | Clinical research services | 100% | |
| Pharmaceutical Research Associates Bulgaria EOOD | 51b Bulgaria Blvd., Floor 4
Sofia,
Bulgaria 1404 | Clinical research services | 100% | |
| 3065613 Nova Scotia Company | 1741 Lower Water Street,
Suite 600
Halifax,
Nova Scotia B3J 0J2,
Canada | Holding company | 100% | |
| ICON Clinical Research (Canada) Inc. | 1, Place Ville Marie,
Suite 3000,
Montréal QC H3B 4N8,
Canada | Clinical research services | 100% | |
| Pharmaceutical Research Associates ULC | 1741 Lower Water Street,
Suite 600
Halifax,
Nova Scotia B3J 0J2,
Canada | Clinical research services | 100% | |
| Services de Recherche Pharmaceutique Srl | 1741 Lower Water Street,
Suite 600
Halifax,
Nova Scotia B3J 0J2,
Canada | Clinical research services | 100% | |
| Oxford Outcomes LTD. | 19th Floor
885 West Georgia Street
Vancouver BC V6C 3H4
Canada | Clinical research services | 100% | |
| ICON Life Sciences Canada Inc. | 5420 North Service Road, Suite 206, Burlington, ON L7L 6C7,Canada | Clinical research services | 100% | |
| ICON Chile Limitada | Avenida Mariano Sánchez Fontecilla 310
Las Condes
Santiago
Región Metropolitana
7550296
Chile | Clinical research services | 100% | |
| PRA Health Sciences Chile SpA | Miraflores 222 piso 28
Santiago, Chile | Clinical research services | 100% | |
| ICON Clinical Research (Beijing No.2) Co., Ltd | Floor 2, Building 5,
Hongda Industrial park,
No. 8, Hongda North Road,
Beijing Economic-Technological Development Area,
Beijing, China | Clinical research services | 100% | |
| ICON Clinical Research (Beijing) Co., Ltd | Floor 1
Building No. 5,
No. 8 Hongda North Road,
Beijing Economic-Technologies
Developement Zone,
Beijing, China | Clinical research services | 100% | |
| PRA Health Sciences China, Inc. | Room 301, Floor 3, Building No. 5, Hongda Industrial Park, No. 8 Hongda North Road, Beijing Economic-Technological Development Area, Beijing, China | Clinical research services | 100% | |
Notes to Consolidated Financial Statements (continued)
for the year ended 31 December 2025
30. Subsidiary undertakings (continued)
| | | | | | | | | | | | |
| Name | Registered Office1 | Nature of business | Proportion held by
Group | |
| PRA Health Sciences Colombia Ltda. | Calle 116 No. 7 – 15
Torre Cusezar Oficina 1002
Bogotá
Cundinamarca
Colombia
110111 | Clinical research services | 100% | |
| Research Pharmaceutical Services Costa Rica, LTDA. | Sabana Business Center, piso 11
Bulevar Rohrmoser y Calle 68
San José,
Costa Rica 10108 | Clinical research services | 100% | |
| ICON Research Ltd. | Radnicka cesta 80,
Zagreb,
Croatia | Clinical research | 100% | |
| Pharm Research Associates Ltd. | (BDO)
Radnička cesta 180,
10 000 Zagreb, Croatia | Clinical research services | 100% | |
| ICON Clinical Research Czech Republic s.r.o. | V parku 2335/20,
Chodov, Praha 4
PSČ 148 00
Czech Republic | Clinical research | 100% | |
KCR Czech Republic a.s., (in Liquidation) 4 | Purkyňova 74/2, Nové Město, 110 00 Prague 1,
Czech Republic | Clinical research services | 100% | |
| DOCS International Nordic Countries A/S | c/o Keller Advokatfirma, H.C. Andersens Boulevard 48,
1. th., DK-1553 København V., Denmark | Clinical research services | 100% | |
| Pharmaceutical Research Associates Denmark ApS | c/o Keller Advokatfirma, H.C. Andersens Boulevard 48,
1. th., DK-1553 København V., Denmark | Clinical research services | 100% | |
| ICON Clinical Research Egypt Limited Liability Company | 40 Road 254, Shell Building,
5th Floor
Degla, Maadi,
11431 Cairo,
Egypt | Clinical research | 100% | |
| KCR Baltics OÜ | Harju maakond, Tallinn,
Pohja-Tallinna Iinnaosa,
Pohja pst 25, 10415,
Estonia | Clinical research services | 100% | |
| RPS Estonia OÜ | Pärnu road 22
10141 Tallinn, Republic of Estonia | Clinical research services | 100% | |
| DOCS International Finland Oy | Mannerheimintie 12B,
00100 Helsinki
Finland | Clinical research services | 100% | |
| Pharmaceutical Research Associates Finland Oy | c/o BDO Oy, Tax and Legal
Porkkalankatu 3
00180 HELSINKI
Finland | Clinical research services | 100% | |
| ICON Clinical Research S.A.R.L. | Tour Légende, Quartier de la Défense, 21 place de la Défense, Puteaux, 92800, France | Clinical research services | 100% | |
| Mapi Research Trust | 27 rue de la Villette,
69003 Lyon,
France | Clinical research services | 100%3 | |
| Oncacare France SAS | Tour Légende, Quartier de la Défense, 21 place de la Défense, Puteaux, 92800, France | Clinical research | 100% | |
| ReSearch Pharmaceutical Services France S.A.S. | Tour Légende, Quartier de la Défense, 21 place de la Défense, Puteaux, 92800, France | Clinical research services | 100% | |
| IMP Logistics Georgia LLC | Mtatsminda District
Freedom Square N4 (Plot 66/4)
Tbilisi, Georgia | Clinical research services | 100% | |
Notes to Consolidated Financial Statements (continued)
for the year ended 31 December 2025
30. Subsidiary undertakings (continued)
| | | | | | | | | | | | |
| Name | Registered Office1 | Nature of business | Proportion held by
Group | |
| KCR LLC | Mtatsminda District, Freedom Square N4, Tbilisi, Georgia | Clinical research services | 100% | |
| Pharmaceutical Research Associates Georgia LLC | 42-42a (Building No. 1)
Alexander Kazbegi Avenue
Vake-Saburtalo District
Tbilisi, Georgia | Clinical research services | 100% | |
Averion Europe GmbH i.L (in Liquidation)5 | Konrad-Zuse-Platz 11
81829 München
Germany | Clinical research | 100% | |
| ICON Clinical Research Germany GmbH | Heinrich-Hertz-Straße 26
63225
Langen
Hessen
Germany | Clinical research services | 100% | |
| KCR CRO GmbH | Heinrich-Hertz-Straße 26, 63225, Langen, Germany | Clinical research services | 100% | |
| KCR Placement GmbH (in liquidation) | Am Kupfergraben 4 - 4 a,
Pergamon Palais,
10117 Berlin,
Germany | Clinical research services | 100% | |
| Oncacare (Germany) GmbH | Heinrich-Hertz-Straße 26
63225
Langen
Hessen
Germany | Clinical research | 100% | |
| Pharmaceutical Research Associates Greece A.E. | 81 Ifigeneias Street
Nea Ionia 142 31
Attikis,
Athens,
Greece | Clinical research services | 100% | |
| ICON Clinical Research Guatemala, S.A. | 5 Avenida 5-55, Zona 14
Edificio Europlaza World Business Center
Torre II, Nivel 9
Guatemala City,
Guatemala | Clinical research services | 100% | |
| ICON Clinical Research Hong Kong Limited | Unit 4333 & 4335C, 43/F
AIA Tower, 183 Electric Road
North Point, Hong Kong | Clinical research services | 100% | |
| PRA Health Sciences (Hong Kong) Limited | Unit 4321 & 4336A, 43/F
AIA Tower, 183 Electric Road
North Point, Hong Kong | Clinical research services | 100% | |
| ICON Clinical Research Limited Liability Company | Szepvolgyi ut 39
HU-1037 Budapest
Hungary | Clinical research | 100% | |
| Pharmaceutical Research Associates Hungary Research and Development Ltd. | Szepvolgyi ut 39
HU-1037 Budapest
Hungary | Clinical research | 100% | |
| RPS Iceland ehf. | Skipholti 50D
105 Reykjavik, Iceland | Clinical research services | 100% | |
| ICON Clinical Research India Private Limited | CHENNAI ONE IT PARK ITE/ITES SEZ North Block
Block B, 4th Floor, Thoraipakkam
Chennai
Tamil Nadu-TN
600097
India | Clinical research | 100% | |
| Pharmaceutical Research Associates India Private Limited | Level 3, Level 4, Block 1,
Prestige Blue Chip Software Park
Municipal No 9, Hosur Road,
Adugodi, Madiwala Range, Ward No 63,
Bangalore – 560029
Karnataka | Clinical research services | 100% | |
Notes to Consolidated Financial Statements (continued)
for the year ended 31 December 2025
30. Subsidiary undertakings (continued)
| | | | | | | | | | | | |
| Name | Registered Office1 | Nature of business | Proportion held by
Group | |
| Accellacare Limited | South County Business Park,
Leopardstown,
Dublin 18
Republic of Ireland
D18 X5R3 | Clinical research services | 100% | |
| ICON (LR) Limited | South County Business Park,
Leopardstown,
Dublin 18
Republic of Ireland
D18 X5R3 | Clinical research services | 100% | |
| ICON Clinical Global Holdings Unlimited Company | South County Business Park,
Leopardstown,
Dublin 18
Republic of Ireland
D18 X5R3 | Investment holding company | 100% | |
| ICON Clinical Research Holdings (Ireland) Unlimited Company | South County Business Park,
Leopardstown,
Dublin 18
Republic of Ireland
D18 X5R3 | Investment holding company | 100% | |
| ICON Clinical Research Limited | South County Business Park,
Leopardstown,
Dublin 18
Republic of Ireland
D18 X5R3 | Clinical research services | 100% | |
| ICON Clinical Research Property Development (Ireland) Limited | South County Business Park,
Leopardstown,
Dublin 18
Republic of Ireland
D18 X5R3 | Property management company | 100% | |
| ICON Clinical Research Property Holdings (Ireland) Limited | South County Business Park,
Leopardstown,
Dublin 18
Republic of Ireland
D18 X5R3 | Property management company | 100%2 | |
| ICON Global Treasury Unlimited Company | South County Business Park,
Leopardstown,
Dublin 18
Republic of Ireland
D18 X5R3 | Investment holding and financing company | 100% | |
| ICON Holdings Clinical Research International Limited | South County Business Park,
Leopardstown,
Dublin 18
Republic of Ireland
D18 X5R3 | Investment holding company | 100% | |
| ICON Holdings Unlimited Company | South County Business Park,
Leopardstown,
Dublin 18
Republic of Ireland
D18 X5R3 | Investment holding company | 100% | |
| ICON Investments Four Unlimited Company (in Liquidation) | South County Business Park,
Leopardstown,
Dublin 18
Republic of Ireland
D18 X5R3 | Investment holding
and financing
company | 100% | |
ICON Investments Six Designated Activity Company
| South County Business Park,
Leopardstown,
Dublin 18
Republic of Ireland
D18 X5R3 | Investment holding
and financing
company | 100%2 | |
| ICON Operational Financing Unlimited Company | South County Business Park,
Leopardstown,
Dublin 18
Republic of Ireland
D18 X5R3 | Investment holding and financing company | 100% | |
Notes to Consolidated Financial Statements (continued)
for the year ended 31 December 2025
30. Subsidiary undertakings (continued)
| | | | | | | | | | | | |
| Name | Registered Office1 | Nature of business | Proportion held by
Group | |
| ICON Operational Holdings Unlimited Company | South County Business Park,
Leopardstown,
Dublin 18
Republic of Ireland
D18 X5R3 | Investment holding company | 100% | |
| Oncacare Limited | South County Business Park,
Leopardstown,
Dublin 18
Republic of Ireland
D18 X5R3 | Clinical research | 100% | |
| ICON Clinical Research Israel Ltd. | Building E, 13th Floor
4 Haharash Street
Hod Hasharon
4524402 Israel | Clinical research services | 100% | |
| Pharmaceutical Research Associates Israel Ltd. | Building E, 13th Floor
4 Haharash Street
Hod Hasharon
4524402 Israel | Clinical research services | 100% | |
| Oncacare Italy S.r.l | Via Benigno Crespi, n. 19
20159
Milano
Italy | Clinical research | 100% | |
| Pharmaceutical Research Associates Italy S.r.l. | Via Porlezza, No. 12
Milan
20123
Italy | Clinical research services | 100% | |
| ICON Clinical Research GK | 1-3 Kyutaro-machi 4-chome,
Chuo-ku,
Osaka 541-0056
Japan | Clinical research | 100% | |
| ICON Investments Limited | 22 Grenville Street
St Helier
JE4 8PX
Jersey | Investment holding company | 100%2 | |
| PRA Health Sciences Kenya Limited | LR No. 1870/1/176, ALN House,
Eldama Ravine Close,
off Eldama Ravine Road, Westlands
PO Box 764, Sarit Centre, Nairobi, Kenya 00606 | Clinical research services | 100% | |
| RPS Latvia SIA | Blaumaņa iela 22
1011 Riga,
Latvia | Clinical research services | 100% | |
| UAB RPS Lithuania | Upês street 21,
LT-08128 Vilnius,
Lithuania | Clinical research services | 100% | |
| ICON Luxembourg S.à r.l. | 61, rue de Rollingergrund
L-2440
Luxembourg | Holding and Investment Company | 100% | |
| ICON CRO Malaysia Sdn. Bhd. | Level 11
1 Sentral
Jalan Rakyat
Kuala Lumpur Sentral
50470 Kuala Lumpur
Malaysia | Clinical research services | 100% | |
| RPS Malaysia Sdn. Bhd. | Level 13, Menara 1 Sentrum
201, Jalan Tun Sambanthan
Brickfields
50470 Kuala Lumpur
Wilayah Persekutuan
Malaysia | Clinical research services | 100% | |
Notes to Consolidated Financial Statements (continued)
for the year ended 31 December 2025
30. Subsidiary undertakings (continued)
| | | | | | | | | | | | |
| Name | Registered Office1 | Nature of business | Proportion held by
Group | |
| ICON Clinical Research México, S.A. de C.V. | Avenida Insurgentes Sur 1271, Piso 17, Interior 1701, Colonia Extremadura Insurgentes, Benito Juarez, CDMX, CP 03740, Mexico | Clinical research services | 100% | |
| Pharmaceutical Research Associates Mexico S. de R.L. de C. V. | Avenida Insurgentes Sur 1271
Piso 16
Interior 1601
Colonia Extremadura Insurgentes
CP 03740
Benito Juarez
CDMX
Mexico | Clinical research services | 100% | |
| RPS Research México, S. de R.L. de C.V. | Avenida Insurgentes Sur 1271, Piso 17, Interior 1701, Colonia Extremadura Insurgentes, Benito Juarez, CDMX, CP 03740, Mexico | Holding company | 100% | |
| RPS Research Servicios, S. de R.L. de C.V. | Avenida Insurgentes Sur 1271, Piso 17, Interior 1701, Colonia Extremadura Insurgentes, Benito Juarez, CDMX, CP 03740, Mexico | Clinical research services | 100% | |
| DOCS International B.V. | Van Swietenlaan 6
9728 NZ, Groningen
The Netherlands | Clinical research services | 100% | |
| Pharmaceutical Research Associates Group B.V. | Van Swietenlaan 6
9728 NZ, Groningen
The Netherlands | Clinical research services | 100% | |
| PRA International Operations B.V. | Van Swietenlaan 6
9728 NZ, Groningen
The Netherlands | Clinical research services | 100% | |
| ReSearch Pharmaceutical Services Netherlands B.V. | Eduard van Beinumstraat 28,
2 Amsterdam Tower, 12e verdieping, 1077CZ
Amsterdam, The Netherlands | Clinical research services | 100% | |
| ICON Clinical Research (New Zealand) Limited | Anthony Harper
Level 9, Anthony Harper Tower
62 Worcester Boulevard
Christchurch
8140 NZ
New Zealand | Clinical research services | 100% | |
| Pharmaceutical Research Associates New Zealand Limited | Anthony Harper
Level 9, Anthony Harper Tower
62 Worcester Boulevard
Christchurch
8140 NZ
New Zealand | Clinical research services | 100% | |
| RPS Research Norway AS | c/o EconPartner AS
Dronning Mauds gate 15
0250 Oslo, Norway | Clinical research services | 100% | |
| RPS Panama Inc. | Urbanización Nuevo Reparto el Carmen No. 58
Calle Primera, Edificio Moreno & Moreno. Local Planta Baja,
Distrito de Panamá, Panamá | Clinical research services | 100% | |
| ICON Clinical Research Perú S.A. | Av. Paseo de la República 5895
Oficina 606
Miraflores
Lima 18
Perú | Clinical research services | 100% | |
| RPS Perú S.A.C. | Av. Paseo de la República 5895
Oficina 606
Miraflores
Lima 18
Perú | Clinical research services | 100% | |
Notes to Consolidated Financial Statements (continued)
for the year ended 31 December 2025
30. Subsidiary undertakings (continued)
| | | | | | | | | | | | |
| Name | Registered Office1 | Nature of business | Proportion held by
Group | |
| ICON Clinical Research Services Philippines, Inc. | 24th Floor Salcedo Towers,
169 H.V. Dela Costa Street,
Salcedo Village,
Makati City,
Philippines 1227 | Clinical research services | 100% | |
| RPS Research Philippines, Inc. | 24th Floor Salcedo Towers,
169 H.V. Dela Costa Street,
Salcedo Village,
Makati City,
Philippines 1227 | Clinical research services | 100% | |
| Curandus Sp z o.o. | ul. Prosta 68, 00-838 Warszawa, Poland | Clinical research services | 100% | |
| ICON Clinical Research Poland Sp z o.o. | Proximo 1
ul. Prosta 68
Warsaw
Poland | Clinical research | 100% | |
| KCR Placement Sp z o.o. | ul. Prosta 68, 00-838 Warszawa, Poland | Clinical research services | 100% | |
| KCR S.A. | ul. Prosta 68, 00-838 Warszawa, Poland | Clinical research services | 100% | |
| Pharmaceutical Research Associates Sp. z o.o. | Proximo 1
ul. Prosta 68
Warsaw
Poland | Clinical research services | 100% | |
| Symphony Clinical Research Sp z.o.o. | ul. Potokowa 26
80-283
Gdansk
Poland | Clinical research | 100% | |
| PRA International Portugal, Unipessoal, Lda. | Av. da Republica, 50-10
1069-211,
Lisboa,
Portugal | Clinical research services | 100% | |
| Research Pharmaceutical Services Puerto Rico, Inc. | 257 Calle Tetuan
2nd Floor
San Juan
00901
Puerto Rico | Clinical research services | 100% | |
| ICON Clinical Research S.R.L. | 8th Floor,
246c Caleca Floresca, Sector 1,
Bucharest 14476
Romania | Clinical research services | 100% | |
| Pharmaceutical Research Associates Romania S.R.L. | 8th Floor, Sky Tower
246c Caleca Floresca
Bucharest 14476
Romania | Clinical research services | 100% | |
| ICON Clinical Research (Rus) LLC | Premises 2/4, 9 Zemlyanoy Val,
Moscow, 105064,
Russian Federation | Clinical research services | 100% | |
| Joint Stock Company IMP Logistics | 8, Energetikov str, v. Lesnoy Gorodok Odintsovsky city disctrict
Moscow region Russia 143080 | Clinical research services | 100% | |
| KCR LLC | Premises 2/4, 9 Zemlyanoy Val,
Moscow, 105064,
Russian Federation | Clinical research services | 100% | |
| ICON Clinical doo Beograd | 4th Floor,
Bulevar Zorana Djindjica 64a,
11070 Belgrade,
Serbia | Clinical research services | 100% | |
| ICON Clinical Research doo Beograd | 4th Floor,
Bulevar Zorana Djindjica 64a,
11070 Belgrade,
Serbia | Clinical research | 100% | |
Notes to Consolidated Financial Statements (continued)
for the year ended 31 December 2025
30. Subsidiary undertakings (continued)
| | | | | | | | | | | | |
| Name | Registered Office1 | Nature of business | Proportion held by
Group | |
| ICON Clinical Research (Pte) Limited | 30 Loyang Way
#02/12
Loyang Industrial Estate
508769
Singapore | Clinical research services | 100% | |
| Mapi Life Sciences Singapore Pte. Ltd. | 30 Loyang Way
#02/12
Loyang Industrial Estate
508769
Singapore | Dormant | 100% | |
| Pharmaceutical Research Associates Singapore Pte. Ltd. | 30 Loyang Way
#02/12
Loyang Industrial Estate
508769
Singapore | Clinical research services | 100% | |
| ICON Clinical Research Slovakia, s.r.o. | Karadžičova 2 Bratislava -Old Town District
Slovenská republika, 81109,
Slovakia | Clinical research services | 100% | |
| KCR s.r.o. | Jégého 8
Bratislava 821 08
Slovakia | Clinical research services | 100% | |
| Pharmaceutical Research Associates SK s.r.o. | Karadžičova 2 Bratislava -Old Town District
Slovenská republika, 81109,
Slovakia | Clinical research services | 100% | |
| Accellacare South Africa (PTY) LTD | Block 29 Second Floor
The Highlands Estate
The Woodlands
Woodlands Drive
Woodmead, Gauteng
2191
Johannesburg
South Africa | Clinical research services | 100% | |
| PRA Pharmaceutical S A (Proprietary) Limited | 2nd Floor Building 29 Highlands Estate
Woodlands Office Park
20 Woodlands Drive Woodmead
Gauteng 2191
South Africa | Clinical research services | 100% | |
| RPS Research South Africa (Proprietary) Limited | 15 Greenwich Grove
Station Road
Ronderbosch
Western Cape
7700
South Africa | Clinical research | 100% | |
| ICON Clinical Research Korea Limited | 142 Taeheran-ro
Gangnam-gu,
18th Floor (Yeoksam-dong, Capital Tower)
Seoul
Republic of Korea
| Clinical research | 100% | |
| Mapi Korea Yuhan Hoesa/ Mapi Korea LLC (in Liquidation) | 16th Floor
396 Seocho-daero
Seocho-gu
Seoul 06619
Republic of Korea | Dormant | 100% | |
| Pharmaceutical Research Associates Korea Limited | 142 Taeheran-ro
Gangnam-gu,
18th Floor (Yeoksam-dong, Capital Tower)
Seoul
Republic of Korea | Clinical research services | 100% | |
| Accellacare España S.L. | Calle Marques de Valdavia 103
Portal 5
28100 Alcobendas
Madrid
Spain | Clinical research services | 100% | |
Notes to Consolidated Financial Statements (continued)
for the year ended 31 December 2025
30. Subsidiary undertakings (continued)
| | | | | | | | | | | | |
| Name | Registered Office1 | Nature of business | Proportion held by
Group | |
| ICON Clinical Research España, S.L. | Calle Josep Pla
Numero 2, Torre Diagonal Mar
Piso 11, Modulo 1
Barcelona
Spain | Clinical research services | 100% | |
| KCR CRO, S.L.U. | Principe de Vergara 112,
Fourth Floor,
28002 Madrid,
Spain | Clinical research services | 100% | |
| Oncacare (Spain), S.L. | Calle Josep Pla, Numero 2,
Torre Diagonal Mar,
Piso 11, Modulo 1,
Barcelona, Spain | Clinical research | 100% | |
| Pharmaceutical Research Associates España, S.A.U. | Avenida de Europa, 19
Edificio 1, 2a Planta
Pozuelo de Alarcon (Madrid)
Spain 28224 | Clinical research services | 100% | |
| RPS ReSearch Ibérica, S.L.U. | Avenida de Europa, 19
Edificio 1, 2a Planta
Pozuelo de Alarcon (Madrid)
Spain 28224 | Clinical research services | 100% | |
| RPS Spain, S.L. | Avenida de Europa, 19
Edificio 1, 2a Planta
Pozuelo de Alarcon (Madrid)
Spain 28224 | Clinical research services | 100% | |
| DOCS International Sweden AB | c/o HLB Revisorsgruppen i Malmö AB Slottsgatan 20, 211 33 Malmö, Sweden | Clinical research services | 100% | |
| PRA International Sweden AB | c/o HLB Revisorsgruppen i Malmö AB Slottsgatan 20, 211 33 Malmö, Sweden | Clinical research services | 100% | |
| DOCS International Switzerland GmbH | c/o Experfina AG
Picassoplatz 8
4052 Basel
Switzerland | Clinical research services | 100% | |
| ICON Clinical Research (Switzerland) GmbH | c/o Experfina AG
Picassoplatz 8
4052 Basel
Switzerland | Clinical research services | 100% | |
| PRA Switzerland AG | Lange Gasse 15
Basel 4052
Switzerland | Clinical research services | 100% | |
| ICON Clinical Research Taiwan Limited | 5th Floor No. 2, Sec 5
Xinyi Road
Xinyi District
Taipei
Taiwan | Clinical research services | 100% | |
| Pharmaceutical Research Associates Taiwan, Inc. | Aurora Building, 5th Floor
No. 2, Sec 5,
Xinyi Road,
Xinyi District,
Taipei,
Taiwan | Clinical research services | 100% | |
| ICON Clinical Research (Thailand) Limited | 27th Floor, Tower 1, Empire Tower, 1 South Sathorn Rd., Yannawa Sub-District, Sathorn District, Bangkok 10120 Thailand | Clinical research services | 100% | |
| RPS Research (Thailand) Co., Ltd. | 27th Floor, Tower 1, Empire Tower, 1 South Sathorn Rd., Yannawa Sub-District, Sathorn District, Bangkok 10120 Thailand | Clinical research services | 100% | |
| ICON Ankara Klinik Arastirma Dis Ticaret Anonim Sirketi | Söğütözü mah.
Eskişehir Yolu Cad. 2176. SK No:9
Posta Kodu:06510
Çankaya Ankara
Turkiye | Clinical research services | 100% | |
Notes to Consolidated Financial Statements (continued)
for the year ended 31 December 2025
30. Subsidiary undertakings (continued)
| | | | | | | | | | | | |
| Name | Registered Office1 | Nature of business | Proportion held by
Group | |
| Pra Turkey Sağlik Araştirma Ve Geliştirme Limited Şirketi | Söğütözü Mah.
2176 Cad. No: 9 İç Kapi No: 2
Çankaya / Ankara,
Turkey | Clinical research services | 100% | |
| DOCS Ukraine LLC | 4th Floor,
St. Poleva 24,
Kiev,
Ukraine, 03056 | Clinical research services | 100% | |
| ICON Clinical Research LLC | 4th Floor,
St. Poleva 24,
Kiev,
Ukraine, 03056 | Clinical research services | 100% | |
| IMP-Logistics Ukraine LLC | 8,Viskozna
st. Kyiv
Ukraine 02094 | Logistics | 100% | |
| KCR Ukraine LLC | 7 Rusanovskii blvd.,
02154 Kiev,
Ukraine | Clinical research services | 100% | |
| Pharmaceutical Research Associates Ukraine LLC | 4th Floor,
St. Poleva 24,
Kiev,
Ukraine, 03056 | Clinical research services | 100% | |
| Accellacare UK Limited | 3rd Floor, North & South Wings, 100 Longwater Avenue, Green Park, Reading, Berkshire, RG2 6GP, United Kingdom | Clinical research services | 100% | |
| Aptiv Solutions (UK) Ltd | 3rd Floor, North & South Wings, 100 Longwater Avenue, Green Park, Reading, Berkshire, RG2 6GP, United Kingdom | Dormant | 100% | |
| DOCS International UK Limited | 3rd Floor, North & South Wings, 100 Longwater Avenue, Green Park, Reading, Berkshire, RG2 6GP, United Kingdom | Clinical research services | 100% | |
| ICON (LR) Limited | 3rd Floor, North & South Wings, 100 Longwater Avenue, Green Park, Reading, Berkshire, RG2 6GP, United Kingdom | Clinical research services | 100% | |
| ICON Clinical (UK) Limited | 3rd Floor, North & South Wings, 100 Longwater Avenue, Green Park, Reading, Berkshire, RG2 6GP, United Kingdom | Clinical research services | 100% | |
| ICON Clinical Research (U.K.) Limited | 3rd Floor, North & South Wings, 100 Longwater Avenue, Green Park, Reading, Berkshire, RG2 6GP, United Kingdom | Clinical research services | 100% | |
| ICON Clinical Research (U.K.) No. 2 Limited | 3rd Floor, North & South Wings, 100 Longwater Avenue, Green Park, Reading, Berkshire, RG2 6GP, United Kingdom | Clinical research services | 100% | |
| ICON Clinical Research (U.K.) No. 3 Limited | 3rd Floor, North & South Wings, 100 Longwater Avenue, Green Park, Reading, Berkshire, RG2 6GP, United Kingdom | Holding Company | 100% | |
| ICON Clinical Research (U.K.) No. 5 Limited | 3rd Floor, North & South Wings, 100 Longwater Avenue, Green Park, Reading, Berkshire, RG2 6GP, United Kingdom | Dormant | 100% | |
| ICON Clinical Research (U.K.) No. 6 Limited | 3rd Floor, North & South Wings, 100 Longwater Avenue, Green Park, Reading, Berkshire, RG2 6GP, United Kingdom | Dormant | 100% | |
| ICON Clinical Research Holdings (U.K.) Limited | 3rd Floor, North & South Wings, 100 Longwater Avenue, Green Park, Reading, Berkshire, RG2 6GP, United Kingdom | Investment holding company | 100% | |
| ICON Development Solutions Limited | 3rd Floor, North & South Wings, 100 Longwater Avenue, Green Park, Reading, Berkshire, RG2 6GP, United Kingdom | Clinical research services | 100% | |
| ICON Investments (UK) Ltd | 3rd Floor, North & South Wings, 100 Longwater Avenue, Green Park, Reading, Berkshire, RG2 6GP, United Kingdom | Dormant | 100%2 | |
Notes to Consolidated Financial Statements (continued)
for the year ended 31 December 2025
30. Subsidiary undertakings (continued)
| | | | | | | | | | | | |
| Name | Registered Office1 | Nature of business | Proportion held by
Group | |
| IMP Logistics UK Limited | 3rd Floor, North & South Wings, 100 Longwater Avenue, Green Park, Reading, Berkshire, RG2 6GP, United Kingdom | Clinical research services | 100% | |
| KCR CRO Ltd. | 3rd Floor Waverley House,
7-12 Noel Street,
London, United Kingdom W1F 8GQ | Clinical research services | 100% | |
| Medeval Group Limited | 3rd Floor, North & South Wings, 100 Longwater Avenue, Green Park, Reading, Berkshire, RG2 6GP, United Kingdom | Dormant | 100% | |
| OncaCare (U.K.) Limited | 3rd Floor, North & South Wings, 100 Longwater Avenue, Green Park, Reading, Berkshire, RG2 6GP, United Kingdom | Dormant | 100% | |
| Sterling Synergy Systems Limited | 3rd Floor, North & South Wings, 100 Longwater Avenue, Green Park, Reading, Berkshire, RG2 6GP, United Kingdom | Holding company | 100% | |
| VSK (Kenilworth) Limited | 3rd Floor, North & South Wings, 100 Longwater Avenue, Green Park, Reading, Berkshire, RG2 6GP, United Kingdom | Holding Company | 100% | |
| RPS Global S.A. | Plaza Cagancha 1145,
4th Floor
Montevideo,
Uruguay 11100 | Clinical research services | 100% | |
| RPS Latin America S.A | Plaza Cagancha 1145,
4th Floor
Montevideo,
Uruguay 11100 | Clinical research services | 100% | |
| KCR U.S., Inc. | 30 Rowes Wharf, Suite 430,
Boston, MA 02110,
United States | Clinical research services | 100% | |
| ICON Early Phase Services, LLC | 8307 Gault Lane,
San Antonio,
TX 78209-1015
United States | Clinical research services | 100% | |
| ClinStar LLC | 4131 Parklake Avenue
Suite 600
Raleigh, NC 27612,
United States | Clinical research services | 100% | |
| Nextrials, Inc. | 731 Arbor Way,
Suite 100
Blue Bell, PA 19422,
United States | Clinical research services | 100% | |
| Pharmaceutical Research Associates CIS, LLC | 4131 Parklake Avenue
Suite 600
Raleigh, NC 27612
United States | Clinical research services | 100% | |
| Pharmaceutical Research Associates Eastern Europe, LLC | 4131 Parklake Avenue
Suite 600
Raleigh, NC 27612,
United States | Clinical research services | 100% | |
| Addplan, Inc. | 731 Arbor Way
Suite 100
Blue Bell, PA 19422,
United States | Clinical research services | 100% | |
| Beacon Bioscience, Inc | 731 Arbor Way
Suite 100
Blue Bell, PA 19422,
United States | Clinical research services | 100% | |
| C4 MedSolutions, LLC | 731 Arbor Way
Suite 100
Blue Bell, PA 19422,
United States | Clinical research services | 100% | |
Notes to Consolidated Financial Statements (continued)
for the year ended 31 December 2025
30. Subsidiary undertakings (continued)
| | | | | | | | | | | | |
| Name | Registered Office1 | Nature of business | Proportion held by
Group | |
| Care Innovations, Inc. | 731 Arbor Way
Suite 100
Blue Bell, PA 19422,
United States | Clinical research services | 100% | |
| Care Innovations, LLC | 731 Arbor Way
Suite 100
Blue Bell, PA 19422,
United States | Clinical research services | 100% | |
| CHC Group, LLC | 731 Arbor Way
Suite 100
Blue Bell, PA 19422,
United States | Holding company | 100% | |
| CRI NewCo, Inc. | 4131 Parklake Avenue
Suite 600
Raleigh, NC 27612,
United States | Clinical research services | 100% | |
| CRI Worldwide, LLC | 4131 Parklake Avenue
Suite 600
Raleigh, NC 27612,
United States | Clinical research services | 100% | |
| CRN Holdings, LLC | 731 Arbor Way
Suite 100
Blue Bell, PA 19422,
United States | Clinical research services | 100% | |
CRN North America, LLC
| 731 Arbor Way
Suite 100
Blue Bell, PA 19422,
United States | Clinical research services | 100% | |
| Global Pharmaceutical Strategies Group, LLC | 731 Arbor Way
Suite 100
Blue Bell, PA 19422,
United States
| Clinical research services | 100% | |
| ICON Clinical Investments, LLC | 731 Arbor Way
Suite 100
Blue Bell, PA 19422,
United States | Investment Company | 100% | |
| ICON Clinical Research LLC | 731 Arbor Way
Suite 100
Blue Bell, PA 19422,
United States | Clinical research services | 100% | |
| ICON Clinical Research, LP | 731 Arbor Way
Suite 100
Blue Bell, PA 19422,
United States | Clinical research services | 100% | |
| ICON Laboratory Services, Inc. | 123 Smith Street,
Farmingdale,
NY 11735
United States | Clinical research services | 100% | |
| ICON Tennessee, LLC | 731 Arbor Way
Suite 100
Blue Bell, PA 19422,
United States | Holding company | 100% | |
| ICON US Holdings Inc. | 731 Arbor Way
Suite 100
Blue Bell, PA 19422,
United States | Holding Company | 100% | |
| International Medical Technical Consultants, LLC | 4131 Parklake Avenue
Suite 600
Raleigh, NC 27612,
United States | Holding company | 100% | |
Notes to Consolidated Financial Statements (continued)
for the year ended 31 December 2025
30. Subsidiary undertakings (continued)
| | | | | | | | | | | | |
| Name | Registered Office1 | Nature of business | Proportion held by
Group | |
| MMMM Consulting, LLC | 731 Arbor Way
Suite 100
Blue Bell, PA 19422,
United States | Clinical research services | 100% | |
| MMMM Group, LLC | 731 Arbor Way
Suite 100
Blue Bell, PA 19422,
United States | Clinical research services | 100% | |
| MolecularMD Corp. | 731 Arbor Way
Suite 100
Blue Bell, PA 19422,
United States | Clinical research services | 100% | |
| Oncacare, Inc. | 731 Arbor Way
Suite 100
Blue Bell, PA 19422,
United States | Clinical research services | 100% | |
| Parallel 6, Inc. | 4131 Parklake Avenue
Suite 600
Raleigh, NC 27612,
United States | Clinical research services | 100% | |
| PRA Early Development Research, Inc. | 9755 Ridge Drive
Lenexa, Kansas 66219,
United States | Clinical research services | 100% | |
| PRA Health Sciences, Inc. | 4131 Parklake Avenue
Suite 600
Raleigh, NC 27612,
United States | Clinical research services | 100% | |
| PRA Holdings, Inc. | 4131 Parklake Avenue
Suite 600
Raleigh, NC 27612,
United States | Holding company | 100% | |
| PRA International, LLC | 4131 Parklake Avenue
Suite 600
Raleigh, NC 27612,
United States | Holding company | 100% | |
| PRA Receivables, LLC | 4131 Parklake Avenue
Suite 600
Raleigh, NC 27612,
United States | Holding company | 100% | |
| PriceSpective LLC | 731 Arbor Way
Suite 100
Blue Bell, PA 19422,
United States | Clinical research services | 100% | |
| PubsHub LLC | 731 Arbor Way
Suite 100
Blue Bell, PA 19422,
United States | Clinical research services | 100% | |
| ReSearch Pharmaceutical Services, LLC | 4131 Parklake Avenue
Suite 600
Raleigh, NC 27612,
United States | Clinical research services | 100% | |
| ReSearch Pharmaceutical Services, Inc. | 731 Arbor Way,
Suite 100
Blue Bell, PA 19422,
United States | Clinical research services | 100% | |
| Roy RPS Holdings LLC | 4131 Parklake Avenue
Suite 600
Raleigh, NC 27612,
United States | Holding company | 100% | |
| RPS Global Holdings, LLC | 4131 Parklake Avenue
Suite 600
Raleigh, NC 27612,
United States | Holding company | 100% | |
Notes to Consolidated Financial Statements (continued)
for the year ended 31 December 2025
30. Subsidiary undertakings (continued)
| | | | | | | | | | | | |
| Name | Registered Office1 | Nature of business | Proportion held by
Group | |
| RPS Parent Holding LLC | 4131 Parklake Avenue
Suite 600
Raleigh, NC 27612,
United States | Holding company | 100% | |
Source Healthcare Analytics, LLC 6 | 731 Arbor Way
Suite 100
Blue Bell, PA 19422,
United States | Clinical research services | 100% | |
| Sunset Hills, LLC | 4131 Parklake Avenue
Suite 600
Raleigh, NC 27612,
United States | Holding company | 100% | |
Symphony Health Solutions Corporation 6 | 731 Arbor Way
Suite 100
Blue Bell, PA 19422,
United States | Clinical research services | 100% | |
| Accellacare of Christie Clinic, LLC | 101 West University Avenue
Champaign
IL 61820
United States | Clinical research services | 100% | |
Clinical Resource Network, LLC
| 731 Arbor Way
Suite 100
Blue Bell, PA 19422,
United State | Clinical research services | 100% | |
| CRI International, LLC | 4131 Parklake Avenue
Suite 600
Raleigh, NC 27612,
United States | Clinical research services | 100% | |
| DOCS Global, Inc. | 731 Arbor Way
Suite 100
Blue Bell, PA 19422,
United States | Clinical research services | 100% | |
| Managed Care Strategic Solutions, L.L.C. | 731 Arbor Way
Suite 100
Blue Bell, PA 19422,
United States | Clinical research services | 100% | |
| Accellacare of Charlotte, LLC | 4131 Parklake Avenue
Suite 600
Raleigh, NC 27612,
United States | Clinical research services | 100% | |
| Accellacare of Hickory, LLC | 221 13th Ave Place NW
Suite 201
Hickory
North Carolina 28601
United States | Clinical research services | 100% | |
| Accellacare of Raleigh, LLC | 3700 Barrett Drive
Suite 310
Raleigh NC 27609
United States | Clinical research services | 100% | |
| Accellacare of Rocky Mount, LLC | 901 N. Winstead Avenue
Rocky Mount
North Carolina 27804
United States | Clinical research services | 100% | |
| Accellacare of Salisbury, LLC | 410 Mocksville Avenue
Salisbury
North Carolina 28144
United States | Clinical research services | 100% | |
| Accellacare of Wilmington, LLC | 1907 Tradd Court
Wilmington
North Carolina 28401
United States | Clinical research services | 100% | |
Notes to Consolidated Financial Statements (continued)
for the year ended 31 December 2025
30. Subsidiary undertakings (continued)
| | | | | | | | | | | | |
| Name | Registered Office1 | Nature of business | Proportion held by
Group | |
| Accellacare of Winston-Salem, LLC | 1901 S. Hawthorne Road
Suite 306
Winston-Salem
North Carolina 27103
United States | Clinical research services | 100% | |
| Accellacare US Inc. | 1901 S. Hawthorne Road
Suite 306
Winston-Salem
North Carolina 27103
United States | Clinical research services | 100% | |
| Complete Healthcare Communications LLC | 731 Arbor Way
Suite 100
Blue Bell, PA 19422,
United States | Clinical research services | 100% | |
| Complete Publication Solutions, LLC | 731 Arbor Way
Suite 100
Blue Bell, PA 19422,
United States | Clinical research services | 100% | |
| Accellacare of Charleston, LLC | 731 Arbor Way
Suite 100
Blue Bell, PA 19422,
United States | Clinical research services | 100% | |
| Accellacare of Bristol, LLC | 731 Arbor Way
Suite 100
Blue Bell, PA 19422,
United States | Clinical research services | 100% | |
| Lifetree Clinical Research, LC | 731 Arbor Way
Suite 100
Blue Bell, PA 19422,
United States | Clinical research services | 100% | |
| ICON Government and Public Health Solutions, Inc. | 731 Arbor Way
Suite 100
Blue Bell, PA 19422,
United States | Clinical research services | 100% | |
| Pharmaceutical Research Associates, Inc. | 4131 Parklake Avenue
Suite 600
Raleigh, NC 27612,
United States | Clinical research services | 100% | |
| ICON Clinical Research Vietnam LLC | Level 6 and 7, Me Linh Point Tower, No. 2 Ngo Duc Ke Street, Ben Nghe Ward, District 1, Ho Chi Minh City, Vietnam | Clinical research services | 100% | |
1 Principal office address used for U.S. entities.
2 Majority which is held directly by ICON plc.
3 Mapi Research Trust is an association, its members are ICON Subsidiary entities.
4 KCR Czech Republic a.s. liquidated on 6 January 2026.
5 Averion Europe GmbH i.L liquidated on 26 March 2026.
6 On 8 May 2026, ICON completed the disposition of Symphony Health Solutions Corporation and its subsidiary Source Healthcare Analytics, LLC.
31. Approval of financial statements
The Board of Directors approved these financial statements on 25 June 2026.
Company Statement of Financial Position
for the year ended 31 December 2025
| | | | | | | | | | | |
| Note | 31 December 2025 | 31 December 2024 |
| | $’000 | $’000 |
| ASSETS | | | |
| Non-current assets | | | |
| Property, plant and equipment | 1 | 482 | | 506 | |
| Right-of-use assets | 9 | 5,610 | | 5,550 | |
| Investment in subsidiaries | 2 | 7,125,357 | | 7,115,418 | |
| Intangible assets | | 12 | | 15 | |
| Amounts due from subsidiary undertakings | 5 | 10,852 | | 10,852 | |
| | | |
| Deferred tax asset | 3 | — | | 380 | |
| Total non-current assets | | 7,142,313 | | 7,132,721 | |
| Current assets | | | |
| Other current assets | 4 | 1,461 | | 750 | |
| Amounts due from subsidiary undertakings | 5 | 302,446 | | 220,344 | |
| | | |
| | | |
| Cash and cash equivalents | | 2,675 | | 10,485 | |
| Total current assets | | 306,582 | | 231,579 | |
| | | |
| Total assets | | 7,448,895 | | 7,364,300 | |
| | | |
| EQUITY | | | |
| Share capital | 7 | 6,305 | | 6,586 | |
| Share premium | 7 | 569,507 | | 559,804 | |
| Merger reserve | 7 | 5,656,195 | | 5,656,195 | |
| Other undenominated capital | 7 | 1,606 | | 1,304 | |
| Share-based payment reserve | 7 | 319,527 | | 270,550 | |
| Other reserve | 7 | 27,405 | | 27,405 | |
| Foreign currency reserve | 7 | (111,875) | | (113,342) | |
| Retained earnings | 7 | 939,849 | | 927,650 | |
| Total equity attributable to equity holders | | 7,408,519 | | 7,336,152 | |
| | | |
| LIABILITIES | | | |
| Non-current liabilities | | | |
| Non-current other liabilities | 6 | 5,665 | | 5,579 | |
| Deferred tax liabilities | 3 | 17 | | — | |
| Total non-current liabilities | | 5,682 | | 5,579 | |
| Current liabilities | | | |
| Accounts payable | | 1,660 | | 1,160 | |
| Amounts due to subsidiary undertakings | 5 | 556 | | 3,433 | |
| Accrued and other liabilities | 6 | 7,592 | | 7,301 | |
| Current taxes payable | | 24,886 | | 10,675 | |
| Total current liabilities | | 34,694 | | 22,569 | |
| | | |
| Total liabilities | | 40,376 | | 28,148 | |
| | | |
| Total equity and liabilities | | 7,448,895 | | 7,364,300 | |
As permitted by section 304 of the Companies Act, the Company has not presented a Company Statement of Profit and Loss. The profit for the 2025 financial year of the Company amounted to $703.9 million (2024: $425.3 million).
On behalf of the Board
| | | | | | | | |
| Barry Balfe | Rónán Murphy | |
Chief Executive Officer | Director | |
Company Statement of Changes in Equity
for the year ended 31 December 2025
| | | | | | | | | | | | | | | | | | | | | | | | | | | | | | | | |
| Number
of shares | Share
Capital | Share
Premium | Merger Reserve | Other Unde- nominated
Capital | Share
Based
Payment
Reserve | Other
Reserve | Foreign Currency Reserve | Retained
Earnings | Total Equity |
| | $’000 | $’000 | $’000 | $’000 | $’000 | $’000 | $’000 | $’000 | $’000 |
| Balance at 1 January 2025 | 80,756,860 | | 6,586 | | 559,804 | | 5,656,195 | | 1,304 | | 270,550 | | 27,405 | | (113,342) | | 927,650 | | 7,336,152 | |
| Profit for the year | — | | — | | — | | — | | — | | — | | — | | — | | 703,899 | | 703,899 | |
| Other comprehensive income | | | | | | | | | | |
| Foreign currency translation | — | | — | | — | | — | | — | | — | | — | | 1,467 | | — | | 1,467 | |
| Total other comprehensive income | — | | — | | — | | — | | — | | — | | — | | 1,467 | | — | | 1,467 | |
| Total comprehensive income for the year | — | | — | | — | | — | | — | | — | | — | | 1,467 | | 703,899 | | 705,366 | |
| Transactions with owners, recorded directly in equity | | | | | | | | | |
| Share-based payment | — | | — | | — | | — | | — | | 107,746 | | — | | — | | — | | 107,746 | |
| Exercise of share options | 86,434 | | 6 | | 9,703 | | — | | — | | — | | — | | — | | — | | 9,709 | |
| Share issue costs | — | | — | | — | | — | | — | | — | | — | | — | | (19) | | (19) | |
| Issue of restricted share units / performance share units | 228,361 | | 15 | | — | | — | | — | | — | | — | | — | | — | | 15 | |
| Repurchase of ordinary shares | (4,504,330) | | (302) | | — | | — | | 302 | | — | | — | | — | | (750,000) | | (750,000) | |
| | | | | | | | | | |
| Share repurchase costs | — | | — | | — | | — | | — | | — | | — | | — | | (450) | | (450) | |
| Transfer of exercised and expired share-based awards | — | | — | | — | | — | | — | | (58,769) | | — | | — | | 58,769 | | — | |
| Total contributions by and distributions to owners | (4,189,535) | | (281) | | 9,703 | | — | | 302 | | 48,977 | | — | | — | | (691,700) | | (632,999) | |
| | | | | | | | | | |
| | | | | | | | | | |
| Balance at 31 December 2025 | 76,567,325 | | 6,305 | | 569,507 | | 5,656,195 | | 1,606 | | 319,527 | | 27,405 | | (111,875) | | 939,849 | | 7,408,519 | |
Company Statement of Changes in Equity (continued)
for the year ended 31 December 2025
| | | | | | | | | | | | | | | | | | | | | | | | | | | | | | | | |
| Number
of shares | Share
Capital | Share
Premium | Merger Reserve | Other Unde- nominated
Capital | Share-
Based
Payment
Reserve | Other
Reserve | Foreign Currency Reserve | Retained
Earnings | Total Equity |
| | $’000 | $’000 | $’000 | $’000 | $’000 | $’000 | $’000 | $’000 | $’000 |
| Balance at 1 January 2024 | 82,495,086 | | 6,699 | | 523,646 | | 5,656,195 | | 1,162 | | 282,520 | | 27,405 | | (112,848) | | 949,128 | | 7,333,907 | |
| | | | | | | | | | |
| Profit for the year | — | | — | | — | | — | | — | | — | | — | | — | | 425,295 | | 425,295 | |
| Other comprehensive loss | | | | | | | | | | |
| Foreign currency translation | — | | — | | — | | — | | — | | — | | — | | (494) | | — | | (494) | |
| Total other comprehensive loss | — | | — | | — | | — | | — | | — | | — | | (494) | | — | | (494) | |
| Total comprehensive income for the year | — | | — | | — | | — | | — | | — | | — | | (494) | | 425,295 | | 424,801 | |
| Transactions with owners, recorded directly in equity | | | | | | | | | |
| | | | | | | | | | |
| | | | | | | | | | |
| Share-based payment | — | | — | | — | | — | | — | | 41,665 | | — | | — | | — | | 41,665 | |
| Exercise of share options | 311,040 | | 20 | | 36,158 | | — | | — | | — | | — | | — | | — | | 36,178 | |
| Share issue costs | — | | — | | — | | — | | — | | — | | — | | — | | (22) | | (22) | |
| Issue of restricted share units / performance share units | 130,433 | | 9 | | — | | — | | — | | — | | — | | — | | — | | 9 | |
| Repurchase of ordinary shares | (2,179,699) | | (142) | | — | | — | | 142 | | — | | — | | — | | (499,998) | | (499,998) | |
| Share repurchase costs | — | | — | | — | | — | | — | | — | | — | | — | | (388) | | (388) | |
| Transfer of exercised and expired share-based awards | — | | — | | — | | — | | — | | (53,635) | | — | | — | | 53,635 | | — | |
| Total contributions by and distributions to owners | (1,738,226) | | (113) | | 36,158 | | — | | 142 | | (11,970) | | — | | — | | (446,773) | | (422,556) | |
| | | | | | | | | | |
| | | | | | | | | | |
| Balance at 31 December 2024 | 80,756,860 | | 6,586 | | 559,804 | | 5,656,195 | | 1,304 | | 270,550 | | 27,405 | | (113,342) | | 927,650 | | 7,336,152 | |
Notes to Company Financial Statements
for the year ended 31 December 2025
1. Property, plant and equipment
–PLC
| | | | | | | | | | | | | | |
| Leasehold improvements | Computer equipment | Office furniture & fixtures | Total |
| $’000 | $’000 | $’000 | $’000 |
| Cost | | | | |
| At 1 January 2025 | 363 | | 166 | | 964 | | 1,493 | |
| Additions | — | — | 6 | 6 |
| Disposals | — | | (9) | | (5) | | (14) | |
| Foreign currency movement | 55 | | 24 | | 143 | | 222 | |
| At 31 December 2025 | 418 | | 181 | | 1,108 | | 1,707 | |
| | | | |
| Depreciation | | | | |
| At 1 January 2025 | 356 | | 121 | | 510 | | 987 | |
| Charge for the year | — | | 19 | | 102 | | 121 | |
| Disposals | — | | (9) | | (5) | | (14) | |
| Foreign currency movement | 54 | | 17 | | 60 | | 131 | |
| At 31 December 2025 | 410 | | 148 | | 667 | | 1,225 | |
| | | | |
| Net book value | | | | |
| At 31 December 2025 | 8 | | 33 | | 441 | | 482 | |
| | | | |
| At 31 December 2024 | 7 | | 45 | | 454 | | 506 | |
| | | | | | | | | | | | | | |
| Leasehold improvements | Computer equipment | Office furniture & fixtures | Total |
| $’000 | $’000 | $’000 | $’000 |
| Cost | | | | |
| At 1 January 2024 | 390 | | 680 | | 730 | | 1,800 | |
| Additions | — | 36 | 283 | 319 |
| Disposals | — | | (531) | | — | | (531) | |
| Foreign currency movement | (27) | | (19) | | (49) | | (95) | |
| At 31 December 2024 | 363 | | 166 | | 964 | | 1,493 | |
| | | | |
| Depreciation | | | | |
| At 1 January 2024 | 384 | | 652 | | 453 | | 1,489 | |
| Charge for the year | 1 | | 22 | | 107 | | 130 | |
| Disposals | — | | (531) | | — | | (531) | |
| Foreign currency movement | (29) | | (22) | | (50) | | (101) | |
| At 31 December 2024 | 356 | | 121 | | 510 | | 987 | |
| | | | |
| Net book value | | | | |
| At 31 December 2024 | 7 | | 45 | | 454 | | 506 | |
| | | | |
| At 31 December 2023 | 6 | | 28 | | 277 | | 311 | |
Notes to Company Financial Statements (continued)
for the year ended 31 December 2025
2. Investment in subsidiaries
| | | | | | | | | | | |
| | | Investment in Subsidiary Undertakings |
| | | $’000 |
| Cost | | | |
| At 1 January 2024 | | | 7,149,445 | |
| Additions | | | 78,199 | |
| Disposals | | | (127,375) | |
| Share-based payment | | | 36,690 | |
| Share subscription payment from subsidiary companies | | | (21,541) | |
| At 31 December 2024 | | | 7,115,418 | |
| | | |
| | | |
| | | |
| Share-based payment | | | 92,584 | |
| Share subscription payment from subsidiary companies | | | (82,645) | |
| At 31 December 2025 | | | 7,125,357 | |
On 14 March 2024, the Company subscribed for 43,000,000 Ordinary Shares of $1.00 each in the capital of the ICON Clinical Global Holdings Unlimited Company, in return for cash consideration of $43.0 million.
On 8 May 2024, the Company subscribed for 14,000,000 Ordinary Shares of $1.00 each in the capital of ICON Investments Six Designated Activity Company in return for cash consideration of $14.0 million.
On 27 August 2024, the Company transferred its interest in ICON Clinical International Limited, with a carrying value of $127.4 million, to ICON Holdings Unlimited Company in exchange for a loan note amounting to $127.4 million.
On 30 September 2024, the Company subscribed for 21,199,164 Ordinary Shares of $1.00 each in the capital of ICON Clinical Global Holdings Unlimited Company in return for cash consideration of $21.2 million.
Notes to Company Financial Statements (continued)
for the year ended 31 December 2025
3. Deferred taxation
The net deferred tax (liabilities)/asset at 31 December 2025 and 31 December 2024 was as follows:
| | | | | | | | |
| 31 December
2025 | 31 December
2024 |
| $'000 | $'000 |
| Deferred taxation (liabilities) / assets | | |
| Accrued expenses and payments on account | (32) | | 367 | |
| Property, plant and equipment | 15 | | 13 | |
| Total deferred taxation (liabilities) / assets | (17) | | 380 | |
| | | | | | | | | | | |
| 1 January 2025 | Recognised in year | 31 December
2025 |
| $'000 | $'000 | $'000 |
| Deferred taxation (liabilities) / assets | | | |
| Accrued expenses and payments on account | 367 | | (399) | | (32) | |
| Property, plant and equipment | 13 | | 2 | | 15 | |
| Total deferred taxation (liabilities) / assets | 380 | | (397) | | (17) | |
| | | | | | | | | | | |
| 1 January 2024 | Recognised in year | 31 December
2024 |
| $'000 | $'000 | $'000 |
| Deferred taxation assets | | | |
| Accrued expenses and payments on account | 387 | | (20) | | 367 | |
| Property, plant and equipment | 12 | | 1 | | 13 | |
| | | |
| Total deferred taxation assets | 399 | | (19) | | 380 | |
At 31 December 2025 and 31 December 2024 the Company had no operating loss carry forwards for income tax purposes. At 31 December 2025 the Company had an unrecognised deferred tax asset in respect of unutilised foreign tax credits carried forward of $8.3 million (2024: $7.9 million).
Notes to Company Financial Statements (continued)
for the year ended 31 December 2025
4. Other current assets
| | | | | | | | |
| 31 December
2025 | 31 December
2024 |
| $’000 | $’000 |
| Prepayments | 172 | | 192 | |
| Other receivables | 1,289 | | 558 | |
| Total | 1,461 | | 750 | |
5. Amounts due from / to subsidiary undertakings
| | | | | | | | |
| 31 December
2025 | 31 December
2024 |
| $’000 | $’000 |
| Amounts due from subsidiary undertakings - non current | 10,852 | | 10,852 | |
| Amounts due from subsidiary undertakings - current | 302,446 | | 220,344 | |
| Amounts due to subsidiary undertakings - current | (556) | | (3,433) | |
Amounts due from subsidiary undertakings within non current are interest-bearing and repayable on 1 October 2033. Amounts due from subsidiary undertakings within current are non interest-bearing and repayable on demand. All amounts fall due within one year.
Amounts due from subsidiary undertakings are initially recognised at fair value and subsequently measured at amortised cost, less any expected credit loss. An expected credit loss assessment was performed at 31 December 2025 and 31 December 2024. The expected credit loss was considered de minimis.
6. Accrued and other liabilities
| | | | | | | | |
| 31 December
2025 | 31 December
2024 |
| $’000 | $’000 |
| Non-current other liabilities | | |
| | |
| | |
| Lease liabilities | 5,665 | | 5,579 | |
| Total | 5,665 | | 5,579 | |
| | | | | | | | |
| 31 December
2025 | 31 December
2024 |
| $’000 | $’000 |
| Current liabilities | | |
| Current lease liabilities | 684 | | 574 | |
| Accruals and other liabilities | 6,908 | | 6,727 | |
| Total | 7,592 | 7,301 |
Notes to Company Financial Statements (continued)
for the year ended 31 December 2025
7. Capital and reserves
| | | | | | | | |
| 31 December
2025 | 31 December
2024 |
| $’000 | $’000 |
| Share capital | 6,305 | | 6,586 | |
| Share premium | 569,507 | | 559,804 | |
| Merger reserve | 5,656,195 | | 5,656,195 | |
| Other undenominated capital | 1,606 | | 1,304 | |
| Share-based payment reserve | 319,527 | | 270,550 | |
| Other reserve | 27,405 | | 27,405 | |
| Foreign currency reserve | (111,875) | | (113,342) | |
| Retained earnings | 939,849 | | 927,650 | |
| Total | 7,408,519 | | 7,336,152 | |
Share Capital
Details are included in Note 22 Share capital in Notes to the Consolidated Financial Statements.
Merger reserve
On 1 July 2021, the Company completed the acquisition of PRA by means of a merger whereby Indigo Merger Sub, Inc., a Delaware corporation and subsidiary of the Company, merged with and into PRA, the parent of the PRA Health Sciences Group. Upon completion of the Merger, pursuant to the terms of the Merger Agreement, PRA became a wholly owned subsidiary of the Company. The transaction resulted in the issuance of 27,372,427 shares to the former stockholders of PRA. The Company issued these shares at the prevailing market price and recognised the premium of $5,656.2 million on issuance of these shares as a merger reserve as required under Irish Company Law.
Other undenominated capital
Other undenominated capital comprises the nominal value of shares repurchased and cancelled by the Company and transferred from share capital to other undenominated capital as required under Irish Company Law. During the year ended 31 December 2025, 4,504,330 ordinary shares were repurchased and cancelled by the Company (2024: 2,179,699).
Share-based payment reserve
The share-based payment reserve is used to account for share-based payments.
Other reserves
In 2005 the Company recognised a capital contribution of $6.1 million being the fair value of outstanding ordinary shares transferred to Mr Peter Gray, formerly Vice Chair of the Board of Directors and formerly Chief Executive Officer, by founding Directors, Dr. John Climax and Dr. Ronan Lambe.
On 1 July 2023, ICON plc transferred the trade of its Italian branch to ICON Holdings Clinical Research International Limited in exchange for the allotment and issuance of 9,214 ordinary shares of €1.00 each in the share capital of ICON Holdings Clinical Research International Limited, issued at a premium of €2,086.85 per share. The disposal of the trade has resulted in a gain of $13.5 million being recorded in Other Reserve in the Company Statement of Changes in Equity.
On 1 October 2023, ICON plc transferred its interest in ICON Japan, with a carrying value of $3.1 million, to PRA Health Sciences KK in exchange for a loan note of amounting to $10.9 million. The transaction resulted in the Company recording a gain on disposal of $7.8 million in Other Reserve in the Company Statement of Changes in Equity.
Foreign currency reserve
The currency reserve comprises all foreign exchange differences arising from the translation of the financial statements of foreign currency denominated operations of the Company. As at 31 December 2025, this amounted to a cumulative loss of $111.9 million (2024: $113.3 million).
Retained earnings
During the year ended 31 December 2025, 4,504,330 (2024: 2,179,699) ordinary shares were redeemed by the Company under this buyback programme for a total consideration of $750.0 million (2024:$500.0 million) which was recorded within retained earnings.
Notes to Company Financial Statements (continued)
for the year ended 31 December 2025
8. Related parties
Directors and Executive Officers of the Parent Company are the same as those for the Group. For information on transactions with Directors and Executive Officers see Note 28 Related parties in Notes to the Consolidated Financial Statements, and for information on Directors’ remuneration see Note 10 Payroll and related benefits in Notes to the Consolidated Financial Statements.
9. Leases
Right-of-use assets
The Company has the following right-of-use assets:
| | | | | | |
| | Premises |
| | $'000 |
| Depreciation charge for 2025 | | 702 | |
| Right-of-use assets at 31 December 2025 | | 5,610 | |
| Depreciation charge for 2024 | | 615 | |
| Right-of-use assets at 31 December 2024 | | 5,550 | |
Additions to right-of-use assets during 2025 were $nil million (2024: $6.38 million).
The weighted average remaining lease term at 31 December 2025 was 8.14 years (2024: 9.15 years).
Lease liabilities
Future minimum lease payments under non-cancellable leases as of 31 December 2025 were as follows:
| | | | | |
| Minimum rental payments |
| $'000 |
| Due within 1 year | 929 | |
| Due between 1 and 2 years | 929 | |
| Due between 2 and 5 years | 2,786 | |
| Due after 5 years | 2,874 | |
| Total future minimum lease payments | 7,518 | |
| Lease imputed interest | (1,169) | |
| Total | 6,349 | |
Lease liabilities are presented as current and non-current. Current lease liabilities of $0.7 million have been included in accrued and other liabilities as at 31 December 2025 (2024: $0.6 million).
Amounts recognised in profit or loss
The following amounts were recognised in profit and loss:
| | | | | | | | |
| 31 December
2025 | 31 December
2024 |
| $'000 | $'000 |
| Depreciation of right-of-use assets | 702 | | 615 | |
| Interest on lease liabilities | 282 | | 183 | |
The depreciation of right-of-use assets is recorded within other operating expenses and interest on lease liabilities is recorded within finance costs.
During the year ended 31 December 2025 and the year ended 31 December 2024, the Company did not incur any costs related to variable lease payments.
Notes to Company Financial Statements (continued)
for the year ended 31 December 2025
10. Litigation
Other than as described below, we do not expect any current litigation to have a materially adverse effect on our financial condition or results of operations. However, from time to time, we may become involved in various lawsuits and legal proceedings which arise in the ordinary course of business. Litigation is subject to inherent uncertainties, and an adverse result in these or other matters may arise from time to time that may harm our business, and one or more unfavourable outcomes could adversely affect us for the period in which they are resolved. In addition, regardless of their merits or their ultimate outcomes, lawsuits and legal proceedings are costly, divert management attention, and may adversely affect our reputation, even if they are resolved in our favour.
The Company, its former Chief Executive Officer, and its former Chief Financial Officer were named as defendants in two class action lawsuits involving similar claims, filed in the United States District Court for the Eastern District of New York on 10 February 2025 (Shing v. ICON plc, et al.) and 2 April 2025 (Police and Fire Retirement System of the City of Detroit v. ICON plc), respectively, alleging that defendants made misleading statements regarding the Company’s financial performance and future business prospects in violation of Sections 10(b) and 20(a) of the Securities Exchange Act of 1934. The two cases have been consolidated and are proceeding under the caption In re ICON plc Securities Litigation, No. 2:25-cv-00763 (the “Putative Class Action”). Lead plaintiffs and lead counsel for the putative class were appointed on 10 June 2025. On 12 September 2025, the lead plaintiffs filed an amended complaint that names the Company’s current Chief Executive Officer in addition to the original defendants.
On 12 November 2025, the defendants filed a motion to dismiss the amended complaint. Lead plaintiffs filed an opposition on 13 January 2026. On 13 February 2026, the parties filed a stipulation that the lead plaintiffs may file a further amended complaint within 30 days after the Company publicly reports full-year 2025 results. Given the preliminary stage of the litigation and inherent uncertainties in light of the forthcoming further amended complaint, we are unable at this time to form a view as to whether an adverse outcome is either probable or remote or to estimate the amount or range of potential loss in the event of an adverse outcome.
11. Financial instruments
The Company is exposed to various financial risks in the normal course of the business. The Company’s financial instruments typically comprise cash and accounts payable. The main purpose of these financial instruments is to provide finance for the Company’s operations. The main risks arising from the Company’s financial instruments are credit risk, liquidity risk, foreign exchange risk and interest rate risk.
Credit risk
Intercompany loans receivable are initially recognised at fair value. These are subsequently measured at amortised cost, less any expected credit loss. An expected credit loss assessment was performed in respect of the receivables at 31 December 2025 and 31 December 2024. The expected credit loss was considered de minimis.
Credit risk is the risk of financial loss to the Company if a customer or counterparty to a financial instrument fails to meet its contractual obligations. Credit risk in respect of the Company arises on balances due from group companies. As the Group generates significant free cash flow; and the subsidiary entities that the Company trades with are in a position to make payments as and when they fall due, the Company has assessed the exposure to credit risk as low.
The maximum exposure of credit risk pertaining to customers is the carrying value of amounts due from subsidiary undertakings.
Liquidity risk
Liquidity risk is the risk that the Company will not be able to meet its financial obligations as they fall due. The Company’s liquidity risk arises from the repayment of short-term debt and other obligations as they fall due. The Company minimises liquidity risk by ensuring that sufficient cash balances and committed bank lines of credit are available to meet its obligations as they fall due. The Company’s bank credit lines and facilities are the same as the Group. Details of the Group’s bank credit lines and facilities are set out in Note 21 Bank credit lines and loan facilities in Notes to the Consolidated Financial Statements.
Notes to Company Financial Statements (continued)
for the year ended 31 December 2025
11. Financial instruments (continued)
The following table sets out details of the maturity of the Company’s financial liabilities into the relevant maturity groupings based on the remaining period from the financial year end date to the contractual maturity date:
Year ended 31 December 2025:
| | | | | | | | | | | | | | | | | | | | |
| Carrying
Amount
$’000 | Contractual Cashflows
$’000 | Under 1 year
$’000 | 1 to 2
years
$’000 | 2 to 5
years
$’000 | More than
5 years
$’000 |
| | | | | | |
| Accounts payable | 1,660 | | 1,660 | | 1,660 | | — | | — | | — | |
| Lease liability | 6,349 | | 7,518 | | 929 | | 929 | | 2,786 | | 2,874 | |
| Accruals and other liabilities | 6,908 | | 6,908 | | 6,908 | | — | | — | | — | |
| 14,917 | | 16,086 | | 9,497 | | 929 | | 2,786 | | 2,874 | |
Year ended 31 December 2024:
| | | | | | | | | | | | | | | | | | | | |
| Carrying
Amount
$’000 | Contractual Cashflows
$’000 | Under 1 year
$’000 | 1 to 2
years
$’000 | 2 to 5
years
$’000 | More than
5 years
$’000 |
| | | | | | |
| Accounts payable | 1,160 | | 1,160 | | 1,160 | | — | | — | | — | |
| Lease liability | 6,153 | | 7,446 | | 819 | | 819 | | 2,456 | | 3,352 | |
| Accruals and other liabilities | 6,727 | | 6,727 | | 6,727 | | — | | — | | — | |
| 14,040 | | 15,333 | | 8,706 | | 819 | | 2,456 | | 3,352 | |
Foreign currency risk
The Company is subject to a number of foreign currency risks given the global nature of its operations. The principal foreign currency risks to which the business is subject to includes both foreign currency translation risk and foreign currency transaction risk.
While the functional currency of the Company is USD, the functional currency of the branches is Euro. As a consequence, the results, when translated into U.S. dollars, could be affected by fluctuations in exchange rates against the U.S. dollar and the currencies of those operations.
The Company is also subject to foreign currency transaction exposures as the currency in which income is received can be different from the currencies in which costs relating are incurred.
Interest rate risk
The Company finances its operations through a mixture of shareholders’ funds, borrowings and working capital. The Company borrows in required currencies at both fixed and floating interest rates. In general the Company borrows at floating rates of interest but may borrow at fixed rates depending on rates available having regard to current market rates and future trends. The Company has no external borrowings.
Fair values
Financial instruments are measured in the Statement of Financial Position at fair value using a fair value hierarchy of valuation inputs. The hierarchy prioritises the inputs into three levels based on the extent to which inputs used in measuring fair value are observable in the market. Each fair value measurement is reported in one of three levels, which is determined by the lowest level input that is significant to the fair value measurement in its entirety.
The carrying values of amounts due from subsidiary undertakings, cash and cash equivalents, other current assets, accounts payable and accruals and other liabilities are carried at amortised cost and are estimated to approximate fair values due to the short-term nature of these balances.
Amounts due from subsidiary undertakings within non current are interest-bearing and repayable on 1 October 2033, while the Amounts due from subsidiary undertakings within current are non-interest-bearing and repayable on demand. The carrying amount of both interest-bearing and non-interest-bearing balances are deemed to materially approximate fair value.
Each category of asset and liability has remained within the same level of hierarchy as the prior year as there has been no change in the extent to which the inputs used in measuring fair value are or are not observable within the market.
Notes to Company Financial Statements (continued)
for the year ended 31 December 2025
12. Employee Information
The average number of employees, including executive Directors, employed by the Company for the year ended 31 December 2025 and 31 December 2024 were as follows:
| | | | | | | | |
| 31 December
2025 | 31 December
2024 |
| | |
| Administration | 23 | | 25 | |
| Clinical Research | 410 | | 459 | |
| 433 | | 484 | |
13. Subsequent events
The Company has evaluated subsequent events from 31 December 2025 through 25 June 2026, the date at which the consolidated financial statements were available to be issued.
Bridge Secured Credit Facility
On 27 April 2026, ICON Global Treasury Unlimited Company (the “Bridge Facility Borrower”) entered into a bridge facility credit agreement for an aggregate principal amount of $500 million (the "Bridge Secured Credit Facility"). The proceeds of the Bridge Secured Credit Facility may be used to discharge and repay in full $500 million aggregate principal amount of 2.875% Senior Secured Notes (the “2026 Notes”) issued by a subsidiary of the Group in July 2021. The Bridge Secured Credit Facility will mature on 26 April 2027.
The borrowings under the Bridge Secured Credit Facility do not amortise and are due at final maturity. The interest rate margin applicable to borrowings under the Bridge Secured Credit Facility is USD Term SOFR plus a fixed calendared applicable margin ranging from 1.00% to 2.25%. At 25 June 2026 , the applicable margin was 1.00%.
The Bridge Facility Borrower’s obligations under the Bridge Secured Credit Facility are guaranteed by ICON and the subsidiary guarantors party thereto. The Bridge Secured Credit Facility is secured by a lien on substantially all of the assets (subject to certain exceptions) of ICON, the Bridge Facility Borrower and each of the subsidiary guarantors, and the Bridge Secured Credit Facility will have a first-priority lien on such assets which will rank pari passu with the lien securing ICON’s other first lien secured indebtedness and is subject to other permitted liens. The Company is permitted to make voluntary prepayments under the Bridge Secured Credit Facility without premium or penalty (subject to customary break funding payments).
The Bridge Secured Credit Facility contains customary negative covenants, including, but not limited to, restrictions on the ability of ICON and its subsidiaries to merge and consolidate with other companies, incur indebtedness, grant liens or security interests on assets, pay dividends or make other restricted payments, sell or otherwise transfer assets or enter into transactions with affiliates.
The Bridge Secured Credit Facility provides that, upon the occurrence of certain events of default, the obligations under the credit agreement may be accelerated. Such events of default will include payment defaults to the lenders thereunder, material inaccuracies of representations and warranties, covenant defaults, cross-defaults to other material indebtedness, voluntary and involuntary bankruptcy proceedings, material monetary judgments, material pension-plan events, change of control and other customary events of default.
Disposal of Symphony Health Solutions Corporation
On 8 May 2026, ICON completed the disposition of Symphony Health Solutions Corporation (“Symphony”) pursuant to a merger agreement, by and among HealthVerity, Inc. (“HealthVerity”), Symphony, Pharmaceutical Research Associates, Inc. and HealthVerity Merger Sub, Inc. (“HV Merger Sub”), a wholly owned subsidiary of HealthVerity. Pursuant to the merger agreement, HV Merger Sub merged with and into Symphony, with Symphony surviving the merger as a wholly owned subsidiary of HealthVerity. The consideration payable by HealthVerity in connection with the merger consisted of shares of stock in HealthVerity, subject to customary adjustments as set forth in the merger agreement. In connection with the merger, ICON also purchased additional shares of stock in HealthVerity for an aggregate purchase price of $37.5 million. As a result, ICON holds a minority equity interest in HealthVerity. As of 8 May 2026, the Company’s investment in HealthVerity has been recorded at a carrying value of $nil.
Notes to Company Financial Statements (continued)
for the year ended 31 December 2025
13. Subsequent events (continued)
Waivers to the debt agreements
On 27 April 2026, the parties (limited to the borrowers and revolving lenders under the senior secured revolving loan facility only) to the Credit Agreement (as defined below) entered into a Consent to Credit Agreement pursuant to which such revolving lenders agreed to provide a limited and temporary waiver of the requirement to deliver certain financial statements under the senior secured revolving credit facility in connection with the borrowings thereunder. The waiver applied solely for the specified consent period ending 31 May 2026.
On 18 May 2026, the Company launched a consent and waiver to the Credit Agreement (applicable to all facilities thereunder) in order to request that the requisite lenders thereunder agree to (i) waive the technical default caused by the Company’s late delivery of its Annual Report on Form 20-F for the fiscal year ending 31 December 2025, (ii) provide an extension of the delivery of the Company’s Annual Report on Form 20-F for the fiscal year ending 31 December 2025 to 16 July 2026 and (iii) provide an extension of the delivery of the Company’s quarterly financial statements for the fiscal quarter ending 31 March 2026 to 31 July 2026. Consent to the waiver was received on 22 May 2026.
The Company filed its Annual Report on Form 20-F for the year ended 31 December 2025 on 27 May 2026. On 29 May 2026, the Annual Report on Form 20-F that was subject to the 27 April 2026 and 18 May 2026 waivers was delivered to the requisite parties under the Credit Agreement.
The Company has determined that there are no other items to disclose.
14. Approval of financial statements
The Board of Directors approved the Company Financial Statements on 25 June 2026.
Reconciliation from IFRS to US Accounting Policies (Unaudited)
The Consolidated Financial Statements set out on pages 40 to 137 have been prepared in accordance with International Financial Reporting Standards (“IFRS”), as adopted by the European Union (“EU IFRS”), which differ in certain significant respects from generally accepted accounting principles applicable in the U.S. (“U.S. GAAP”). The material differences as they apply to the Consolidated Financial Statements are as follows:
(a) Financial statement format
The format of the financial statements and certain note disclosures differ under U.S. GAAP from those under EU IFRS. The Group prepared a U.S. Securities and Exchange Commission Annual Report on Form 20-F Report which was made available to all shareholders in May 2026. The financial statements included in such Annual Report on Form 20-F are prepared in accordance with U.S. GAAP.
(b) Merger with PRAI
The Group accounts for business combinations under EU IFRS in accordance with the IFRS 3 Business Combinations. As permitted by IFRS 1 First Time Adoption of International Financial Reporting Standards the Group has only restated business combinations from 1 June 2001 onwards. Business combinations prior to this date have not been restated. In addition, goodwill has no longer been amortised since 1 June 2001, but rather is tested annually for impairment. U.S. GAAP adopts different criteria to EU IFRS for establishing the method of accounting to be adopted for business combinations. On 28 January 2000, the Group completed a transaction with Pacific Research Associates Inc. (“PRAI”), a Group specialising in data management, statistical analysis and medical and regulatory consulting based in San Francisco, USA. The merger with PRAI was accounted for using acquisition accounting principles in accordance with EU IFRS whilst U.S. GAAP required that the merger be accounted for using the pooling-of-interest method of accounting. U.S. GAAP pooling-of-interest accounting has resulted in a number of adjustments. Most significantly:
(i)the Group’s historic U.S. GAAP financial statements have been restated to reflect the combined results of ICON and PRAI;
(ii)the costs of the merger were expensed for U.S. GAAP purposes and included in the cost of acquisition for IFRS; and
(iii)goodwill arising on IFRS has been amortised over its expected useful life up to 31 May 2001. No goodwill arose on the merger under U.S. GAAP.
(c) Share-based payment expense
IFRS requires that the fair value of share-based payments be expensed to the Consolidated Statement of Profit and Loss over the period the related services are received, with a corresponding increase in equity. The Group has accounted for share-based payments under U.S. GAAP in accordance with ASC 718, Compensation – Stock Compensation, which also requires that the fair value of share-based payments be expensed to the Consolidated Statement of Profit and Loss over the period the related services are received, with a corresponding increase in equity.
There is a difference in recorded expense. Under U.S. GAAP, the Company recognises compensation cost on a straight-line basis over the total requisite service period for the entire award. IFRS requires that each instalment of an award where there is graded vesting is treated as a separate grant with a different fair value. Each instalment is therefore separately measured and charged to the Consolidated Statement of Profit and Loss over the related vesting period. This results in accelerated expense recognition under IFRS.
(d) Stock-based Compensation Arrangements in a Business Combination
An exchange of share-based payment awards in a business combination is treated as a modification under IFRS 2. The replacement awards and the original acquiree awards should both be measured at fair value at the acquisition date and calculated using the fair-value-based measurement principles in IFRS 2.
U.S. GAAP requires the attribution of compensation cost for the acquirer’s replacement awards in the post-combination financial statements to be based on the acquirer’s attribution policy (i.e., straight-line approach or graded-vesting approach). Under IFRS, however, the graded vesting approach is required for all awards with graded vesting features based on the requirements in IFRS 2.
(e) IAS 19R Defined Benefit Liabilities
The Group has recognised the net interest expense of the defined benefit liabilities within payroll costs (operating expenses) in the Consolidated Statement of Profit and Loss under IAS19R which is consistent with the U.S. GAAP treatment of this cost. Additional net credits related to the defined benefit liabilities refer to the adjustment required to reverse the application of the corridor approach permitted under U.S. GAAP and the different net periodic pension cost recorded under IFRS and U.S. GAAP.
Under U.S. GAAP capped benefits are spread over the service life of plan participants. Under IFRS, the charge commences when the service begins which count towards capped benefits.
Reconciliation from IFRS to US Accounting Policies (Unaudited) (continued)
(f) Current tax and deferred tax assets
Deferred tax asset
U.S. GAAP, ASC 740, Income Taxes requires recognition of a deferred tax asset in respect of the cumulative amount of compensation cost recognised in the financial statements in respect of unexercised options that will give rise to a future tax deduction. The tax deduction is based on the intrinsic value of the options, with the full tax deduction recorded in profit or loss in the year of exercise.
IFRS also requires that a deferred tax asset is recognised in respect of options not yet exercised where a tax deduction will arise. IAS 12 Income taxes requires that the tax deduction is estimated. The fair value estimate is based on the share price at the exercise date.
Current tax benefit
U.S. GAAP, ASC 740, Income Taxes requires recognition of a current tax benefit of certain tax deductions arising from Share-based payment windfall gains in the Consolidated Statement of Operations. IFRS requires that the current tax benefit of these Share-based payment windfall gains is recognised through Equity, in the Share-based payment reserve.
(g) IFRS 16 Leases
Under U.S. GAAP, ASC 842 Leases, lessees account for leases as operating or finance. Costs in respect of operating leases are charged to the Consolidated Statement of Operations on a straight-line basis over the lease term. Lease costs for all leases under IFRS 16 are comprised of the depreciation of right-of-use assets and the interest charge in respect of the associated lease liability.
(h) Contract Assets and Contract Liabilities in a Business Combination
In October 2021, the FASB issued ASU 2021-08 "Business Combinations (Topic 805) - Accounting for Contract Assets and Contract Liabilities from Contracts with Customers". The amendments in this ASU require that an entity (acquirer) recognise and measure contract assets and contract liabilities acquired in a business combination in accordance with Topic 606. At the acquisition date, an acquirer should account for the related revenue contracts in accordance with Topic 606 as if it had originated the contracts. The Company has adopted the amendments in this ASU for year ended 31 December 2021 and has applied the amendments of this ASU to the Merger with PRA, completed on 1 July 2021.
IFRS 3 Business Combinations does not have a similar fair value measurement requirement for contract assets and contract liabilities. As a result, contract liabilities will have a lower valuation under IFRS compared to U.S. GAAP with the valuation adjustment being charged to revenue over the life of the contract with the customer.
(i) Onerous contracts
Under IFRS, provisions for onerous contracts are accounted for in accordance with IAS 37, Provisions, Contingent Liabilities and Contingent Assets, which requires an entity to recognise a provision when a contract is onerous.
U.S. GAAP does not contain a single general accounting model equivalent to the IFRS onerous contract guidance. Instead, anticipated contract losses are generally recognised only where required by specific authoritative guidance applicable to particular contract types (for example, certain construction-type, production-type, warranty, healthcare, or other scoped arrangements), or where the recognition criteria under ASC 450 Contingencies or other applicable guidance are met. As a result, the Group may recognise provisions under IFRS that would not arise under U.S. GAAP and the timing of loss recognition may differ.
(j) Goodwill impairment
This represents the impairment of Goodwill allocated to the Data Solutions CGU (Data Solutions reporting unit under U.S. GAAP) (on the acquisition of PRA (see ‘d’ above)), which was recognised and now impaired under IFRS. Under both IFRS and U.S. GAAP the goodwill allocated to Data Solutions was impaired to nil.
Reconciliation from IFRS to US Accounting Policies (Unaudited) (continued)
The following is a summary of the material adjustments to profit for the financial year and shareholders’ equity, which would be required, had the Consolidated Financial Statements been prepared in accordance with U.S. GAAP:
(i) Effect on profit for the financial year
| | | | | | | | |
| 31 December
2025 | 31 December
2024
(As Restated) |
| $’000 | $’000 |
| Profit for the financial year attributable to equity holders of the Group as stated under IFRS | 214,038 | | 727,077 | |
| | |
| U.S. GAAP adjustments | | |
| Share-based payment expense under IFRS (c) (d) | 110,235 | | 46,108 | |
| Share-based payment expense under U.S. GAAP (c) (d) | (104,530) | | (45,870) | |
| Right-of-use asset amortisation adjustment under IFRS (g) | 1,532 | | 1,227 | |
| Deferred tax adjustments on share-based payments (f) | (2,185) | | 7,556 | |
| Current tax adjustments on share-based payments (f) | (961) | | 3,596 | |
| Deferred tax adjustments on leases (f) | (385) | | (307) | |
| Additional credits of defined benefit liabilities (e) | (624) | | (261) | |
| Goodwill Impairment (j) | 3,339 | | — | |
| Provision for onerous contracts (i) | 12,000 | | — | |
| Deferred tax on provision for onerous contracts (i) | (3,120) | | — | |
| Net income as stated under U.S. GAAP | 229,339 | | 739,126 | |
| | |
| Basic earnings per Ordinary Share under U.S. GAAP | $2.92 | | $8.96 | |
| | |
| Diluted earnings per Ordinary Share under U.S. GAAP | $2.90 | | $8.90 | |
Reconciliation from IFRS to US Accounting Policies (Unaudited) (continued)
(ii) Effect on shareholders’ equity
| | | | | | | | |
| 31 December
2025 | 31 December
2024
(As Restated) |
| $’000 | $’000 |
| | |
| Total equity attributable to the owners of the Group as stated under IFRS | 9,246,920 | | 9,500,980 | |
| | |
| U.S. GAAP adjustments | | |
| Goodwill (net) arising on PRA merger related stock compensation (d) | (58,199) | | (58,199) | |
| Fair value adjustment to unearned revenue under IFRS (h) | 16,000 | | 16,000 | |
| Right-of-use asset amortisation adjustment under IFRS (g) | 5,829 | | 4,297 | |
| Deferred tax adjustments on leases (f) | (1,634) | | (1,249) | |
| Taxes on unearned revenue (f) | (4,104) | | (4,104) | |
| Goodwill (net) arising on merger with PRAI (b) | (14,009) | | (14,009) | |
| Deferred tax adjustments on share-based payments (f) | (8,694) | | (2,362) | |
| Re-measurement of defined benefit liability | (944) | | — | |
| Goodwill Impairment (j) | 3,339 | | — | |
| Provision for onerous contracts (i) | 12,000 | | — | |
| Deferred tax on provision for onerous contracts (i) | (3,120) | | — | |
| Total equity attributable to the owners of the Group as stated under U.S. GAAP | 9,193,384 | | 9,441,354 | |
(iii) Effect on total assets
| | | | | | | | |
| 31 December
2025 | 31 December
2024
(As Restated) |
| $’000 | $’000 |
| Total assets as stated under IFRS | 16,332,917 | | 16,693,376 | |
| | |
| U.S. GAAP adjustments | | |
| Right-of-use asset amortisation adjustment under IFRS (g) | 5,829 | | 4,297 | |
| Goodwill (net) arising on PRA merger related stock compensation (d) | (58,199) | | (58,199) | |
| Goodwill (net) arising on merger with PRAI (b) | (14,009) | | (14,009) | |
| Goodwill on fair value adjustment to unearned revenue under IFRS (h) | 16,000 | | 16,000 | |
| Deferred tax adjustments on share-based payments (f) | (12,801) | | (6,469) | |
| Goodwill (net) arising on PRA merger related right-of-use assets (g) | (174) | | (174) | |
| Goodwill Impairment (j) | 3,339 | | — | |
| Deferred tax on provision for onerous contracts (i) | (3,120) | | — | |
| Total assets as stated under U.S. GAAP | 16,269,782 | | 16,634,822 | |
Reconciliation from IFRS to US Accounting Policies (Unaudited) (continued)
(iv) Effect on total liabilities
| | | | | | | | |
| 31 December
2025 | 31 December
2024
(As Restated) |
| $’000 | $’000 |
| Total liabilities as stated under IFRS | 7,085,997 | | 7,192,396 | |
| | |
| U.S. GAAP adjustments | | |
| Deferred tax adjustments on leases (f) | 1,457 | | 1,072 | |
| Re-measurement of defined benefit liability | 944 | | — | |
| Provision for onerous contracts (i) | (12,000) | | — | |
| Total liabilities as stated under U.S. GAAP | 7,076,398 | | 7,193,468 | |
Risk Related to Our Business and Operations
The potential loss or delay of our large contracts, or of multiple contracts, could adversely affect our results.
Our clients may discontinue using our services completely or cancel some projects either without notice or upon short notice. The termination or delay of a large contract, or of multiple contracts, could have a material adverse effect on our revenue and profitability. Historically, clients have cancelled or discontinued projects and may in the future cancel their contracts with us for reasons including, amongst others:
•cost reductions or change in prioritisation of resources;
•the failure of products being tested to satisfy safety or efficacy requirements;
•unexpected or undesired clinical results of the product;
•a decision that a particular study is no longer necessary or viable;
•poor project performance, quality concerns, insufficient patient enrolment or investigator recruitment; and
•production problems resulting in shortages of the drug.
As a result, contract terminations, delays or other changes are part of our clinical services business. In the event of termination, our contracts often provide for fees for winding down the trial but these fees may not be sufficient for us to maintain our margins, and termination may result in lower resource utilisation rates. In addition, we may not realise the full benefits of our unsatisfied performance obligation of contractually committed services if our clients cancel, delay or reduce their commitments under our contracts with them. Therefore, the loss, early termination or delay of a large contract or contracts could adversely affect our revenues and profitability.
If we do not generate new business awards, or if new business awards are delayed, terminated, reduced in scope or fail to go to contract, our business, financial conditions, results of operations or cash flows may be materially adversely affected.
Our business is dependent on our ability to generate new business awards from new and existing customers and maintain and execute existing customer contracts. If we were unable to generate new business awards on a timely basis and contract, execute and deliver those awards, that could have a material impact on our business, financial condition, results of operations or cash flows.
We depend on a limited number of customers and a loss of, or significant decrease in, business or an inability to pay outstanding invoices by one or more of them could affect our business.
While no customers individually contributed more than 10% of our revenues during the years ended 31 December 2025 and 31 December 2024, our top five customers represented 24.8% and 25.2% (as restated) of our revenues respectively, our largest customer represented 7.0% and 7.8% (as restated) of our revenues, respectively, and our top twenty five customers represented 64.0% and 62.4% (as restated) of our revenues, respectively. The loss of, or a significant decrease in, business from one or more of these key customers, or an inability to pay outstanding invoices due to us, could have a material adverse impact on our results of operations and financial results.
The inability of biotechnology customers to raise adequate financing or funding could affect our business.
A portion of our revenue is generated from sales and services to the biotechnology industry. The clients we serve are commonly subject to financial pressures, including, but not limited to, the ability to obtain adequate financing or generate sufficient funding. To the extent our clients face such pressures, or they change how they utilise our offerings, the demand for our services, or the prices our clients are willing to pay for those services, may decline. Any such decline could have a material adverse effect on our business, operating results and financial condition.
Our financial results may be adversely impacted if we underprice our contracts, overrun our cost estimates or fail to receive approval for, or experience delays in, documenting change orders.
Many of our contracts are long-term contracts for services. As a result, variations in the timing and progress of large contracts may materially adversely affect our financial results. Revenue recognised on these service contracts is based on an assessment of progress towards completion, being the cost of time and other third party costs as a percentage of total estimated time and other third party costs to deliver our services. Estimating time and costs to complete requires judgment and includes consideration of the complexity of the study, the number of sites where trials are to be conducted and the number of patients to be recruited. We regularly review the estimated hours on each contract to determine if the budget accurately reflects the agreed tasks to be performed, taking into account the state of progress at the time of review.
We bear the risk of cost overruns unless the scope of activity and/or the assumptions upon which a budget is built are revised via a change order and we are able to negotiate a contract modification. We endeavour to ensure that any changes in scope are appropriately monitored and change orders or contract modifications are promptly negotiated and documented. If we fail to successfully negotiate change orders for changes in the resources required or the scope of the work to be performed, it could materially adversely affect our operations and financial results.
Appendix A: Risk Factors (continued)
If we are unable to successfully develop and market new services or enter new markets, our growth, results of operations or financial condition could be adversely affected.
A key element of our growth strategy is the successful development and marketing of new services or entering new markets that complement or expand our existing business. As we develop new services or enter new markets, we may not be able to adequately build the competencies necessary to perform such services satisfactorily, may not receive market acceptance for such services or may face increased competition. If we are unable to succeed in developing new services, entering new markets or attracting a client base for our new services or in new markets, we will be unable to implement this element of our growth strategy, and our future business, reputation, results of operations or financial condition could be adversely impacted.
If we fail to attract or retain key personnel, our performance may suffer.
Our business, future success and ability to continue to expand operations depend upon our ability to attract, hire, train and retain qualified professional, scientific and technical operating people. We compete for qualified professionals with other Contract Research Organisations (“CROs”), temporary staffing agencies and the in-house departments of pharmaceutical, biotechnology and medical device companies. An inability to attract and retain a sufficient number of high calibre clinical research professionals (in particular, key personnel and executives) at an acceptable cost would impact our ability to provide our services, our future performance and results of operations.
We may face challenges retaining employees which could cause disruption to our day-to-day activities which may result in additional costs to the business.
ICON is an award-winning workplace that enables employees to make a difference to patients’ lives by being part of a world-class CRO that helps deliver new medicines and medical devices that are benefiting patients worldwide. The attraction, development and retention of our talent is critical to the success of the Company, and we continue to strengthen processes around these areas to minimise retention risk. The Company is taking meaningful action to retain employees. Through our annual Talent Review process, we have identified opportunities for improvement as it relates to employee retention. Our People Plans have set specific goals for each functional area in terms of three critical areas: talent attraction, development and retention. However, we can provide no assurances that our efforts in this respect will be successful.
Our ability to perform clinical trials is dependent upon the ability to recruit suitable willing patients.
The successful completion of clinical trials is dependent upon the ability to recruit suitable and willing patients on which to test the drug under study. The availability of suitable patients for enrolment in studies is dependent upon many factors including, amongst others, the size of the patient population, the design of the study protocol, eligibility criteria, the referral practices of physicians, the perceived risks and benefits of the drug under study and the availability of alternative medication, including medication undergoing separate clinical trials. Insufficient or inappropriate patient enrolment may result in the termination or delay of a study which could have a material adverse impact on our results of operations.
The Company is focused on continuing to develop its expertise in patient recruitment through Accellacare, a global clinical research network, offering patients easier and faster access to innovative treatments and offering customers the option to deploy decentralised trials. The focus is on making it easier for the site and the patient to actively participate in a trial to ensure increased predictability, enrolment and retention. Our site and patient solutions group includes upfront planning of site and patient management including identification, enrolment and engagement.
Improved site selection is achieved through:
•leading technology to identify where the patients are that match the protocol;
•assessment of the qualification of sites based on real data; and
•partnerships with leading technology vendors and developing the capability to enable Electronic Medical Record (“EMR”) interrogation into clinical insights such as sub-populations and larger pre-screened pools where the technology and regulations are enabled.
Our ability to perform clinical trials is dependent upon our ability to recruit suitable willing investigators.
We contract with physicians located in hospitals, clinics or other similar sites, who serve as investigators in conducting clinical trials to test new drugs on their patients. Investigators supervise administration of the study drug to patients during the course of the clinical trial. The successful conduct of a clinical trial is dependent upon the integrity, experience and capabilities of the investigators conducting the trial. Insufficient investigator recruitment, which in turn may lead to insufficient or inappropriate patient enrolment, may result in the termination or delay of a study which could have a material adverse impact on our results of operations.
Appendix A: Risk Factors (continued)
Climate change, extreme weather events, earthquakes and other natural disasters could adversely affect our business.
In recent years, extreme weather events and changing weather patterns such as storms, flooding, droughts and temperature changes have become more common. As a result, we are potentially exposed to varying natural disaster or extreme weather risks such as hurricanes, tornadoes, droughts, floods, wildfires or other events that may result from the impact of climate change on the environment. As a result, we could experience increased costs, business interruptions, destruction of facilities, and loss of life, all of which could have a material adverse effect on our business, financial condition, or results of operations. The potential impacts of climate change may also include increased operating costs associated with additional regulatory requirements and investments in reducing energy, water use and greenhouse gas emissions.
A disease outbreak, epidemic or pandemic could adversely affect our business performance.
A disease outbreak could negatively impact our operations. We could experience restrictions on our ability to travel, or the ability of patients or other service providers to travel, to monitor our clinical trials and to ensure laboratory samples are collected and analysed on time as a result of an outbreak. The potential impact of an epidemic or pandemic may also result in increased operating costs and result in a requirement to increase investment in impact prevention in addition to adversely affecting the economies and financial markets worldwide, resulting in an economic downturn that could impact our business, financial condition and results of operations.
Our business depends on the continued effectiveness and availability of our information systems, including the information systems we use to provide our services to our clients, and any system failures of, security breaches of or cyber attacks to these systems may materially limit our operations or have a material adverse effect on our results of operations.
Due to the global nature of our business and our reliance on information systems to provide our services, we use web-enabled and other integrated information systems in delivering our services. We continue to increase the use of technology. The systems may be either developed internally or provided in conjunction with third parties. We also provide access to similar information systems to certain clients in connection with the services we provide them. As the use, scope and complexity of our information systems continue to grow, we are exposed to, and will increasingly be exposed to, the risks inherent in the development, integration and ongoing operation of evolving information systems, including:
•disruption or failure of data centres, telecommunications facilities or other key infrastructure platforms;
•security breaches, cyber attacks or other failures (such as inappropriate software updates) or malfunctions in our application or information systems or their associated hardware or other systems that we have access to, or that we rely upon, or that have access to our systems;
•security breaches, cyber attacks or malfunctions with key suppliers or partners who we rely on to provide services to customers;
•use of Artificial Intelligence (“AI”) resulting in inappropriate interpretation of data; and
•excessive costs, excessive delays or other deficiencies in, or problems with, systems development and deployment.
The materialisation of any of these risks may impede our ability to provide services, the processing of data, the delivery of databases and services and the day-to-day management of our business and could result in the corruption, loss or unauthorised disclosure of proprietary, confidential or other data, as well as reputational harm.
In addition, as AI powered cyber threats evolve, our cybersecurity programme strives to keep pace through the development of advanced detection and mitigation mechanisms. However, the dynamic nature of AI-driven attacks poses an ongoing challenge, as staying one step ahead requires constant adaptation and innovation in defensive strategies to effectively protect the organisation against emerging threats.
While we have cybersecurity controls and disaster recovery plans in place, they might not adequately protect us in the event of a system failure, security breach or cyber attack. To date, no cyber attacks have had a material impact on our results of operations or financial reporting. Additionally, despite any precautions we take, damage from fire, floods, hurricanes, power loss, telecommunications failures, computer viruses, information system security breaches, cyber attacks and similar events that impact our various computer facilities could result in interruptions in the flow of data to our servers and from our servers to our clients. Corruption or loss of data may result in the need to repeat a trial at no cost to the client, but at significant cost to us, or result in the termination of one or more contracts, legal proceedings or claims against us or damage to our reputation. Additionally, significant delays in system enhancements or inadequate performance of new or upgraded systems once completed could damage our reputation and harm our business. Long-term disruptions in the infrastructure caused by events such as security breaches, cyber attacks, natural disasters, the outbreak of war, the escalation of hostilities and acts of terrorism, particularly involving cities in which we have offices, could adversely affect our business.
Unauthorised disclosure of sensitive or confidential data, whether through system failure or employee negligence, fraud or misappropriation, could damage our reputation and cause us to lose clients. Similarly, despite investing in information and cybersecurity controls, there is a risk that unauthorised access to our information systems or those we develop for our clients, whether by our employees or third parties, including a cyber attack by computer programmers and hackers who may attack ICON systems, develop and deploy viruses, worms, ransomware or other malicious software programmes, could
Appendix A: Risk Factors (continued)
result in negative publicity, significant remediation costs, legal liability, loss of customers and damage to our reputation and could have a material adverse effect on our results of operations and financial results. In addition, our liability insurance might not be sufficient in type, cover provided or amount to adequately cover us against claims related to security breaches, cyber attacks and other related breaches.
We may also face cybersecurity risks due to hybrid work arrangements, which could create opportunities for cybercriminals to exploit vulnerabilities.
Upgrading the information systems that support our operating processes and evolving the technology platform for our services pose risks to our business.
Continued efficient operation of our business requires that we implement standardised global business processes and evolve our information systems to enable this. We have continued to undertake significant programmes to optimise business processes. A failure to effectively manage the implementation and adapt to new processes designed in these new or upgraded systems in a timely and cost-effective manner may result in disruption to our business and negatively affect our results of operations.
We have entered into agreements with certain vendors to provide systems development and integration services that develop or licence to us the IT platform for programs to optimise our business processes. If such vendors fail to perform as required or if there are substantial delays in developing, implementing and updating the IT platform, our customer delivery may be impaired and we may have to make substantial further investments, internally or with third parties, to achieve our objectives. Additionally, our progress may be limited by parties with existing or claimed patents who seek to prevent us from using preferred technology or seek licence payments from us.
Meeting our objectives is dependent on a number of factors which may not take place as we anticipate, including obtaining adequate technology-enabled services, creating IT-enabled services that our customers will find desirable and implementing our business model with respect to these services. We are continuing to develop opportunities for automation across ICON using state of the art automation tools including Robotic Process Automation (RPA), the development of new applications and capabilities, and enabling deeper integration across our digital ecosystem.
ICON has a dedicated Artificial Intelligence Centre of Excellence. By leveraging innovative Artificial Intelligence (“AI”) and Machine Learning (“ML”), we accelerate trials, optimise resources, and ensure strict compliance, all while upholding the highest standards of ethical governance and data privacy. Our focus is to expedite our ability to:
•find signals quickly;
•connect information intelligently;
•predict outcomes; and
•take proactive action to accelerate processes or mitigate emerging risks.
Regulations relating to the use of AI and the interpretation of those regulations by regulators, courts and others are in the early stages of development and evolving, which may make it difficult to identify adequate compliance requirements or suitable governance practices to meet those requirements.
To remain competitive within our industry and keep pace with the rapid evolution of the technological landscape, it is critical that we continue to innovate and expand the capabilities of our current technologies. Increased requirements for investment in information technology or failure to comply with regulations may negatively impact our financial condition, including profitability.
Uncertainties related to the development, deployment and use of artificial intelligence could adversely affect our business, operations, and reputation.
The Company is increasingly exploring and adopting artificial intelligence, machine learning, and other advanced technologies to enhance efficiency, improve predictability, and empower data-driven decision-making. While these technologies present significant opportunities, their use also involves risks and uncertainties that could adversely affect our business, results of operations, information security, regulatory compliance, and reputation. Failure to keep pace with rapid developments in AI technologies could adversely affect our competitive position and results of operation.
AI-based systems rely on complex algorithms and large datasets, which may be flawed, incomplete, outdated, insufficient, or contain biases. Inaccurate or biased outputs could lead to suboptimal outcomes, flawed analyses, inappropriate recommendations, or errors in supporting client decision-making. If the insights or services derived from AI-assisted tools prove to be inaccurate or unreliable, we could experience competitive harm, loss of client trust, contractual disputes, litigation exposure, regulatory scrutiny, or reputational damage.
The use of AI and automated tools also presents cybersecurity and data protection risks. AI systems may process sensitive or confidential information, including proprietary client data, personal data, or health-related data. Security vulnerabilities, misuse by employees or third-party vendors, model leakage, or unauthorised access could result in the disclosure or misuse of confidential information, violations of data protection laws, contractual obligations, or intellectual property rights, and may expose us to fines, penalties, litigation, or loss of business.
Appendix A: Risk Factors (continued)
We rely on third-party providers and AI developers for certain infrastructure. Any operational failure, service discontinuation, or ethical controversy involving these vendors could disrupt our AI-enabled workflows. Furthermore, as competitors develop more advanced or cost-effective AI solutions, our failure to innovate at a similar pace could lead to a loss of market share and downward pressure on our service pricing.
In addition, the regulatory framework governing AI is evolving and may lag behind the pace of technological advancement, creating uncertainty in interpretation and compliance expectations across jurisdictions and, in some cases, across different customer requirement. Changes in laws, regulations, or regulatory guidance, or divergent global standards, could increase compliance costs, delay deployment of AI solutions, or restrict certain uses of these technologies.
Failure to meet productivity objectives under our business improvement objectives could adversely impact our competitiveness and therefore our operating results.
We continue to pursue business transformation initiatives to embed technology and innovation including through the use of AI and deliver operational efficiencies. As part of these initiatives, we seek to improve our productivity, flexibility, quality, functionality and cost savings by our on-going investment in global technologies, continuous improvement of our business processes and functions to deliver economies of scale. These initiatives may not deliver their intended gains or be completed in a timely manner which may adversely impact our competitiveness and our ability to meet our growth objectives and therefore, could adversely affect our business and operating results, including profitability.
An error in the design, programming or validation of our interactive response technologies could lead to patient safety issues and invalidation of a trial and/or liability claims against the Company, amongst other things, any of which could have a material adverse effect on our financial condition and operations.
We develop and maintain computer run and web based interactive response technologies to automatically manage the randomisation of patients in trials, assign the study drug and adjust the dosage when required for patients enroled in trials we support. An error in the design, programming or validation of these systems could lead to inappropriate assignment or dosing of patients, which could give rise to patient safety issues and invalidation of the trial and/or liability claims against the Company, amongst other things, any of which could have a material adverse effect on our financial condition and operations.
A failure to identify and successfully close and integrate strategic acquisition targets could adversely impact our ongoing business and financial results.
We have made a number of acquisitions in recent years, including the Merger, and continue to review new acquisition opportunities. If we are unable to identify suitable acquisition targets, complete an acquisition or successfully integrate an acquired company or business, our business may be disrupted. The success of an acquisition will depend upon, among other things, our ability to:
•effectively and quickly assimilate the operations and services or products of the acquired company or business;
•integrate acquired personnel;
•retain and motivate key employees;
•retain customers; and
•minimise the diversion of management's attention from other business concerns.
In the event that the operations of an acquired company or business do not meet our performance expectations, we may have to restructure the acquired company or business or write-off the value of some, or all, of the assets of the acquired company or business.
Improper performance or delays in performance of our services could adversely impact our reputation and our financial results.
The performance of clinical development services is complex and time-consuming. We, or vendors we engage, may make mistakes in conducting a clinical trial that could negatively impact or damage the usefulness of the clinical trial or cause the results to be reported improperly. If the clinical trial results are compromised, we could be subject to significant costs or liability, which could have an adverse impact on our ability to perform our services. Large clinical trials are costly, and while we endeavour to contractually limit our exposure to such risks, improper performance of our services or delays as a result of our performance could have an adverse effect on our financial condition, damage our reputation and result in the cancellation of current contracts or failure to obtain new contracts from affected or other clients.
Appendix A: Risk Factors (continued)
Our relationships with existing or potential customers who are in competition with each other may adversely impact the degree to which other customers or potential customers use our services, which may adversely affect our results of operations.
The biopharmaceutical industry is highly competitive, with biopharmaceutical companies each seeking to persuade payers, providers and patients that their drug therapies are better and more cost-effective than competing therapies marketed or being developed by competing companies. In addition to the adverse competitive interests that biopharmaceutical companies have with each other, biopharmaceutical companies also have adverse interests with respect to drug selection and reimbursement with other participants in the healthcare industry, including payers and providers. Biopharmaceutical companies also compete to be first to market with new drug therapies. We regularly provide services to biopharmaceutical companies who compete with each other and we sometimes provide services to such customers regarding competing drugs in development. Our existing or future relationships with our biopharmaceutical customers may therefore deter other biopharmaceutical customers from using our services or may result in our customers seeking to place limits on our ability to serve other biopharmaceutical industry participants. In addition, our further expansion into the broader healthcare market may adversely impact our relationships with biopharmaceutical customers and such customers may elect not to use our services, reduce the scope of services that we provide to them or seek to place restrictions on our ability to serve customers in the broader healthcare market with interests that are adverse to theirs. Any loss of customers or reductions in the level of revenues from a customer could have a material adverse effect on our results of operations, business and prospects.
We have only a limited ability to protect our intellectual property rights and these rights are important to our success.
Our success depends, in part, upon our ability to develop, use and protect our proprietary methodologies, analytics, systems, technologies and other intellectual property. Existing laws of the various countries in which we provide services or solutions offer only limited protection of our intellectual property rights and the protection in some countries may be very limited. We rely upon a combination of trade secrets, confidentiality policies, non-disclosure, invention assignment and other contractual arrangements and patent, copyright and trademark laws, to protect our intellectual property rights. These laws are subject to change at any time and certain agreements may not be fully enforceable, which could further restrict our ability to protect our innovations. Intellectual property rights may not prevent competitors from independently developing services similar to, or duplicative of, ours. Further, the steps we take in this regard might not be adequate to prevent or deter infringement or other misappropriation of our intellectual property by competitors, former employees or other third parties and we might not be able to detect unauthorised use of, or take appropriate and timely steps to enforce our intellectual property rights. Enforcing our rights might also require considerable time, money and oversight and we may not be successful in enforcing our rights.
Further, the regulatory landscape surrounding artificial intelligence is also evolving. The intellectual property ownership and licence rights of new technologies such as AI have not been fully addressed by US or global courts. As these technologies’ use expands, we may fail to adequately protect our intellectual property.
The biopharmaceutical industry has a history of patent and other intellectual property litigation and we may become involved in costly intellectual property lawsuits.
The biopharmaceutical industry has a history of intellectual property litigation, and these lawsuits will likely continue in the future. Accordingly, we may face patent infringement legal proceedings by companies that have patents for similar business processes or other legal proceedings alleging infringement of their intellectual property rights. Legal proceedings relating to intellectual property could be expensive, take significant time and divert management’s attention from other business concerns, regardless of the outcome of the litigation. If we do not prevail in an infringement lawsuit brought against us, we might have to pay damages and we could be required to stop the infringing activity or obtain a licence to use technology on unfavourable terms. Any infringement or other legal processing related to intellectual property could have a material adverse effect on our operations and financial condition.
We act as authorised representative or legal representative for some clients pursuant to certain jurisdictional requirements for sponsors of clinical trials to appoint an authorised representative or legal representative with a local presence within the relevant jurisdiction.
We act as authorised representative pursuant to Medical Devices Regulation 2017/745 (“MDR”) for certain clients who are located outside of the European Union. As authorised representative, we act on behalf of medical device manufacturers in relation to specified tasks with regard to their obligations under MDR.
We also act as legal representative pursuant to European Clinical Trials Directive (2021/20/EC) (“CTD”), EU Clinical Trials Regulation (No.536/2014) (“CTR”) and MDR for certain clients who are located outside of the European Union with respect to clinical trials being carried out by those clients in the European Union. We also perform similar legal representative services for certain clients in other non-EU jurisdictions. Where the client is located outside the relevant local jurisdiction, ICON has an established local legal entity in that jurisdiction where analogous local regulations have a similar requirement for a local legal representative for clinical trials being carried out in those jurisdictions. As legal representative, we are responsible for ensuring compliance with the client’s obligations pursuant to CTD, CTR and MDR or analogous local legislation and we are the addressee for all communications with the client provided for under CTD, CTR and MDR or analogous local legislation.
Appendix A: Risk Factors (continued)
We provide these services subject to certain terms and conditions which are contained in our agreements with clients pertaining to these services. We aim to reduce any potential liability associated with these activities by seeking contractual indemnification from our clients and by maintaining an appropriate level of insurance cover. However, there is no guarantee that the specific insurance will be available or that a client will fulfil its obligations in relation to their indemnity.
We rely on third parties to provide certain data and other information to us. Our suppliers or providers might increase our cost to obtain, restrict our use of, or refuse to license data, which could lead to our inability to access certain data or provide certain services and, as a result, materially and adversely affect our operating results and financial condition.
Our services are derived from, or include, the use of data we collect from third parties. We have several data suppliers that provide us with a broad scope of information that we collect, use in our business and sell.
We generally enter into long-term contractual arrangements with many of our data suppliers. At the time we enter into a new data supply contract or renew an existing contract, suppliers may increase our cost to obtain and use the data provided by such supplier, increase restrictions on our ability to use or sell such data, or altogether refuse to license the data to us. Also, our data suppliers may fail to meet or adhere to our quality control standards or fail to deliver the data to us. Although no single supplier is material to our business, if suppliers that collectively provide a significant amount of the data we receive or use were to increase our costs to obtain or use such data, further restrict our access to or use of such data, fail to meet or adhere to our quality control standards, refuse to provide or fail to deliver data to us, our ability to provide data-dependent services to our clients may be adversely impacted, which could have a material adverse effect on our business, results of operations, financial condition or cash flow.
We rely on third parties for important products, services and licences to certain technology and intellectual property rights. If there was a failure in delivery by these parties, we might not be able to continue to obtain such products, services and licences.
We depend on certain third parties to provide us with products and services critical to our business. Such services include, among others, suppliers of drugs for patients participating in trials, suppliers of kits for use in our laboratories, suppliers of reagents for use in our testing equipment and providers of maintenance services for our equipment. The failure of any of these third parties to adequately provide the required products or services, or to do so in compliance with applicable regulatory requirements, could have a material adverse effect on our business.
Some of our services rely on intellectual property, technology and other similar property owned and/or controlled by third parties. Our licences to this property and technology could terminate or expire and we might not be able to replace these licences in a timely manner. Also, we might not be able to renew these licences on similar terms and conditions. Failure to renew these licences, or renewals of these licences on less advantageous terms, could have a material adverse effect on our business, results of operations, financial condition or cash flow.
Risk Related to Our Industry
Outsourcing trends in the pharmaceutical, biotechnology and medical device industries and changes in spending on research and development could adversely affect our operating results and growth rates.
We are dependent upon the ability and willingness of the pharmaceutical, biotechnology and medical device companies to continue to spend on research and development and to outsource the services that we provide. We are therefore subject to risks, uncertainties and trends that affect companies in these industries that we do not control. We have benefited to date from the tendency of pharmaceutical, biotechnology and medical device companies to outsource clinical research projects. Any downturn in these industries or reduction in spending or outsourcing could materially adversely affect our business. The following could each result in such a downturn:
•if pharmaceutical, biotechnology or medical device companies expanded upon their in-house clinical or development capabilities, they would be less likely to utilise our services;
•if governmental regulations were changed, it could affect the ability of our clients to operate profitably, which may lead to a decrease in research spending and therefore this could have a material adverse effect on our business; and
•if unfavourable economic conditions or disruptions in the credit and capital markets negatively impact our customers, this could result in delays or reprioritisation of their research spending.
Large pharmaceutical companies are increasingly consolidating their vendor base and entering strategic partnership arrangements with a limited number of outsource providers.
Large pharmaceutical companies continually seek to drive efficiencies in their development processes to both reduce costs associated with the development of new drug candidates and accelerate time to market. As a result, large pharmaceutical companies, in particular, are increasingly looking to consolidate the number of outsource providers with which they engage, with many entering strategic partnership arrangements with a limited number of outsource providers. The failure to enter strategic partnership arrangements with customers or the loss of existing customers as a result of them entering strategic partnership arrangements with our competitors could have a material adverse impact on our results of operations.
Appendix A: Risk Factors (continued)
Increased collaboration amongst pharmaceutical companies in research and development activities may lead to fewer research opportunities.
Certain pharmaceutical companies have begun to collaborate in seeking to develop new drug candidates. Increased collaboration amongst pharmaceutical companies may lead to fewer research opportunities, which in turn may lead to fewer outsource opportunities for companies within the CRO industry. A reduction in outsource opportunities as a result of this increased collaboration could have a material adverse impact on our results of operations.
We operate in a highly competitive and dynamic market.
The CRO industry is highly competitive. In particular, we compete with other large global CROs for strategic relationships with large pharmaceutical companies. If we are unable to retain and renew existing strategic relationships and win new strategic relationships, there could be a material adverse impact on our results. Similarly, we compete with other CROs for work, which comes outside of these strategic relationships, and we may also compete with the Research and Development capabilities of our customers; being unable to win work outside of the strategic relationships could have a material adverse impact on our results.
The type and depth of services provided by CROs has changed in recent years. Failure to develop and market new services or expand existing service offerings could adversely affect our business and operations.
New entrants may also enter the market which would further increase competition and could adversely affect our business and operations.
In addition, the emergence of the use of Real World Evidence and the advancements in new approaches such as machine learning and artificial intelligence (AI), including generative, agentic and foundation models that are increasingly accessible through third-party or open-source platforms, that capitalise on the availability of large data sets may reduce the time and costs of the discovery and development process, may allow our clients to more readily perform for themselves clinical development tasks and services that we have typically provided, may cause even greater price competition and/or reduce the perceived differentiation of certain of our information, analytics and insight-based offerings. If customers are able to obtain comparable insights through alternative AI-enabled solutions, develop such capabilities internally, or shift spending toward lower-cost providers, demand for certain of our services and offerings could decline, pricing pressure could increase, and our margins and growth prospects could be adversely affected which could have a material impact on our business, financial condition, results of operations or cash flows.
We may be adversely affected by industry, customer or therapeutic concentration.
We provide services to biopharmaceutical, biotechnology, medical device and government organisations and our revenue is dependent on expenditures by these customers. Our business could therefore be adversely impacted by mergers, consolidation, business failures, policy decisions, distress in financial markets or other factors resulting in a decrease in the number of potential customers or therapeutic products being developed through the drug development process.
There has been consolidation in the biopharmaceutical market in recent years, including the acquisition of biotechnology companies by pharmaceutical companies. If the number of our potential customers were to decline in the future, they may be able to negotiate price discounts or other terms for services that are less favourable to us than they have been historically.
Risk Related to Our Financial Results and Financial Position
Our quarterly results are dependent upon a number of factors and can fluctuate from quarter to quarter. They may fall short of prior periods, our projections, or the expectations of securities analysts or investors, which may adversely affect the market price of our stock.
Our results of operations in any quarter can fluctuate or differ from expected or forecast results depending upon or due to, among other things, the number and scope of ongoing client projects, the commencement, postponement, variation, cancellation or termination of projects in a quarter, the mix of activity, cost overruns, employee hiring, employee attrition and other factors. Our revenue in any period is directly related to the number of employees who were working on billable projects together with investigator activity during that period. We may be unable to compensate for periods of under-utilisation during one part of a fiscal period by earning revenue during another part of that period. We believe that operating results for any particular quarter are not necessarily a meaningful indicator of future results.
If in future quarters, we are unable to continue to deliver operational efficiencies and our expenses grow faster than our revenues, our operating margins, profitability and overall financial condition may be materially adversely impacted.
Appendix A: Risk Factors (continued)
Our exposure to exchange rate fluctuations could adversely affect our future results of operations
Our contracts with clients are sometimes denominated in currencies other than the currency in which we incur expenses related to such contracts. Where expenses are incurred in currencies other than those in which contracts are priced, fluctuations in the relative value of those currencies could have a material adverse effect on our results of operations.
In addition, we are also subject to translation exposures as our consolidated financial results are presented in U.S. dollars, while the local results of a certain number of our subsidiaries are prepared in currencies other than U.S. dollars, including, amongst others, the pound sterling and the euro. Accordingly, changes in exchange rates between the U.S. dollar and those other currencies will affect the translation of subsidiary companies' financial results into U.S. dollars in reporting our consolidated financial results.
Inflation and rising labour costs could adversely affect our future results of operations.
Inflation and rising labour costs may result in significant increases to the cost of our services, which we may not be able to recover from our customers. If macroeconomic forces, such as inflation, cause the cost of inputs required to deliver these contracts to increase significantly, we may be unable to pass along all of these costs to our customers. A sustained increase in these costs may require us to increase the price of future service offerings. These actions could adversely affect our future revenue, gross margin, or both.
Our effective tax rate may fluctuate from quarter-to-quarter, which may adversely affect our results of operations.
Our quarterly effective tax rate has depended and will continue to depend on the geographic distribution of our taxable earnings amongst the multiple tax jurisdictions (such as Ireland, United States and United Kingdom) in which we operate and the tax laws in those jurisdictions. Changes in the geographic mix of our results of operations amongst these jurisdictions may have a significant impact on our effective tax rate from quarter-to-quarter. Changes in tax law in one or more jurisdictions could also have a significant impact on our tax rate and results. In addition, as we operate in multiple tax jurisdictions, we may be subject to audits in certain jurisdictions. These audits may involve complex issues which could require an extended time period before being resolved. The resolution of audit issues may lead to additional taxes, interest as well as fines and/or penalties being imposed which could have a material adverse impact on our effective tax rate and our consolidated financial results.
In terms of recent legislative changes which could potentially impact our effective tax rate, on 4 July 2025, the U.S. President signed into law the Budget Reconciliation Bill, which extends various expiring tax provisions from the 2017 Tax Cuts and Jobs Act and introduces a variety of other law changes. Our assessment is that it is not expected to have a material impact on our results of operations.
We cannot predict the impact of any executive orders or regulatory changes that may become effective or enacted by the administration in the United States.
In terms of a global minimum tax rate, the Organisation for Economic Co-operation and Development's (“OECD”) Global Anti-Base Erosion (“GloBE”) Model Rules proposed a global minimum tax rate of 15% and recommended that it be effective from 2024. European Union member states adopted a global minimum tax in December 2022 and member states were obliged to implement the rules by 31 December 2023, which impact large multinational groups with a consolidated revenue of over €750 million. Although there is no assurance that every country in which ICON has a presence will implement GloBE, where a particular jurisdiction has a minimum effective tax rate of less than 15%, the head office location may be obliged to pay a top-up tax. Ireland has also implemented global minimum tax legislation which has been in force from 1 January 2024. The global tax environment is becoming increasingly complex and management continues to review the impact of a global minimum tax on the Company’s financial performance. Further, regulatory or policy changes in geographies in which we operate may have a material adverse impact on our results of operations.
Our unsatisfied performance obligation may not convert to revenue and the rate of conversion may slow.
Our unsatisfied performance obligation is the amount of awards that has not yet converted to revenue. This value is not necessarily a meaningful predictor of future results due to the potential for the cancellation or delay of projects included in the unsatisfied performance obligation. No assurances can be given that we will be able to realise this unsatisfied performance obligation in full as revenue. A significant reduction in the rate of conversion could have a material adverse impact on our results of operations.
The Company is exposed to various risks in relation to our cash and cash equivalents.
The Company’s treasury function manages our available cash resources and invests significant cash balances in various financial institutions to try to ensure optimum returns for our surplus cash balances. These balances are classified as cash and cash equivalents. Cash and cash equivalents comprise cash and highly liquid investments with maturities of three months or less.
Appendix A: Risk Factors (continued)
Given the global nature of our business, we are exposed to various risks in relation to these balances including liquidity risk, credit risk associated with the counterparties with whom we invest, interest rate risk on floating rate securities, sovereign risk (our principle sovereign risk relates to investments in U.S. Treasury funds) and other factors.
Although we have not recognised any significant losses to date on our cash and cash equivalents, any significant declines in their market values could have a material adverse effect on our financial position and operating results.
Changes in accounting standards may adversely affect our financial statements.
We prepare our Annual Report on Form 20-F in accordance with generally accepted accounting principles in the United States of America (“U.S. GAAP”) which are revised on an on-going basis by the authoritative bodies. We prepare our statutory financial statements in accordance with generally accepted accounting principles in Ireland which are revised on an on-going basis by the authoritative bodies. It is possible that future accounting standard updates may require changes to the accounting treatment that we apply in preparation of our financial statements. These changes may also require significant changes to our reporting systems. These updates may result in unexpected variability in the timing of recognition of revenue or expenses and therefore in our operating results.
Impairment of goodwill and intangible assets may adversely impact future results of operations.
We record intangible assets, including goodwill, on our Statement of financial position on acquisitions of businesses. The initial identification and valuation of these intangible assets and the determination of the estimated useful lives at the time of acquisition involve use of judgments and estimates. These estimates are based on, among other factors, projections of cash flows that arise from identifiable intangible assets of acquired businesses and discount rates based on an analysis of our weighted average cost of capital, adjusted for specific risks associated with the assets. Disruptions in global financial markets and deterioration of economic conditions could, among other things, impact the discount rate. Other assumptions used in the valuations and actual cash flows arising from a particular intangible asset could vary from projected cash flows, which could imply different carrying values from those established at the dates of acquisition and which could result in impairment of such assets.
If the future growth and operating results of our business are not as strong as anticipated, overall macroeconomic or industry conditions deteriorate and/or our market capitalisation declines, this could impact the assumptions used in establishing the carrying value of goodwill or intangible assets. Should disruption in the global financial markets and deterioration of economic conditions have a prolonged impact on our industry, triggering events may arise resulting in intangible asset, or goodwill impairments. For example, during the year ended 31 December 2025, the Company recorded a goodwill impairment charge of $367.6 million, which represented the entire balance of goodwill attributed to the Data Solutions reporting unit. To the extent intangible assets, or goodwill are impaired, their carrying value will be written down to their implied fair values and a charge will be made to our net income (refer to Note 13 Goodwill and intangible assets in the Notes to the Consolidated Financial Statements for charges recorded during the year ended 31 December 2025). Such an impairment charge could materially and adversely affect our operating results.
We have concluded that our internal control over financial reporting and our disclosure controls and procedures were not effective as of 31 December 2025 due to material weaknesses, which has adversely affected our ability to report our financial results in a timely and accurate manner and could have a material adverse impact on our business and financial condition.
We are required to evaluate the effectiveness of our disclosure controls and procedures and our internal control over financial reporting and publicly disclose the results of these evaluations and related matters in accordance with the requirements of Section 404 of the Sarbanes-Oxley Act of 2002. We have identified material weaknesses in internal controls over financial reporting. As a result of these material weaknesses, our management concluded that our internal control over financial reporting and disclosure controls and procedures were not effective as of 31 December 2025.
We are engaged in developing and implementing a remediation plan, designed to address the material weaknesses, but our remediation efforts are not complete and are ongoing. Although we are working to remedy the ineffectiveness of the Company’s internal control over financial reporting, there can be no assurance as to when the remediation plan will be fully implemented, or the aggregate cost of implementation. Until our remediation plan is fully implemented, our management will continue to devote time and attention to these efforts. If we do not complete our remediation in a timely fashion, or at all, or if our remediation plan is inadequate, there will continue to be an increased risk that we will be unable to timely file future periodic reports with the SEC and that our future consolidated financial statements could contain errors that will be undetected. If we are unable to remediate our material weaknesses or report our results in a timely and accurate manner, our stock price may decline, or our stock may be delisted from NASDAQ, our ability to raise capital may be limited and we may not be able to comply with the applicable covenants in our financing arrangements. In addition, we could be subject to regulatory investigations and penalties or shareholder litigation. Any of these risks could have a material adverse impact on our business and financial condition.
Appendix A: Risk Factors (continued)
If we fail to maintain proper and effective internal controls, our business and financial condition could be materially adversely impacted.
We cannot assure you that we will not discover additional deficiencies in our internal control over financial reporting. Moreover, because of the inherent limitations of any control system, material misstatements due to error or fraud may not be prevented or detected on a timely basis, or at all.
Further and continued determinations that there are deficiencies in the effectiveness of the Company’s internal control over financial reporting could result in another restatement of our consolidated financial statements, cause us to fail to meet our reporting obligations, reduce our ability to obtain financing, negatively affect investor or customer confidence in our management and the accuracy of our financial statements and disclosures, or result in adverse publicity and concerns from investors, any of which could have a negative effect on the price of our common stock, subject us to regulatory investigations and penalties or shareholder litigation, and materially adversely impact our business, financial condition, results of operations and cash flows.
Due to inherent limitations, there can be no assurance that our system of disclosure and internal controls and procedures will be successful in preventing all errors, theft and fraud, or in informing management of all material information in a timely manner.
Management does not expect that our disclosure controls and procedures and internal controls over financial reporting will prevent all errors or fraud. A control system is designed to give reasonable, but not absolute, assurance that the objectives of the control system are met. In addition, any control system reflects resource constraints and the benefits of controls must be considered relative to their costs. Inherent limitations of a control system may include: judgments in decision making may be faulty, breakdowns can occur simply because of error or mistake and controls can be circumvented by collusion or management override. Due to the inherent limitations in a cost-effective control system, misstatements due to error or fraud may occur and may not be detected.
Matters relating to or arising from the subject of the Investigation, including expenses and diversion of personnel and resources, regulatory investigations, and proceedings and litigation matters, could have an adverse effect on our business, results of operations and financial condition.
We have incurred, and may continue to incur, significant expenses related to legal, accounting and other professional services in connection with matters relating to or arising from the subject of the Investigation, including with respect to the Putative Class Action (as defined below). To the extent steps we take to remediate deficiencies in our internal controls over financial reporting are not successfully identified and implemented, we may incur significant additional time and expense.
In addition, we elected to self-report the Investigation to the SEC and other regulatory authorities. If the SEC or any other regulator were to commence legal action against us, we could be required to pay significant penalties and become subject to injunctions, cease and desist orders or other remedies. We can provide no assurances as to the outcome of any governmental inquiry or investigation. The Company and certain of its current and former executive officers are named as defendants in the Putative Class Action. Further, we, our officers and members of our Board of Directors could be named as defendants in other class action lawsuits, contract claims, derivative lawsuits or other actions asserting claims arising out of the subject matter of the Investigation. Defending against these matters can be time-consuming and costly and will divert management's attention from our business operations. Adverse outcomes could result in substantial monetary damages, penalties, injunctive, or other relief, and even if resolved favourably, we may incur significant legal expenses. Further, as a result of any legal proceedings and any related indemnification requirements to our officers and directors, we could be required to pay monetary damages that may be in excess of our insurance coverage or may have additional penalties or other remedies imposed against us or our officers and directors.
All of these expenses, and the diversion of the attention of management and other personnel that has occurred and is expected to continue, could adversely affect our business, financial condition, results of operations and cash flows.
We may incur additional substantial costs in connection with remediation efforts following the Restatement, which could adversely affect our results of operations.
We are undertaking significant efforts to remediate material weaknesses in our internal control over financial reporting and to enhance our disclosure controls and procedures. These efforts have required and will continue to require significant management time and financial resources. We may incur substantial costs in connection with these remediation activities, including consulting fees, audit and professional service fees, and upgrades to our financial reporting systems and controls. These additional expenses could materially adversely affect our results of operations and financial condition.
We may be required to indemnify our current and former directors, officers and employees in connection with litigation and other actions which could result in significant legal expenses and other costs to us.
In certain enumerated circumstances and subject to applicable law, our corporate governance documents and applicable indemnification agreements require us to defend and indemnify our current and former directors and officers, and certain employees against enumerated liabilities and expenses incurred as a result of legal proceedings and investigations,
Appendix A: Risk Factors (continued)
including any potential regulatory actions or litigation arising out of the matters related to the Investigation and Restatement. As a result, we may be obligated to advance and ultimately pay substantial legal costs, settlement amounts, or judgments on behalf of these individuals. These indemnification obligations could significantly increase our legal expenses and could materially adversely affect our financial condition and cash flows.
It may be difficult or costly to obtain director and officer insurance coverage in the future as a result of the Restatement.
As a result of the restatement, the Investigation and related risks, our current directors’ and officers’ liability insurance (“D&O Insurance”) providers may seek to increase premiums significantly, impose additional exclusions, or refuse to renew coverage altogether. In addition, we may face challenges in obtaining comparable coverage from alternative insurance carriers on commercially reasonable terms, or at all. A reduction in the scope or amount of D&O Insurance coverage could adversely affect our ability to attract and retain qualified directors and officers, and expose us to greater potential liability, which could have a material adverse effect on our financial condition, governance, and ability to operate our business.
Our failure to timely file our Annual Report on Form 20-F with the SEC limits our access to the public markets to raise debt or equity capital, may impact our ability to obtain alternative financing, and could have negative consequences under the terms of our existing credit agreements.
Our failure to timely file our Annual Report on Form 20-F with the SEC restricts our ability to use a registration statement on Form F-3, which limits our ability to access the public markets quickly and efficiently. It may also restrict our ability to raise capital through traditional private placements, as potential investors may be reluctant to invest in a company that is not current or has a history of not being current in its SEC filings. In addition, our failure to file periodic reports could constitute a default under certain covenants in existing or future credit facilities, which could lead to the acceleration of outstanding indebtedness or other adverse consequences. The combined effect of these factors could materially and adversely affect our liquidity, financial condition, and results of operations.
Risk Related to Our Indebtedness
We incurred substantial additional indebtedness, which could impair our flexibility and access to capital and could adversely affect the Company’s business, financial condition or results of operations.
Following completion of the Merger and the other transactions contemplated by the Merger Agreement, the Company has a substantial amount of debt. ICON borrowed approximately $6,015.0 million in order to pay PRA shareholders the cash consideration due to them as merger consideration under the Merger Agreement, pay related fees and transaction costs in connection with the transactions, and refinance existing indebtedness.
On 8 May 2024, ICON Investments Six Designated Activity Company (the “Issuer”), a wholly-owned subsidiary of ICON plc, issued $2 billion senior secured notes (“the New Notes”). The New Notes were issued in aggregate principal amounts of: $750 million 5.809% Senior Secured Notes due 2027 (the “2027 Notes”), $750 million 5.849% Senior Secured Notes due 2029 (the “2029 Notes”) and $500 million 6.000% Senior Secured Notes due 2034 (the “2034 Notes”). The proceeds from the issuance were used to repay a portion of the senior secured term loan outstanding under the Senior Secured Credit Facilities and to pay fees, costs and expenses related to the offering. As of 31 December 2025 we had outstanding $3,416.7 million of debt.
This level of borrowings could adversely affect the Company in a number of ways, including, but not limited to, causing us to incur substantial fees from time to time in connection with debt amendments or refinancing, making it more difficult for the Company to satisfy its obligations with respect to its debt or to its trade or other creditors, requiring a substantial portion of the Company’s cash flows from operations for the payment of interest on the Company’s debt, reducing the Company’s flexibility to respond to changing business and economic conditions, and reducing funds available for the Company’s investments in research and development, capital expenditures and other activities. If ICON cannot service its debt, it may have to take actions such as selling assets, seeking additional debt or equity, or reducing or delaying capital expenditures, strategic acquisitions, investments and alliances.
Appendix A: Risk Factors (continued)
Covenants in our credit agreement and the indentures governing the 2026 Notes and the New Notes may restrict our business and operations. Our financial condition and results of operations could be adversely affected if we do not comply with those covenants.
The Senior Secured Credit Facilities and the indentures governing the 2026 Notes and the New Notes include certain customary covenants that limit our ability to, amongst other things, subject to certain exceptions:
•make dividends, investments and other restricted payments;
•enter into sale and leaseback transactions;
•engage in share buybacks;
•incur or assume liens or additional debt;
•engage in mergers or reorganisations; or
•enter into certain types of transactions with affiliates.
On 8 December 2023, ICON notified the holders of the 2026 Notes of the upgrade of the instrument rating to investment grade and the consequent suspension of certain of the covenants under the indenture governing the 2026 Notes. The suspension of these covenants remains in place and will continue so long as the instrument remains at investment grade.
Interest rate fluctuations may materially adversely affect our results of operations and financial conditions due to the variable interest rate on our senior secured term loan facility, our revolving credit facility or in respect of any future issuances of debt.
Borrowings under the senior secured term loan facility amortise in equal quarterly instalments in an amount equal to 1.00% per annum of the principal amount, with the remaining balance due at final maturity.
On 14 March 2024, the parties to the credit agreement entered into a Third Amendment (the “Third Amendment”) in connection with the repricing of the senior secured term loan facility and the senior secured revolving credit facility.
The interest rate margin applicable to borrowings under the senior secured term loan facility is USD Term SOFR plus an applicable margin which is dependent on the Company's net leverage ratio. At 31 December 2025, the applicable margin is 2.0% (which reflects the Third Amendment). The senior secured term loan facility is subject to a floor of 0.50%.
On 26 November 2025, the parties to the Credit Agreement entered into a Fourth Amendment (the “Fourth Amendment”) to reprice and extend the senior secured revolving credit facility.
As a result of the Fourth Amendment, the maturity was extended from a five-year term to a seven-year term ending 1 July 2028. Reflecting the Fourth Amendment, the interest rate margin applicable to borrowings under the revolving loan facility will be, at the option of the borrower, either (i) the applicable base rate plus an applicable margin of 0.35% or 0.00%, based on the Company’s current corporate family rating assigned by S&P of BB (or lower) or BB+ (or higher), respectively, or (ii) Term SOFR plus an applicable margin of 1.35%, 1.00%, 0.75%, 0.55%, or 0.40% based on the Company’s current corporate family rating assigned by S&P of BB (or lower), BB+, BBB-, BBB or BBB+ (or higher), respectively. In addition, lenders under the revolving loan facility are entitled to commitment fees as a percentage of the applicable margin at the time of drawing and utilisation fees dependent on the proportion of the facility drawn.
At 31 December 2025, $nil (31 December 2024: $nil) was outstanding under the revolving loan facility while there was also $nil (31 December 2024: $nil) in letters of credit given to landlords to guarantee lease arrangements under the senior secured revolving loan facility.
As the Company has variable rate debt, fluctuations in interest rates affect our business. We attempt to minimise interest rate risk by issuing fixed term debt to provide a mix of fixed and floating rate debt in the Company debt portfolio. Although the Company manages its interest rate exposure (at 31 December 2025, 73% of the Company's outstanding debt was at a fixed interest rate (31 December 2024: 73%)), significant changes in rates at which the Company can borrow could have a material adverse effect on our financial position and operating results.
Our financial results and ability to access cost effective debt may be adversely impacted if we do not maintain our current credit rating.
In Quarter Four, 2023, S&P Global Ratings (“S&P”) upgraded ICON to an investment grade credit rating of BBB- with a stable outlook. Further Moody's Investors Service upgraded all of ICON plc’s instrument ratings to Baa3 with a stable outlook. In Quarter Four, 2024 S&P affirmed ICON issuer ratings of BBB- and Moody's Investors Service changed the outlook from stable to positive. As at 19 February 2026, Moody's affirmed ICON plc’s instrument ratings of Baa3 however changed the outlook to stable from positive. Our financial results and ability to access cost effective debt may be adversely impacted if we do not maintain our current credit rating.
Appendix A: Risk Factors (continued)
Risk Related to Political, Legal or Regulatory Environment
We may lose business opportunities as a result of healthcare reform and the expansion of managed care organisations.
Numerous governments, including the U.S. government, have undertaken efforts to control growing healthcare costs through legislation, regulation and voluntary agreements with medical care providers and drug companies. If these efforts are successful, pharmaceutical, biotechnology and medical device companies may react by spending less on research and development and therefore this could have a material adverse effect on our business.
In addition to healthcare reform proposals, the expansion of managed care organisations in the health care market may result in reduced spending on research and development. Managed care organisations' efforts to cut costs by limiting expenditures on pharmaceuticals and medical devices could result in pharmaceutical, biotechnology and medical device companies spending less on research and development. If this were to occur, we would have fewer business opportunities and our revenues could decrease, possibly materially.
Healthcare reform legislation, other changes in the healthcare industry and in healthcare spending could adversely affect our business model, financial condition or results of operations.
Our results of operations and financial conditions could be affected by changes in healthcare spending and policy. The healthcare industry is subject to changing political, regulatory and other influences. It is possible that legislation will be introduced and passed in the United States repealing, modifying or invalidating the current healthcare reform legislation, in whole or in part, and signed into law. Because of the continued uncertainty about the implementation of the current healthcare reform legislation, including the potential for further legal challenges or repeal of that legislation, we cannot quantify or predict with any certainty the likely impact of the current healthcare reform legislation or its repeal on the healthcare sector, on our customers and ultimately on our financial condition or results of operations.
On 16 August 2022, the US government enacted the Inflation Reduction Act of 2022 (the “IRA”), which among other things, authorises the U.S. Department of Health and Human Services to establish prices for certain single-source drugs and biologics within the Medicare programme, commencing in 2026. Furthermore, the IRA contains provisions which impose rebate obligations on manufacturers if price increases outpace inflation. On 12 May 2025, the Executive Order titled “Delivering Most-Favored-Nation Prescription Drug Pricing to American Patients” (“MFN”) was signed which aims to reduce drug costs in the U.S. Further, on 4 July 2025, the U.S. enacted the One Big Beautiful Bill Act (“OBBBA”) that reduced healthcare funding and eligibility. The full impact of these IRA provisions, the MFN executive order, and OBBBA on our customers in the biopharmaceutical industry remains uncertain, and any resultant pressure on our customers’ operating results could lead to a reduction in research and development spend and related outsourcing activities, which could have an adverse impact on our operating results and financial condition.
We cannot predict the impact of any executive orders or regulatory changes that may become effective or enacted by the current administration in the United States.
Our international operations expose us to risks as a result of changes in global political conditions which could adversely affect our results of operations.
Political and/or financial instability and armed conflict in various regions of the world, including, but not limited to, Ukraine, Israel and the conflict area in the Middle East, can lead to sanctions, economic uncertainty and currency exchange rate fluctuations and may interrupt our operations in those areas, which may adversely impact our results of operations. While these situations are subject to change, there remains the possibility of additional and harsher sanctions if a conflict intensifies. If that were to happen, our operations in the impacted region may be severely curtailed or eliminated, which could adversely affect our results of operations. In addition, if a current conflict broadens or further escalates, our operations may be severely curtailed, which could adversely affect our results of operations.
We may lose business as a result of changes in the regulatory environment.
Various regulatory bodies throughout the world may enact legislation, rules and guidance which could introduce changes to the regulatory environment for drug development and research. The adoption and implementation of such legislation, rules and guidance is difficult to predict and therefore could have a material adverse effect on our business.
Failure to comply with the regulations and requirements of the U.S. Food and Drug Administration and other regulatory authorities could result in substantial penalties and/or loss of business.
The U.S. Food and Drug Administration, (“FDA”), and other regulatory and government authorities and agencies inspect and audit us from time to time to ensure that we comply with their regulations and guidelines, including environmental, health and safety matters, and other requirements imposed in connection with the performance of government contracts. We must comply with the applicable regulatory requirements governing the conduct of clinical trials and contracting with the government in all countries in which we operate.
Appendix A: Risk Factors (continued)
If we, or vendors we engage, fail to comply with any of these requirements we could suffer some or all of:
•termination of or delay in any research;
•disqualification of data;
•denial of the right to conduct business;
•criminal penalties;
•financial penalties;
•other enforcement actions including debarment from government contracts;
•loss of clients and/or business; and
•litigation from clients and/or patients and/or regulatory authorities and/or other affected third parties, and resulting material penalties, damages and costs.
We are subject to political, regulatory, operational and legal risks associated with our international operations.
We believe we are one of a small group of organisations with the capability and expertise to conduct clinical trials on a global basis. We believe that this capability to provide our services globally in most major and developing pharmaceutical markets enhances our ability to compete for new business from large multinational pharmaceutical, biotechnology and medical device companies. We have expanded geographically in the past and intend to continue expanding in regions that have the potential to increase our client base or increase our investigator and patient populations. However, emerging market operations may present several risks, including civil disturbances, health concerns, cultural differences such as employment, regulatory and business practices, compliance with economic sanctions laws and regulations, volatility in gross domestic product, economic and governmental instability, the potential for nationalisation of private assets and the imposition of exchange controls. In addition, operating globally means the Company faces the challenges associated with coordinating its services across different countries, time zones and cultures.
Changes in the political and regulatory environment in the markets in which we operate such as price, exchange controls or tariffs could impact our revenue and profitability and could lead to penalties, sanctions and reputational damages if we are not compliant with those regulations. Political uncertainty and a lack of institutional continuity in some of the emerging, developing or other countries in which we operate could affect the orderly operation of markets in these economies. In addition, in countries with a large and complicated structure of government and administration, national, regional, local and other governmental bodies may issue inconsistent decisions and opinions that could increase our cost of regulatory compliance and/or have a material adverse effect on our business. For instance, the US has a complex and evolving framework of tariffs on imports from Canada, Mexico and China. The ongoing conflict in Ukraine has resulted in economic sanctions and export controls environment applicable to our business operations in the region (including Russia and Belarus) as a result of additional trade compliance measures, including those enacted by the United States, United Kingdom and European Union. These economic sanctions and export controls restrict our ability to do business with sanctioned entities, require additional compliance resources, and could have a material adverse effect on the results of our operations. We continue to monitor developments in other regions, including the Middle East and China, and will assess any impact of trade compliance measures, or other restrictions, on our business.
Uncertainty of the legal environment could also limit our ability to enforce our rights. In certain emerging and developing countries, we enjoy less comprehensive protection for some of our rights, including intellectual property rights, which could undermine our competitive position. Proceedings to enforce our future patent rights, if any, in foreign jurisdictions could result in substantial cost and divert our efforts and attention from other aspects of our business.
If any of the above risks or similar risks associated with our international operations were to materialise, our results of operations and financial condition could be materially adversely affected.
We operate in many different jurisdictions and we could be adversely affected by violations of anti-corruption laws, including the United States Foreign Corrupt Practices Act of 1977 (“FCPA”), UK Bribery Act of 2010 (“UK Bribery Act”) and similar anti-corruption laws in other jurisdictions as well as laws and regulations relating to trade compliance and economic sanctions.
The FCPA, UK Bribery Act and similar anti-corruption laws in other jurisdictions prohibit us and our officers, directors, employees and third parties acting on our behalf, including agents, from corruptly offering, promising, authorising, or providing anything of value to a “foreign official” for the purposes of influencing official decisions or obtaining or retaining business or otherwise obtaining favourable treatment. In addition, the FCPA imposes certain books, records and accounting control obligations on public companies and other issuers. The UK Bribery Act also prohibits “commercial” bribery and accepting bribes.
Our global business operations also must be conducted in compliance with applicable export controls and economic sanctions laws and regulations, including those administered by the U.S. Department of the Treasury’s (the “U.S. Treasury”) Office of Foreign Assets Control, the U.S. Department of State, the U.S. Department of Commerce, the United Nations Security Council, the European Union, His Majesty’s Treasury and other relevant trade compliance authorities.
Appendix A: Risk Factors (continued)
Our internal policies mandate compliance with these anti-corruption and trade compliance laws and regulations. We also operate in many jurisdictions in which bribery or corruption can be common and compliance with anti-bribery laws may conflict with local customs and practices. Despite our training and compliance programme safeguards, we cannot assure that our internal control policies, procedures and safeguards will protect us from acts in violation of anti-corruption and trade compliance laws and regulations committed by employees or other third parties associated with us and our continued expansion, including in developing countries, could increase such risk in the future. Violations of anti-corruption, economic sanctions and trade control laws and regulations, or even allegations of such violations, could disrupt our business and result in a material adverse effect on our financial condition, results of operations, cash flows and reputation. For example, violations of anti-corruption and trade compliance laws can result in restatements of, or irregularities in, our financial statements, disgorgement of profits, related shareholder lawsuits as well as severe criminal or civil sanctions. In some cases, companies that violate anti-corruption and trade compliance laws might be debarred by the U.S. government and/or lose their U.S. export privileges. In addition, the U.S. government or other governments may seek to hold us liable based on successor liability for violations of anti-corruption and trade compliance laws committed by companies that we acquire or in which we invest. Changes in anti-corruption and trade compliance laws or enforcement priorities could also result in increased compliance requirements and related costs which could materially adversely affect our business, financial condition, results of operations and cash flows. The increase in economic sanctions and trade controls, particularly relating to our ongoing operations in Russia, Ukraine and Belarus, has increased the amount of resources necessary to ensure compliance in this area.
Current and proposed laws and regulations regarding the protection of personal data could result in increased risks of liability or increased costs to us or could limit our service offerings.
ICON has a strong privacy posture, driven by the implementation of a core privacy governance strategy and the adoption of policies and procedures designed to help ensure that ICON, including our employees and contractors, can comply with applicable data protection laws (including, but not limited to, the General Data Protection Regulation (“GDPR”) (EU) 2016/679). Notwithstanding these measures, failure to comply with applicable data protection laws may occur and could result in increased risk of liability or increased costs to us or could limit our service offerings.
Administrative fines: The GDPR introduced a regime of administrative fines for data protection infringements and provided for a tiered penalty structure based on the nature of the infringement. The EU supervisory authorities for the GDPR can directly impose fines on organisations found to be in breach of the GDPR. Lower tier administrative fines allow for fines of up to 2% of worldwide turnover of the group in the preceding financial year. Higher tier administrative fines allow for fines of up to 4% of worldwide turnover of the group in the preceding financial year. Higher tier administrative fines are more likely to be levied for major infringements of the GDPR and core data protection principles (e.g. transparency, data retention, accountability).
Penalties: The GDPR also permits Member States to implement rules on other penalties applicable to infringements of the GDPR, in particular, for infringements which are not subject to administrative fines under the GDPR itself. Therefore, Member States may legislate for further fines or penalties that may be criminal in nature.
Any fines levied under the GDPR must be effective, proportionate, and dissuasive. Supervisory authorities have been strengthening enforcement activities across the EU in recent years in respect of breaches of GDPR. The risk of fines and penalties under the GDPR carries increased risk of liability to ICON and can result in increased costs and disruption to the delivery of our services.
Right to compensation of data subjects: In addition to the risk of administrative and criminal penalties, the GDPR also provides that any person who has suffered material or non-material damage as a result of an infringement of the GDPR shall have the right to receive compensation for the damage suffered, from the controller or processor responsible for the infringement. The level of award of damages is set by the competent court in the applicable EU Member State. This carries increased risk of liability for ICON.
Corrective Powers of the supervisory authorities: Each supervisory authority across the Member States of the EU also has corrective powers. Supervisory authorities have the power to order ICON to bring processing operations into compliance with the provisions of the GDPR in a specified manner within a specified time period, or to impose a temporary or definitive limitation including a ban on processing, and to order the suspension of data flows to a recipient in a third country or to an international organisation. Supervisory authorities also have powers to conduct audits and investigations of ICON and instruct ICON to take certain actions. The exercise of these powers by supervisory authorities has the potential to increase costs for ICON and cause disruption to the business and delivery of our services.
The foundational principles of the GDPR have helped shape the development of many other privacy laws globally. Internationally, data protection laws continue to be introduced at a rapid rate, with greater protections afforded to personal data than ever before, and greater risk of liability to organisations processing that personal data. As a global organisation, ICON must ensure that our privacy posture continues to adapt to these new laws and regulations.
Appendix A: Risk Factors (continued)
From a US perspective, the confidentiality, collection, use and disclosure of personal data, including clinical trial patient-specific information, is regulated at the federal and state level. The Federal Trade Commission, or FTC, is an independent U.S. law enforcement agency charged with protecting consumers and enhancing competition across broad sectors of the economy. The FTC’s authority with respect to data privacy and security comes from Section 5 of the FTC Act. The FTC uses its broad grant of authority to regulate data privacy and security, using including, but not limited to, requiring the implementation of comprehensive privacy and security programmes, biennial assessments by independent experts, monetary redress to consumers, and provision of robust notice and choice mechanisms to consumers. Similar laws exist at the state level, which are used by state attorneys general to enforce against privacy and security-related acts or practices deemed to be unfair or deceptive.
Certain US states have adopted a comprehensive consumer privacy law or a consumer health data privacy law that regulates how certain businesses collect, use, and disclose the personal information of consumers residing in the state. In general, these laws provide for certain consumer privacy rights and impose transparency standards for business data collection and processing practices. These laws have broad exemptions for personal information that constitutes protected health information under the Health Insurance Portability and Accountability Act of 1996 (“HIPAA”) and de-identified health data as defined under HIPAA. As a result, we do not expect to have compliance obligations under these laws with respect to most patient information we collect and process. However, we are required to comply with these consumer privacy laws insofar as we collect other categories of consumers’ personal information, which could include, for example, information about website visitors. These state consumer privacy laws are generally enforced by the respective state Attorney General. California’s law also includes a private right of action for certain data breaches. Other states are currently considering similar consumer privacy laws, which could impact our operations if enacted.
The US federal administrative simplification regulations under HIPAA require individuals’ written authorisation, in addition to any required informed consent, before protected health information may be used for research (unless an institutional review board has waived the authorisation requirement or another exception applies).
We are directly regulated by HIPAA as a “business associate” because we obtain individually identifiable health information from “covered entity” third parties that are subject to such regulations. We can be directly liable to the covered entity contractually for mishandling protected health information and, under HIPAA’s enforcement scheme, we can be subject to up to approximately $2.1 million per year in civil money penalties for multiple violations of the same HIPAA requirement in 2025. The per violation penalties and calendar year cap on penalties are adjusted annually for inflation under the Federal Civil Penalties Inflation Adjustment Act.
Additional legislation or regulation of this type might, among other things, require us to implement new security measures and processes which may require substantial expenditures or limit our ability to offer some of our services. Additionally, if we violate applicable laws, regulations or duties relating to the use, processing or security of personal data, we could be subject to civil liability or criminal prosecution, be forced to alter our business practices or suffer reputational harm.
Our employees may engage in misconduct or other improper activities, including noncompliance with regulatory standards and requirements, which could have a material adverse effect on our business.
We are exposed to the risk of employee fraud or other misconduct. Misconduct by employees could include intentional failures to comply with governmental regulations, comply with federal and state healthcare fraud and abuse laws and regulations, report financial information or data accurately or disclose unauthorised activities to us. In particular, sales, marketing and business arrangements in the healthcare industry are subject to extensive laws and regulations intended to prevent fraud, kickbacks, self-dealing and other abusive practices. These laws and regulations may restrict or prohibit a wide range of pricing, discounting, marketing and promotion, sales commission, customer incentive programmes and other business arrangements. Employee misconduct could also involve the improper use of information obtained in the course of clinical studies or data or documentation fraud or manipulation, which could result in regulatory sanctions and serious harm to our reputation. It is not always possible to identify and deter employee misconduct, and the precautions we take to detect and prevent misconduct may not be effective in controlling unknown or unmanaged risks or losses or in protecting us from governmental investigations or other actions or lawsuits stemming from a failure to be in compliance with such laws or regulations. If any such actions are instituted against us, and we are not successful in defending ourselves or asserting our rights, those actions could have a significant impact on our business and results of operations, including the imposition of significant fines or other sanctions.
Appendix A: Risk Factors (continued)
The failure to comply with our government contracts or applicable laws and regulations could result in, among other things, fines or other liabilities, and changes in government procurement regulations could adversely impact our business, results of operations or cash flows.
Revenues from our government customers are derived from sales to federal, state and local governmental departments and agencies through various contracts. Sales to public segment customers are highly regulated. Noncompliance with contract provisions, government procurement regulations or other applicable laws or regulations (including but not limited to the False Claims Act) could result in civil, criminal and administrative liability, including substantial monetary fines or damages, termination of government contracts or other public segment customer contracts, and suspension, debarment or ineligibility from doing business with the government and other customers in the public segment. In addition, contracts in the public segment are generally terminable at any time for convenience of the contracting agency or upon default. The effect of any of these possible actions by any governmental department or agency could adversely affect our business, results of operations or cash flows. In addition, the adoption of new or modified procurement regulations and other requirements may increase our compliance costs and reduce our gross margins, which could have a negative effect on our business, results of operations or cash flows.
Liability claims brought against us could result in payment of substantial damages, costs and liabilities and decrease our profitability.
We may face legal claims involving shareholder, consumers, clinical trial subjects, competitors, regulators and other parties. Litigation and other legal proceedings are inherently uncertain, and adverse rulings could occur, including monetary damages, or an injunction stopping us from engaging in business practices, or requiring other remedies, including, but not limited to, compulsory licensing of patents.
Customer Claims
If we breach the terms of an agreement with a customer (for example if we fail to comply with the agreement, all applicable regulations or Good Clinical Practice) this could result in claims against us for substantial damages which could have a material adverse effect on our business. As we provide staff to deliver our services, there is a risk that our management, quality and control structures fail to quickly detect a failure by one or more employees or contractors to comply with all applicable regulations and Good Clinical Practice and our internal requirements and standard operating procedures thereby exposing us to the risk of claims by customers.
Claims relating to Investigators
We contract with physicians who serve as investigators in conducting clinical trials to test new drugs on their patients. These patients will generally have underlying health conditions and this testing creates the risk of liability for personal injury to the patient or the risk of a serious adverse event occurring. Although investigators are generally required by law to maintain their own liability insurance, we could be named in lawsuits and incur expenses arising from any professional malpractice or other actions brought against the investigators with whom we contract.
Indemnification from Customers
Indemnifications provided by our customers against the risk of liability for personal injury to or death of the patients arising from a study drug vary from customer to customer and from trial to trial and may not be sufficient in scope or amount, or our customer may not have the financial ability to fulfil their indemnification obligations. Furthermore, we would be liable for our own negligence and negligence of our employees which could lead to litigation from customers or action or enforcement by regulatory authorities.
Insurance
We maintain what we believe is an appropriate level of worldwide Professional Liability/Error and Omissions Insurance. In the future we may be unable to maintain or continue our current insurance coverage on the same or similar terms. If we are liable for a claim or settlement that is beyond the level of insurance coverage, we may be responsible for paying all or part of any award or settlement amount. Also, the insurance policies contain exclusions which mean that the policy will not respond or provide cover in certain circumstances.
Claims to Date
To date, we have not been subject to any liability claims that are expected to have a material effect on our business; however, there can be no assurance that we will not become subject to such claims in the future or that such claims will not have a material effect on our business.
Appendix A: Risk Factors (continued)
Sustainability matters may impact our business and reputation.
Sustainability matters continue to attract significant attention from stakeholders, including customers, investors, regulators, and ratings agencies. Companies are increasingly assessed on their sustainability performance and long‑term practices. Customers may also impose specific sustainability‑related requirements, and failure to meet these expectations could adversely affect our ability to win or retain business.
Regulatory focus on sustainability matters is also increasing globally. This has resulted in the adoption of legal and regulatory requirements designed to mitigate the effects of climate change on the environment, as well as legal and regulatory requirements requiring climate, human rights and supply chain-related disclosures. If new laws or regulations are more stringent than current legal or regulatory requirements, we may experience increased compliance burdens and costs to meet such obligations.
Our selection of voluntary disclosure frameworks and standards, and the interpretation or application of those frameworks and standards, may change from time to time or may not meet the expectations of investors or other stakeholders. Our ability to achieve our sustainability expectations and commitments is subject to numerous risks, many of which are outside of our control.
Risk Related to Our Common Stock
Volatility in the market price of our common stock could lead to losses by investors.
The market price of our common stock has experienced volatility in the past and may experience volatility in the future which could lead to losses for investors. Factors impacting volatility in the market price of our common stock include, among others:
•general market and economic conditions;
•public perception of biotechnology and pharmaceutical companies;
•our results of operations;
•issuance of new or changed securities analysts’ reports or recommendations;
•developments impacting the industry or our competitors;
•declines in the market prices of stocks generally;
•strategic actions by us or our competitors;
▪announcements by us or our competitors of significant contracts, new products, acquisitions, joint marketing relationships, joint ventures, other strategic relationships or capital commitments;
•the public's reaction to press releases, other public announcements by us or third parties, including our filings with the SEC;
•guidance, if any, that we provide to the public, any changes in this guidance or failure to meet this guidance;
•changes in the credit rating of our debt;
•sale, or anticipated sale, of large blocks of our stock;
•additions or departures of key personnel;
•regulatory or political developments;
•our performance on sustainability matters;
•litigation and governmental investigations;
•changing economic conditions;
•exchange rate fluctuations;
•changes in accounting principles; and
•other events or factors, including those resulting from natural disasters, war, acts of terrorism or responses to those events.
In addition, stock markets have from time to time experienced significant price and volume fluctuations unrelated to the operating performance of particular companies. Future fluctuations in stock markets may lead to volatility in the market price of our common stock which could lead to losses by investors.
An investor's return may be reduced if we lose our foreign private issuer status.
We are a “foreign private issuer,” as such term is defined in Rule 405 under the U.S. Securities Act 1933, and, therefore, we are not required to file quarterly reports on Form 10-Q or current reports on Form 8-K with the SEC. In addition, the proxy rules and Section 16 short-swing profit recapture rules are not applicable to us. Recently, the United States passed new legislation that imposes Section 16 reporting obligations on our directors and officers. More regulatory changes could follow. If we lose our status as a foreign private issuer by our election or otherwise and we become subject to the full reporting regime of the United States securities laws, we will be subject to additional reporting obligations and proxy solicitation obligations under the Exchange Act and our officers, directors and 10% shareholders would become subject to the short-swing profit rules. The imposition of these reporting rules would increase our costs and the obligations of those affected by the short-swing rules.
Appendix A: Risk Factors (continued)
We do not expect to pay any cash dividends for the foreseeable future.
We currently do not expect to declare dividends on our common stock and have not done so in the past. We continue to anticipate that our earnings will be used to provide working capital, to support operations, to make debt repayments and to finance the growth and development of our business. They may also be used to continue our share repurchase programme. Any determination to declare or pay dividends in the future will be at the discretion of our board of directors, subject to relevant laws and dependent on a number of factors, including our earnings, capital requirements and overall financial condition. Therefore, the only opportunity for shareholders to achieve a return on their investment may be if the market price of our common stock appreciates and shares are sold at a profit. The market price for our common stock may not appreciate and may fall below the price shareholders paid for such common stock.
A future transfer of ICON ordinary shares, other than one effected by means of the transfer of book entry interests in the Depositary Trust Company (“DTC”), may be subject to Irish stamp duty.
Transfers of ICON ordinary shares effected by means of the transfer of book entry interests in the DTC should not be subject to Irish stamp duty where ICON ordinary shares are traded through DTC, either directly or through brokers that hold such shares on behalf of customers through DTC. However, if ICON ordinary shares are held as of record rather than beneficially through DTC, any transfer of ICON ordinary shares could be subject to Irish stamp duty (currently at the rate of 1% of the higher of the price paid or the market value of the shares acquired). Payment of Irish stamp duty is generally a legal obligation of the transferee. The potential for Irish stamp duty to arise could adversely affect the price of ICON ordinary shares.
Forward-looking statements
Statements included herein which are not historical facts are forward-looking statements. Such forward-looking statements are made pursuant to the safe harbour provisions of the U.S. Private Securities Litigation Reform Act of 1995 (the “PSLRA”). Examples of forward-looking statements include, but are not limited to, statements regarding the following: the remediation of material weaknesses in the Company’s internal control over financial reporting and the implementation of the Group’s corrective action plan; the Group’s expectations regarding business momentum, market opportunity, demand trends, growth, and commercial performance; and the Group’s expectations with respect to its long-term value creation and competitive positioning. You can identify many forward-looking statements by words such as “aims,” “anticipates,” “believes,” “continues,” “could,” “estimates,” “expects,” “focused,” “guidance,” “intends,” “look,” “may,” “opportunities,” “plans,” “positions,” “potential,” “predicts,” “projects,” “seeks,” “should,” “will,” “would” and other similar expressions and the negatives of such expressions. However, not all forward-looking statements contain these words. These statements are based on management's current expectations and information currently available, including current economic and industry conditions. The forward-looking statements involve a number of risks and uncertainties and are subject to change at any time. In the event such risks or uncertainties materialise, our results could be materially adversely affected. The risks and uncertainties include, but are not limited to, dependence on the pharmaceutical industry and certain clients, the need to regularly win projects and then to execute them efficiently and correctly, the challenges presented by rapid growth, competition and the continuing consolidation of the industry, the impact of market conditions on demand for the Group's services, risks related to the Group's ability to execute on its commercial strategy and maintain relationships with large pharmaceutical customers, risks relating to the Group's strategic partnerships, the dependence on certain key executives, changes in the regulatory environment, exchange rate fluctuations, inflation and rising labour costs, the effect of material weaknesses on our internal control over financial reporting, the risk that material weaknesses in the Group's internal control over financial reporting are not remediated on the timeline expected or at all, and other factors identified in the Company’s United States Securities and Exchange Commission filings and this Annual Report. The Group’s forward-looking statements speak only as of the date of this report or as of the date they are made, and the Group undertakes no obligation to update its forward-looking statements.