Pay vs Performance Disclosure - USD ($)
|
12 Months Ended |
Mar. 31, 2026 |
Mar. 31, 2025 |
Mar. 31, 2024 |
Mar. 31, 2023 |
Mar. 31, 2022 |
| Pay vs Performance Disclosure |
|
|
|
|
|
| Pay vs Performance Disclosure, Table |
| | | | | | | | | | | | | | | | | | | | | | | | | | | | | | | | | | | | | | | | Year(1) | SCT Total
for First PEO
($) | CAP for
First PEO(2) ($) | Avg. SCT
Total for
non-PEO NEOs(2) ($) | Avg. CAP
to non-PEO
NEOs(2) ($) | Value of Initial Fixed
$100 | Net Income
($ in Thousands) | Adjusted EBIT(4) ($ in Thousands) | | TSR ($) | Peer Group
TSR (3) ($) | | (a) | (b) | (c) | (d) | (e) | (f) | (g) | (h) | | | | | | | | | | | | | | 2026 | 5,971,066 | 4,398,298 | 1,684,222 | 1,408,381 | 28.84 | 183.32 | (229,535) | 94,865 | | | 2025 | 5,325,938 | (1,610,341) | 1,360,850 | 166,465 | 33.03 | 166.99 | (5,138) | 102,300 | | 2024 | 5,799,250 | 7,011,006 | 1,479,373 | 1,769,549 | 86.39 | 137.71 | 46,625 | 119,238 | | 2023 | 4,973,892 | 3,543,606 | 1,622,384 | 1,421,836 | 71.39 | 97.58 | 48,429 | 105,869 | | 2022 | 4,067,021 | 2,562,396 | 1,347,394 | 788,702 | 80.77 | 92.69 | 29,660 | 95,589 | |
|
|
|
|
|
| Company Selected Measure Name |
Adjusted EBIT
|
|
|
|
|
| Named Executive Officers, Footnote |
The PEOs and the Non-PEO NEOs for the indicated years were as follows: | | | | | | | | | | | | Year | First PEO | Other Non-PEOs | | | | | 2026 | Mr. Wilson | Messrs. Chintapalli, Korman, Rustowicz and Ms. Williams | | 2025 | Mr. Wilson | Messrs. Brant, Chintapalli, Korman, Rustowicz and Ms. Williams | 2024 | Mr. Wilson | Messrs. Brant, Korman, Rustowicz and Schadeberg | 2023 | Mr. Wilson | Messrs. Brant, Korman, Rustowicz and Schadeberg | 2022 | Mr. Wilson | Messrs. Brant, Korman, Rustowicz and Wozniak |
|
|
|
|
|
| Peer Group Issuers, Footnote |
For the relevant fiscal year, represents the cumulative TSR (the “Peer Group TSR”) of the Dow Jones U.S. Diversified Industrials Index.
|
|
|
|
|
| PEO Total Compensation Amount |
$ 5,971,066
|
$ 5,325,938
|
$ 5,799,250
|
$ 4,973,892
|
$ 4,067,021
|
| PEO Actually Paid Compensation Amount |
$ 4,398,298
|
(1,610,341)
|
7,011,006
|
3,543,606
|
2,562,396
|
| Adjustment To PEO Compensation, Footnote |
DAVID J. WILSON (FIRST PRINCIPAL EXECUTIVE OFFICER) | | | | | | | | | | | | | | | | | | | | | | | | | | | | | | | | | | | | | | | | | | | | | | | | | | Year | Summary
Compensation
Table
Total ($) | Minus:
Change
in
Present
Value of
NQDC ($) | Minus:
Change
in
Present
Value of
Pension ($) | Plus:
Pension
Service
Costs
Attributable
to the
Applicable
Year ($) | Minus:
Grant Date
Fair Value
of Equity
Awards
Granted
During
Applicable
Year ($) | | Plus:
Year-
End Fair
Value of
Equity
Awards
Granted
During
Applicable
Year
($) | Plus:
Fair Value of Awards
Granted and
Vested in
Applicable
Year ($) | Plus:
Change in
Fair Value
as of Year-
End of Any
Prior-Year
Awards that
Remain
Unvested as
of Year-End ($) | Plus:
Change in
Fair Value as of Vesting Date of Any Prior-Year Awards that Vested During Applicable Year ($) | Compensation
Actually Paid ($) | | | | | | | | | | | | | | | | 2026 | 5,971,066 | 14,146 | — | — | 4,036,978 | | 3,229,963 | — | (770,061) | 18,454 | 4,398,298 | | | 2025 | 5,325,938 | 9,951 | — | — | 3,909,959 | | 1,390,504 | — | (4,340,800) | (66,074) | (1,610,341) | | 2024 | 5,799,250 | 5,491 | — | — | 3,495,828 | | 4,352,194 | — | 448,465 | (87,584) | 7,011,006 | | 2023 | 4,973,892 | 2,900 | — | — | 2,816,047 | | 3,501,035 | — | (1,616,943) | (495,431) | 3,543,606 | | 2022 | 4,067,021 | 1,896 | — | — | 2,362,446 | | 1,840,059 | — | (993,714) | 13,371 | 2,562,396 | |
|
|
|
|
|
| Non-PEO NEO Average Total Compensation Amount |
$ 1,684,222
|
1,360,850
|
1,479,373
|
1,622,384
|
1,347,394
|
| Non-PEO NEO Average Compensation Actually Paid Amount |
$ 1,408,381
|
166,465
|
1,769,549
|
1,421,836
|
788,702
|
| Adjustment to Non-PEO NEO Compensation Footnote |
AVERAGE OF NON-PEO NEOs | | | | | | | | | | | | | | | | | | | | | | | | | | | | | | | | | | | | | | | | | | | | | | | | Year | Summary
Compensation
Table Total ($) | Minus:
Change
in Present
Value of
NQDC ($) | Minus:
Change in Present
Value of
Pension ($) | Plus:
Pension
Service
Costs
Attributable
to the
Applicable
Year
($) | Minus:
Grant Date
Fair Value
of Equity
Awards
Granted
During
Applicable
Year ($) | Plus: Year
End Fair
Value of
Equity
Awards
Granted
During
Applicable
Year
($) | Plus: Fair
Value of
Awards
Granted
and
Vested in
Applicable
Year
($) | Plus:
Change in
Fair Value
as of Year
End of Any
Prior-Year
Awards that
Remain
Unvested as
of Year-End
($) | Plus:
Change in
Fair Value as
of Vesting
Date of Any
Prior-Year
Awards that
Vested During
Applicable
Year
($) | Compensation
Actually Paid ($) | | | | | | | | | | | | | | | 2026 | 1,684,222 | 7,983 | — | — | 695,916 | 556,681 | — | (131,863) | 3,240 | 1,408,381 | | | 2025 | 1,360,850 | 21,058 | — | — | 636,684 | 212,973 | 10,280 | (719,962) | (39,934) | 166,465 | | 2024 | 1,479,373 | 13,476 | 53 | — | 668,025 | 831,669 | — | 157,778 | (17,717) | 1,769,549 | | 2023 | 1,622,384 | 8,205 | — | — | 814,420 | 701,707 | — | 33,962 | (113,592) | 1,421,836 | | 2022 | 1,347,394 | 6,473 | — | — | 668,073 | 520,369 | — | (404,240) | (275) | 788,702 | |
|
|
|
|
|
| Compensation Actually Paid vs. Total Shareholder Return |
|
|
|
|
|
| Compensation Actually Paid vs. Net Income |
|
|
|
|
|
| Compensation Actually Paid vs. Company Selected Measure |
|
|
|
|
|
| Total Shareholder Return Vs Peer Group |
|
|
|
|
|
| Total Shareholder Return Amount |
$ 28.84
|
33.03
|
86.39
|
71.39
|
80.77
|
| Peer Group Total Shareholder Return Amount |
183.32
|
166.99
|
137.71
|
97.58
|
92.69
|
| Net Income (Loss) |
$ (229,535,000)
|
$ (5,138,000)
|
$ 46,625,000
|
$ 48,429,000
|
$ 29,660,000
|
| Company Selected Measure Amount |
94,865,000
|
102,300,000
|
119,238,000
|
105,869,000
|
95,589,000
|
| PEO Name |
Mr. Wilson
|
Mr. Wilson
|
Mr. Wilson
|
Mr. Wilson
|
Mr. Wilson
|
| Additional 402(v) Disclosure |
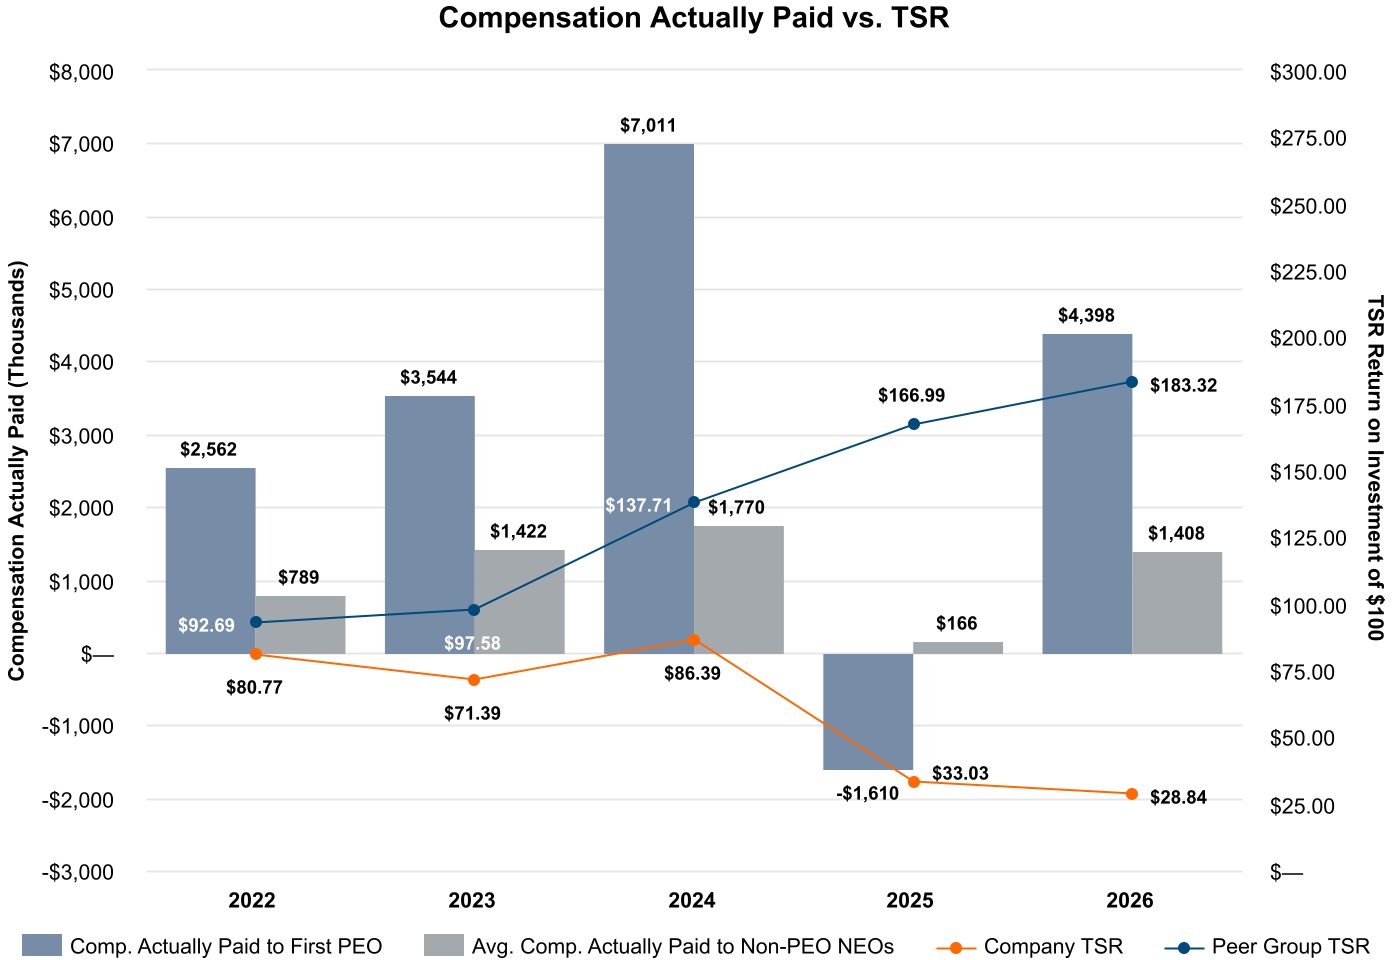
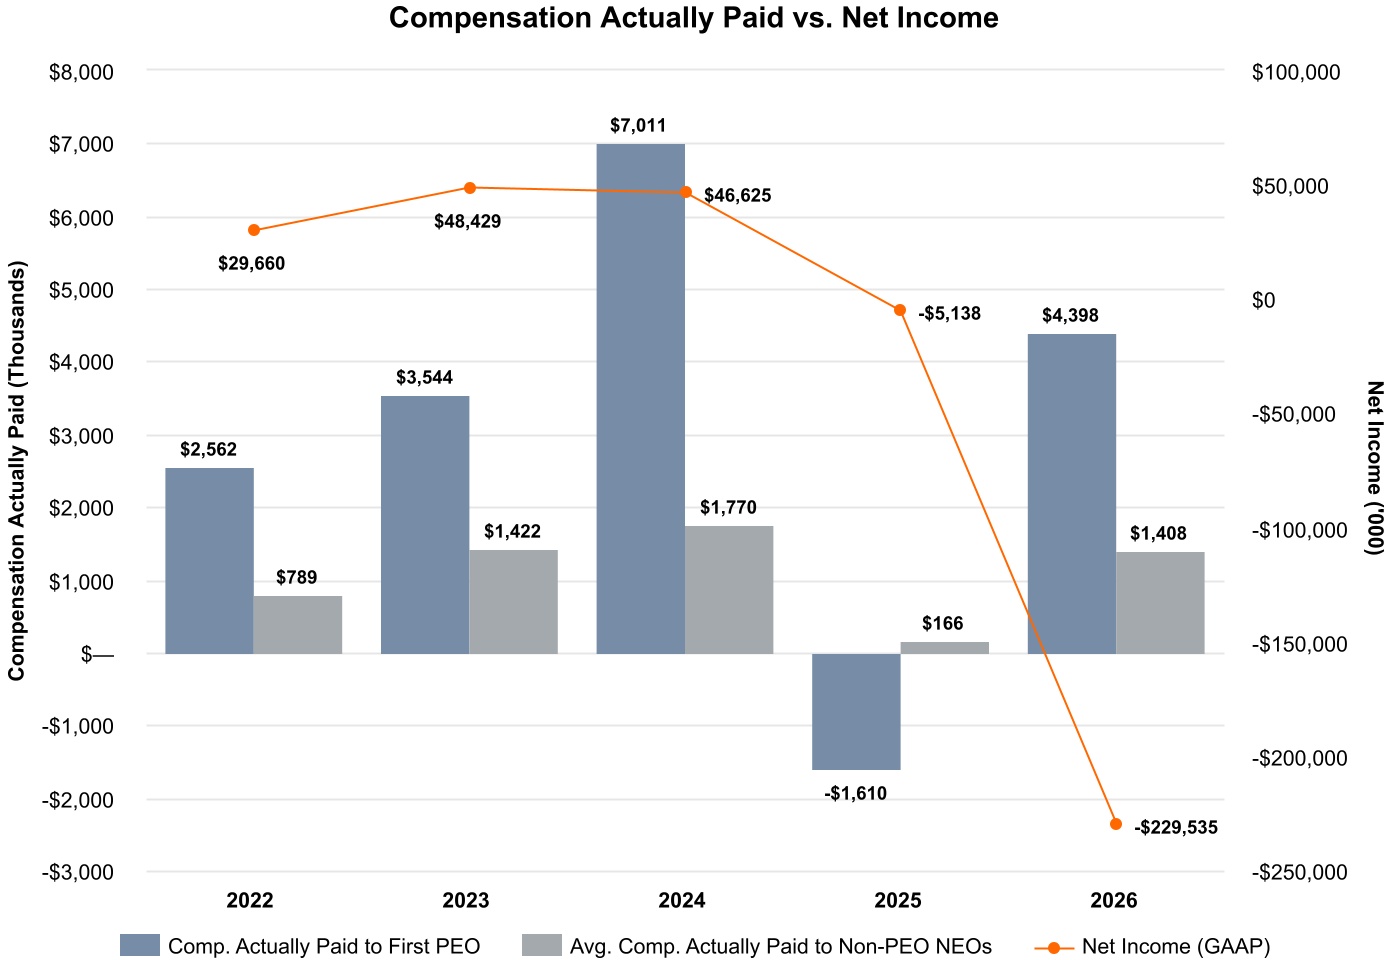
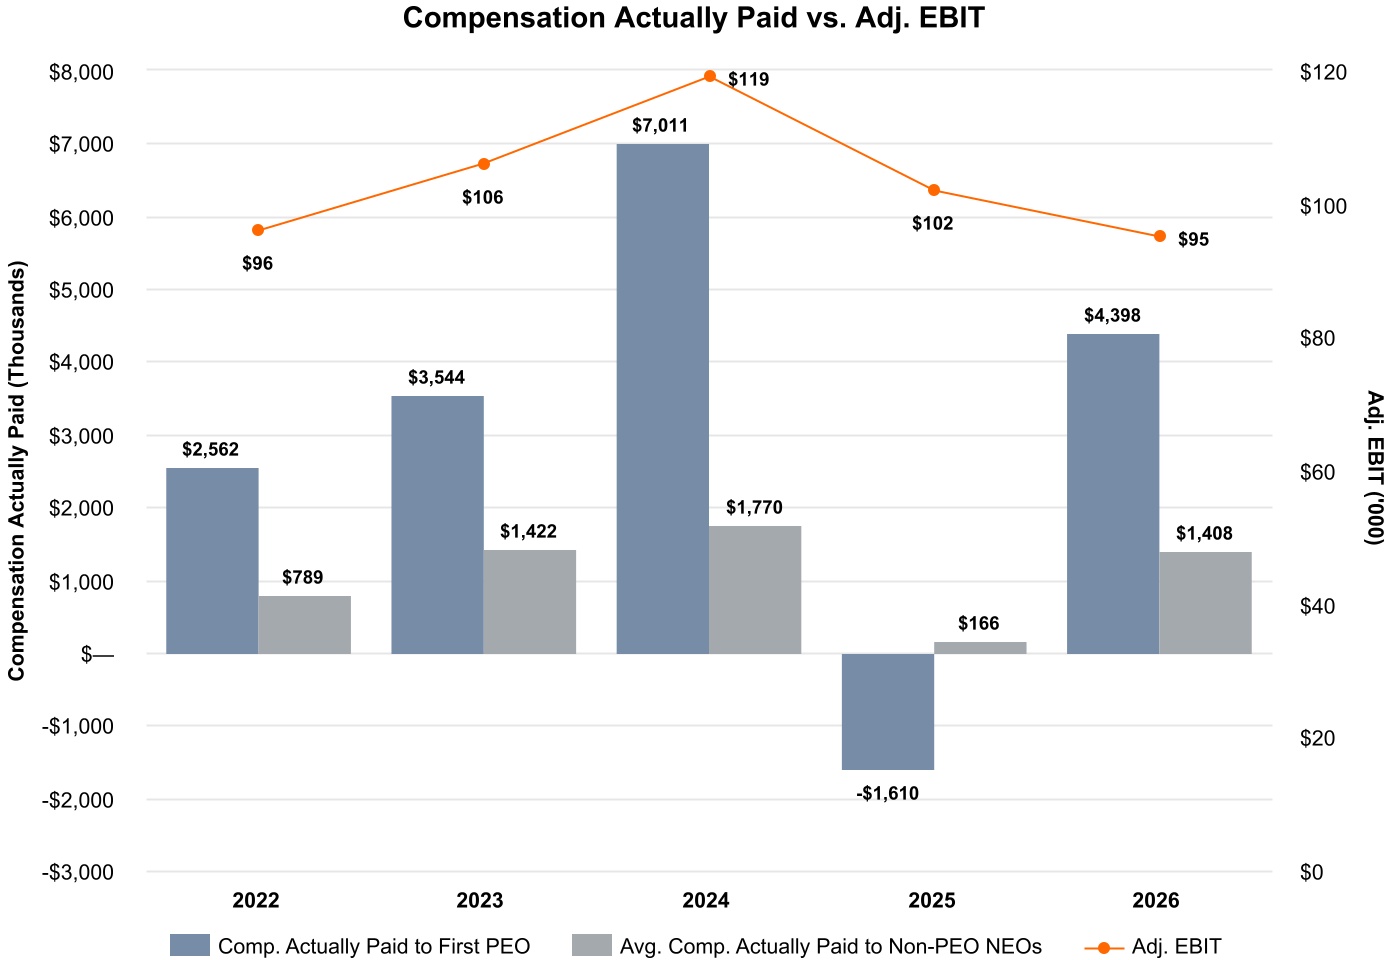
Amounts represent compensation actually paid to our PEOs and the average compensation actually paid to our non-PEO NEOs for the relevant fiscal year, as determined under SEC rules (and described below). The graphs below describe the relationship between the compensation actually paid to our PEOs and the average of the compensation actually paid to our Non-PEO NEOs and (i) our cumulative TSR, (ii) our net income and (iii) our Adjusted EBIT, in each case, for the fiscal years ended March 31, 2022, 2023, 2024, 2025 and 2026. In addition, the first graph below compares our cumulative TSR and peer group cumulative TSR for the fiscal years ended March 31, 2022, 2023, 2024, 2025 and 2026. TSR amounts reported in the graph assume an initial fixed investment of $100 and that all dividends, if any, were reinvested. The graphs above demonstrate that over the measurement period, Compensation Actually Paid (CAP) for the PEO and Non-PEO NEOs generally trended directionally with the Company’s cumulative TSR, net income and Adjusted EBIT. During the time period, changes in CAP were largely attributable to the fluctuation in value of outstanding equity awards, which correlate with increases and decreases in stock price and cumulative TSR. PAY VERSUS PERFORMANCE TABULAR LIST We believe the following performance measures represent the most important financial performance measures used by us to link compensation actually paid to our PEOs and Non-PEO NEOs for the fiscal year ended March 31, 2026. The measures in this list are not ranked: •Adjusted EBIT •Adjusted Free Cash Flow •Adjusted ROIC For additional details regarding our most important financial performance measures, please see the sections titled “Elements of our Compensation Program for NEOs” and “Components of Compensation” in our Compensation Discussion and Analysis elsewhere in this proxy statement.
|
|
|
|
|
| Measure:: 1 |
|
|
|
|
|
| Pay vs Performance Disclosure |
|
|
|
|
|
| Name |
Adjusted EBIT
|
|
|
|
|
| Non-GAAP Measure Description |
In accordance with SEC rules, the Company is required to include in the Pay versus Performance table the “most important” financial performance measure (as determined by the Company) used to link compensation actually paid to our PEOs and Non-PEO NEOs to Company performance for the most recently completed fiscal year. The Company determined that Adjusted EBIT, which is a non-GAAP measure included in our incentive program, meets this requirement and therefore, we have included this performance measure in the Pay versus Performance table. Adjusted EBIT is defined as operating income as determined in accordance with GAAP adjusted for each of the adjustments used in the computation of Adjusted EBITDA other than depreciation and amortization expense,
|
|
|
|
|
| Measure:: 2 |
|
|
|
|
|
| Pay vs Performance Disclosure |
|
|
|
|
|
| Name |
Adjusted Free Cash Flow
|
|
|
|
|
| Measure:: 3 |
|
|
|
|
|
| Pay vs Performance Disclosure |
|
|
|
|
|
| Name |
Adjusted ROIC
|
|
|
|
|
| PEO | Aggregate Change in Present Value of Accumulated Benefit for All Pension Plans Reported in Summary Compensation Table |
|
|
|
|
|
| Pay vs Performance Disclosure |
|
|
|
|
|
| Adjustment to Compensation, Amount |
$ 0
|
$ 0
|
$ 0
|
$ 0
|
$ 0
|
| PEO | Pension Adjustments Service Cost |
|
|
|
|
|
| Pay vs Performance Disclosure |
|
|
|
|
|
| Adjustment to Compensation, Amount |
0
|
0
|
0
|
0
|
0
|
| PEO | Aggregate Grant Date Fair Value of Equity Award Amounts Reported in Summary Compensation Table |
|
|
|
|
|
| Pay vs Performance Disclosure |
|
|
|
|
|
| Adjustment to Compensation, Amount |
(4,036,978)
|
(3,909,959)
|
(3,495,828)
|
(2,816,047)
|
(2,362,446)
|
| PEO | Year-end Fair Value of Equity Awards Granted in Covered Year that are Outstanding and Unvested |
|
|
|
|
|
| Pay vs Performance Disclosure |
|
|
|
|
|
| Adjustment to Compensation, Amount |
3,229,963
|
1,390,504
|
4,352,194
|
3,501,035
|
1,840,059
|
| PEO | Year-over-Year Change in Fair Value of Equity Awards Granted in Prior Years That are Outstanding and Unvested |
|
|
|
|
|
| Pay vs Performance Disclosure |
|
|
|
|
|
| Adjustment to Compensation, Amount |
(770,061)
|
(4,340,800)
|
448,465
|
(1,616,943)
|
(993,714)
|
| PEO | Vesting Date Fair Value of Equity Awards Granted and Vested in Covered Year |
|
|
|
|
|
| Pay vs Performance Disclosure |
|
|
|
|
|
| Adjustment to Compensation, Amount |
0
|
0
|
0
|
0
|
0
|
| PEO | Change in Fair Value as of Vesting Date of Prior Year Equity Awards Vested in Covered Year |
|
|
|
|
|
| Pay vs Performance Disclosure |
|
|
|
|
|
| Adjustment to Compensation, Amount |
18,454
|
(66,074)
|
(87,584)
|
(495,431)
|
13,371
|
| PEO | Aggregate Change In Present Value Of NQDC [Member] |
|
|
|
|
|
| Pay vs Performance Disclosure |
|
|
|
|
|
| Adjustment to Compensation, Amount |
(14,146)
|
(9,951)
|
(5,491)
|
(2,900)
|
(1,896)
|
| Non-PEO NEO | Aggregate Change in Present Value of Accumulated Benefit for All Pension Plans Reported in Summary Compensation Table |
|
|
|
|
|
| Pay vs Performance Disclosure |
|
|
|
|
|
| Adjustment to Compensation, Amount |
0
|
0
|
(53)
|
0
|
0
|
| Non-PEO NEO | Pension Adjustments Service Cost |
|
|
|
|
|
| Pay vs Performance Disclosure |
|
|
|
|
|
| Adjustment to Compensation, Amount |
0
|
0
|
0
|
0
|
0
|
| Non-PEO NEO | Aggregate Grant Date Fair Value of Equity Award Amounts Reported in Summary Compensation Table |
|
|
|
|
|
| Pay vs Performance Disclosure |
|
|
|
|
|
| Adjustment to Compensation, Amount |
(695,916)
|
(636,684)
|
(668,025)
|
(814,420)
|
(668,073)
|
| Non-PEO NEO | Year-end Fair Value of Equity Awards Granted in Covered Year that are Outstanding and Unvested |
|
|
|
|
|
| Pay vs Performance Disclosure |
|
|
|
|
|
| Adjustment to Compensation, Amount |
556,681
|
212,973
|
831,669
|
701,707
|
520,369
|
| Non-PEO NEO | Year-over-Year Change in Fair Value of Equity Awards Granted in Prior Years That are Outstanding and Unvested |
|
|
|
|
|
| Pay vs Performance Disclosure |
|
|
|
|
|
| Adjustment to Compensation, Amount |
(131,863)
|
(719,962)
|
157,778
|
33,962
|
(404,240)
|
| Non-PEO NEO | Vesting Date Fair Value of Equity Awards Granted and Vested in Covered Year |
|
|
|
|
|
| Pay vs Performance Disclosure |
|
|
|
|
|
| Adjustment to Compensation, Amount |
0
|
10,280
|
0
|
0
|
0
|
| Non-PEO NEO | Change in Fair Value as of Vesting Date of Prior Year Equity Awards Vested in Covered Year |
|
|
|
|
|
| Pay vs Performance Disclosure |
|
|
|
|
|
| Adjustment to Compensation, Amount |
3,240
|
(39,934)
|
(17,717)
|
(113,592)
|
(275)
|
| Non-PEO NEO | Aggregate Change In Present Value Of NQDC [Member] |
|
|
|
|
|
| Pay vs Performance Disclosure |
|
|
|
|
|
| Adjustment to Compensation, Amount |
$ (7,983)
|
$ (21,058)
|
$ (13,476)
|
$ (8,205)
|
$ (6,473)
|