Financial Risk Management
Mar. 31, 2026
47 |
FINANCIAL RISK MANAGEMENT |
The Group classifies risks into the following categories: credit risk, market risk, liquidity risk, operational risk, conduct risk, reputational risk, model risk and environmental and social risk. This note presents information about the Group’s exposure to credit risk, market risk, and liquidity risk, and its policies and processes for measuring and managing these risks.
Risk Management System
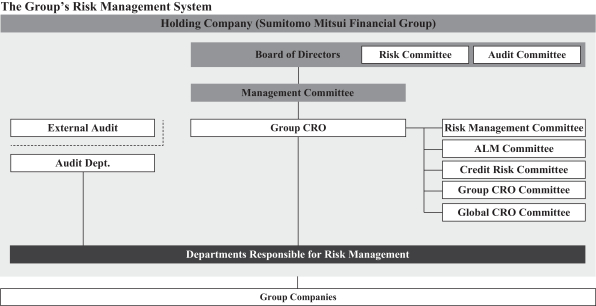
Based on the recognition of the importance of risk management, top management is actively involved in the risk management process, and systems are in place for verifying the effectiveness and appropriateness of this process. Specifically, the Group-wide basic policies for risk management are determined by the Management Committee before being authorized by the board of directors, and regular reports are issued to the board of
directors by the Group Chief Risk Officer (“CRO”) with regard to the status of risk management based on these policies.
Three lines of defense have been defined, and the Group has clarified related roles and responsibilities of relevant divisions. With these provisions in place, risk management systems have been established based on the characteristics of particular businesses, and measures are being put in place to strengthen and improve the effectiveness of these systems in accordance with these basic policies for risk management.
Furthermore, the Group is strengthening Group-wide risk management systems through the Group CRO Committee and the Global CRO Committee.
The diagram below represents the risk management system of the Group.
Credit Risk
Credit risk is the risk of incurring losses from decline or loss of the value of an asset (including
off-balance
sheet items) that is caused by a credit event including but not limited to the deterioration of financial condition of a borrower. Overseas credits transactions also entail country risk, which is closely related to credit risk. Country risk is the risk of incurring losses caused by changes in political or economic conditions. Credit exposures arise primarily from lending activities such as loans and advances, acquiring investment securities, derivative transactions, and off-balance
sheet transactions such as unused portion of loan commitments. Credit risk management system
Credit risk is the most significant risk to which the Group is exposed. The purpose of credit risk management is to keep the credit risk exposure to a permissible level relative to capital, to maintain the quality of assets and to ensure returns commensurate with risk.
At the Group, the Group CRO formulates credit risk management policies each year on the basis of Group-wide basic policies for risk management. The Credit & Investment Planning Department, responsible for the comprehensive management of credit risk, drafts and administers credit risk regulations including the Group
credit policies, manages
non-performing
loans (“NPLs”), and performs other aspects of credit portfolio management. Also, the Credit Risk Committee deliberates on matters related to Group-wide credit portfolios. The Group companies follow the fundamental principles established by the Group to assess and manage credit risk. Each of Group companies manages credit risk according to the nature of its business, and assesses and manages the credit risks of individual loans and credit portfolios quantitatively, using consistent standards. The
following chart shows the credit risk management system of SMBC, the Group’s significant banking subsidiary.
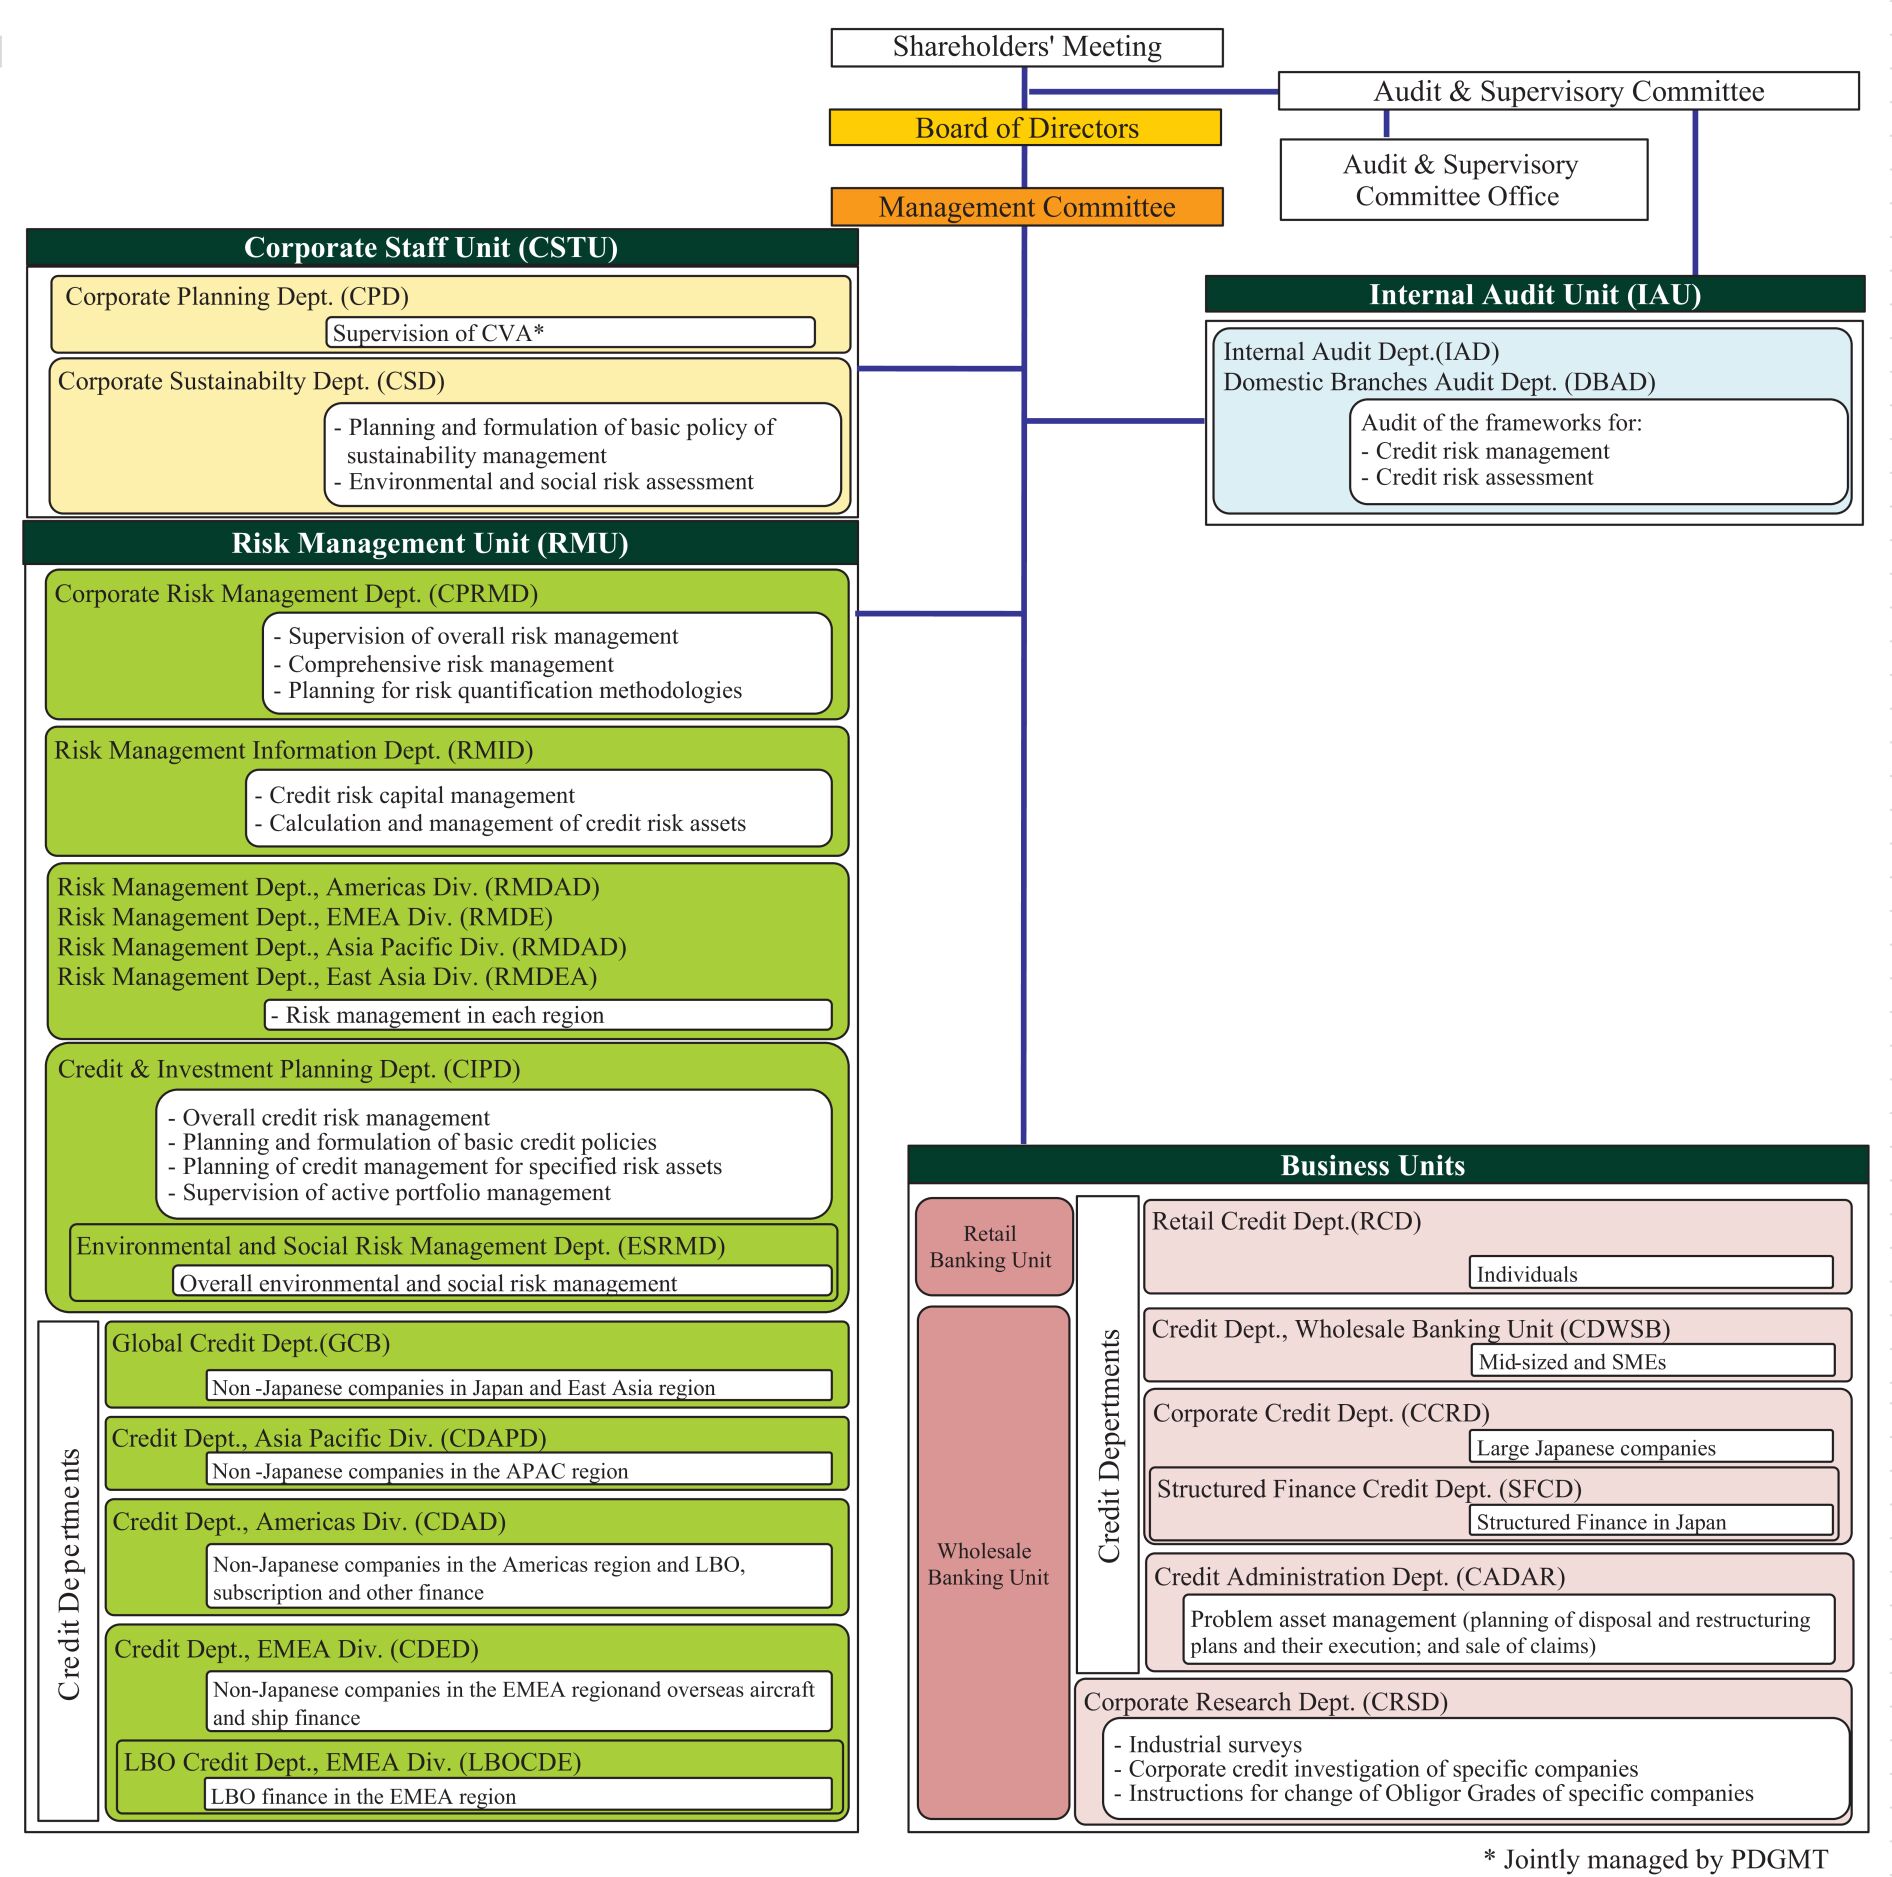
At SMBC, the Credit & Investment Planning Department within the Risk Management Unit is responsible for the comprehensive management of credit risk. This department drafts and administers credit policies, the internal rating system, credit authority guidelines and credit application guidelines, and manages NPLs, including impaired loans, and performs other aspects of credit portfolio management. The department also cooperates with
the Corporate Risk Management Department and the Risk Management Information Department in quantifying credit risk (risk capital and risk-weighted assets) and controls SMBC’s entire credit risk. Further, the Credit & Investment Planning Department aims to stabilize the credit portfolio and manage the risk through credit derivatives, loan asset sales and other instruments.
The credit departments, in cooperation with branches, conduct credit risk management for loans and manage portfolios. The credit limits they use are based on the baseline amounts that the Credit & Investment Planning Department establishes for each grading category, with particular attention paid to evaluating and managing customers or loans perceived to have particularly high credit risk. The Corporate Research Department engages in research on industries and analyzes the business and financial conditions of borrower enterprises to detect early signs of problems or growth potential. The Credit Administration Department is responsible for handling NPLs of borrowers classified as potentially bankrupt or lower, and formulates plans for workouts, including write-offs, and corporate rehabilitation. The department closely liaises with SMBC Servicer Co., Ltd., a Group company, which engages in related services to efficiently reduce the amount of NPLs, including through the sales of loans.
The Internal Audit Unit of SMBC, operating independently of the business units, audits asset quality, accuracy of grading and state of credit risk management, and reports the results directly to the board of directors, the Management Committee and audit & supervisory committee.
SMBC has established the Credit Risk Committee to undertake control of credit risk and to ensure the overall soundness of the loan operations.
Credit risk management methods
To effectively manage the risk involved in individual loans as well as the credit portfolio as a whole, the Group first acknowledges that every loan entails credit risk, assesses the credit risk posed by each borrower and loan using an internal rating system, and quantifies that risk for control purposes.
Credit risk evaluation
At SMBC, the Credit & Investment Planning Department manages an internal rating system for each asset control category set according to portfolio characteristics. For example, credits to commercial and industrial (“C&I”) companies, individuals for business purposes (domestic only), sovereigns, public sector entities, and financial institutions are assigned an “obligor grade,” which indicates the borrower’s creditworthiness, and/or “facility grade,” which indicates the collectability of assets taking into account the transaction conditions such as guarantee/collateral, and tenor. The business units determine an obligor grade by first assigning a financial grade using a financial strength grading model and data obtained from the obligor’s financial statements, including net worth and cash flows. The financial grade is then adjusted taking into account the actual state of the obligor’s financial position and qualitative factors to derive the obligor grade. The qualitative factors mainly include the expected future cash flows taking into account factors such as historical loss information, the appropriateness of the borrower’s business plan or operational improvement plan, the status of progress of its plan, and the overall support from financial institutions. In the event that the borrower is domiciled overseas, internal ratings for credit are made after taking into consideration the country rank, which represents an assessment of the credit quality of each country based on its political and economic situation, as well as its current account balance and external debt. Obligor grades and facility grades are reviewed once a year and as otherwise necessary, such as when there are changes in the credit situation. The Group’s subsidiaries carry out credit risk evaluations in line with SMBC.
The table below show the corporate obligor grading system of SMBC.
Obligor Grade |
Definition |
Borrower Category | ||
Domestic (C&I), etc. | ||||
J1 |
Very high certainty of debt repayment | Normal Borrowers | ||
J2 |
High certainty of debt repayment | |||
J3 |
Satisfactory certainty of debt repayment | |||
J4 |
Debt repayment is likely but this could change in cases of significant changes in economic trends or business environment depending on the situation | |||
J5 |
No problem with debt repayment over the short term, but not satisfactory over the mid to long term and the situation could change in cases of any changes in economic trends or business environment | |||
J6 |
Currently no problem with debt repayment, but it is highly likely that this could change in cases of significant changes in economic trends or business environment | |||
J7 |
Close monitoring is required due to problems in meeting loan terms and conditions, sluggish/unstable business, or financial problems | Borrowers Requiring Caution | ||
J7R |
Obligors with loans that are more than three months past due or with restructured loans within the “Borrowers Requiring Caution” category | Substandard Borrowers | ||
J8 |
Currently not bankrupt, but experiencing business difficulties, making insufficient progress in restructuring, and highly likely to go bankrupt | Potentially Bankrupt Borrowers | ||
J9 |
Though not yet legally or formally bankrupt, has serious business difficulties and rehabilitation is unlikely; thus, effectively bankrupt | Virtually Bankrupt Borrowers | ||
J10 |
Legally or formally bankrupt | Bankrupt Borrowers | ||
G1 |
Very high certainty or high certainty of debt repayment | Normal Borrowers | ||
G2 |
Satisfactory certainty of debt repayment | |||
G3 |
Debt repayment is likely but this could change in cases of significant changes in economic trends or business environment depending on the situation | |||
G4 |
Debt repayment is likely but this could change in cases of significant changes in economic trends or business environment | |||
G5 |
No problem with debt repayment over the short term, but not satisfactory over the mid to long term and the situation could change in cases of any changes in economic trends or business environment | |||
G6 |
Currently no problem with debt repayment, but it is highly likely that this could change in cases of significant changes in economic trends or business environment | |||
G7 |
Close monitoring is required due to problems in meeting loan terms and conditions, sluggish/unstable business, or financial problems | Borrowers Requiring Caution | ||
G7R |
Obligors with loans that are more than three months past due or with restructured loans within the “Borrowers Requiring Caution” category | Substandard Borrowers | ||
Obligor Grade |
Definition |
Borrower Category | ||
Domestic (C&I), etc. | ||||
G8 |
Currently not bankrupt, but experiencing business difficulties, making insufficient progress in restructuring, and highly likely to go bankrupt | Potentially Bankrupt Borrowers | ||
G9 |
Though not yet legally or formally bankrupt, has serious business difficulties and rehabilitation is unlikely; thus, effectively bankrupt | Virtually Bankrupt Borrowers | ||
G10 |
Legally or formally bankrupt | Bankrupt Borrowers | ||
There are also grading systems for loans to individuals such as housing loans and structured finance including project finance, where the repayment source is limited to the cash flows generated by a particular business or asset. For example, the obligor grade of housing loans is determined taking into account various relevant factors such as proportion of the repayment to revenue, proportion of down payment to the value and past due information.
The Credit & Investment Planning Department of SMBC centrally manages the internal rating systems, and designs, operates, supervises and validates the grading models. It validates the grading models (including statistical validation) of main assets following the procedure manual once a year to ensure their effectiveness and suitability.
Quantification of credit risk
At SMBC, credit risk quantification refers to the process of estimating the degree of credit risk of a portfolio or individual loan taking into account not just the obligor’s probability of default (“PD”), but also the concentration of risk in a specific customer or industry and the loss impact of fluctuations in the value of collateral, such as real estate and securities.
Specifically, the PD by grade, loss given default (“LGD”), credit quality correlation among obligors, and other parameter values are estimated using the historical data of obligors and facilities stored in a database to calculate the credit risk. Then, based on these parameters, SMBC runs a simulation of simultaneous default using the Monte Carlo Simulation to calculate SMBC’s maximum loss exposure to the estimated amount of the maximum losses that may be incurred. Based on these quantitative results, SMBC allocates risk capital.
Risk quantification is also executed for purposes such as to determine the portfolio’s risk concentration or to simulate economic movements (stress tests), and the results are used for making optimal decisions across the whole range of business operations, including formulating business plans and providing a standard against which individual credit applications are assessed.
Credit assessment
At SMBC, the credit assessment of corporate loans involves a variety of financial analyses, including cash flows, to predict an enterprise’s capability of loan repayment and its growth prospects. These quantitative measures, when combined with qualitative analyses of industrial trends, the enterprise’s research and development capabilities, the competitiveness of its products or services, and its management caliber, result in a comprehensive credit assessment. The loan application is analyzed in terms of the intended utilization of the funds and the repayment schedule. In the assessment of housing loans for individuals, SMBC employs a credit assessment model based on credit data amassed and analyzed by SMBC over many years, taking into account various relevant factors including proportion of the repayment to revenue, proportion of down payment to the value and past due information.
Credit monitoring
At SMBC, in addition to analyzing loans at the application stage, the Credit Monitoring System is utilized to reassess obligor grades, and review credit policies for each obligor so that problems can be detected at an early stage, and quick and effective action can be taken. The system includes annual monitoring that is carried out each time the financial results of the obligor enterprise are obtained, as well as
ad-hoc
monitoring that is performed each time credit conditions change. Credit portfolio management
Risk-taking within the scope of capital
To keep the credit risk exposure to a permissible level relative to capital, the Corporate Risk Management Department of the Group sets a credit risk capital limit for internal control purposes. The Corporate Risk Management Department conducts monthly monitoring to make sure that these limits are being followed.
Controlling concentration risk
As the Group’s equity capital may be materially impaired in the event that the credit concentration risk becomes apparent, the Credit & Investment Planning Department of the Group therefore takes measures to manage concentration risks, such as introducing large exposure limits and conducting intensive loan reviews for obligors with large exposures, with an increased focus on industrial sectors with an excessive concentration of credit risk. Further, to manage country risk, SMBC’s Strategic Planning Department of the Global Banking Unit has credit limit guidelines based on each country’s creditworthiness.
Toward active portfolio management
The Credit & Investment Planning Department makes use of financial instruments to proactively and flexibly manage SMBC’s portfolio to stabilize credit risk.
Maximum exposure to credit risk before collateral held or other credit enhancements
The following table shows the maximum exposure to credit risk before taking into account any collateral held or other credit enhancements at March 31, 2026 and 2025.
At March 31, |
||||||||
2026 |
2025 |
|||||||
(In millions) |
||||||||
| Credit risk exposures relating to assets on the consolidated statements of financial position: |
||||||||
| Deposits with banks |
¥ | 73,623,887 | ¥ | 75,754,246 | ||||
| Call loans and bills bought |
7,885,057 | 5,200,789 | ||||||
| Reverse repurchase agreements and cash collateral on securities borrowed |
25,468,742 | 22,076,009 | ||||||
| Trading assets |
6,476,194 | 5,511,465 | ||||||
| Derivative financial instruments |
10,093,100 | 8,313,016 | ||||||
| Financial assets at fair value through profit or loss |
2,620,759 | 2,820,665 | ||||||
| Investment securities: |
||||||||
| Debt instruments at amortized cost |
4,763,716 | 366,997 | ||||||
| Debt instruments at FVOCI |
23,268,702 | 28,008,280 | ||||||
| Loans and advances |
130,516,241 | 125,190,819 | ||||||
| Other financial assets |
11,876,173 | 7,061,639 | ||||||
| Credit risk exposures relating to off-balance sheet items(1) : |
||||||||
| Loan commitments |
100,314,339 | 91,810,227 | ||||||
| Financial guarantees and other credit-related contingent liabilities |
17,033,173 | 15,139,799 | ||||||
| |
|
|
|
|||||
| Total |
¥ | 413,940,083 | ¥ | 387,253,951 | ||||
| |
|
|
|
|||||
| (1) | The off-balance sheet items represent the nominal amounts of undrawn loan commitments, financial guarantees and other credit-related contingent liabilities. |
Based on the table above, excluding loan commitments (refer to Note 43 “Contingency and Capital Commitments”), the majority of the total exposure to credit risk is derived from “Loans and advances.”
Collateral and other credit enhancements
The Group considers the acquisition of collateral and guarantees as a secondary repayment source to further enhance loan recovery and minimize credit risk. Based on the assessment of a borrower’s real financial condition and potential future cash flows, the Group shall analyze the borrower’s repayment ability and require sufficient collateral in the form of an asset or third-party obligation. This serves to mitigate the inherent credit risk in the exposure, by either improving recoveries in the event of a default or transferring the borrower’s obligation to guarantors. Collateral received is mainly segregated into (1) financial collateral such as cash, deposits and securities, (2) real estate collateral such as land and buildings, and (3) guarantees received from sovereigns, municipal corporations, credit guarantee corporations and other public entities, financial institutions, and other companies.
The Group’s credit risk management is mainly based on an analysis of the repayment ability from the cash flows of the borrower’s business performance, and the collateral and other credit enhancements are considered as secondary repayment sources in the Group’s business practice. At the time of the primary lending decision, the Group evaluates the collateral on an individual borrower basis to consider its financial effect for mitigating credit risk. The
re-evaluation
of the collateral and other credit enhancements will be performed regularly, depending on the borrower’s creditworthiness. In case there is a significant change in the borrower’s repayment ability due to a deterioration in its creditworthiness and/or its cash flows, the Group may utilize the collateral and other credit enhancements as a source of repayment. The following table shows the financial effect of collateral and other credit enhancements on impaired loans and advances at March 31, 2026 and 2025. The maximum collateral amounts included in the disclosure are limited to the carrying value of loans and advances where the credit exposure is over-collateralized.
At March 31, |
||||||||
2026 |
2025 |
|||||||
(In millions) |
||||||||
| Impaired loans and advances |
¥ | 1,583,138 | ¥ | 1,290,812 | ||||
| Financial effect of collateral and other credit enhancements |
518,563 | 333,383 | ||||||
Concentration of risks of loans and advances with credit risk exposure
An analysis of concentrations of credit risk from loans and advances by geographical sector and industry sector at March 31, 2026 and 2025 is shown below. The concentration by geographical sector is measured based on the domicile of the borrower.
Geographical sector
At March 31, |
||||||||
2026 |
2025 |
|||||||
(In millions) |
||||||||
| Domestic |
¥ | 77,971,747 | ¥ | 73,240,162 | ||||
| Foreign: |
||||||||
| Americas |
21,886,240 | 21,777,691 | ||||||
| Europe |
11,595,933 | 10,920,043 | ||||||
| Asia |
13,565,007 | 13,432,099 | ||||||
| Others |
7,337,296 | 7,454,279 | ||||||
| |
|
|
|
|||||
| Total foreign |
54,384,476 | 53,584,112 | ||||||
| |
|
|
|
|||||
| Gross loans and advances |
132,356,223 | 126,824,274 | ||||||
| Adjust: Unearned income, unamortized premiums—net and deferred loan fees—net |
(603,143 | ) | (530,933 | ) | ||||
| Less: Allowance for loan losses |
(1,236,839 | ) | (1,102,522 | ) | ||||
| |
|
|
|
|||||
| Carrying amount |
¥ | 130,516,241 | ¥ | 125,190,819 | ||||
| |
|
|
|
|||||
Industry sector
At March 31, |
||||||||
2026 |
2025 |
|||||||
(In millions) |
||||||||
| Domestic: |
||||||||
| Manufacturing |
¥ | 13,931,412 | ¥ | 12,299,303 | ||||
| Agriculture, forestry, fisheries and mining |
311,089 | 254,820 | ||||||
| Construction |
1,271,543 | 1,118,001 | ||||||
| Transportation, communications and public enterprises |
7,182,198 | 6,795,140 | ||||||
| Wholesale and retail |
7,315,429 | 6,413,857 | ||||||
| Finance and insurance |
4,149,868 | 3,962,719 | ||||||
| Real estate and goods rental and leasing |
19,246,697 | 18,144,037 | ||||||
| Services |
5,618,473 | 5,277,710 | ||||||
| Municipalities |
1,002,243 | 583,750 | ||||||
| Lease financing |
16,878 | 21,154 | ||||||
| Consumer (1) |
17,214,182 | 16,806,507 | ||||||
| Others |
711,735 | 1,563,164 | ||||||
| |
|
|
|
|||||
| Total domestic |
77,971,747 | 73,240,162 | ||||||
| |
|
|
|
|||||
| Foreign: |
||||||||
| Public sector |
940,526 | 664,085 | ||||||
| Financial institutions |
12,694,870 | 12,415,685 | ||||||
| Commerce and industry |
31,880,801 | 32,682,288 | ||||||
| Lease financing |
257,665 | 300,322 | ||||||
| Others |
8,610,614 | 7,521,732 | ||||||
| |
|
|
|
|||||
| Total foreign |
54,384,476 | 53,584,112 | ||||||
| |
|
|
|
|||||
| Gross loans and advances |
132,356,223 | 126,824,274 | ||||||
| Adjust: Unearned income, unamortized premiums—net and deferred loan fees—net |
(603,143 | ) | (530,933 | ) | ||||
| Less: Allowance for loan losses |
(1,236,839 | ) | (1,102,522 | ) | ||||
| |
|
|
|
|||||
| Carrying amount |
¥ | 130,516,241 | ¥ | 125,190,819 | ||||
| |
|
|
|
|||||
| (1) | The balance in Consumer mainly consists of housing loans. The housing loan balances amounted to ¥10,857,602 million and ¥11,120,139 million at March 31, 2026 and 2025, respectively. |
The following tables show a disaggregation of the structured finance loans and advances balances, where the repayment source is limited to the cash flows generated by a particular business or asset, and the balances of secured or unsecured consumer loans at March 31, 2026 and 2025. These loans and advances are included in the preceding tables.
Structured finance:
At March 31, |
||||||||
2026 |
2025 |
|||||||
(In millions) |
||||||||
| Real estate finance |
¥ | 7,073,251 | ¥ | 6,235,358 | ||||
| Project finance |
7,627,299 | 7,028,222 | ||||||
| Other structured finance |
513,656 | 532,616 | ||||||
| |
|
|
|
|||||
| Total structured finance |
¥ | 15,214,206 | ¥ | 13,796,196 | ||||
| |
|
|
|
|||||
Consumer:
At March 31, |
||||||||
2026 |
2025 |
|||||||
(In millions) |
||||||||
| Secured loans (1) |
¥ | 11,567,151 | ¥ | 11,598,044 | ||||
| Unsecured loans |
5,647,031 | 5,208,463 | ||||||
| |
|
|
|
|||||
| Total consumer |
¥ | 17,214,182 | ¥ | 16,806,507 | ||||
| |
|
|
|
|||||
| (1) | The secured loans and advances mainly represent housing loans. The housing loan balances amounted to ¥10,857,602 million and ¥11,120,139 million at March 31, 2026 and 2025, respectively. |
Credit quality analysis
The following tables set forth information about the gross carrying amount of financial assets and the exposure to credit risk on loan commitments and financial guarantee contracts by stage allocation and internal rating grades of SMBC. Refer to Note 2 “Summary of Material Accounting Policies” for information on stage allocation. Also refer to Note 47 “Financial Risk Management” for information on obligor grading system of SMBC.
At March 31, 2026 |
||||||||||||||||
12-month ECL |
Lifetime ECL not credit- impaired |
Lifetime ECL credit- impaired |
Total |
|||||||||||||
(In millions) |
||||||||||||||||
| Loans and advances at amortized cost: |
||||||||||||||||
| Normal |
||||||||||||||||
| J1-6 |
¥ | 58,797,982 | ¥ | 235,237 | ¥ | — | ¥ | 59,033,219 | ||||||||
| G1-6 |
42,397,402 | 804,699 | — | 43,202,101 | ||||||||||||
| Japanese government and local municipal corporations |
1,890,955 | — | — | 1,890,955 | ||||||||||||
| Other (1) |
25,236,402 | 79,329 | — | 25,315,731 | ||||||||||||
| Requiring caution |
||||||||||||||||
| J7 |
— | 514,318 | — | 514,318 | ||||||||||||
| G7 |
— | 584,109 | — | 584,109 | ||||||||||||
| Other (1) |
— | 232,652 | — | 232,652 | ||||||||||||
| Impaired (2) |
— | — | 1,583,138 | 1,583,138 | ||||||||||||
| |
|
|
|
|
|
|
|
|||||||||
| Gross loans and advances |
128,322,741 | 2,450,344 | 1,583,138 | 132,356,223 | ||||||||||||
| Adjust: Unearned income, unamortized premiums—net and deferred loan fees—net |
(603,143 | ) | ||||||||||||||
| Less: Allowance for loan losses |
(295,235 | ) | (194,947 | ) | (746,657 | ) | (1,236,839 | ) | ||||||||
| |
|
|
|
|
|
|
|
|||||||||
| Carrying amount |
¥ | 130,516,241 | ||||||||||||||
| |
|
|||||||||||||||
| (1) | The balance of “Other” includes housing loans, which amounted to ¥10,799,128 million and ¥12,719 million for the borrower category of Normal and Requiring Caution, respectively. |
| (2) | “Impaired” refers to loans and advances to borrowers with obligor grades not higher than 7R. |
At March 31, 2025 |
||||||||||||||||
12-month ECL |
Lifetime ECL not credit- impaired |
Lifetime ECL credit-impaired |
Total |
|||||||||||||
(In millions) |
||||||||||||||||
| Loans and advances at amortized cost: |
||||||||||||||||
| Normal |
||||||||||||||||
| J1-6 |
¥ | 53,549,667 | ¥ | 188,938 | ¥ | — | ¥ | 53,738,605 | ||||||||
| G1-6 |
41,787,148 | 987,678 | — | 42,774,826 | ||||||||||||
| Japanese government and local municipal corporations |
2,341,701 | — | — | 2,341,701 | ||||||||||||
| Other (1) |
24,805,495 | 73,524 | — | 24,879,019 | ||||||||||||
| Requiring caution |
||||||||||||||||
| J7 |
— | 708,530 | — | 708,530 | ||||||||||||
| G7 |
— | 841,851 | — | 841,851 | ||||||||||||
| Other (1) |
— | 248,930 | — | 248,930 | ||||||||||||
| Impaired (2) |
— | — | 1,290,812 | 1,290,812 | ||||||||||||
| |
|
|
|
|
|
|
|
|||||||||
| Gross loans and advances |
122,484,011 | 3,049,451 | 1,290,812 | 126,824,274 | ||||||||||||
| Adjust: Unearned income, unamortized premiums—net and deferred loan fees—net |
(530,933 | ) | ||||||||||||||
| Less: Allowance for loan losses |
(295,352 | ) | (251,680 | ) | (555,490 | ) | (1,102,522 | ) | ||||||||
| |
|
|
|
|
|
|
|
|||||||||
| Carrying amount |
¥ | 125,190,819 | ||||||||||||||
| |
|
|||||||||||||||
| (1) | The balance of “Other” includes housing loans, which amounted to ¥11,052,547 million and ¥14,461 million for the borrower category of Normal and Requiring Caution, respectively. |
| (2) | “Impaired” refers to loans and advances to borrowers with obligor grades not higher than 7R. |
Modified loans and advances that were subject to lifetime ECL measurement amounted to ¥156,245 million and ¥309,531 million for the fiscal years ended March 31, 2026 and 2025, respectively. The net modification gain or loss is not material.
At March 31, 2026 |
||||||||||||||||
12-month ECL |
Lifetime ECL not credit- impaired |
Lifetime ECL credit-impaired |
Total |
|||||||||||||
(In millions) |
||||||||||||||||
| Loan commitments and financial guarantees (1) : |
||||||||||||||||
| Gross carrying amount |
¥ | 56,582,932 | ¥ | 746,332 | ¥ | 140,713 | ¥ | 57,469,977 | ||||||||
| Allowance for off-balance sheet items |
59,058 | 31,234 | 20,887 | 111,179 | ||||||||||||
At March 31, 2025 |
||||||||||||||||
12-month ECL |
Lifetime ECL not credit- impaired |
Lifetime ECL credit-impaired |
Total |
|||||||||||||
(In millions) |
||||||||||||||||
| Loan commitments and financial guarantees (1) : |
||||||||||||||||
| Gross carrying amount |
¥ | 51,258,693 | ¥ | 998,202 | ¥ | 81,588 | ¥ | 52,338,483 | ||||||||
| Allowance for off-balance sheet items |
52,716 | 53,736 | 10,990 | 117,442 | ||||||||||||
| (1) | Loan commitments are the undrawn components of loan commitments on which ECL can be separately identified from those on the drawn components. |
Movements in ECL allowance
The following tables show reconciliations from the opening balance to the closing balance of the ECL allowance by class of financial instrument.
12-month ECL |
Lifetime ECL not credit- impaired |
Lifetime ECL credit-impaired |
Total |
|||||||||||||
(In millions) |
||||||||||||||||
| Loans and advances at amortized cost (1) : |
||||||||||||||||
| Balance at April 1, 2024 |
¥ | 196,325 | ¥ | 257,542 | ¥ | 525,133 | ¥ | 979,000 | ||||||||
| Transfer to 12-month ECL |
5,589 | (4,573 | ) | (1,016 | ) | — | ||||||||||
| Transfer to lifetime ECL not credit-impaired |
(10,433 | ) | 14,413 | (3,980 | ) | — | ||||||||||
| Transfer to lifetime ECL credit-impaired |
(6,899 | ) | (30,491 | ) | 37,390 | — | ||||||||||
| |
|
|
|
|
|
|
|
|||||||||
| Net transfers between stages |
(11,743 | ) | (20,651 | ) | 32,394 | — | ||||||||||
| Provision for loan losses |
109,536 | 17,264 | 251,991 | 378,791 | ||||||||||||
| |
|
|
|
|
|
|
|
|||||||||
| Charge-offs |
— | — | 264,684 | 264,684 | ||||||||||||
| Recoveries |
— | — | 18,553 | 18,553 | ||||||||||||
| |
|
|
|
|
|
|
|
|||||||||
| Net charge-offs |
— | — | 246,131 | 246,131 | ||||||||||||
| Others (2) |
1,234 | (2,475 | ) | (7,897 | ) | (9,138 | ) | |||||||||
| |
|
|
|
|
|
|
|
|||||||||
| Balance at March 31, 2025 |
295,352 | 251,680 | 555,490 | 1,102,522 | ||||||||||||
| |
|
|
|
|
|
|
|
|||||||||
| Transfer to 12-month ECL |
8,118 | (7,211 | ) | (907 | ) | — | ||||||||||
| Transfer to lifetime ECL not credit-impaired |
(10,070 | ) | 11,152 | (1,082 | ) | — | ||||||||||
| Transfer to lifetime ECL credit-impaired |
(15,244 | ) | (20,867 | ) | 36,111 | — | ||||||||||
| |
|
|
|
|
|
|
|
|||||||||
| Net transfers between stages |
(17,196 | ) | (16,926 | ) | 34,122 | — | ||||||||||
| Provision (Credit) for loan losses |
45,154 | (47,170 | ) | 386,166 | 384,150 | |||||||||||
| |
|
|
|
|
|
|
|
|||||||||
| Charge-offs |
— | — | 274,513 | 274,513 | ||||||||||||
| Recoveries |
— | — | 22,014 | 22,014 | ||||||||||||
| |
|
|
|
|
|
|
|
|||||||||
| Net charge-offs |
— | — | 252,499 | 252,499 | ||||||||||||
| Others (3) |
(28,075 | ) | 7,363 | 23,378 | 2,666 | |||||||||||
| |
|
|
|
|
|
|
|
|||||||||
| Balance at March 31, 2026 |
¥ | 295,235 | ¥ | 194,947 | ¥ | 746,657 | ¥ | 1,236,839 | ||||||||
| |
|
|
|
|
|
|
|
|||||||||
| (1) | “Loans and advances at amortized cost” includes allowance for undrawn components of loan commitments issued to retail customers which cannot be separately identified from that for the drawn components. |
| (2) | Others mainly include foreign exchange translations. |
| (3) | Others mainly include the exclusion of the allowance for loans and advances of SMBC MANUBANK, which were reclassified as assets held for sale, and foreign exchange transactions during the fiscal year ended March 31, 2026. |
For the fiscal year ended March 31, 2026, the ECL allowance increased by ¥134,317 million from ¥1,102,522 million at March 31, 2025 to ¥1,236,839 million at March 31, 2026.
The increase was primarily due to the allowance for lifetime ECLs on credit-impaired assets, which increased by
¥
191,167million for the fiscal year ended March 31, 2026. This was mainly attributable to the provision for loan losses related to some large overseas corporate borrowers that became credit-impaired. Meanwhile, this increase was partially offset by a decrease in the ECL allowance for portfolios affected by the situation in Russia and Ukraine.
For additional information, refer to Note 3 “Critical Accounting Estimates and Judgments.”
12-month ECL |
Lifetime ECL not credit-impaired |
Lifetime ECL credit-impaired |
Total |
|||||||||||||
(In millions) |
||||||||||||||||
| Loan commitments and financial guarantees (1) : |
||||||||||||||||
| Balance at April 1, 2024 |
¥ | 33,480 | ¥ | 43,751 | ¥ | 6,300 | ¥ | 83,531 | ||||||||
| Net transfers between stages |
763 | (899 | ) | 136 | — | |||||||||||
| Provision for off-balance sheet items |
16,941 | 10,467 | 4,784 | 32,192 | ||||||||||||
| Others |
1,532 | 417 | (230 | ) | 1,719 | |||||||||||
| |
|
|
|
|
|
|
|
|||||||||
| Balance at March 31, 2025 |
52,716 | 53,736 | 10,990 | 117,442 | ||||||||||||
| |
|
|
|
|
|
|
|
|||||||||
| Net transfers between stages |
55 | (632 | ) | 577 | — | |||||||||||
| Provision (Credit) for off-balance sheet items |
7,807 | (21,930 | ) | 8,999 | (5,124 | ) | ||||||||||
| Others |
(1,520 | ) | 60 | 321 | (1,139 | ) | ||||||||||
| |
|
|
|
|
|
|
|
|||||||||
| Balance at March 31, 2026 |
¥ | 59,058 | ¥ | 31,234 | ¥ | 20,887 | ¥ | 111,179 | ||||||||
| |
|
|
|
|
|
|
|
|||||||||
| (1) | ECL allowance for loan commitments is that for the undrawn components of loan commitments, which can be separately identified from that for the drawn components. |
Trading assets, financial assets at fair value through profit or loss and investment securities
The following tables show an analysis of trading assets, financial assets at fair value through profit or loss and debt instruments at amortized cost and at fair value through other comprehensive income based on the external rating system at March 31, 2026 and 2025, excluding instruments with equity features. Collateral is generally not obtained directly from the issuers.
At March 31, 2026 |
||||||||||||||||
Trading assets (1) |
Financial assets at fair value through profit or loss (1) |
Debt instruments at amortized cost (1)(2) |
Debt instruments at fair value through other comprehensive income (1)(2) |
|||||||||||||
(In millions) |
||||||||||||||||
| AAA |
¥ | 79,171 | ¥ | — | ¥ | 69,872 | ¥ | 3,312,698 | ||||||||
| AA- to AA+ |
5,237,512 | 25,440 | 4,599,948 | 17,582,729 | ||||||||||||
| A- to A+ |
531,789 | 4,515 | — | 1,428,237 | ||||||||||||
| Lower than A- |
486,384 | 63,751 | 83,011 | 1,316,287 | ||||||||||||
| Unrated |
41,955 | 24,650 | 10,885 | 231,510 | ||||||||||||
| |
|
|
|
|
|
|
|
|||||||||
| Total |
¥ | 6,376,811 | ¥ | 118,356 | ¥ | 4,763,716 | ¥ | 23,871,461 | ||||||||
| |
|
|
|
|
|
|
|
|||||||||
At March 31, 2025 |
||||||||||||||||
Trading assets (1) |
Financial assets at fair value through profit or loss (1) |
Debt instruments at amortized cost (1)(2) |
Debt instruments at fair value through other comprehensive income (1)(2) |
|||||||||||||
(In millions) |
||||||||||||||||
| AAA |
¥ | 83,484 | ¥ | — | ¥ | — | ¥ | 2,759,838 | ||||||||
| AA- to AA+ |
4,473,308 | 26,006 | 288,291 | 23,489,895 | ||||||||||||
| A- to A+ |
369,924 | 11,871 | — | 1,075,246 | ||||||||||||
| Lower than A- |
451,490 | 142,241 | 66,895 | 1,115,603 | ||||||||||||
| Unrated |
67,712 | 12,657 | 11,811 | 205,583 | ||||||||||||
| |
|
|
|
|
|
|
|
|||||||||
| Total |
¥ | 5,445,918 | ¥ | 192,775 | ¥ | 366,997 | ¥ | 28,646,165 | ||||||||
| |
|
|
|
|
|
|
|
|||||||||
| (1) | The amounts represent fair value for trading assets and financial assets at fair value through profit or loss, whereas they represent the gross carrying amount for debt instruments at amortized cost and at fair value through other comprehensive income. |
| (2) | There were no debt instruments at amortized cost or debt instruments at fair value through other comprehensive income subject to lifetime ECL at March 31, 2026 and 2025. |
Credit risk from derivative financial instruments
The Group maintains control limits on derivative positions, by both amount and term. At any one time, the amount subject to credit risk is limited to the fair value of derivative financial instruments that are favorable to the Group (i.e., assets where their fair value is positive).
The Group’s credit risk from derivatives is mitigated where possible through netting agreements whereby derivative assets and liabilities with the same counterparty can be offset. Netting agreements, such as the ISDA master agreement, allow the netting of obligations arising under all of the derivative transactions that the agreement covers upon the counterparty’s default, regardless of maturity and currency, resulting in a single net claim against the counterparty. The Group’s credit risk is also mitigated by collateral arrangements through the credit support annex, resulting in collateral delivered or received regularly based on the replacement costs of derivatives.
Market Risk and Liquidity Risk
Market risk is the possibility that fluctuations in interest rates, foreign exchange rates, equity prices or other market prices will change the market value of financial products, leading to a loss. The purpose of market risk management is to keep the market risk exposure to a permissible level relative to capital.
Liquidity risk is defined as the uncertainty around the ability to meet debt obligations without incurring unacceptably large losses. An example of such risk is the possible inability to meet current and future cash flow/ collateral needs, both expected and unexpected. In such cases, the Group may be required to raise funds at less than favorable rates or be unable to raise sufficient funds for settlement. The purpose of liquidity risk management is to ensure that the Group is in a position to address its liquidity obligations through monitoring the liquidity gap between assets and liabilities, and by maintaining highly liquid supplementary funding resources.
On the basis of the Group-wide basic policies for risk management, the Group has a quantitative management process to control market and liquidity risks on a Group-wide basis. The Group at least annually reviews and identifies which companies primarily carry the market and liquidity risks within the Group. The Group sets permissible level limits of risk for each identified company in consideration of those companies’ business plans. The Group ensures that each identified company establishes a risk management system that is appropriate to the risks it faces, and has
built-in
transparent risk management processes which clearly separate front, middle and back office operations, and establishes a control system of mutual checks and balances. Framework for market and liquidity risk management
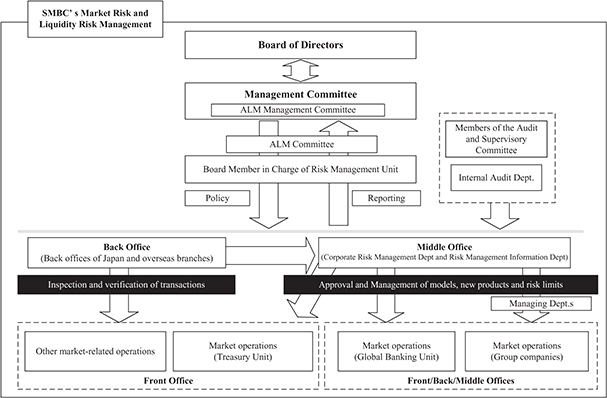
The board of directors authorizes important matters related to the management of market and liquidity risks, such as the basic policies and risk appetite, which are decided by the Management Committee. The Corporate Risk Management Department and the Risk Management Information Department, which are independent from the business units that directly handle market transactions, manage market and liquidity risks in an integrated manner. The Corporate Risk Management Department and the Risk Management Information Department not only monitor the current risk situations but also report regularly to the Management Committee and the board of directors.
Additionally, the Asset Liability Management (“ALM”) Committee, which is generally held on a monthly basis, or the ALM Management Committee, which is generally held four times a year, meets to examine reports on the state of market and liquidity risk management and to discuss our ALM operation policies.
Under the Group’s internal audit system, internal audits are also periodically performed to verify that the risk management framework is functioning properly.
The following chart shows the market and liquidity risk management system of SMBC.
Market risk management methods
The Group manages market risk capital derived from trading activities and
non-trading
activities, including equity holding investments and other transactions in the Risk Appetite Framework by taking into account SMFG’s shareholders’ equity and other principal indicators of the financial position. The Group also establishes an upper limit on value at risk (“VaR”) and losses as Risk Appetite Measures. The Group’s market risk can be divided into various factors: interest rates, foreign exchange rates, equity prices and option risks. The Group manages each of these risks by employing the VaR method as well as supplemental indicators suitable for managing each risk, such as the basis point value (“BPV”).
VaR is the largest predicted loss that is possible given a fixed confidence interval. For example, the Group’s VaR indicates the largest loss that is possible for a holding period of one day and a confidence interval of 99.0%. BPV is the amount of change in assessed value as a result of a
one-basis-point
(0.01%) movement in interest rates. Value at risk
The principal Group companies’ internal VaR model makes use of historical data to prepare scenarios for market fluctuations and, by conducting simulations of gains and losses on a net position basis, the model estimates the potential losses that may occur. The VaR calculation method the Group employs for both trading and
non-trading
activities is based mainly on the following: | • | the historical simulation method; |
| • | a one-sided confidence interval of 99.0%; |
| • | a one-day holding period (a one-year holding period for the equity holding investment portfolio); and |
| • | an observation period of four years (ten years for the equity holding investment portfolio). |
This method is reviewed periodically and refined, if necessary.
The relationship between the VaR calculated by the model and the hypothetical profit and loss data is back-tested periodically. There were no significant excess losses that would raise doubts on the validity of the model in the back-testing results, including from the trading accounts. The back-testing results are reviewed by management, which also monitors the ongoing suitability of the VaR model.
For products and positions where the historical simulation method is not applied, risk amounts are measured using reasonable and conservative methods and are also added to the risk amounts calculated using the historical simulation method. During the fiscal year ended March 31, 2026, the calculation methodology was improved in order to better reflect the Group’s risk profile.
The following tables show the Group’s VaR by risk category and these figures are prepared based on the internal reporting provided to management. The Group’s material market risk exposure categories consist of interest rate risk, foreign exchange risk, equities and commodities risk and others. The section headed “VaR for Trading Activity” shows VaR for instruments entered into for trading purposes and the VaR model for the trading book includes principal consolidated subsidiaries. The section headed “VaR for
Non-Trading
Activity” shows VaR for instruments entered into for purposes other than trading purposes. “Equity Holding Investment” in the “VaR for Non-Trading
Activity” section is a portfolio that consists principally of publicly traded Japanese equities. This portfolio, like that of other financial institutions in Japan, has historically included shares of the Group’s customers. | (a) | VaR for Trading Activity |
Interest rate risk |
Foreign exchange risk |
Equities and commodities risk |
Others |
Total (1) (2) |
||||||||||||||||
(In billions) |
||||||||||||||||||||
For the fiscal year ended March 31, 2026: |
||||||||||||||||||||
SMBC Consolidated |
||||||||||||||||||||
Maximum |
¥ | 12.3 | ¥ | 8.5 | ¥ | 2.5 | ¥ | 2.4 | ¥ | 7.7 | ||||||||||
Minimum |
5.4 | 4.2 | 0.2 | 0.8 | 4.3 | |||||||||||||||
Daily average |
9.5 | 6.5 | 0.6 | 1.4 | 5.7 | |||||||||||||||
At March 31, 2026 |
10.0 | 7.3 | 0.3 | 1.4 | 4.7 | |||||||||||||||
SMFG Consolidated |
||||||||||||||||||||
Maximum |
¥ | 13.5 | ¥ | 9.5 | ¥ | 6.1 | ¥ | 2.4 | ¥ | 12.2 | ||||||||||
Minimum |
6.5 | 5.2 | 1.1 | 0.8 | 7.6 | |||||||||||||||
Daily average |
10.8 | 7.5 | 1.9 | 1.4 | 9.0 | |||||||||||||||
At March 31, 2026 |
11.3 | 8.2 | 1.3 | 1.4 | 7.9 | |||||||||||||||
Interest rate risk |
Foreign exchange risk |
Equities and commodities risk |
Others |
Total (1) |
||||||||||||||||
(In billions) |
||||||||||||||||||||
For the fiscal year ended March 31, 2025: |
||||||||||||||||||||
SMBC Consolidated |
||||||||||||||||||||
Maximum |
¥ | 7.2 | ¥ | 6.7 | ¥ | 2.4 | ¥ | 21.5 | ¥ | 26.9 | ||||||||||
Minimum |
4.4 | 3.2 | 0.1 | 12.4 | 17.8 | |||||||||||||||
Daily average |
6.0 | 5.1 | 0.7 | 17.0 | 22.6 | |||||||||||||||
At March 31, 2025 |
5.7 | 5.4 | 0.2 | 19.1 | 23.9 | |||||||||||||||
SMFG Consolidated |
||||||||||||||||||||
Maximum |
¥ | 24.1 | ¥ | 8.4 | ¥ | 22.3 | ¥ | 21.5 | ¥ | 61.8 | ||||||||||
Minimum |
17.8 | 4.5 | 2.9 | 12.4 | 38.4 | |||||||||||||||
Daily average |
19.5 | 6.5 | 5.7 | 17.0 | 42.1 | |||||||||||||||
At March 31, 2025 |
18.3 | 7.1 | 3.0 | 19.1 | 40.8 | |||||||||||||||
| (1) | Total for “Maximum,” “Minimum,” and “Daily average” represents the maximum, minimum and daily average of the total of the trading book. |
(2) |
As a result of an improvement of the methodology, the reported VaR figures are not directly comparable with those of prior periods. |
| (b) | VaR for Non-Trading Activity |
| (i) | Banking |
Interest rate risk |
Foreign exchange risk |
Equities and commodities risk |
Others |
Total (1) (2) |
||||||||||||||||
(In billions) |
||||||||||||||||||||
For the fiscal year ended March 31, 2026: |
||||||||||||||||||||
SMBC Consolidated |
||||||||||||||||||||
Maximum |
¥ | 104.7 | ¥ | 4.1 | ¥ | 34.6 | ¥ | 0.0 | ¥ | 124.6 | ||||||||||
Minimum |
61.6 | 0.0 | 19.0 | 0.0 | 59.1 | |||||||||||||||
Daily average |
87.1 | 0.2 | 25.8 | 0.0 | 93.0 | |||||||||||||||
At March 31, 2026 |
81.3 | 0.1 | 24.3 | 0.0 | 87.7 | |||||||||||||||
SMFG Consolidated |
||||||||||||||||||||
Maximum |
¥ | 106.1 | ¥ | 4.1 | ¥ | 34.6 | ¥ | 0.0 | ¥ | 126.1 | ||||||||||
Minimum |
62.7 | 0.0 | 19.0 | 0.0 | 60.2 | |||||||||||||||
Daily average |
88.4 | 0.2 | 25.8 | 0.0 | 94.3 | |||||||||||||||
At March 31, 2026 |
82.9 | 0.1 | 24.3 | 0.0 | 89.3 | |||||||||||||||
Interest rate risk |
Foreign exchange risk |
Equities and commodities risk |
Others |
Total (1) |
||||||||||||||||
(In billions) |
||||||||||||||||||||
For the fiscal year ended March 31, 2025: |
||||||||||||||||||||
SMBC Consolidated |
||||||||||||||||||||
Maximum |
¥ | 80.6 | ¥ | 0.2 | ¥ | 35.6 | ¥ | 0.0 | ¥ | 94.7 | ||||||||||
Minimum |
56.4 | 0.0 | 12.6 | 0.0 | 58.2 | |||||||||||||||
Daily average |
66.9 | 0.0 | 28.0 | 0.0 | 73.7 | |||||||||||||||
At March 31, 2025 |
61.3 | 0.1 | 32.6 | 0.0 | 62.5 | |||||||||||||||
SMFG Consolidated |
||||||||||||||||||||
Maximum |
¥ | 82.1 | ¥ | 0.2 | ¥ | 35.6 | ¥ | 0.0 | ¥ | 96.3 | ||||||||||
Minimum |
57.6 | 0.0 | 12.6 | 0.0 | 59.5 | |||||||||||||||
Daily average |
68.2 | 0.0 | 28.0 | 0.0 | 75.0 | |||||||||||||||
At March 31, 2025 |
62.5 | 0.1 | 32.6 | 0.0 | 63.6 | |||||||||||||||
(1) |
Total for “Maximum,” “Minimum,” and “Daily average” represents the maximum, minimum and daily average of the total of the banking book. |
(2) |
As a result of an improvement of the methodology, the reported VaR figures are not directly comparable with those of prior periods. |
(ii) |
Equity Holding Investment |
Equities risk |
||||
(In billions) |
||||
| For the fiscal year ended March 31, 2026: |
||||
| SMBC Consolidated |
||||
| Maximum |
¥ | 1,272.5 | ||
| Minimum |
832.8 | |||
| Daily average |
1,105.8 | |||
| At March 31, 2026 |
1,012.6 | |||
| SMFG Consolidated |
||||
| Maximum |
¥ | 1,621.0 | ||
| Minimum |
1,147.9 | |||
| Daily average |
1,455.4 | |||
| At March 31, 2026 |
1,337.5 | |||
Equities risk |
||||
(In billions) |
||||
| For the fiscal year ended March 31, 2025: |
||||
| SMBC Consolidated |
||||
| Maximum |
¥ | 1,258.2 | ||
| Minimum |
937.3 | |||
| Daily average |
1,134.5 | |||
| At March 31, 2025 |
960.3 | |||
| SMFG Consolidated |
||||
| Maximum |
¥ | 1,576.8 | ||
| Minimum |
1,233.7 | |||
| Daily average |
1,456.7 | |||
| At March 31, 2025 |
1,323.4 | |||
Stress tests
The market occasionally undergoes extreme fluctuations that exceed projections. Therefore, to manage market risk, it is important to run simulations of situations that may occur only once in many years, or
so-called
stress tests. To prepare for unexpected market swings, the Group performs stress tests on a monthly basis based on various scenarios. The limitations of the VaR methodology include the following:
| • | The use of historical data as a proxy for estimating future events may underestimate the probability of extreme market movements. Past market movement is not necessarily a good indicator of future events; |
| • | The use of a holding period assumes that all positions can be liquidated or hedged in that period of time. This assumption does not fully capture the market risk arising during periods of illiquidity, when liquidation or hedging in that period of time may not be possible; |
| • | The use of a confidence level neither takes account of, nor makes any statement about, any losses that might occur beyond this level of confidence; and |
| • | VaR does not capture all of the complex effects of the risk factors on the value of positions and portfolios and could underestimate potential losses. |
Additional information for the certain risks
| (a) | Interest rate risk |
To supplement the above limitations of VaR methodologies, the Group adopts various indices to measure and monitor the sensitivity of interest rates, including delta, gamma and vega risks. The Group considers BPV as one of the most significant indices to manage interest rate risk. BPV is the amount of change in the value to the banking and trading book as a result of a
one-basis-point
(0.01%) movement in interest rates. The principal Group companies use BPV to monitor interest rate risk, not only on a net basis, but also by term to prevent the concentration of interest rate risk in a specific period. In addition, as previously addressed, the Group enhances the risk management methods of VaR and BPV by using them in combination with back-testing and stress tests. Interest rate risk substantially changes depending on the method used for recognizing the expected maturity dates of demand deposits that can be withdrawn at any time, or the method used for estimating the timing of cancellation prior to maturity of time deposits and consumer housing loans. At SMBC, the maturity of demand deposits that are expected to be left with the bank for a prolonged period is regarded to be, at the longest, ten years, and the cancellation prior to maturity of time deposits and consumer housing loans is estimated based on historical data.
Based on the standards for interest rate risk in the banking book issued by the Basel Committee on Banking Supervision (“BCBS”) in April 2016, the FSA revised the related regulatory guidelines pertaining to monitoring of interest rate risks in the banking book in December 2017. The revised disclosure requirements with respect to the changes in economic value of equity (“ΔEVE”) in the banking book as a result of interest rate shocks have been applied from March 2018. ΔEVE is defined as a decline in economic value as a result of an interest rate shock. It is calculated by multiplying the interest rate sensitivity (excluding credit spread) and interest rate change. The FSA implements a “materiality test” to identify banks taking excessive interest rate risks. Under the materiality test, the FSA monitors the ratio of ΔEVE to Tier 1 capital based on a set of prescribed interest rate shock scenarios. The threshold applied by the FSA is 15% and the ratios for SMBC on a consolidated basis at March 31, 2026 and 2025 were 5.0% and 3.0
%, respectively
,
and those for SMFG on a consolidated basis at March 31, 2026 and 2025 were 4.6% and 2.9%, respectively.
| (b) | Foreign exchange risk |
The principal Group companies set risk limits for each currency to manage the concentration of the foreign currency position. The foreign exchange risk is immaterial as shown above in VaR by risk category.
| (c) | Equity holding investment risk |
The Group establishes limits on allowable risk for equity holding investments and monitors the observance of those limits to keep equity price fluctuation risk within acceptable parameters. The Group has been reducing its equity holding investments, and the balance is within a permitted level, which is less than 100% of the Group’s Tier 1 Capital.
Liquidity risk management methods
At Group, liquidity risk is regarded as one of the major risks. The Group’s liquidity risk management is based on a framework consisting of setting Risk Appetite Measures and establishing contingency plans.
The Risk Appetite Measures are measures for selecting the types and levels of risk that the Group is willing to take on or tolerate. As the level of liquidity risk is evaluated based on cash flow and balance sheet conditions, Risk Appetite Measures have been set for both of these areas. These measures include the Liquidity Coverage Ratio, a liquidity regulation, as well as a measure of the periods for which it will be possible to maintain funding levels even under stress due to deposit outflows or other factors, and the ratio which shows how much the stable funding covers the funding for loans and other assets.
The tolerated levels of risk are set based on account funding status, cash management planning, economic environments and other factors, and measures are monitored on a daily or monthly basis in order to limit reliance on short-term funding and appropriately manage liquidity.
As a framework to complement the Risk Appetite Measures, upper limits are set in place on both a Group company basis and individual branch bases with regard to funding gaps, which are defined as a maturity mismatch between the source of funds and use of funds.
Furthermore, contingency plans are established in preparation for emergency situations. These plans contain information on chains of command and lines of reporting as well as detailed action plans depending on the existing situation (i.e., normal, concerned, or crisis). Meanwhile, SMBC carries out quantitative management of alert indications based on early warning indicators established to assist the bank in promptly and systematically detecting liquidity risks.
Maturity analysis of financial liabilities at March 31, 2026 and 2025
The following tables show a maturity analysis of the contractual undiscounted cash flows for financial liabilities at March 31, 2026 and 2025. The amount of interest on debt instruments is not included in the maturity tables below due to its insignificance.
At March 31, 2026 |
||||||||||||||||||||||||||||
On demand |
Not later than three months |
Later than three months and not later than one year |
Later than one year and not later than three years |
Later than three years and not later than five years |
Later than five years |
Total |
||||||||||||||||||||||
(In millions) |
||||||||||||||||||||||||||||
Non-derivative financial instruments: |
||||||||||||||||||||||||||||
Deposits |
¥ | 122,293,981 | ¥ | 52,209,492 | ¥ | 22,416,618 | ¥ | 2,799,727 | ¥ | 1,100,716 | ¥ | 1,151,351 | ¥ | 201,971,885 | ||||||||||||||
Call money and bills sold |
— | 3,629,571 | 27,166 | — | — | — | 3,656,737 | |||||||||||||||||||||
Repurchase agreements and cash collateral on securities lent |
278,146 | 23,472,367 | 426,043 | — | — | — | 24,176,556 | |||||||||||||||||||||
Trading liabilities |
4,130,591 | — | — | — | — | — | 4,130,591 | |||||||||||||||||||||
Financial liabilities designated at fair value through profit or loss |
— | 19,391 | 59,459 | 91,540 | 108,011 | 456,090 | 734,491 | |||||||||||||||||||||
Borrowings |
280,644 | 1,203,233 | 3,356,156 | 3,446,820 | 606,363 | 1,310,165 | 10,203,381 | |||||||||||||||||||||
Debt securities in issue |
— | 3,661,830 | 2,708,049 | 2,726,254 | 3,733,556 | 4,101,011 | 16,930,700 | |||||||||||||||||||||
Lease payable |
— | 19,250 | 60,970 | 114,229 | 69,869 | 137,378 | 401,696 | |||||||||||||||||||||
Other financial liabilities |
3,193,664 | 13,212,768 | 8,836 | — | 146 | 9,606 | 16,425,020 | |||||||||||||||||||||
Off balance sheet items: |
||||||||||||||||||||||||||||
Loan commitments |
100,314,339 | — | — | — | — | — | 100,314,339 | |||||||||||||||||||||
Financial guarantees and other credit-related contingent liabilities |
17,033,173 | — | — | — | — | — | 17,033,173 | |||||||||||||||||||||
Total non-derivative financial instruments |
¥ | 247,524,538 | ¥ | 97,427,902 | ¥ | 29,063,297 | ¥ | 9,178,570 | ¥ | 5,618,661 | ¥ | 7,165,601 | ¥ | 395,978,569 | ||||||||||||||
Derivative financial instruments |
¥ | 11,090,691 | ¥ | — | ¥ | 17,698 | ¥ | 51,341 | ¥ | 142,860 | ¥ | 169,854 | ¥ | 11,472,444 | ||||||||||||||
At March 31, 2025 |
||||||||||||||||||||||||||||
On demand |
Not later than three months |
Later than three months and not later than one year |
Later than one year and not later than three years |
Later than three years and not later than five years |
Later than five years |
Total |
||||||||||||||||||||||
(In millions) |
||||||||||||||||||||||||||||
Non-derivative financial instruments: |
||||||||||||||||||||||||||||
Deposits |
¥ | 121,012,519 | ¥ | 46,594,286 | ¥ | 17,173,432 | ¥ | 3,157,803 | ¥ | 1,006,617 | ¥ | 1,098,943 | ¥ | 190,043,600 | ||||||||||||||
Call money and bills sold |
— | 4,346,342 | 31,935 | — | — | — | 4,378,277 | |||||||||||||||||||||
Repurchase agreements and cash collateral on securities lent |
155,438 | 27,456,024 | 179,639 | — | — | — | 27,791,101 | |||||||||||||||||||||
Trading liabilities |
4,838,439 | — | — | — | — | — | 4,838,439 | |||||||||||||||||||||
Financial liabilities designated at fair value through profit or loss |
— | 3,100 | 41,121 | 101,704 | 79,461 | 418,224 | 643,610 | |||||||||||||||||||||
Borrowings |
301,721 | 1,102,473 | 3,184,919 | 5,090,260 | 530,156 | 2,115,212 | 12,324,741 | |||||||||||||||||||||
Debt securities in issue |
— | 2,858,867 | 2,381,446 | 3,342,775 | 2,675,596 | 3,503,247 | 14,761,931 | |||||||||||||||||||||
Lease payable |
— | 19,100 | 62,448 | 115,293 | 71,831 | 157,415 | 426,087 | |||||||||||||||||||||
Other financial liabilities |
2,961,970 | 7,369,431 | 4,762 | — | 146 | 10,625 | 10,346,934 | |||||||||||||||||||||
Off balance sheet items: |
||||||||||||||||||||||||||||
Loan commitments |
91,810,227 | — | — | — | — | — | 91,810,227 | |||||||||||||||||||||
Financial guarantees and other credit-related contingent liabilities |
15,139,799 | — | — | — | — | — | 15,139,799 | |||||||||||||||||||||
Total non-derivative financial instruments |
¥ | 236,220,113 | ¥ | 89,749,623 | ¥ | 23,059,702 | ¥ | 11,807,835 | ¥ | 4,363,807 | ¥ | 7,303,666 | ¥ | 372,504,746 | ||||||||||||||
Derivative financial instruments |
¥ | 8,882,734 | ¥ | — | ¥ | 20,073 | ¥ | 75,619 | ¥ | 122,772 | ¥ | 202,060 | ¥ | 9,303,258 | ||||||||||||||
Notes:
| 1. | Embedded derivatives which are separately accounted for, but presented together with the host contract in the consolidated statements of financial position are not included in the tables above as they relate to the interest cash flows of the host contract, which are also not included in the tables above. |
| 2. | Derivative financial instruments are recorded at fair value. Except for items designated as hedging instruments for fair value hedge, they are included in the column “On demand.” |
Balance of loans and advances, and deposits at March 31, 2026 and 2025
The following table presents the balance of loans and advances, and deposits at March 31, 2026 and 2025. The balance of deposits at March 31, 2026 and 2025 exceeded the balance of loans and advances at the same time due to the stable deposit base in Japan.
At March 31, |
||||||||
2026 |
2025 |
|||||||
(In millions) |
||||||||
Loans and advances |
¥ | 130,516,241 | ¥ | 125,190,819 | ||||
Deposits |
201,930,427 | 190,022,742 | ||||||
The following table presents a breakdown of deposits by domestic and foreign offices. Domestic inter-bank money is classified as “Call money and bills sold” and not included in “Deposits” in the consolidated statements of financial position. Domestic deposits are mainly composed of corporate and individual customer deposits.
At March 31, |
||||||||
2026 |
2025 |
|||||||
(In millions) |
||||||||
Domestic offices: |
||||||||
Non-interest-bearing demand deposits |
¥ | 28,069,136 | ¥ | 29,902,509 | ||||
Interest-bearing demand deposits |
75,696,259 | 74,165,956 | ||||||
Deposits at notice |
598,846 | 593,258 | ||||||
Time deposits |
25,381,678 | 21,825,843 | ||||||
Negotiable certificates of deposit |
2,985,452 | 4,264,295 | ||||||
Others |
11,292,205 | 10,222,280 | ||||||
Total domestic offices |
144,023,576 | 140,974,141 | ||||||
Foreign offices: |
||||||||
Non-interest-bearing demand deposits |
3,337,095 | 3,032,855 | ||||||
Interest-bearing demand deposits |
7,904,003 | 6,204,646 | ||||||
Deposits at notice |
16,981,820 | 14,062,549 | ||||||
Time deposits |
16,761,066 | 12,656,739 | ||||||
Negotiable certificates of deposit |
12,681,680 | 12,911,097 | ||||||
Others |
241,187 | 180,715 | ||||||
Total foreign offices |
57,906,851 | 49,048,601 | ||||||
Total deposits |
¥ | 201,930,427 | ¥ | 190,022,742 | ||||
Capital Management
The Group manages its capital by taking into consideration regulatory compliance and business development.
The Group’s capital management objectives are to maintain sufficient capital resources to meet the capital adequacy requirements and to maintain a strong capital base to support the development of its business.
External regulatory capital requirement
The Group, the Company and its principal banking subsidiaries in Japan rigidly abide by the capital adequacy guidelines set by the FSA. Japan’s capital adequacy guidelines are based on the Basel Capital Accord, which was proposed by the BCBS for uniform application to all banks which have international operations in industrialized countries. The current international standard is the Basel III framework, published by the BCBS in December 2010. Finalized Basel III regulatory reforms were published in December 2017.
The FSA has adopted capital adequacy guidelines for banking organizations in Japan in line with the Basel III framework and the finalized Basel III regulatory reforms. The FSA’s capital adequacy guidelines may be different from those of central banks or supervisory bodies of other countries because they have been designed by the FSA to suit the Japanese banking environment. The Group’s banking subsidiaries outside of Japan are also subject to local capital ratio requirements.
Under the FSA capital adequacy guidelines, which reflect the Basel III framework, banks and bank holding companies with international operations are required to maintain a minimum Common Equity Tier 1 capital ratio of 4.5%, a minimum Tier 1 capital ratio of 6%, and a minimum total capital ratio of 8%. Moreover, bank holding
companies with international operations are required to hold a capital conservation buffer
of 2.5%
to withstand future periods of stress. As a result, taking the capital conservation buffer into account, the minimum Common Equity Tier 1 capital requirement, the minimum Tier 1 capital requirement and the minimum total capital requirement for bank holding companies with international operations are
7%, 8.5% and 10.5%,
respectively. Furthermore, a countercyclical buffer within a range
of 0% to 2.5%
of common equity or other fully loss-absorbing capital has been implemented according to national circumstances and the Company is required to hold a countercyclical buffer
of
0.19% at March 31, 2026.
In addition to the above-mentioned minimum capital requirements and capital buffer requirements under Basel III, organizations identified by the Financial Stability Board (“FSB”) as Global Systemically Important Banks
(“G-SIBs”),
which includes the Group, are required to maintain an additional 1% to 2.5% of Common Equity Tier 1 capital as a percentage of risk-weighted assets based on the organization’s size, interconnectedness, substitutability, complexity and cross-jurisdictional activity as determined by the FSB. The amount of G-SIB
capital surcharge that applies to the Group based on the FSB’s determination is 1
%. The FSB updates its list of G-SIBs
on anannual basis.
The Group classifies its capital into three tiers: Common Equity Tier 1 capital, Additional Tier 1 capital and Tier 2 capital as follows:
Common Equity Tier 1 capital consists primarily of capital stock, capital surplus and retained earnings relating to common shares, and
non-controlling
interests that meet the criteria for inclusion in Common Equity Tier 1 capital. Additional Tier 1 capital consists primarily of perpetual subordinated bonds.
Tier 2 capital consists primarily of subordinated debt securities.
The FSA capital adequacy guidelines permit Japanese banks to choose from the standardized approach, the foundation internal ratings-based (“IRB”) approach and the advanced IRB approach for measuring credit risk. Banks are permitted to calculate the Internal Loss Multiplier (“ILM”) using internal loss data for operational risk, provided that specific conditions are met. To be eligible to adopt the foundation IRB approach or the advanced IRB approach for measuring credit risk, and to calculate the ILM with internal loss data for operational risk, a Japanese bank must establish advanced risk management systems and receive prior approval from the FSA.
Adopting these approved approaches, the Group has complied with all externally imposed capital requirements throughout the period.
Failure of a Japanese bank, bank holding company or other financial institution to maintain the required risk-weighted capital ratios, may result in administrative actions or sanctions imposed by the FSA.
Regulatory capital
The table below presents the Group’s total capital ratio, total capital and risk-weighted assets under Japanese GAAP at March 31, 2026 and 2025 based on the Basel III rules.
At March 31, |
||||||||
2026 |
2025 |
|||||||
(In billions, except percentages) |
||||||||
SMFG Consolidated: |
||||||||
Total risk-weighted capital ratio |
15.69 | % | 15.18 | % | ||||
Tier 1 risk-weighted capital ratio |
14.49 | % | 14.23 | % | ||||
Common Equity Tier 1 risk-weighted capital ratio |
12.41 | % | 12.44 | % | ||||
Total capital (Common Equity Tier 1 capital + Additional Tier 1 capital + Tier 2 capital) |
¥ | 15,865.9 | ¥ | 14,144.1 | ||||
Tier 1 capital (Common Equity Tier 1 capital + Additional Tier 1 capital) |
14,655.9 | 13,258.8 | ||||||
Common Equity Tier 1 capital |
12,544.0 | 11,585.1 | ||||||
Risk-weighted assets |
101,078.2 | 93,117.1 | ||||||
The amount of minimum total capital requirements (1) |
8,086.3 | 7,449.4 | ||||||
| (1) | The amount of minimum total capital requirements is calculated by multiplying risk-weighted assets by 8%. |