Pay vs Performance Disclosure - USD ($)
|
12 Months Ended |
Sep. 30, 2025 |
Sep. 30, 2024 |
Sep. 30, 2023 |
Sep. 30, 2022 |
Sep. 30, 2021 |
| Pay vs Performance Disclosure |
|
|
|
|
|
| Pay vs Performance Disclosure, Table |
| | | | | | | | | | | | | | | | | | | | | | | | | | | | | | | | | | | | | | | | | | | | | | | | | | | | | | | | | | | | | | | | | | | | Value of Initial Fixed $100 Investment Based On: | | | | | | | | | | | | | | | | | | | | | | | | | | | | | | | | | | | | | | | | | | | | | Fiscal Year | | Summary Compensation Total for PEO($)1 | | Compensation Actually Paid to PEO($)2 | | Average Summary Compensation Table Total for Non-PEO NEOs($)3 | | Average Compensation Actually Paid to Non- PEO NEOs($)4 | | Total Shareholder Return($)5 | | Peer Group Total Shareholder Return($)5 | | Net Income($)6 | | Adjusted EBITDA($)7 | | | | | | | | | | | | | | | | | | | | | | 2025 | | 8,757,036 | | (1,839,996) | | 1,968,706 | | (448,622) | | 103.06 | | 117.42 | | 100.4 | | 289.1 | | | 2024 | | 10,577,798 | | 14,719,467 | | 4,323,328 | | 5,902,248 | | 181.59 | | 132.76 | | 124.8 | | 371.8 | | | 2023 | | 7,418,786 | | | 15,184,023 | | | 1,517,541 | | | 2,536,142 | | | 146.55 | | | 106.13 | | | 1,801.9 | | | 275.1 | | | | 2022 | | 6,815,682 | | | (9,871,558) | | | 1,989,920 | | | (2,094,300) | | | 71.13 | | | 91.57 | | | 72.7 | | | 283.1 | | | | 2021 | | 8,606,325 | | | 21,852,381 | | | 2,465,198 | | | 5,141,570 | | | 170.99 | | | 99.86 | | | 189.6 | | | 391.8 | | |
|
|
|
|
|
| Company Selected Measure Name |
Adjusted EBITDA
|
|
|
|
|
| Named Executive Officers, Footnote |
The dollar amounts reported in this column are the amounts of total compensation reported for our Principal Executive Officer (“PEO”) for each corresponding year in the “Total” column of the Summary Compensation Table, which for each year in the table was David Maura. The dollar amounts reported in this column represent the average of the amounts reported for the Company’s non-PEO named executive officers (“Non-PEO NEOs”) as a group in the “Total” column of the Summary Compensation Table in each applicable year. For purposes of calculating the average amounts in each applicable year, the names of each of the Non-PEO NEOs for fiscal years 2021, 2022, and 2023 are as follows: Jeremy Smeltser, Ehsan Zargar, Randal Lewis and Rebeckah Long. For Fiscal 2024, the names of the Non-PEO NEOs are Jeremy Smeltser and Ehsan Zargar. For Fiscal 2025, the names of the Non-PEO NEOs are Faisal Qadir, Jeremy Smeltser and Ehsan Zargar.
|
|
|
|
|
| Peer Group Issuers, Footnote |
Cumulative TSR is determined over the applicable period shown in the table assuming that $100 was invested from September 30, 2020 until September 30, 2025, and assumes the reinvestment of all dividends, if any. The stockholder return is not necessarily indicative of future performance and will not make or endorse any predictions as to future stockholder returns. Peer group TSR was based on the peer group we use for purposes of Item 201(e)(1)(ii) of Regulation S-K, which was the S&P 500 Household Products Index (the “Peer Group”).
|
|
|
|
|
| PEO Total Compensation Amount |
$ 8,757,036
|
$ 10,577,798
|
$ 7,418,786
|
$ 6,815,682
|
$ 8,606,325
|
| PEO Actually Paid Compensation Amount |
$ (1,839,996)
|
14,719,467
|
15,184,023
|
(9,871,558)
|
21,852,381
|
| Adjustment To PEO Compensation, Footnote |
The dollar amounts reported in this column represent the amount of “compensation actually paid” to our PEO for the applicable fiscal year, as computed in accordance with Item 402(v) of Regulation S-K. The dollar amounts do not reflect the actual amount of compensation earned by or paid to such executive during the applicable year. In accordance with the requirements of Item 402(v) of Regulation S-K, the adjustments set forth below were made to the total compensation for each year to determine the compensation actually paid. Adjusted fair values have been determined using, as applicable, updated stock price and assumptions (i.e., term, volatility, dividend yield, risk free rates) as of the measurement date. | | | | | | | | | | | | | | | | | | | | | | | | | | | | | | | | | | | | | Fiscal Year | | 2021($) | | 2022($) | | 2023($) | | 2024($) | | 2025($) | | | | | | | | | | | | | | Total from Summary Compensation Table | | 8,606,325 | | | 6,815,682 | | | 7,418,786 | | | 10,577,798 | | | 8,757,036 | | | - Amount reported in the Summary Compensation Table for Stock Awards and Option Awards | | (5,399,980) | | | (5,114,755) | | | (5,400,013) | | | (6,749,963) | | | (6,750,004) | | | + Fair Value at Fiscal Year-End of Outstanding and Unvested Option Awards and Stock Awards Granted in Fiscal Year | | 8,861,580 | | | 617,338 | | | 8,495,804 | | | 9,696,384 | | | 3,928,404 | | | +/- Change in Fair Value of Outstanding and Unvested Option Awards and Stock Awards Granted in Prior Fiscal Years (Including Modifications) | | 9,146,349 | | | (12,656,942) | | | 2,551,834 | | | 1,516,743 | | | (7,771,320) | | | - Fair Value at Prior Fiscal Year-End of Stock and Option Awards Forfeited during the Covered Year | | 0 | | | 0 | | | 0 | | | 0 | | | 0 | | | +/- Change in Fair Value as of Vesting Date of Option Awards and Stock Awards Granted in Prior Fiscal Years For Which Applicable Vesting Conditions Were Satisfied During Fiscal Year | | 638,107 | | | 467,119 | | | 2,117,612 | | | (321,495) | | | (4,112) | | | Compensation Actually Paid | | 21,852,381 | | | (9,871,558) | | | 15,184,023 | | | 14,719,467 | | | (1,839,996) | |
|
|
|
|
|
| Non-PEO NEO Average Total Compensation Amount |
$ 1,968,706
|
4,323,328
|
1,517,541
|
1,989,920
|
2,465,198
|
| Non-PEO NEO Average Compensation Actually Paid Amount |
$ (448,622)
|
5,902,248
|
2,536,142
|
(2,094,300)
|
5,141,570
|
| Adjustment to Non-PEO NEO Compensation Footnote |
The dollar amounts reported in this column represent the average amount of “compensation actually paid” to the Non-PEO NEOs as a group in the applicable year as computed in accordance with Item 402(v) of Regulation S-K. The dollar amounts do not reflect the actual average amount of compensation earned by or paid to the Non-PEO NEOs as a group during the applicable year. In accordance with the requirements of Item 402(v) of Regulation S-K, the adjustments set forth below were made to the average total compensation for the Non-PEO NEOs as a group for each year to determine the compensation actually paid, using the same methodology described in Note 2 above. | | | | | | | | | | | | | | | | | | | | | | | | | | | | | | | | | | | | | Fiscal Year | | 2021($) | | 2022($) | | 2023($) | | 2024($) | | 2025($) | | | | | | | | | | | | | | Total from Summary Compensation Table | | 2,465,198 | | | 1,989,920 | | | 1,517,541 | | | 4,323,328 | | | 1,968,706 | | - Amount reported in the Summary Compensation Table for Stock Awards and Option Awards | | (1,287,499) | | | (1,295,253) | | | (694,996) | | | (2,900,047) | | | (1,183,369) | | | + Fair Value at Fiscal Year-End of Outstanding and Unvested Option Awards and Stock Awards Granted in Fiscal Year | | 2,112,841 | | | 156,335 | | | 1,093,433 | | | 4,165,943 | | | 688,703 | | | + Change in Fair Value of Outstanding and Unvested Option Awards and Stock Awards Granted in Prior Fiscal Years (Including Modifications) | | 1,730,537 | | | (3,017,765) | | | 312,348 | | | 390,420 | | | (1,921,795) | | | - Fair Value at Prior Fiscal Year-End of Stock and Option Awards Forfeited during the Covered Year | | 0 | | | 0 | | | (235,142) | | | 0 | | | 0 | | | + Change in Fair Value as of Vesting Date of Option Awards and Stock Awards Granted in Prior Fiscal Years For Which Applicable Vesting Conditions Were Satisfied During Fiscal Year | | 120,493 | | | 72,463 | | | 542,958 | | | (77,396) | | | (867) | | | Compensation Actually Paid | | 5,141,570 | | | (2,094,300) | | | 2,536,142 | | | 5,902,248 | | | (448,622) | |
|
|
|
|
|
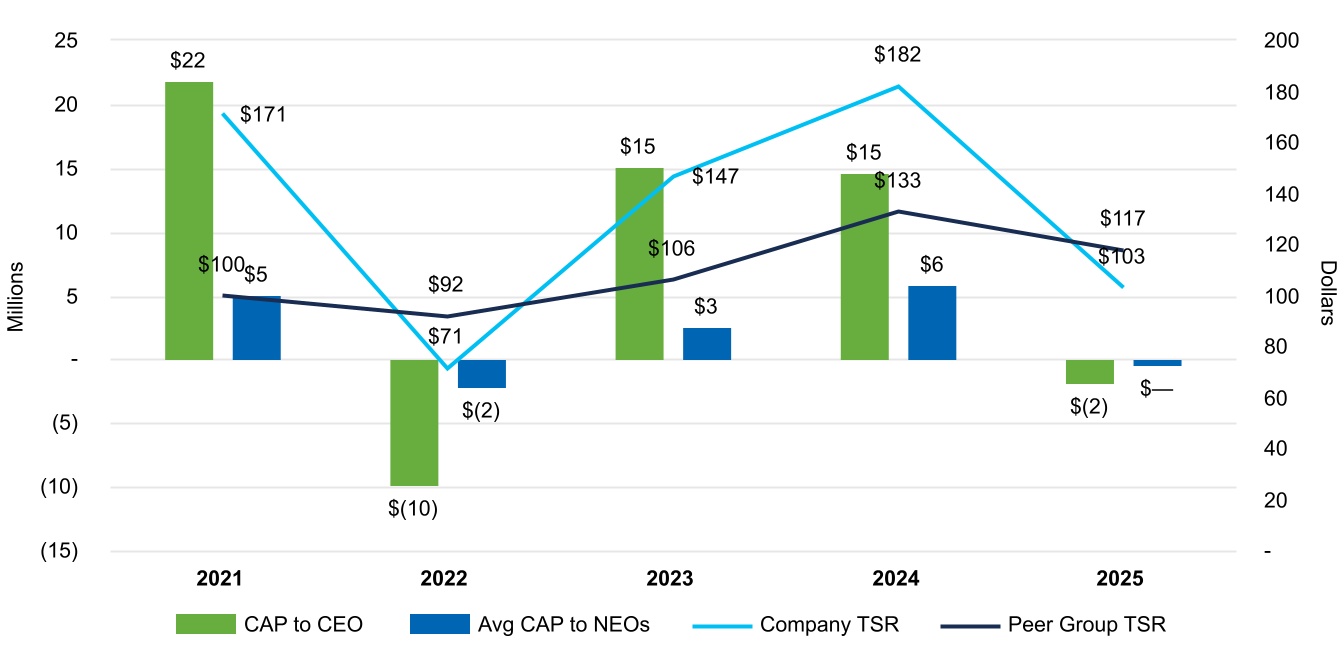
| Compensation Actually Paid vs. Total Shareholder Return |
|
|
|
|
|
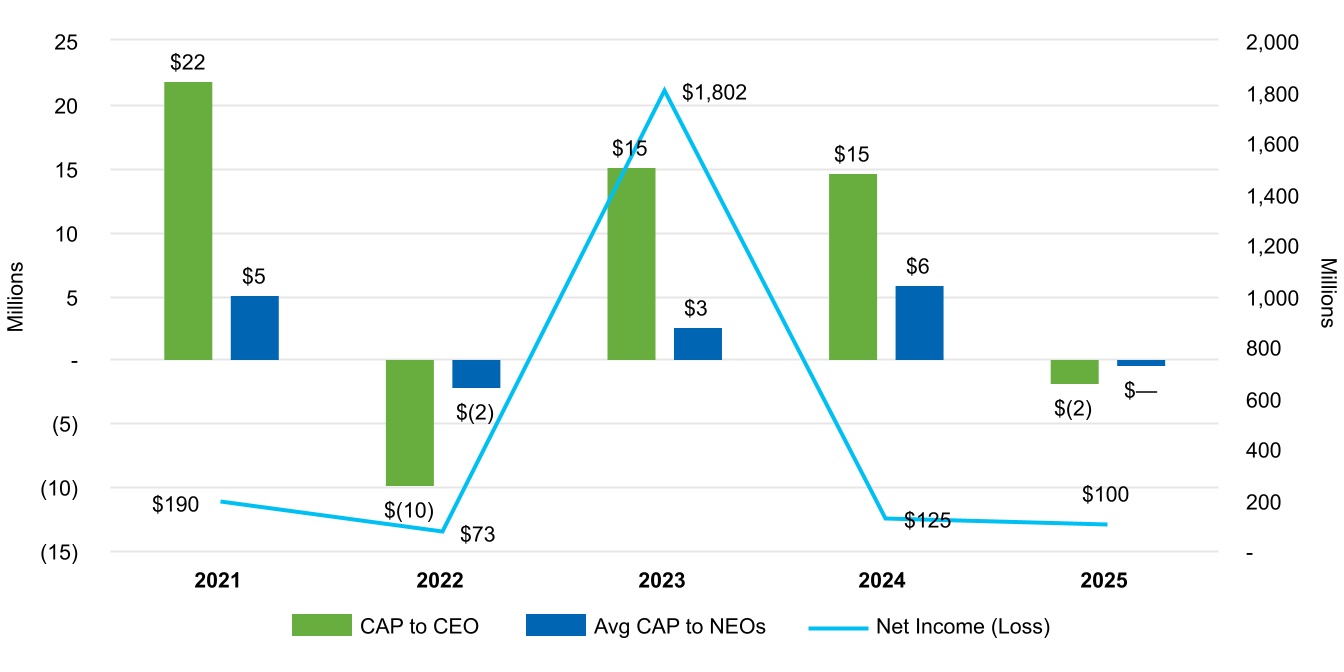
| Compensation Actually Paid vs. Net Income |
|
|
|
|
|
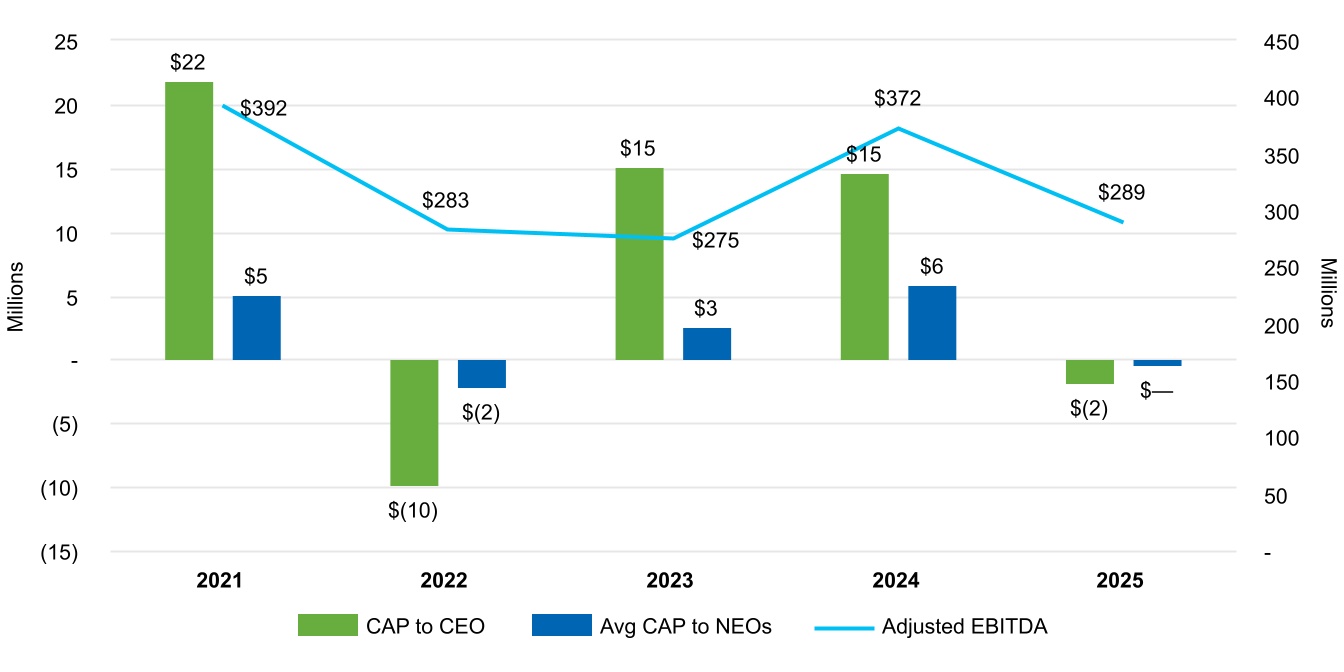
| Compensation Actually Paid vs. Company Selected Measure |
|
|
|
|
|
| Total Shareholder Return Vs Peer Group |
|
|
|
|
|
| Tabular List, Table |
| | | | | | | | | | Measure | How We Used the Measure | | | | | Adjusted EBITDA | Metric in MIP and LTIP | | Adjusted Average Inventory Turns | Metric in MIP | | Net Sales | Metric in MIP | | Adjusted Return on Average Equity | Metric in LTIP | | Adjusted Free Cash Flow | Metric in LTIP |
|
|
|
|
|
| Total Shareholder Return Amount |
$ 103.06
|
181.59
|
146.55
|
71.13
|
170.99
|
| Peer Group Total Shareholder Return Amount |
117.42
|
132.76
|
106.13
|
91.57
|
99.86
|
| Net Income (Loss), Including Portion Attributable to Noncontrolling Interest |
$ 100,400,000
|
$ 124,800,000
|
$ 1,801,900,000
|
$ 72,700,000
|
$ 189,600,000
|
| Company Selected Measure Amount |
289,100,000
|
371,800,000
|
275,100,000
|
283,100,000
|
391,800,000
|
| Additional 402(v) Disclosure |
Net Income includes Net Income From Discontinued Operations, Net of Tax.
|
|
|
|
|
| Measure:: 1 |
|
|
|
|
|
| Pay vs Performance Disclosure |
|
|
|
|
|
| Name |
Adjusted EBITDA
|
|
|
|
|
| Non-GAAP Measure Description |
“Adjusted EBITDA” means net income from continuing operations before income tax expense, interest expense, depreciation expense and amortization expense (from intangible assets); and further excludes non-cash adjustments including share-based compensation; impairment charges on property plant and equipment, right of use lease assets and goodwill and other intangible assets, gain or loss from early extinguishment of debt through repurchase or early redemption of debt; purchase accounting adjustments recognized in income subsequent to an acquisition attributable to the step-up in value on asset acquired; and other one-time charges including, but no limited to, incremental costs associated with strategic transactions, restructuring, and optimization initiatives such as acquisition or divestiture of a business, related integration or separation costs, or the development and implementation of strategies to optimize or restructure the Company and its operations. For purposes of determining performance under the MIP and LTIP, the result of the formula in the preceding sentence is then adjusted by the Compensation Committee in good faith, after consultation with the Chief Executive Officer, so as to negate the effects of any dispositions; provided, however, that Adjusted EBITDA resulting from businesses or products lines acquired (in Board approved transactions) during the applicable timeframe will, to the extent reasonably and in good faith determined by the Compensation Committee to be appropriate (after consultation with the Chief Executive Officer), be included in the calculation from the date of acquisition.
|
|
|
|
|
| Measure:: 2 |
|
|
|
|
|
| Pay vs Performance Disclosure |
|
|
|
|
|
| Name |
Adjusted Average Inventory Turns
|
|
|
|
|
| Measure:: 3 |
|
|
|
|
|
| Pay vs Performance Disclosure |
|
|
|
|
|
| Name |
Net Sales
|
|
|
|
|
| Measure:: 4 |
|
|
|
|
|
| Pay vs Performance Disclosure |
|
|
|
|
|
| Name |
Adjusted Return on Average Equity
|
|
|
|
|
| Measure:: 5 |
|
|
|
|
|
| Pay vs Performance Disclosure |
|
|
|
|
|
| Name |
Adjusted Free Cash Flow
|
|
|
|
|
| PEO | Aggregate Change in Present Value of Accumulated Benefit for All Pension Plans Reported in Summary Compensation Table |
|
|
|
|
|
| Pay vs Performance Disclosure |
|
|
|
|
|
| Adjustment to Compensation, Amount |
$ (6,750,004)
|
$ (6,749,963)
|
$ (5,400,013)
|
$ (5,114,755)
|
$ (5,399,980)
|
| PEO | Year-end Fair Value of Equity Awards Granted in Covered Year that are Outstanding and Unvested |
|
|
|
|
|
| Pay vs Performance Disclosure |
|
|
|
|
|
| Adjustment to Compensation, Amount |
3,928,404
|
9,696,384
|
8,495,804
|
617,338
|
8,861,580
|
| PEO | Year-over-Year Change in Fair Value of Equity Awards Granted in Prior Years That are Outstanding and Unvested |
|
|
|
|
|
| Pay vs Performance Disclosure |
|
|
|
|
|
| Adjustment to Compensation, Amount |
(7,771,320)
|
1,516,743
|
2,551,834
|
(12,656,942)
|
9,146,349
|
| PEO | Change in Fair Value as of Vesting Date of Prior Year Equity Awards Vested in Covered Year |
|
|
|
|
|
| Pay vs Performance Disclosure |
|
|
|
|
|
| Adjustment to Compensation, Amount |
(4,112)
|
(321,495)
|
2,117,612
|
467,119
|
638,107
|
| PEO | Prior Year End Fair Value of Equity Awards Granted in Any Prior Year that Fail to Meet Applicable Vesting Conditions During Covered Year |
|
|
|
|
|
| Pay vs Performance Disclosure |
|
|
|
|
|
| Adjustment to Compensation, Amount |
0
|
0
|
0
|
0
|
0
|
| Non-PEO NEO | Aggregate Change in Present Value of Accumulated Benefit for All Pension Plans Reported in Summary Compensation Table |
|
|
|
|
|
| Pay vs Performance Disclosure |
|
|
|
|
|
| Adjustment to Compensation, Amount |
(1,183,369)
|
(2,900,047)
|
(694,996)
|
(1,295,253)
|
(1,287,499)
|
| Non-PEO NEO | Year-end Fair Value of Equity Awards Granted in Covered Year that are Outstanding and Unvested |
|
|
|
|
|
| Pay vs Performance Disclosure |
|
|
|
|
|
| Adjustment to Compensation, Amount |
688,703
|
4,165,943
|
1,093,433
|
156,335
|
2,112,841
|
| Non-PEO NEO | Year-over-Year Change in Fair Value of Equity Awards Granted in Prior Years That are Outstanding and Unvested |
|
|
|
|
|
| Pay vs Performance Disclosure |
|
|
|
|
|
| Adjustment to Compensation, Amount |
(1,921,795)
|
390,420
|
312,348
|
(3,017,765)
|
1,730,537
|
| Non-PEO NEO | Change in Fair Value as of Vesting Date of Prior Year Equity Awards Vested in Covered Year |
|
|
|
|
|
| Pay vs Performance Disclosure |
|
|
|
|
|
| Adjustment to Compensation, Amount |
(867)
|
(77,396)
|
542,958
|
72,463
|
120,493
|
| Non-PEO NEO | Prior Year End Fair Value of Equity Awards Granted in Any Prior Year that Fail to Meet Applicable Vesting Conditions During Covered Year |
|
|
|
|
|
| Pay vs Performance Disclosure |
|
|
|
|
|
| Adjustment to Compensation, Amount |
$ 0
|
$ 0
|
$ (235,142)
|
$ 0
|
$ 0
|