Shareholder Report
Apr. 30, 2026
USD ($)
Holding
FUND EXPENSES
What were the fund costs for the last year?
| (based on a hypothetical $10,000 investment) | ||
| Class Name | Costs of a $10,000 investment ~ | Costs paid as a percentage of a $10,000 investment ~ |
| R4 | $0 | 0.00% |
˜ Expenses are direct expenses and do not include underlying fund fees and expenses.
MANAGEMENT'S DISCUSSION OF FUND PERFORMANCE
-
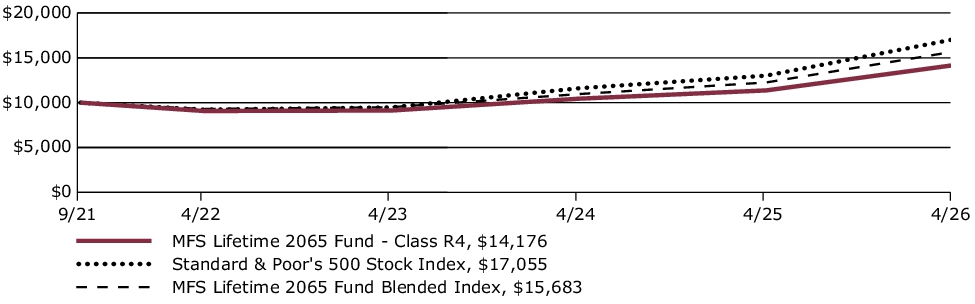
For the twelve months ended April 30, 2026, Class R4 shares of the MFS Lifetime 2065 Fund (fund) provided a total return of 24.74%, at net asset value. This compares with a return of 31.05% for the fund’s benchmark, the Standard & Poor's 500 Stock Index. The fund's other benchmark, the MFS Lifetime 2065 Fund Blended Index (Blended Index), generated a return of 28.01%. The Blended Index reflects the blended returns of broad asset class indices, with percentage allocations to each index designed to resemble the long term strategic allocations of the fund. The market indices and related percentage allocations used to compile the Blended Index are set forth in the Fund Performance.
-
Global equity markets reached record levels during the period, withstanding considerable volatility amid tariffs, geopolitical conflict and high levels of uncertainty. A new geopolitical event distressed markets at the end of the period as US and Israeli forces launched strikes against Iran, disrupting Mideast oil and natural gas exports. During the period, a pro-growth tax and spending bill was signed into law in the US, while in Europe, renewed focus on defense and infrastructure spending brightened the economic outlook. In Japan, the election of a pro-growth prime minister sent stocks to new highs prior to the conflict in Iran. Optimism over artificial intelligence remained high.
-
Considerable progress was made in trade talks between the US and many major trading partners, with a fragile truce between the US and China extended through late 2026. While the US Supreme Court struck down part of the Trump administration’s tariff strategy, the administration began deploying other authorities to largely replace the ones that were ruled unconstitutional.
-
Early in the period, moderating inflation pressures allowed many global central banks to ease monetary policy. Amid a difficult policymaking environment and slower job growth, the Federal Reserve resumed easing policy in September and delivered quarter-point rate cuts in October and December before pausing.
-
In fixed income markets, previously range-bound global bond yields spiked following the onset of the Middle East conflict, as energy-driven inflation fears appeared to have rattled bond investors. US rate volatility (as measured by the Merrill Lynch Option Volatility Estimate (MOVE) Index) similarly rose from intra-period lows, reflecting uncertainty around the scope and duration of the conflict and its implications for global growth. However, volatility later retracted as the risk of a broader regional military escalation appeared less likely. Global credit spreads widened only modestly before stabilizing near prior levels, supported by strong demand and resilient underlying fundamentals.
-
Top contributors to performance relative to the Blended Index:
-
The fund's international equity segment benefited relative performance, as the MFS Blended Research International Equity Fund outpaced its respective benchmark.
-
-
Top detractors from performance relative to the Blended Index:
-
Within the US equity segment, lagging relative performance across the majority of the strategies weighed on relative results as the funds generally underperformed their respective benchmarks. Style selection also held back relative performance as mid-cap growth and mid-cap core strategies underperformed the broader index.
-
FUND PERFORMANCE
The fund’s past performance is not a good predictor of the fund’s future performance. The graph and table below do not reflect the deduction of taxes that a shareholder would pay on fund distributions or the redemption of fund shares. The graph and table below assume reinvestment of dividends and capital gain distributions.
Growth of a Hypothetical $10,000 Investment*
This graph shows the performance of a hypothetical $10,000 investment in Class R4 over a ten year period or since inception, if shorter, in comparison to (i) a broad measure of market performance and (ii) an additional index that MFS believes more closely reflects the market segments in which the fund invests.
Average Annual Total Returns through 4/30/26
This table shows the average annual total returns of the class of shares noted for the periods shown, both with (if any) and without sales charges. It also shows the average annual total returns of (i) a broad measure of market performance and (ii) an additional index that MFS believes more closely reflects the market segments in which the fund invests, over the same periods.
| Share Class | 1-yr | Life* |
| R4 without sales charge | 24.74% | 7.77% |
| Comparative Benchmark(s) | ||
| Standard & Poor's 500 Stock Index ∆ | 31.05% | 12.12% |
| MFS Lifetime 2065 Fund Blended Index ∆ | 28.01% | 10.13% |
|
*
|
For the period from the commencement of the class's investment operations, September 1, 2021 through April 30, 2026.
|
|
∆
|
Source: FactSet Research Systems Inc.
|
Visit mfs.com/perf/r4 for more recent performance information.
FUND STATISTICS AS OF 4/30/26
| Net Assets ($): | 52,384,457 | Total Management Fee ($)#: | 0 | |
| Total Number of Holdings: | 24 | Portfolio Turnover Rate (%): | 21 |
# The fund itself does not pay a management fee but the underlying funds in which the fund invests do pay management fees to MFS.
PORTFOLIO COMPOSITION (BASED ON TOTAL INVESTMENTS AS OF 4/30/26)
Portfolio allocation

Portfolio holdings
| MFS Blended Research International Equity Fund | 11.1% |
| MFS Blended Research Mid Cap Equity Fund | 10.0% |
| MFS Blended Research Value Equity Fund | 5.5% |
| MFS Value Fund | 5.5% |
| MFS Growth Fund | 5.2% |
| MFS Blended Research Growth Equity Fund | 5.2% |
| MFS Commodity Strategy Fund | 5.1% |
| MFS Mid Cap Growth Fund | 5.0% |
| MFS Global Real Estate Fund | 5.0% |
| MFS Mid Cap Value Fund | 5.0% |
| MFS Blended Research Core Equity Fund | 4.6% |
| MFS Research Fund | 4.6% |
| MFS International New Discovery Fund | 4.1% |
| MFS Research International Fund | 4.0% |
| MFS International Intrinsic Equity Fund | 3.5% |
| MFS International Growth Fund | 3.5% |
| MFS Blended Research Small Cap Equity Fund | 2.5% |
| MFS Inflation-Adjusted Bond Fund | 2.5% |
| MFS Total Return Bond Fund | 2.4% |
| MFS New Discovery Fund | 1.3% |
| MFS New Discovery Value Fund | 1.3% |
| MFS Blended Research Emerging Markets Equity Fund | 1.1% |
| MFS Emerging Markets Equity Fund | 1.0% |
| MFS Institutional Money Market Portfolio | 1.0% |
FUND EXPENSES
What were the fund costs for the last year?
| (based on a hypothetical $10,000 investment) | ||
| Class Name | Costs of a $10,000 investment ~ | Costs paid as a percentage of a $10,000 investment ~ |
| R6 | $0 | 0.00% |
˜ Expenses are direct expenses and do not include underlying fund fees and expenses.
MANAGEMENT'S DISCUSSION OF FUND PERFORMANCE
-
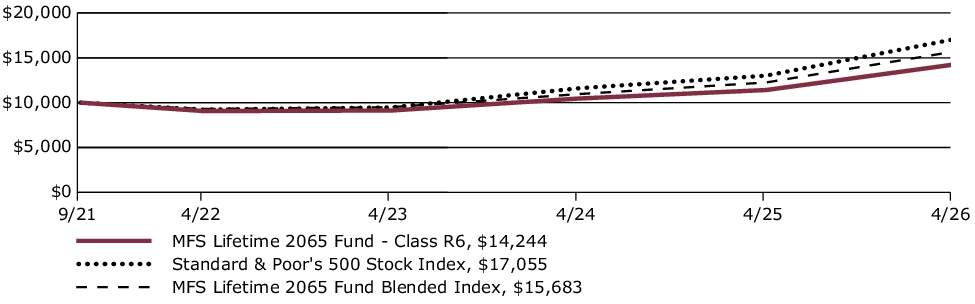
For the twelve months ended April 30, 2026, Class R6 shares of the MFS Lifetime 2065 Fund (fund) provided a total return of 24.86%, at net asset value. This compares with a return of 31.05% for the fund’s benchmark, the Standard & Poor's 500 Stock Index. The fund's other benchmark, the MFS Lifetime 2065 Fund Blended Index (Blended Index), generated a return of 28.01%. The Blended Index reflects the blended returns of broad asset class indices, with percentage allocations to each index designed to resemble the long term strategic allocations of the fund. The market indices and related percentage allocations used to compile the Blended Index are set forth in the Fund Performance.
-
Global equity markets reached record levels during the period, withstanding considerable volatility amid tariffs, geopolitical conflict and high levels of uncertainty. A new geopolitical event distressed markets at the end of the period as US and Israeli forces launched strikes against Iran, disrupting Mideast oil and natural gas exports. During the period, a pro-growth tax and spending bill was signed into law in the US, while in Europe, renewed focus on defense and infrastructure spending brightened the economic outlook. In Japan, the election of a pro-growth prime minister sent stocks to new highs prior to the conflict in Iran. Optimism over artificial intelligence remained high.
-
Considerable progress was made in trade talks between the US and many major trading partners, with a fragile truce between the US and China extended through late 2026. While the US Supreme Court struck down part of the Trump administration’s tariff strategy, the administration began deploying other authorities to largely replace the ones that were ruled unconstitutional.
-
Early in the period, moderating inflation pressures allowed many global central banks to ease monetary policy. Amid a difficult policymaking environment and slower job growth, the Federal Reserve resumed easing policy in September and delivered quarter-point rate cuts in October and December before pausing.
-
In fixed income markets, previously range-bound global bond yields spiked following the onset of the Middle East conflict, as energy-driven inflation fears appeared to have rattled bond investors. US rate volatility (as measured by the Merrill Lynch Option Volatility Estimate (MOVE) Index) similarly rose from intra-period lows, reflecting uncertainty around the scope and duration of the conflict and its implications for global growth. However, volatility later retracted as the risk of a broader regional military escalation appeared less likely. Global credit spreads widened only modestly before stabilizing near prior levels, supported by strong demand and resilient underlying fundamentals.
-
Top contributors to performance relative to the Blended Index:
-
The fund's international equity segment benefited relative performance, as the MFS Blended Research International Equity Fund outpaced its respective benchmark.
-
-
Top detractors from performance relative to the Blended Index:
-
Within the US equity segment, lagging relative performance across the majority of the strategies weighed on relative results as the funds generally underperformed their respective benchmarks. Style selection also held back relative performance as mid-cap growth and mid-cap core strategies underperformed the broader index.
-
FUND PERFORMANCE
The fund’s past performance is not a good predictor of the fund’s future performance. The graph and table below do not reflect the deduction of taxes that a shareholder would pay on fund distributions or the redemption of fund shares. The graph and table below assume reinvestment of dividends and capital gain distributions.
Growth of a Hypothetical $10,000 Investment*
This graph shows the performance of a hypothetical $10,000 investment in Class R6 over a ten year period or since inception, if shorter, in comparison to (i) a broad measure of market performance and (ii) an additional index that MFS believes more closely reflects the market segments in which the fund invests.
Average Annual Total Returns through 4/30/26
This table shows the average annual total returns of the class of shares noted for the periods shown, both with (if any) and without sales charges. It also shows the average annual total returns of (i) a broad measure of market performance and (ii) an additional index that MFS believes more closely reflects the market segments in which the fund invests, over the same periods.
| Share Class | 1-yr | Life* |
| R6 without sales charge | 24.86% | 7.88% |
| Comparative Benchmark(s) | ||
| Standard & Poor's 500 Stock Index ∆ | 31.05% | 12.12% |
| MFS Lifetime 2065 Fund Blended Index ∆ | 28.01% | 10.13% |
|
*
|
For the period from the commencement of the class's investment operations, September 1, 2021 through April 30, 2026.
|
|
∆
|
Source: FactSet Research Systems Inc.
|
Visit mfs.com/perf/r6 for more recent performance information.
FUND STATISTICS AS OF 4/30/26
| Net Assets ($): | 52,384,457 | Total Management Fee ($)#: | 0 | |
| Total Number of Holdings: | 24 | Portfolio Turnover Rate (%): | 21 |
# The fund itself does not pay a management fee but the underlying funds in which the fund invests do pay management fees to MFS.
PORTFOLIO COMPOSITION (BASED ON TOTAL INVESTMENTS AS OF 4/30/26)
Portfolio allocation

Portfolio holdings
| MFS Blended Research International Equity Fund | 11.1% |
| MFS Blended Research Mid Cap Equity Fund | 10.0% |
| MFS Blended Research Value Equity Fund | 5.5% |
| MFS Value Fund | 5.5% |
| MFS Growth Fund | 5.2% |
| MFS Blended Research Growth Equity Fund | 5.2% |
| MFS Commodity Strategy Fund | 5.1% |
| MFS Mid Cap Growth Fund | 5.0% |
| MFS Global Real Estate Fund | 5.0% |
| MFS Mid Cap Value Fund | 5.0% |
| MFS Blended Research Core Equity Fund | 4.6% |
| MFS Research Fund | 4.6% |
| MFS International New Discovery Fund | 4.1% |
| MFS Research International Fund | 4.0% |
| MFS International Intrinsic Equity Fund | 3.5% |
| MFS International Growth Fund | 3.5% |
| MFS Blended Research Small Cap Equity Fund | 2.5% |
| MFS Inflation-Adjusted Bond Fund | 2.5% |
| MFS Total Return Bond Fund | 2.4% |
| MFS New Discovery Fund | 1.3% |
| MFS New Discovery Value Fund | 1.3% |
| MFS Blended Research Emerging Markets Equity Fund | 1.1% |
| MFS Emerging Markets Equity Fund | 1.0% |
| MFS Institutional Money Market Portfolio | 1.0% |
FUND EXPENSES
What were the fund costs for the last year?
| (based on a hypothetical $10,000 investment) | ||
| Class Name | Costs of a $10,000 investment ~ | Costs paid as a percentage of a $10,000 investment ~ |
| A | $28 | 0.25% |
˜ Expenses are direct expenses and do not include underlying fund fees and expenses.
MANAGEMENT'S DISCUSSION OF FUND PERFORMANCE
-
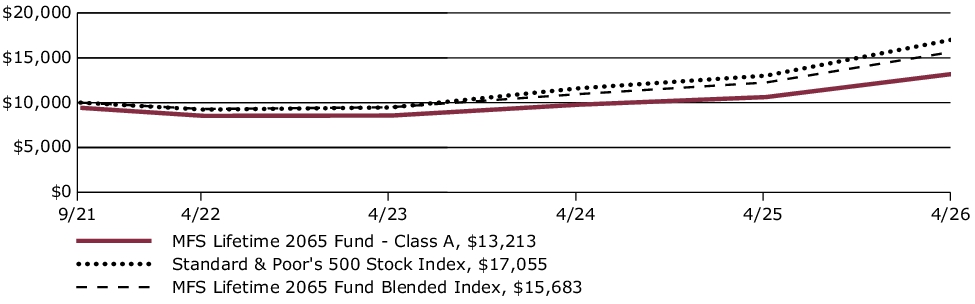
For the twelve months ended April 30, 2026, Class A shares of the MFS Lifetime 2065 Fund (fund) provided a total return of 24.39%, at net asset value. This compares with a return of 31.05% for the fund’s benchmark, the Standard & Poor's 500 Stock Index. The fund's other benchmark, the MFS Lifetime 2065 Fund Blended Index (Blended Index), generated a return of 28.01%. The Blended Index reflects the blended returns of broad asset class indices, with percentage allocations to each index designed to resemble the long term strategic allocations of the fund. The market indices and related percentage allocations used to compile the Blended Index are set forth in the Fund Performance.
-
Global equity markets reached record levels during the period, withstanding considerable volatility amid tariffs, geopolitical conflict and high levels of uncertainty. A new geopolitical event distressed markets at the end of the period as US and Israeli forces launched strikes against Iran, disrupting Mideast oil and natural gas exports. During the period, a pro-growth tax and spending bill was signed into law in the US, while in Europe, renewed focus on defense and infrastructure spending brightened the economic outlook. In Japan, the election of a pro-growth prime minister sent stocks to new highs prior to the conflict in Iran. Optimism over artificial intelligence remained high.
-
Considerable progress was made in trade talks between the US and many major trading partners, with a fragile truce between the US and China extended through late 2026. While the US Supreme Court struck down part of the Trump administration’s tariff strategy, the administration began deploying other authorities to largely replace the ones that were ruled unconstitutional.
-
Early in the period, moderating inflation pressures allowed many global central banks to ease monetary policy. Amid a difficult policymaking environment and slower job growth, the Federal Reserve resumed easing policy in September and delivered quarter-point rate cuts in October and December before pausing.
-
In fixed income markets, previously range-bound global bond yields spiked following the onset of the Middle East conflict, as energy-driven inflation fears appeared to have rattled bond investors. US rate volatility (as measured by the Merrill Lynch Option Volatility Estimate (MOVE) Index) similarly rose from intra-period lows, reflecting uncertainty around the scope and duration of the conflict and its implications for global growth. However, volatility later retracted as the risk of a broader regional military escalation appeared less likely. Global credit spreads widened only modestly before stabilizing near prior levels, supported by strong demand and resilient underlying fundamentals.
-
Top contributors to performance relative to the Blended Index:
-
The fund's international equity segment benefited relative performance, as the MFS Blended Research International Equity Fund outpaced its respective benchmark.
-
-
Top detractors from performance relative to the Blended Index:
-
Within the US equity segment, lagging relative performance across the majority of the strategies weighed on relative results as the funds generally underperformed their respective benchmarks. Style selection also held back relative performance as mid-cap growth and mid-cap core strategies underperformed the broader index.
-
FUND PERFORMANCE
The fund’s past performance is not a good predictor of the fund’s future performance. The graph and table below do not reflect the deduction of taxes that a shareholder would pay on fund distributions or the redemption of fund shares. The graph and table below assume reinvestment of dividends and capital gain distributions.
Growth of a Hypothetical $10,000 Investment*
This graph shows the performance of a hypothetical $10,000 investment in Class A over a ten year period or since inception, if shorter, in comparison to (i) a broad measure of market performance and (ii) an additional index that MFS believes more closely reflects the market segments in which the fund invests. This graph includes the deduction of the maximum applicable sales charge.
Average Annual Total Returns through 4/30/26
This table shows the average annual total returns of the class of shares noted for the periods shown, both with (if any) and without sales charges. It also shows the average annual total returns of (i) a broad measure of market performance and (ii) an additional index that MFS believes more closely reflects the market segments in which the fund invests, over the same periods.
| Share Class | 1-yr | Life* |
| A without sales charge | 24.39% | 7.51% |
| A with initial sales charge (5.75%) | 17.24% | 6.15% |
| Comparative Benchmark(s) | ||
| Standard & Poor's 500 Stock Index ∆ | 31.05% | 12.12% |
| MFS Lifetime 2065 Fund Blended Index ∆ | 28.01% | 10.13% |
|
*
|
For the period from the commencement of the class's investment operations, September 1, 2021 through April 30, 2026.
|
|
∆
|
Source: FactSet Research Systems Inc.
|
Visit mfs.com/perf/a for more recent performance information.
FUND STATISTICS AS OF 4/30/26
| Net Assets ($): | 52,384,457 | Total Management Fee ($)#: | 0 | |
| Total Number of Holdings: | 24 | Portfolio Turnover Rate (%): | 21 |
# The fund itself does not pay a management fee but the underlying funds in which the fund invests do pay management fees to MFS.
PORTFOLIO COMPOSITION (BASED ON TOTAL INVESTMENTS AS OF 4/30/26)
Portfolio allocation

Portfolio holdings
| MFS Blended Research International Equity Fund | 11.1% |
| MFS Blended Research Mid Cap Equity Fund | 10.0% |
| MFS Blended Research Value Equity Fund | 5.5% |
| MFS Value Fund | 5.5% |
| MFS Growth Fund | 5.2% |
| MFS Blended Research Growth Equity Fund | 5.2% |
| MFS Commodity Strategy Fund | 5.1% |
| MFS Mid Cap Growth Fund | 5.0% |
| MFS Global Real Estate Fund | 5.0% |
| MFS Mid Cap Value Fund | 5.0% |
| MFS Blended Research Core Equity Fund | 4.6% |
| MFS Research Fund | 4.6% |
| MFS International New Discovery Fund | 4.1% |
| MFS Research International Fund | 4.0% |
| MFS International Intrinsic Equity Fund | 3.5% |
| MFS International Growth Fund | 3.5% |
| MFS Blended Research Small Cap Equity Fund | 2.5% |
| MFS Inflation-Adjusted Bond Fund | 2.5% |
| MFS Total Return Bond Fund | 2.4% |
| MFS New Discovery Fund | 1.3% |
| MFS New Discovery Value Fund | 1.3% |
| MFS Blended Research Emerging Markets Equity Fund | 1.1% |
| MFS Emerging Markets Equity Fund | 1.0% |
| MFS Institutional Money Market Portfolio | 1.0% |
FUND EXPENSES
What were the fund costs for the last year?
| (based on a hypothetical $10,000 investment) | ||
| Class Name | Costs of a $10,000 investment ~ | Costs paid as a percentage of a $10,000 investment ~ |
| C | $112 | 1.00% |
˜ Expenses are direct expenses and do not include underlying fund fees and expenses.
MANAGEMENT'S DISCUSSION OF FUND PERFORMANCE
-
For the twelve months ended April 30, 2026, Class C shares of the MFS Lifetime 2065 Fund (fund) provided a total return of 23.56%, at net asset value. This compares with a return of 31.05% for the fund’s benchmark, the Standard & Poor's 500 Stock Index. The fund's other benchmark, the MFS Lifetime 2065 Fund Blended Index (Blended Index), generated a return of 28.01%. The Blended Index reflects the blended returns of broad asset class indices, with percentage allocations to each index designed to resemble the long term strategic allocations of the fund. The market indices and related percentage allocations used to compile the Blended Index are set forth in the Fund Performance.
-
Global equity markets reached record levels during the period, withstanding considerable volatility amid tariffs, geopolitical conflict and high levels of uncertainty. A new geopolitical event distressed markets at the end of the period as US and Israeli forces launched strikes against Iran, disrupting Mideast oil and natural gas exports. During the period, a pro-growth tax and spending bill was signed into law in the US, while in Europe, renewed focus on defense and infrastructure spending brightened the economic outlook. In Japan, the election of a pro-growth prime minister sent stocks to new highs prior to the conflict in Iran. Optimism over artificial intelligence remained high.
-
Considerable progress was made in trade talks between the US and many major trading partners, with a fragile truce between the US and China extended through late 2026. While the US Supreme Court struck down part of the Trump administration’s tariff strategy, the administration began deploying other authorities to largely replace the ones that were ruled unconstitutional.
-
Early in the period, moderating inflation pressures allowed many global central banks to ease monetary policy. Amid a difficult policymaking environment and slower job growth, the Federal Reserve resumed easing policy in September and delivered quarter-point rate cuts in October and December before pausing.
-
In fixed income markets, previously range-bound global bond yields spiked following the onset of the Middle East conflict, as energy-driven inflation fears appeared to have rattled bond investors. US rate volatility (as measured by the Merrill Lynch Option Volatility Estimate (MOVE) Index) similarly rose from intra-period lows, reflecting uncertainty around the scope and duration of the conflict and its implications for global growth. However, volatility later retracted as the risk of a broader regional military escalation appeared less likely. Global credit spreads widened only modestly before stabilizing near prior levels, supported by strong demand and resilient underlying fundamentals.
-
Top contributors to performance relative to the Blended Index:
-
The fund's international equity segment benefited relative performance, as the MFS Blended Research International Equity Fund outpaced its respective benchmark.
-
-
Top detractors from performance relative to the Blended Index:
-
Within the US equity segment, lagging relative performance across the majority of the strategies weighed on relative results as the funds generally underperformed their respective benchmarks. Style selection also held back relative performance as mid-cap growth and mid-cap core strategies underperformed the broader index.
-
FUND PERFORMANCE
The fund’s past performance is not a good predictor of the fund’s future performance. The graph and table below do not reflect the deduction of taxes that a shareholder would pay on fund distributions or the redemption of fund shares. The graph and table below assume reinvestment of dividends and capital gain distributions.
Growth of a Hypothetical $10,000 Investment*
This graph shows the performance of a hypothetical $10,000 investment in Class C over a ten year period or since inception, if shorter, in comparison to (i) a broad measure of market performance and (ii) an additional index that MFS believes more closely reflects the market segments in which the fund invests.

Average Annual Total Returns through 4/30/26
This table shows the average annual total returns of the class of shares noted for the periods shown, both with (if any) and without sales charges. It also shows the average annual total returns of (i) a broad measure of market performance and (ii) an additional index that MFS believes more closely reflects the market segments in which the fund invests, over the same periods.
| Share Class | 1-yr | Life* |
| C without sales charge | 23.56% | 6.73% |
| C with CDSC (1% for 12 months)× | 22.56% | 6.73% |
| Comparative Benchmark(s) | ||
| Standard & Poor's 500 Stock Index ∆ | 31.05% | 12.12% |
| MFS Lifetime 2065 Fund Blended Index ∆ | 28.01% | 10.13% |
|
*
|
For the period from the commencement of the class's investment operations, September 1, 2021 through April 30, 2026.
|
|
∆
|
Source: FactSet Research Systems Inc.
|
|
×
|
Assuming redemption at the end of the applicable period.
|
Visit mfs.com/perf/c for more recent performance information.
FUND STATISTICS AS OF 4/30/26
| Net Assets ($): | 52,384,457 | Total Management Fee ($)#: | 0 | |
| Total Number of Holdings: | 24 | Portfolio Turnover Rate (%): | 21 |
# The fund itself does not pay a management fee but the underlying funds in which the fund invests do pay management fees to MFS.
PORTFOLIO COMPOSITION (BASED ON TOTAL INVESTMENTS AS OF 4/30/26)
Portfolio allocation

Portfolio holdings
| MFS Blended Research International Equity Fund | 11.1% |
| MFS Blended Research Mid Cap Equity Fund | 10.0% |
| MFS Blended Research Value Equity Fund | 5.5% |
| MFS Value Fund | 5.5% |
| MFS Growth Fund | 5.2% |
| MFS Blended Research Growth Equity Fund | 5.2% |
| MFS Commodity Strategy Fund | 5.1% |
| MFS Mid Cap Growth Fund | 5.0% |
| MFS Global Real Estate Fund | 5.0% |
| MFS Mid Cap Value Fund | 5.0% |
| MFS Blended Research Core Equity Fund | 4.6% |
| MFS Research Fund | 4.6% |
| MFS International New Discovery Fund | 4.1% |
| MFS Research International Fund | 4.0% |
| MFS International Intrinsic Equity Fund | 3.5% |
| MFS International Growth Fund | 3.5% |
| MFS Blended Research Small Cap Equity Fund | 2.5% |
| MFS Inflation-Adjusted Bond Fund | 2.5% |
| MFS Total Return Bond Fund | 2.4% |
| MFS New Discovery Fund | 1.3% |
| MFS New Discovery Value Fund | 1.3% |
| MFS Blended Research Emerging Markets Equity Fund | 1.1% |
| MFS Emerging Markets Equity Fund | 1.0% |
| MFS Institutional Money Market Portfolio | 1.0% |
FUND EXPENSES
What were the fund costs for the last year?
| (based on a hypothetical $10,000 investment) | ||
| Class Name | Costs of a $10,000 investment ~ | Costs paid as a percentage of a $10,000 investment ~ |
| I | $0 | 0.00% |
˜ Expenses are direct expenses and do not include underlying fund fees and expenses.
MANAGEMENT'S DISCUSSION OF FUND PERFORMANCE
-
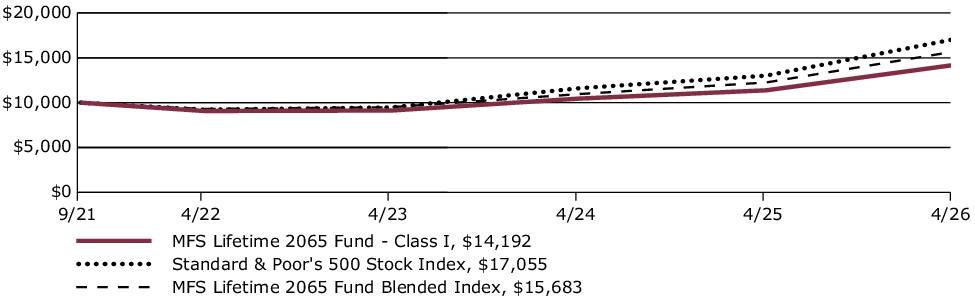
For the twelve months ended April 30, 2026, Class I shares of the MFS Lifetime 2065 Fund (fund) provided a total return of 24.75%, at net asset value. This compares with a return of 31.05% for the fund’s benchmark, the Standard & Poor's 500 Stock Index. The fund's other benchmark, the MFS Lifetime 2065 Fund Blended Index (Blended Index), generated a return of 28.01%. The Blended Index reflects the blended returns of broad asset class indices, with percentage allocations to each index designed to resemble the long term strategic allocations of the fund. The market indices and related percentage allocations used to compile the Blended Index are set forth in the Fund Performance.
-
Global equity markets reached record levels during the period, withstanding considerable volatility amid tariffs, geopolitical conflict and high levels of uncertainty. A new geopolitical event distressed markets at the end of the period as US and Israeli forces launched strikes against Iran, disrupting Mideast oil and natural gas exports. During the period, a pro-growth tax and spending bill was signed into law in the US, while in Europe, renewed focus on defense and infrastructure spending brightened the economic outlook. In Japan, the election of a pro-growth prime minister sent stocks to new highs prior to the conflict in Iran. Optimism over artificial intelligence remained high.
-
Considerable progress was made in trade talks between the US and many major trading partners, with a fragile truce between the US and China extended through late 2026. While the US Supreme Court struck down part of the Trump administration’s tariff strategy, the administration began deploying other authorities to largely replace the ones that were ruled unconstitutional.
-
Early in the period, moderating inflation pressures allowed many global central banks to ease monetary policy. Amid a difficult policymaking environment and slower job growth, the Federal Reserve resumed easing policy in September and delivered quarter-point rate cuts in October and December before pausing.
-
In fixed income markets, previously range-bound global bond yields spiked following the onset of the Middle East conflict, as energy-driven inflation fears appeared to have rattled bond investors. US rate volatility (as measured by the Merrill Lynch Option Volatility Estimate (MOVE) Index) similarly rose from intra-period lows, reflecting uncertainty around the scope and duration of the conflict and its implications for global growth. However, volatility later retracted as the risk of a broader regional military escalation appeared less likely. Global credit spreads widened only modestly before stabilizing near prior levels, supported by strong demand and resilient underlying fundamentals.
-
Top contributors to performance relative to the Blended Index:
-
The fund's international equity segment benefited relative performance, as the MFS Blended Research International Equity Fund outpaced its respective benchmark.
-
-
Top detractors from performance relative to the Blended Index:
-
Within the US equity segment, lagging relative performance across the majority of the strategies weighed on relative results as the funds generally underperformed their respective benchmarks. Style selection also held back relative performance as mid-cap growth and mid-cap core strategies underperformed the broader index.
-
FUND PERFORMANCE
The fund’s past performance is not a good predictor of the fund’s future performance. The graph and table below do not reflect the deduction of taxes that a shareholder would pay on fund distributions or the redemption of fund shares. The graph and table below assume reinvestment of dividends and capital gain distributions.
Growth of a Hypothetical $10,000 Investment*
This graph shows the performance of a hypothetical $10,000 investment in Class I over a ten year period or since inception, if shorter, in comparison to (i) a broad measure of market performance and (ii) an additional index that MFS believes more closely reflects the market segments in which the fund invests.
Average Annual Total Returns through 4/30/26
This table shows the average annual total returns of the class of shares noted for the periods shown, both with (if any) and without sales charges. It also shows the average annual total returns of (i) a broad measure of market performance and (ii) an additional index that MFS believes more closely reflects the market segments in which the fund invests, over the same periods.
| Share Class | 1-yr | Life* |
| I without sales charge | 24.75% | 7.79% |
| Comparative Benchmark(s) | ||
| Standard & Poor's 500 Stock Index ∆ | 31.05% | 12.12% |
| MFS Lifetime 2065 Fund Blended Index ∆ | 28.01% | 10.13% |
|
*
|
For the period from the commencement of the class's investment operations, September 1, 2021 through April 30, 2026.
|
|
∆
|
Source: FactSet Research Systems Inc.
|
Visit mfs.com/perf/i for more recent performance information.
FUND STATISTICS AS OF 4/30/26
| Net Assets ($): | 52,384,457 | Total Management Fee ($)#: | 0 | |
| Total Number of Holdings: | 24 | Portfolio Turnover Rate (%): | 21 |
# The fund itself does not pay a management fee but the underlying funds in which the fund invests do pay management fees to MFS.
PORTFOLIO COMPOSITION (BASED ON TOTAL INVESTMENTS AS OF 4/30/26)
Portfolio allocation

Portfolio holdings
| MFS Blended Research International Equity Fund | 11.1% |
| MFS Blended Research Mid Cap Equity Fund | 10.0% |
| MFS Blended Research Value Equity Fund | 5.5% |
| MFS Value Fund | 5.5% |
| MFS Growth Fund | 5.2% |
| MFS Blended Research Growth Equity Fund | 5.2% |
| MFS Commodity Strategy Fund | 5.1% |
| MFS Mid Cap Growth Fund | 5.0% |
| MFS Global Real Estate Fund | 5.0% |
| MFS Mid Cap Value Fund | 5.0% |
| MFS Blended Research Core Equity Fund | 4.6% |
| MFS Research Fund | 4.6% |
| MFS International New Discovery Fund | 4.1% |
| MFS Research International Fund | 4.0% |
| MFS International Intrinsic Equity Fund | 3.5% |
| MFS International Growth Fund | 3.5% |
| MFS Blended Research Small Cap Equity Fund | 2.5% |
| MFS Inflation-Adjusted Bond Fund | 2.5% |
| MFS Total Return Bond Fund | 2.4% |
| MFS New Discovery Fund | 1.3% |
| MFS New Discovery Value Fund | 1.3% |
| MFS Blended Research Emerging Markets Equity Fund | 1.1% |
| MFS Emerging Markets Equity Fund | 1.0% |
| MFS Institutional Money Market Portfolio | 1.0% |
FUND EXPENSES
What were the fund costs for the last year?
| (based on a hypothetical $10,000 investment) | ||
| Class Name | Costs of a $10,000 investment ~ | Costs paid as a percentage of a $10,000 investment ~ |
| R1 | $112 | 1.00% |
˜ Expenses are direct expenses and do not include underlying fund fees and expenses.
MANAGEMENT'S DISCUSSION OF FUND PERFORMANCE
-
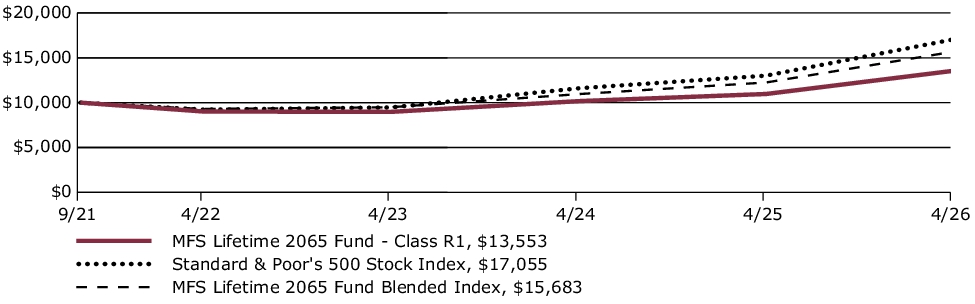
For the twelve months ended April 30, 2026, Class R1 shares of the MFS Lifetime 2065 Fund (fund) provided a total return of 23.57%, at net asset value. This compares with a return of 31.05% for the fund’s benchmark, the Standard & Poor's 500 Stock Index. The fund's other benchmark, the MFS Lifetime 2065 Fund Blended Index (Blended Index), generated a return of 28.01%. The Blended Index reflects the blended returns of broad asset class indices, with percentage allocations to each index designed to resemble the long term strategic allocations of the fund. The market indices and related percentage allocations used to compile the Blended Index are set forth in the Fund Performance.
-
Global equity markets reached record levels during the period, withstanding considerable volatility amid tariffs, geopolitical conflict and high levels of uncertainty. A new geopolitical event distressed markets at the end of the period as US and Israeli forces launched strikes against Iran, disrupting Mideast oil and natural gas exports. During the period, a pro-growth tax and spending bill was signed into law in the US, while in Europe, renewed focus on defense and infrastructure spending brightened the economic outlook. In Japan, the election of a pro-growth prime minister sent stocks to new highs prior to the conflict in Iran. Optimism over artificial intelligence remained high.
-
Considerable progress was made in trade talks between the US and many major trading partners, with a fragile truce between the US and China extended through late 2026. While the US Supreme Court struck down part of the Trump administration’s tariff strategy, the administration began deploying other authorities to largely replace the ones that were ruled unconstitutional.
-
Early in the period, moderating inflation pressures allowed many global central banks to ease monetary policy. Amid a difficult policymaking environment and slower job growth, the Federal Reserve resumed easing policy in September and delivered quarter-point rate cuts in October and December before pausing.
-
In fixed income markets, previously range-bound global bond yields spiked following the onset of the Middle East conflict, as energy-driven inflation fears appeared to have rattled bond investors. US rate volatility (as measured by the Merrill Lynch Option Volatility Estimate (MOVE) Index) similarly rose from intra-period lows, reflecting uncertainty around the scope and duration of the conflict and its implications for global growth. However, volatility later retracted as the risk of a broader regional military escalation appeared less likely. Global credit spreads widened only modestly before stabilizing near prior levels, supported by strong demand and resilient underlying fundamentals.
-
Top contributors to performance relative to the Blended Index:
-
The fund's international equity segment benefited relative performance, as the MFS Blended Research International Equity Fund outpaced its respective benchmark.
-
-
Top detractors from performance relative to the Blended Index:
-
Within the US equity segment, lagging relative performance across the majority of the strategies weighed on relative results as the funds generally underperformed their respective benchmarks. Style selection also held back relative performance as mid-cap growth and mid-cap core strategies underperformed the broader index.
-
FUND PERFORMANCE
The fund’s past performance is not a good predictor of the fund’s future performance. The graph and table below do not reflect the deduction of taxes that a shareholder would pay on fund distributions or the redemption of fund shares. The graph and table below assume reinvestment of dividends and capital gain distributions.
Growth of a Hypothetical $10,000 Investment*
This graph shows the performance of a hypothetical $10,000 investment in Class R1 over a ten year period or since inception, if shorter, in comparison to (i) a broad measure of market performance and (ii) an additional index that MFS believes more closely reflects the market segments in which the fund invests.
Average Annual Total Returns through 4/30/26
This table shows the average annual total returns of the class of shares noted for the periods shown, both with (if any) and without sales charges. It also shows the average annual total returns of (i) a broad measure of market performance and (ii) an additional index that MFS believes more closely reflects the market segments in which the fund invests, over the same periods.
| Share Class | 1-yr | Life* |
| R1 without sales charge | 23.57% | 6.73% |
| Comparative Benchmark(s) | ||
| Standard & Poor's 500 Stock Index ∆ | 31.05% | 12.12% |
| MFS Lifetime 2065 Fund Blended Index ∆ | 28.01% | 10.13% |
|
*
|
For the period from the commencement of the class's investment operations, September 1, 2021 through April 30, 2026.
|
|
∆
|
Source: FactSet Research Systems Inc.
|
Visit mfs.com/perf/r1 for more recent performance information.
FUND STATISTICS AS OF 4/30/26
| Net Assets ($): | 52,384,457 | Total Management Fee ($)#: | 0 | |
| Total Number of Holdings: | 24 | Portfolio Turnover Rate (%): | 21 |
# The fund itself does not pay a management fee but the underlying funds in which the fund invests do pay management fees to MFS.
PORTFOLIO COMPOSITION (BASED ON TOTAL INVESTMENTS AS OF 4/30/26)
Portfolio allocation

Portfolio holdings
| MFS Blended Research International Equity Fund | 11.1% |
| MFS Blended Research Mid Cap Equity Fund | 10.0% |
| MFS Blended Research Value Equity Fund | 5.5% |
| MFS Value Fund | 5.5% |
| MFS Growth Fund | 5.2% |
| MFS Blended Research Growth Equity Fund | 5.2% |
| MFS Commodity Strategy Fund | 5.1% |
| MFS Mid Cap Growth Fund | 5.0% |
| MFS Global Real Estate Fund | 5.0% |
| MFS Mid Cap Value Fund | 5.0% |
| MFS Blended Research Core Equity Fund | 4.6% |
| MFS Research Fund | 4.6% |
| MFS International New Discovery Fund | 4.1% |
| MFS Research International Fund | 4.0% |
| MFS International Intrinsic Equity Fund | 3.5% |
| MFS International Growth Fund | 3.5% |
| MFS Blended Research Small Cap Equity Fund | 2.5% |
| MFS Inflation-Adjusted Bond Fund | 2.5% |
| MFS Total Return Bond Fund | 2.4% |
| MFS New Discovery Fund | 1.3% |
| MFS New Discovery Value Fund | 1.3% |
| MFS Blended Research Emerging Markets Equity Fund | 1.1% |
| MFS Emerging Markets Equity Fund | 1.0% |
| MFS Institutional Money Market Portfolio | 1.0% |
FUND EXPENSES
What were the fund costs for the last year?
| (based on a hypothetical $10,000 investment) | ||
| Class Name | Costs of a $10,000 investment ~ | Costs paid as a percentage of a $10,000 investment ~ |
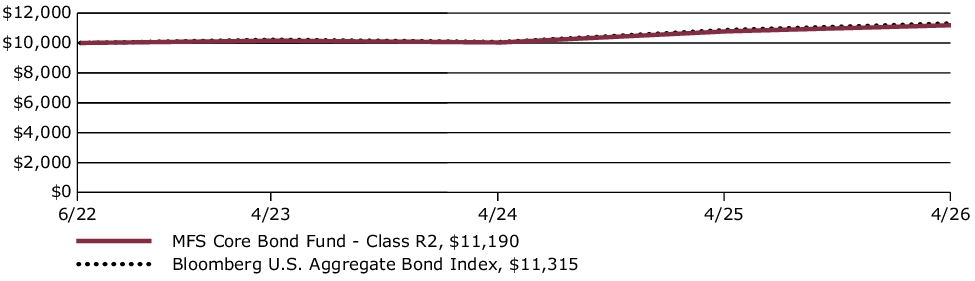
| R2 | $56 | 0.50% |
˜ Expenses are direct expenses and do not include underlying fund fees and expenses.
MANAGEMENT'S DISCUSSION OF FUND PERFORMANCE
-
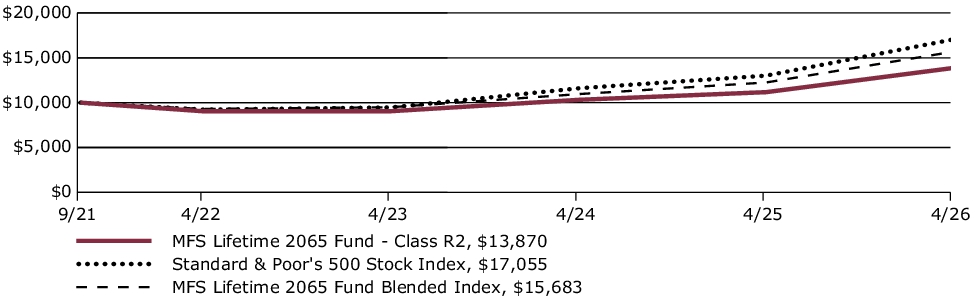
For the twelve months ended April 30, 2026, Class R2 shares of the MFS Lifetime 2065 Fund (fund) provided a total return of 24.16%, at net asset value. This compares with a return of 31.05% for the fund’s benchmark, the Standard & Poor's 500 Stock Index. The fund's other benchmark, the MFS Lifetime 2065 Fund Blended Index (Blended Index), generated a return of 28.01%. The Blended Index reflects the blended returns of broad asset class indices, with percentage allocations to each index designed to resemble the long term strategic allocations of the fund. The market indices and related percentage allocations used to compile the Blended Index are set forth in the Fund Performance.
-
Global equity markets reached record levels during the period, withstanding considerable volatility amid tariffs, geopolitical conflict and high levels of uncertainty. A new geopolitical event distressed markets at the end of the period as US and Israeli forces launched strikes against Iran, disrupting Mideast oil and natural gas exports. During the period, a pro-growth tax and spending bill was signed into law in the US, while in Europe, renewed focus on defense and infrastructure spending brightened the economic outlook. In Japan, the election of a pro-growth prime minister sent stocks to new highs prior to the conflict in Iran. Optimism over artificial intelligence remained high.
-
Considerable progress was made in trade talks between the US and many major trading partners, with a fragile truce between the US and China extended through late 2026. While the US Supreme Court struck down part of the Trump administration’s tariff strategy, the administration began deploying other authorities to largely replace the ones that were ruled unconstitutional.
-
Early in the period, moderating inflation pressures allowed many global central banks to ease monetary policy. Amid a difficult policymaking environment and slower job growth, the Federal Reserve resumed easing policy in September and delivered quarter-point rate cuts in October and December before pausing.
-
In fixed income markets, previously range-bound global bond yields spiked following the onset of the Middle East conflict, as energy-driven inflation fears appeared to have rattled bond investors. US rate volatility (as measured by the Merrill Lynch Option Volatility Estimate (MOVE) Index) similarly rose from intra-period lows, reflecting uncertainty around the scope and duration of the conflict and its implications for global growth. However, volatility later retracted as the risk of a broader regional military escalation appeared less likely. Global credit spreads widened only modestly before stabilizing near prior levels, supported by strong demand and resilient underlying fundamentals.
-
Top contributors to performance relative to the Blended Index:
-
The fund's international equity segment benefited relative performance, as the MFS Blended Research International Equity Fund outpaced its respective benchmark.
-
-
Top detractors from performance relative to the Blended Index:
-
Within the US equity segment, lagging relative performance across the majority of the strategies weighed on relative results as the funds generally underperformed their respective benchmarks. Style selection also held back relative performance as mid-cap growth and mid-cap core strategies underperformed the broader index.
-
FUND PERFORMANCE
The fund’s past performance is not a good predictor of the fund’s future performance. The graph and table below do not reflect the deduction of taxes that a shareholder would pay on fund distributions or the redemption of fund shares. The graph and table below assume reinvestment of dividends and capital gain distributions.
Growth of a Hypothetical $10,000 Investment*
This graph shows the performance of a hypothetical $10,000 investment in Class R2 over a ten year period or since inception, if shorter, in comparison to (i) a broad measure of market performance and (ii) an additional index that MFS believes more closely reflects the market segments in which the fund invests.
Average Annual Total Returns through 4/30/26
This table shows the average annual total returns of the class of shares noted for the periods shown, both with (if any) and without sales charges. It also shows the average annual total returns of (i) a broad measure of market performance and (ii) an additional index that MFS believes more closely reflects the market segments in which the fund invests, over the same periods.
| Share Class | 1-yr | Life* |
| R2 without sales charge | 24.16% | 7.26% |
| Comparative Benchmark(s) | ||
| Standard & Poor's 500 Stock Index ∆ | 31.05% | 12.12% |
| MFS Lifetime 2065 Fund Blended Index ∆ | 28.01% | 10.13% |
|
*
|
For the period from the commencement of the class's investment operations, September 1, 2021 through April 30, 2026.
|
|
∆
|
Source: FactSet Research Systems Inc.
|
Visit mfs.com/perf/r2 for more recent performance information.
FUND STATISTICS AS OF 4/30/26
| Net Assets ($): | 52,384,457 | Total Management Fee ($)#: | 0 | |
| Total Number of Holdings: | 24 | Portfolio Turnover Rate (%): | 21 |
# The fund itself does not pay a management fee but the underlying funds in which the fund invests do pay management fees to MFS.
PORTFOLIO COMPOSITION (BASED ON TOTAL INVESTMENTS AS OF 4/30/26)
Portfolio allocation

Portfolio holdings
| MFS Blended Research International Equity Fund | 11.1% |
| MFS Blended Research Mid Cap Equity Fund | 10.0% |
| MFS Blended Research Value Equity Fund | 5.5% |
| MFS Value Fund | 5.5% |
| MFS Growth Fund | 5.2% |
| MFS Blended Research Growth Equity Fund | 5.2% |
| MFS Commodity Strategy Fund | 5.1% |
| MFS Mid Cap Growth Fund | 5.0% |
| MFS Global Real Estate Fund | 5.0% |
| MFS Mid Cap Value Fund | 5.0% |
| MFS Blended Research Core Equity Fund | 4.6% |
| MFS Research Fund | 4.6% |
| MFS International New Discovery Fund | 4.1% |
| MFS Research International Fund | 4.0% |
| MFS International Intrinsic Equity Fund | 3.5% |
| MFS International Growth Fund | 3.5% |
| MFS Blended Research Small Cap Equity Fund | 2.5% |
| MFS Inflation-Adjusted Bond Fund | 2.5% |
| MFS Total Return Bond Fund | 2.4% |
| MFS New Discovery Fund | 1.3% |
| MFS New Discovery Value Fund | 1.3% |
| MFS Blended Research Emerging Markets Equity Fund | 1.1% |
| MFS Emerging Markets Equity Fund | 1.0% |
| MFS Institutional Money Market Portfolio | 1.0% |
FUND EXPENSES
What were the fund costs for the last year?
| (based on a hypothetical $10,000 investment) | ||
| Class Name | Costs of a $10,000 investment ~ | Costs paid as a percentage of a $10,000 investment ~ |
| R3 | $28 | 0.25% |
˜ Expenses are direct expenses and do not include underlying fund fees and expenses.
MANAGEMENT'S DISCUSSION OF FUND PERFORMANCE
-
For the twelve months ended April 30, 2026, Class R3 shares of the MFS Lifetime 2065 Fund (fund) provided a total return of 24.44%, at net asset value. This compares with a return of 31.05% for the fund’s benchmark, the Standard & Poor's 500 Stock Index. The fund's other benchmark, the MFS Lifetime 2065 Fund Blended Index (Blended Index), generated a return of 28.01%. The Blended Index reflects the blended returns of broad asset class indices, with percentage allocations to each index designed to resemble the long term strategic allocations of the fund. The market indices and related percentage allocations used to compile the Blended Index are set forth in the Fund Performance.
-
Global equity markets reached record levels during the period, withstanding considerable volatility amid tariffs, geopolitical conflict and high levels of uncertainty. A new geopolitical event distressed markets at the end of the period as US and Israeli forces launched strikes against Iran, disrupting Mideast oil and natural gas exports. During the period, a pro-growth tax and spending bill was signed into law in the US, while in Europe, renewed focus on defense and infrastructure spending brightened the economic outlook. In Japan, the election of a pro-growth prime minister sent stocks to new highs prior to the conflict in Iran. Optimism over artificial intelligence remained high.
-
Considerable progress was made in trade talks between the US and many major trading partners, with a fragile truce between the US and China extended through late 2026. While the US Supreme Court struck down part of the Trump administration’s tariff strategy, the administration began deploying other authorities to largely replace the ones that were ruled unconstitutional.
-
Early in the period, moderating inflation pressures allowed many global central banks to ease monetary policy. Amid a difficult policymaking environment and slower job growth, the Federal Reserve resumed easing policy in September and delivered quarter-point rate cuts in October and December before pausing.
-
In fixed income markets, previously range-bound global bond yields spiked following the onset of the Middle East conflict, as energy-driven inflation fears appeared to have rattled bond investors. US rate volatility (as measured by the Merrill Lynch Option Volatility Estimate (MOVE) Index) similarly rose from intra-period lows, reflecting uncertainty around the scope and duration of the conflict and its implications for global growth. However, volatility later retracted as the risk of a broader regional military escalation appeared less likely. Global credit spreads widened only modestly before stabilizing near prior levels, supported by strong demand and resilient underlying fundamentals.
-
Top contributors to performance relative to the Blended Index:
-
The fund's international equity segment benefited relative performance, as the MFS Blended Research International Equity Fund outpaced its respective benchmark.
-
-
Top detractors from performance relative to the Blended Index:
-
Within the US equity segment, lagging relative performance across the majority of the strategies weighed on relative results as the funds generally underperformed their respective benchmarks. Style selection also held back relative performance as mid-cap growth and mid-cap core strategies underperformed the broader index.
-
FUND PERFORMANCE
The fund’s past performance is not a good predictor of the fund’s future performance. The graph and table below do not reflect the deduction of taxes that a shareholder would pay on fund distributions or the redemption of fund shares. The graph and table below assume reinvestment of dividends and capital gain distributions.
Growth of a Hypothetical $10,000 Investment*
This graph shows the performance of a hypothetical $10,000 investment in Class R3 over a ten year period or since inception, if shorter, in comparison to (i) a broad measure of market performance and (ii) an additional index that MFS believes more closely reflects the market segments in which the fund invests.

Average Annual Total Returns through 4/30/26
This table shows the average annual total returns of the class of shares noted for the periods shown, both with (if any) and without sales charges. It also shows the average annual total returns of (i) a broad measure of market performance and (ii) an additional index that MFS believes more closely reflects the market segments in which the fund invests, over the same periods.
| Share Class | 1-yr | Life* |
| R3 without sales charge | 24.44% | 7.52% |
| Comparative Benchmark(s) | ||
| Standard & Poor's 500 Stock Index ∆ | 31.05% | 12.12% |
| MFS Lifetime 2065 Fund Blended Index ∆ | 28.01% | 10.13% |
|
*
|
For the period from the commencement of the class's investment operations, September 1, 2021 through April 30, 2026.
|
|
∆
|
Source: FactSet Research Systems Inc.
|
Visit mfs.com/perf/r3 for more recent performance information.
FUND STATISTICS AS OF 4/30/26
| Net Assets ($): | 52,384,457 | Total Management Fee ($)#: | 0 | |
| Total Number of Holdings: | 24 | Portfolio Turnover Rate (%): | 21 |
# The fund itself does not pay a management fee but the underlying funds in which the fund invests do pay management fees to MFS.
PORTFOLIO COMPOSITION (BASED ON TOTAL INVESTMENTS AS OF 4/30/26)
Portfolio allocation

Portfolio holdings
| MFS Blended Research International Equity Fund | 11.1% |
| MFS Blended Research Mid Cap Equity Fund | 10.0% |
| MFS Blended Research Value Equity Fund | 5.5% |
| MFS Value Fund | 5.5% |
| MFS Growth Fund | 5.2% |
| MFS Blended Research Growth Equity Fund | 5.2% |
| MFS Commodity Strategy Fund | 5.1% |
| MFS Mid Cap Growth Fund | 5.0% |
| MFS Global Real Estate Fund | 5.0% |
| MFS Mid Cap Value Fund | 5.0% |
| MFS Blended Research Core Equity Fund | 4.6% |
| MFS Research Fund | 4.6% |
| MFS International New Discovery Fund | 4.1% |
| MFS Research International Fund | 4.0% |
| MFS International Intrinsic Equity Fund | 3.5% |
| MFS International Growth Fund | 3.5% |
| MFS Blended Research Small Cap Equity Fund | 2.5% |
| MFS Inflation-Adjusted Bond Fund | 2.5% |
| MFS Total Return Bond Fund | 2.4% |
| MFS New Discovery Fund | 1.3% |
| MFS New Discovery Value Fund | 1.3% |
| MFS Blended Research Emerging Markets Equity Fund | 1.1% |
| MFS Emerging Markets Equity Fund | 1.0% |
| MFS Institutional Money Market Portfolio | 1.0% |
FUND EXPENSES
What were the fund costs for the last year?
| (based on a hypothetical $10,000 investment) | ||
| Class Name | Costs of a $10,000 investment | Costs paid as a percentage of a $10,000 investment |
| R6 | $34 | 0.33% |
MANAGEMENT'S DISCUSSION OF FUND PERFORMANCE
-
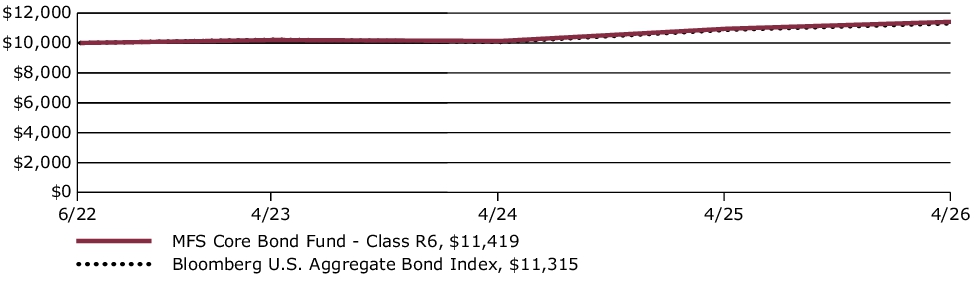
For the twelve months ended April 30, 2026, Class R6 shares of the MFS Core Bond Fund (fund) provided a total return of 4.25%, at net asset value. This compares with a return of 4.06% for the fund’s benchmark, the Bloomberg U.S. Aggregate Bond Index.
-
Global equity markets reached record levels during the period, withstanding considerable volatility amid tariffs, geopolitical conflict and high levels of uncertainty. A new geopolitical event distressed markets at the end of the period as US and Israeli forces launched strikes against Iran, disrupting Mideast oil and natural gas exports. During the period, a pro-growth tax and spending bill was signed into law in the US, while in Europe, renewed focus on defense and infrastructure spending brightened the economic outlook. In Japan, the election of a pro-growth prime minister sent stocks to new highs prior to the conflict in Iran. Optimism over artificial intelligence remained high.
-
Considerable progress was made in trade talks between the US and many major trading partners, with a fragile truce between the US and China extended through late 2026. While the US Supreme Court struck down part of the Trump administration’s tariff strategy, the administration began deploying other authorities to largely replace the ones that were ruled unconstitutional.
-
Early in the period, moderating inflation pressures allowed many global central banks to ease monetary policy. Amid a difficult policymaking environment and slower job growth, the Federal Reserve resumed easing policy in September and delivered quarter-point rate cuts in October and December before pausing.
-
In fixed income markets, previously range-bound global bond yields spiked following the onset of the Middle East conflict, as energy-driven inflation fears appeared to have rattled bond investors. US rate volatility (as measured by the Merrill Lynch Option Volatility Estimate (MOVE) Index) similarly rose from intra-period lows, reflecting uncertainty around the scope and duration of the conflict and its implications for global growth. However, volatility later retracted as the risk of a broader regional military escalation appeared less likely. Global credit spreads widened only modestly before stabilizing near prior levels, supported by strong demand and resilient underlying fundamentals.
-
Top contributors to performance relative to the Bloomberg U.S. Aggregate Bond Index:
-
The fund's underweight exposure to the treasury sector and out-of-benchmark exposure to the collateralized mortgage obligation (CMO) sector aided relative performance.
-
Yield curve positioning also benefited relative returns.
-
-
Top detractors from performance relative to the Bloomberg U.S. Aggregate Bond Index:
-
Security selection within the mortgage-backed security (MBS) sector and within AA-rated bonds held back the fund's relative performance.
-
FUND PERFORMANCE
The fund’s past performance is not a good predictor of the fund’s future performance. The graph and table below do not reflect the deduction of taxes that a shareholder would pay on fund distributions or the redemption of fund shares. The graph and table below assume reinvestment of dividends and capital gain distributions.
Growth of a Hypothetical $10,000 Investment*
This graph shows the performance of a hypothetical $10,000 investment in Class R6 over a ten year period or since inception, if shorter, in comparison to a broad measure of market performance.
Average Annual Total Returns through 4/30/26
This table shows the average annual total returns of the class of shares noted for the periods shown, both with (if any) and without sales charges. It also shows the average annual total returns of a broad measure of market performance over the same periods.
| Share Class | 1-yr | Life* |
| R6 without sales charge | 4.25% | 3.50% |
| Comparative Benchmark(s) | ||
| Bloomberg U.S. Aggregate Bond Index ∆ | 4.06% | 3.25% |
|
*
|
For the period from the commencement of the class's investment operations, June 22, 2022 through April 30, 2026.
|
|
∆
|
Source: FactSet Research Systems Inc.
|
Visit mfs.com/perf/r6 for more recent performance information.
FUND STATISTICS AS OF 4/30/26
| Net Assets ($): | 33,917,711 | Average Effective Maturity (yrs): | 7.4 | |
| Total Number of Holdings: | 307 | Average Effective Duration (yrs): | 5.8 | |
| Total Management Fee ($)#: | 103,802 | |||
| Portfolio Turnover Rate (%): | 110 |
# Includes the effect of any management fee waivers, if applicable.
Where the fund holds derivatives, they are not included in the total number of portfolio holdings.
PORTFOLIO COMPOSITION (BASED ON TOTAL INVESTMENTS AS OF 4/30/26)
Portfolio structure
| Fixed Income | 95.4% |
| Money Market Funds | 4.6% |
Composition including fixed income credit
quality
quality
| AAA | 15.8% |
| AA | 4.0% |
| A | 14.3% |
| BBB | 17.1% |
| U.S. Government | 22.7% |
| Federal Agencies | 21.5% |
| Money Market Funds | 4.6% |
Ratings are assigned using Moody’s, Fitch, and Standard & Poor’s and applying a hierarchy: If all 3 agencies rate a security, the middle rating is assigned; if 2 agencies rate a security, the lower rating is assigned. If none of the 3 agencies rate a security, we use DBRS Morningstar. If none of the 4 agencies rate a security, we use Kroll Bond Rating Agency. Ratings are shown in the S&P and Fitch scale (e.g., AAA). All ratings are subject to change.
Ratings are assigned using Moody’s, Fitch, and Standard & Poor’s and applying a hierarchy: If all 3 agencies rate a security, the middle rating is assigned; if 2 agencies rate a security, the lower rating is assigned. If none of the 3 agencies rate a security, we use DBRS Morningstar. If none of the 4 agencies rate a security, we use Kroll Bond Rating Agency. Ratings are shown in the S&P and Fitch scale (e.g., AAA). All ratings are subject to change.
FUND EXPENSES
What were the fund costs for the last year?
| (based on a hypothetical $10,000 investment) | ||
| Class Name | Costs of a $10,000 investment | Costs paid as a percentage of a $10,000 investment |
| R1 | $138 | 1.36% |
MANAGEMENT'S DISCUSSION OF FUND PERFORMANCE
-
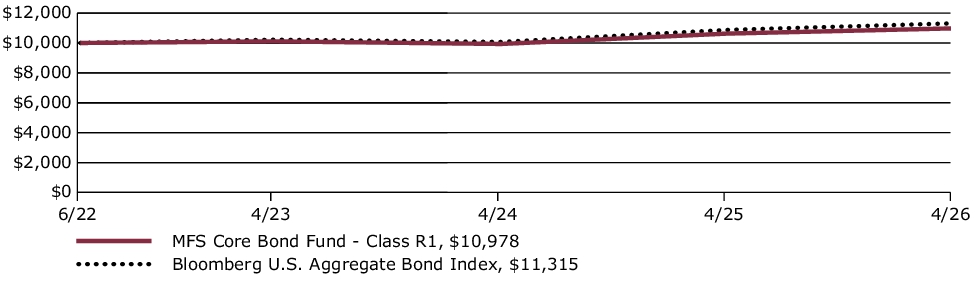
For the twelve months ended April 30, 2026, Class R1 shares of the MFS Core Bond Fund (fund) provided a total return of 3.30%, at net asset value. This compares with a return of 4.06% for the fund’s benchmark, the Bloomberg U.S. Aggregate Bond Index.
-
Global equity markets reached record levels during the period, withstanding considerable volatility amid tariffs, geopolitical conflict and high levels of uncertainty. A new geopolitical event distressed markets at the end of the period as US and Israeli forces launched strikes against Iran, disrupting Mideast oil and natural gas exports. During the period, a pro-growth tax and spending bill was signed into law in the US, while in Europe, renewed focus on defense and infrastructure spending brightened the economic outlook. In Japan, the election of a pro-growth prime minister sent stocks to new highs prior to the conflict in Iran. Optimism over artificial intelligence remained high.
-
Considerable progress was made in trade talks between the US and many major trading partners, with a fragile truce between the US and China extended through late 2026. While the US Supreme Court struck down part of the Trump administration’s tariff strategy, the administration began deploying other authorities to largely replace the ones that were ruled unconstitutional.
-
Early in the period, moderating inflation pressures allowed many global central banks to ease monetary policy. Amid a difficult policymaking environment and slower job growth, the Federal Reserve resumed easing policy in September and delivered quarter-point rate cuts in October and December before pausing.
-
In fixed income markets, previously range-bound global bond yields spiked following the onset of the Middle East conflict, as energy-driven inflation fears appeared to have rattled bond investors. US rate volatility (as measured by the Merrill Lynch Option Volatility Estimate (MOVE) Index) similarly rose from intra-period lows, reflecting uncertainty around the scope and duration of the conflict and its implications for global growth. However, volatility later retracted as the risk of a broader regional military escalation appeared less likely. Global credit spreads widened only modestly before stabilizing near prior levels, supported by strong demand and resilient underlying fundamentals.
-
Top contributors to performance relative to the Bloomberg U.S. Aggregate Bond Index:
-
The fund's underweight exposure to the treasury sector and out-of-benchmark exposure to the collateralized mortgage obligation (CMO) sector aided relative performance.
-
Yield curve positioning also benefited relative returns.
-
-
Top detractors from performance relative to the Bloomberg U.S. Aggregate Bond Index:
-
Security selection within the mortgage-backed security (MBS) sector and within AA-rated bonds held back the fund's relative performance.
-
FUND PERFORMANCE
The fund’s past performance is not a good predictor of the fund’s future performance. The graph and table below do not reflect the deduction of taxes that a shareholder would pay on fund distributions or the redemption of fund shares. The graph and table below assume reinvestment of dividends and capital gain distributions.
Growth of a Hypothetical $10,000 Investment*
This graph shows the performance of a hypothetical $10,000 investment in Class R1 over a ten year period or since inception, if shorter, in comparison to a broad measure of market performance.
Average Annual Total Returns through 4/30/26
This table shows the average annual total returns of the class of shares noted for the periods shown, both with (if any) and without sales charges. It also shows the average annual total returns of a broad measure of market performance over the same periods.
| Share Class | 1-yr | Life* |
| R1 without sales charge | 3.30% | 2.45% |
| Comparative Benchmark(s) | ||
| Bloomberg U.S. Aggregate Bond Index ∆ | 4.06% | 3.25% |
|
*
|
For the period from the commencement of the class's investment operations, June 22, 2022 through April 30, 2026.
|
|
∆
|
Source: FactSet Research Systems Inc.
|
Visit mfs.com/perf/r1 for more recent performance information.
FUND STATISTICS AS OF 4/30/26
| Net Assets ($): | 33,917,711 | Average Effective Maturity (yrs): | 7.4 | |
| Total Number of Holdings: | 307 | Average Effective Duration (yrs): | 5.8 | |
| Total Management Fee ($)#: | 103,802 | |||
| Portfolio Turnover Rate (%): | 110 |
# Includes the effect of any management fee waivers, if applicable.
Where the fund holds derivatives, they are not included in the total number of portfolio holdings.
PORTFOLIO COMPOSITION (BASED ON TOTAL INVESTMENTS AS OF 4/30/26)
Portfolio structure
| Fixed Income | 95.4% |
| Money Market Funds | 4.6% |
Composition including fixed income credit quality
| AAA | 15.8% |
| AA | 4.0% |
| A | 14.3% |
| BBB | 17.1% |
| U.S. Government | 22.7% |
| Federal Agencies | 21.5% |
| Money Market Funds | 4.6% |
Ratings are assigned using Moody’s, Fitch, and Standard & Poor’s and applying a hierarchy: If all 3 agencies rate a security, the middle rating is assigned; if 2 agencies rate a security, the lower rating is assigned. If none of the 3 agencies rate a security, we use DBRS Morningstar. If none of the 4 agencies rate a security, we use Kroll Bond Rating Agency. Ratings are shown in the S&P and Fitch scale (e.g., AAA). All ratings are subject to change.
Ratings are assigned using Moody’s, Fitch, and Standard & Poor’s and applying a hierarchy: If all 3 agencies rate a security, the middle rating is assigned; if 2 agencies rate a security, the lower rating is assigned. If none of the 3 agencies rate a security, we use DBRS Morningstar. If none of the 4 agencies rate a security, we use Kroll Bond Rating Agency. Ratings are shown in the S&P and Fitch scale (e.g., AAA). All ratings are subject to change.
FUND EXPENSES
What were the fund costs for the last year?
| (based on a hypothetical $10,000 investment) | ||
| Class Name | Costs of a $10,000 investment | Costs paid as a percentage of a $10,000 investment |
| R2 | $88 | 0.86% |
MANAGEMENT'S DISCUSSION OF FUND PERFORMANCE
-
For the twelve months ended April 30, 2026, Class R2 shares of the MFS Core Bond Fund (fund) provided a total return of 3.81%, at net asset value. This compares with a return of 4.06% for the fund’s benchmark, the Bloomberg U.S. Aggregate Bond Index.
-
Global equity markets reached record levels during the period, withstanding considerable volatility amid tariffs, geopolitical conflict and high levels of uncertainty. A new geopolitical event distressed markets at the end of the period as US and Israeli forces launched strikes against Iran, disrupting Mideast oil and natural gas exports. During the period, a pro-growth tax and spending bill was signed into law in the US, while in Europe, renewed focus on defense and infrastructure spending brightened the economic outlook. In Japan, the election of a pro-growth prime minister sent stocks to new highs prior to the conflict in Iran. Optimism over artificial intelligence remained high.
-
Considerable progress was made in trade talks between the US and many major trading partners, with a fragile truce between the US and China extended through late 2026. While the US Supreme Court struck down part of the Trump administration’s tariff strategy, the administration began deploying other authorities to largely replace the ones that were ruled unconstitutional.
-
Early in the period, moderating inflation pressures allowed many global central banks to ease monetary policy. Amid a difficult policymaking environment and slower job growth, the Federal Reserve resumed easing policy in September and delivered quarter-point rate cuts in October and December before pausing.
-
In fixed income markets, previously range-bound global bond yields spiked following the onset of the Middle East conflict, as energy-driven inflation fears appeared to have rattled bond investors. US rate volatility (as measured by the Merrill Lynch Option Volatility Estimate (MOVE) Index) similarly rose from intra-period lows, reflecting uncertainty around the scope and duration of the conflict and its implications for global growth. However, volatility later retracted as the risk of a broader regional military escalation appeared less likely. Global credit spreads widened only modestly before stabilizing near prior levels, supported by strong demand and resilient underlying fundamentals.
-
Top contributors to performance relative to the Bloomberg U.S. Aggregate Bond Index:
-
The fund's underweight exposure to the treasury sector and out-of-benchmark exposure to the collateralized mortgage obligation (CMO) sector aided relative performance.
-
Yield curve positioning also benefited relative returns.
-
-
Top detractors from performance relative to the Bloomberg U.S. Aggregate Bond Index:
-
Security selection within the mortgage-backed security (MBS) sector and within AA-rated bonds held back the fund's relative performance.
-
FUND PERFORMANCE
The fund’s past performance is not a good predictor of the fund’s future performance. The graph and table below do not reflect the deduction of taxes that a shareholder would pay on fund distributions or the redemption of fund shares. The graph and table below assume reinvestment of dividends and capital gain distributions.
Growth of a Hypothetical $10,000 Investment*
This graph shows the performance of a hypothetical $10,000 investment in Class R2 over a ten year period or since inception, if shorter, in comparison to a broad measure of market performance.
Average Annual Total Returns through 4/30/26
This table shows the average annual total returns of the class of shares noted for the periods shown, both with (if any) and without sales charges. It also shows the average annual total returns of a broad measure of market performance over the same periods.
| Share Class | 1-yr | Life* |
| R2 without sales charge | 3.81% | 2.96% |
| Comparative Benchmark(s) | ||
| Bloomberg U.S. Aggregate Bond Index ∆ | 4.06% | 3.25% |
|
*
|
For the period from the commencement of the class's investment operations, June 22, 2022 through April 30, 2026.
|
|
∆
|
Source: FactSet Research Systems Inc.
|
Visit mfs.com/perf/r2 for more recent performance information.
FUND STATISTICS AS OF 4/30/26
| Net Assets ($): | 33,917,711 | Average Effective Maturity (yrs): | 7.4 | |
| Total Number of Holdings: | 307 | Average Effective Duration (yrs): | 5.8 | |
| Total Management Fee ($)#: | 103,802 | |||
| Portfolio Turnover Rate (%): | 110 |
# Includes the effect of any management fee waivers, if applicable.
Where the fund holds derivatives, they are not included in the total number of portfolio holdings.
PORTFOLIO COMPOSITION (BASED ON TOTAL INVESTMENTS AS OF 4/30/26)
Portfolio structure
| Fixed Income | 95.4% |
| Money Market Funds | 4.6% |
Composition including fixed income credit quality
| AAA | 15.8% |
| AA | 4.0% |
| A | 14.3% |
| BBB | 17.1% |
| U.S. Government | 22.7% |
| Federal Agencies | 21.5% |
| Money Market Funds | 4.6% |
Ratings are assigned using Moody’s, Fitch, and Standard & Poor’s and applying a hierarchy: If all 3 agencies rate a security, the middle rating is assigned; if 2 agencies rate a security, the lower rating is assigned. If none of the 3 agencies rate a security, we use DBRS Morningstar. If none of the 4 agencies rate a security, we use Kroll Bond Rating Agency. Ratings are shown in the S&P and Fitch scale (e.g., AAA). All ratings are subject to change.
Ratings are assigned using Moody’s, Fitch, and Standard & Poor’s and applying a hierarchy: If all 3 agencies rate a security, the middle rating is assigned; if 2 agencies rate a security, the lower rating is assigned. If none of the 3 agencies rate a security, we use DBRS Morningstar. If none of the 4 agencies rate a security, we use Kroll Bond Rating Agency. Ratings are shown in the S&P and Fitch scale (e.g., AAA). All ratings are subject to change.
FUND EXPENSES
What were the fund costs for the last year?
| (based on a hypothetical $10,000 investment) | ||
| Class Name | Costs of a $10,000 investment | Costs paid as a percentage of a $10,000 investment |
| R3 | $62 | 0.61% |
MANAGEMENT'S DISCUSSION OF FUND PERFORMANCE
-
For the twelve months ended April 30, 2026, Class R3 shares of the MFS Core Bond Fund (fund) provided a total return of 4.07%, at net asset value. This compares with a return of 4.06% for the fund’s benchmark, the Bloomberg U.S. Aggregate Bond Index.
-
Global equity markets reached record levels during the period, withstanding considerable volatility amid tariffs, geopolitical conflict and high levels of uncertainty. A new geopolitical event distressed markets at the end of the period as US and Israeli forces launched strikes against Iran, disrupting Mideast oil and natural gas exports. During the period, a pro-growth tax and spending bill was signed into law in the US, while in Europe, renewed focus on defense and infrastructure spending brightened the economic outlook. In Japan, the election of a pro-growth prime minister sent stocks to new highs prior to the conflict in Iran. Optimism over artificial intelligence remained high.
-
Considerable progress was made in trade talks between the US and many major trading partners, with a fragile truce between the US and China extended through late 2026. While the US Supreme Court struck down part of the Trump administration’s tariff strategy, the administration began deploying other authorities to largely replace the ones that were ruled unconstitutional.
-
Early in the period, moderating inflation pressures allowed many global central banks to ease monetary policy. Amid a difficult policymaking environment and slower job growth, the Federal Reserve resumed easing policy in September and delivered quarter-point rate cuts in October and December before pausing.
-
In fixed income markets, previously range-bound global bond yields spiked following the onset of the Middle East conflict, as energy-driven inflation fears appeared to have rattled bond investors. US rate volatility (as measured by the Merrill Lynch Option Volatility Estimate (MOVE) Index) similarly rose from intra-period lows, reflecting uncertainty around the scope and duration of the conflict and its implications for global growth. However, volatility later retracted as the risk of a broader regional military escalation appeared less likely. Global credit spreads widened only modestly before stabilizing near prior levels, supported by strong demand and resilient underlying fundamentals.
-
Top contributors to performance relative to the Bloomberg U.S. Aggregate Bond Index:
-
The fund's underweight exposure to the treasury sector and out-of-benchmark exposure to the collateralized mortgage obligation (CMO) sector aided relative performance.
-
Yield curve positioning also benefited relative returns.
-
-
Top detractors from performance relative to the Bloomberg U.S. Aggregate Bond Index:
-
Security selection within the mortgage-backed security (MBS) sector and within AA-rated bonds held back the fund's relative performance.
-
FUND PERFORMANCE
The fund’s past performance is not a good predictor of the fund’s future performance. The graph and table below do not reflect the deduction of taxes that a shareholder would pay on fund distributions or the redemption of fund shares. The graph and table below assume reinvestment of dividends and capital gain distributions.
Growth of a Hypothetical $10,000 Investment*
This graph shows the performance of a hypothetical $10,000 investment in Class R3 over a ten year period or since inception, if shorter, in comparison to a broad measure of market performance.
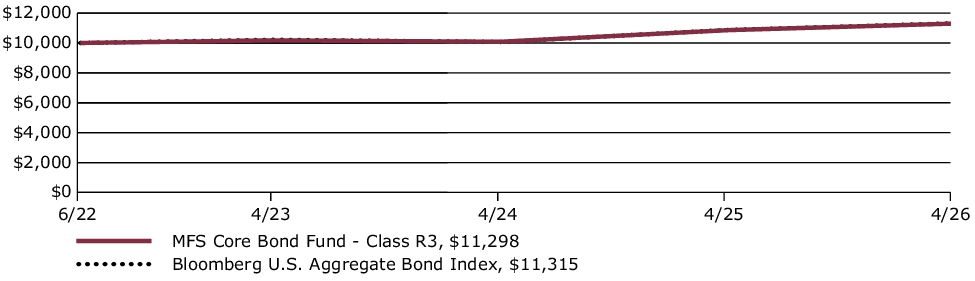
Average Annual Total Returns through 4/30/26
This table shows the average annual total returns of the class of shares noted for the periods shown, both with (if any) and without sales charges. It also shows the average annual total returns of a broad measure of market performance over the same periods.
| Share Class | 1-yr | Life* |
| R3 without sales charge | 4.07% | 3.21% |
| Comparative Benchmark(s) | ||
| Bloomberg U.S. Aggregate Bond Index ∆ | 4.06% | 3.25% |
|
*
|
For the period from the commencement of the class's investment operations, June 22, 2022 through April 30, 2026.
|
|
∆
|
Source: FactSet Research Systems Inc.
|
Visit mfs.com/perf/r3 for more recent performance information.
FUND STATISTICS AS OF 4/30/26
| Net Assets ($): | 33,917,711 | Average Effective Maturity (yrs): | 7.4 | |
| Total Number of Holdings: | 307 | Average Effective Duration (yrs): | 5.8 | |
| Total Management Fee ($)#: | 103,802 | |||
| Portfolio Turnover Rate (%): | 110 |
# Includes the effect of any management fee waivers, if applicable.
Where the fund holds derivatives, they are not included in the total number of portfolio holdings.
PORTFOLIO COMPOSITION (BASED ON TOTAL INVESTMENTS AS OF 4/30/26)
Portfolio structure
| Fixed Income | 95.4% |
| Money Market Funds | 4.6% |
Composition including fixed income credit quality
| AAA | 15.8% |
| AA | 4.0% |
| A | 14.3% |
| BBB | 17.1% |
| U.S. Government | 22.7% |
| Federal Agencies | 21.5% |
| Money Market Funds | 4.6% |
Ratings are assigned using Moody’s, Fitch, and Standard & Poor’s and applying a hierarchy: If all 3 agencies rate a security, the middle rating is assigned; if 2 agencies rate a security, the lower rating is assigned. If none of the 3 agencies rate a security, we use DBRS Morningstar. If none of the 4 agencies rate a security, we use Kroll Bond Rating Agency. Ratings are shown in the S&P and Fitch scale (e.g., AAA). All ratings are subject to change.
Ratings are assigned using Moody’s, Fitch, and Standard & Poor’s and applying a hierarchy: If all 3 agencies rate a security, the middle rating is assigned; if 2 agencies rate a security, the lower rating is assigned. If none of the 3 agencies rate a security, we use DBRS Morningstar. If none of the 4 agencies rate a security, we use Kroll Bond Rating Agency. Ratings are shown in the S&P and Fitch scale (e.g., AAA). All ratings are subject to change.
FUND EXPENSES
What were the fund costs for the last year?
| (based on a hypothetical $10,000 investment) | ||
| Class Name | Costs of a $10,000 investment | Costs paid as a percentage of a $10,000 investment |
| R4 | $37 | 0.36% |
MANAGEMENT'S DISCUSSION OF FUND PERFORMANCE
-
For the twelve months ended April 30, 2026, Class R4 shares of the MFS Core Bond Fund (fund) provided a total return of 4.22%, at net asset value. This compares with a return of 4.06% for the fund’s benchmark, the Bloomberg U.S. Aggregate Bond Index.
-
Global equity markets reached record levels during the period, withstanding considerable volatility amid tariffs, geopolitical conflict and high levels of uncertainty. A new geopolitical event distressed markets at the end of the period as US and Israeli forces launched strikes against Iran, disrupting Mideast oil and natural gas exports. During the period, a pro-growth tax and spending bill was signed into law in the US, while in Europe, renewed focus on defense and infrastructure spending brightened the economic outlook. In Japan, the election of a pro-growth prime minister sent stocks to new highs prior to the conflict in Iran. Optimism over artificial intelligence remained high.
-
Considerable progress was made in trade talks between the US and many major trading partners, with a fragile truce between the US and China extended through late 2026. While the US Supreme Court struck down part of the Trump administration’s tariff strategy, the administration began deploying other authorities to largely replace the ones that were ruled unconstitutional.
-
Early in the period, moderating inflation pressures allowed many global central banks to ease monetary policy. Amid a difficult policymaking environment and slower job growth, the Federal Reserve resumed easing policy in September and delivered quarter-point rate cuts in October and December before pausing.
-
In fixed income markets, previously range-bound global bond yields spiked following the onset of the Middle East conflict, as energy-driven inflation fears appeared to have rattled bond investors. US rate volatility (as measured by the Merrill Lynch Option Volatility Estimate (MOVE) Index) similarly rose from intra-period lows, reflecting uncertainty around the scope and duration of the conflict and its implications for global growth. However, volatility later retracted as the risk of a broader regional military escalation appeared less likely. Global credit spreads widened only modestly before stabilizing near prior levels, supported by strong demand and resilient underlying fundamentals.
-
Top contributors to performance relative to the Bloomberg U.S. Aggregate Bond Index:
-
The fund's underweight exposure to the treasury sector and out-of-benchmark exposure to the collateralized mortgage obligation (CMO) sector aided relative performance.
-
Yield curve positioning also benefited relative returns.
-
-
Top detractors from performance relative to the Bloomberg U.S. Aggregate Bond Index:
-
Security selection within the mortgage-backed security (MBS) sector and within AA-rated bonds held back the fund's relative performance.
-
FUND PERFORMANCE
The fund’s past performance is not a good predictor of the fund’s future performance. The graph and table below do not reflect the deduction of taxes that a shareholder would pay on fund distributions or the redemption of fund shares. The graph and table below assume reinvestment of dividends and capital gain distributions.
Growth of a Hypothetical $10,000 Investment*
This graph shows the performance of a hypothetical $10,000 investment in Class R4 over a ten year period or since inception, if shorter, in comparison to a broad measure of market performance.
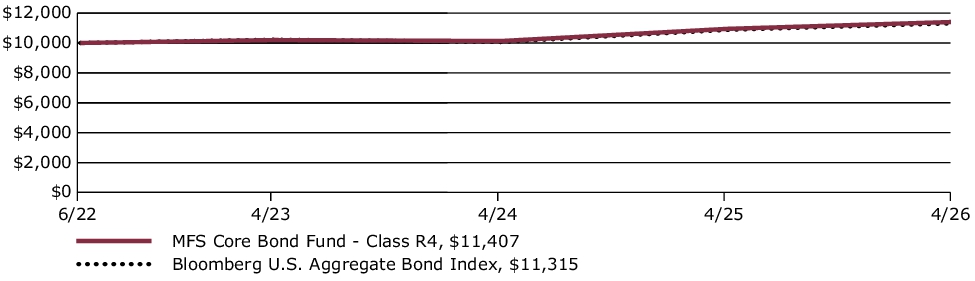
Average Annual Total Returns through 4/30/26
This table shows the average annual total returns of the class of shares noted for the periods shown, both with (if any) and without sales charges. It also shows the average annual total returns of a broad measure of market performance over the same periods.
| Share Class | 1-yr | Life* |
| R4 without sales charge | 4.22% | 3.47% |
| Comparative Benchmark(s) | ||
| Bloomberg U.S. Aggregate Bond Index ∆ | 4.06% | 3.25% |
|
*
|
For the period from the commencement of the class's investment operations, June 22, 2022 through April 30, 2026.
|
|
∆
|
Source: FactSet Research Systems Inc.
|
Visit mfs.com/perf/r4 for more recent performance information.
FUND STATISTICS AS OF 4/30/26
| Net Assets ($): | 33,917,711 | Average Effective Maturity (yrs): | 7.4 | |
| Total Number of Holdings: | 307 | Average Effective Duration (yrs): | 5.8 | |
| Total Management Fee ($)#: | 103,802 | |||
| Portfolio Turnover Rate (%): | 110 |
# Includes the effect of any management fee waivers, if applicable.
Where the fund holds derivatives, they are not included in the total number of portfolio holdings.
PORTFOLIO COMPOSITION (BASED ON TOTAL INVESTMENTS AS OF 4/30/26)
Portfolio structure
| Fixed Income | 95.4% |
| Money Market Funds | 4.6% |
Composition including fixed income credit
quality
quality
| AAA | 15.8% |
| AA | 4.0% |
| A | 14.3% |
| BBB | 17.1% |
| U.S. Government | 22.7% |
| Federal Agencies | 21.5% |
| Money Market Funds | 4.6% |
Ratings are assigned using Moody’s, Fitch, and Standard & Poor’s and applying a hierarchy: If all 3 agencies rate a security, the middle rating is assigned; if 2 agencies rate a security, the lower rating is assigned. If none of the 3 agencies rate a security, we use DBRS Morningstar. If none of the 4 agencies rate a security, we use Kroll Bond Rating Agency. Ratings are shown in the S&P and Fitch scale (e.g., AAA). All ratings are subject to change.
Ratings are assigned using Moody’s, Fitch, and Standard & Poor’s and applying a hierarchy: If all 3 agencies rate a security, the middle rating is assigned; if 2 agencies rate a security, the lower rating is assigned. If none of the 3 agencies rate a security, we use DBRS Morningstar. If none of the 4 agencies rate a security, we use Kroll Bond Rating Agency. Ratings are shown in the S&P and Fitch scale (e.g., AAA). All ratings are subject to change.
FUND EXPENSES
What were the fund costs for the last year?
| (based on a hypothetical $10,000 investment) | ||
| Class Name | Costs of a $10,000 investment | Costs paid as a percentage of a $10,000 investment |
| A | $62 | 0.61% |
MANAGEMENT'S DISCUSSION OF FUND PERFORMANCE
-
For the twelve months ended April 30, 2026, Class A shares of the MFS Core Bond Fund (fund) provided a total return of 3.97%, at net asset value. This compares with a return of 4.06% for the fund’s benchmark, the Bloomberg U.S. Aggregate Bond Index.
-
Global equity markets reached record levels during the period, withstanding considerable volatility amid tariffs, geopolitical conflict and high levels of uncertainty. A new geopolitical event distressed markets at the end of the period as US and Israeli forces launched strikes against Iran, disrupting Mideast oil and natural gas exports. During the period, a pro-growth tax and spending bill was signed into law in the US, while in Europe, renewed focus on defense and infrastructure spending brightened the economic outlook. In Japan, the election of a pro-growth prime minister sent stocks to new highs prior to the conflict in Iran. Optimism over artificial intelligence remained high.
-
Considerable progress was made in trade talks between the US and many major trading partners, with a fragile truce between the US and China extended through late 2026. While the US Supreme Court struck down part of the Trump administration’s tariff strategy, the administration began deploying other authorities to largely replace the ones that were ruled unconstitutional.
-
Early in the period, moderating inflation pressures allowed many global central banks to ease monetary policy. Amid a difficult policymaking environment and slower job growth, the Federal Reserve resumed easing policy in September and delivered quarter-point rate cuts in October and December before pausing.
-
In fixed income markets, previously range-bound global bond yields spiked following the onset of the Middle East conflict, as energy-driven inflation fears appeared to have rattled bond investors. US rate volatility (as measured by the Merrill Lynch Option Volatility Estimate (MOVE) Index) similarly rose from intra-period lows, reflecting uncertainty around the scope and duration of the conflict and its implications for global growth. However, volatility later retracted as the risk of a broader regional military escalation appeared less likely. Global credit spreads widened only modestly before stabilizing near prior levels, supported by strong demand and resilient underlying fundamentals.
-
Top contributors to performance relative to the Bloomberg U.S. Aggregate Bond Index:
-
The fund's underweight exposure to the treasury sector and out-of-benchmark exposure to the collateralized mortgage obligation (CMO) sector aided relative performance.
-
Yield curve positioning also benefited relative returns.
-
-
Top detractors from performance relative to the Bloomberg U.S. Aggregate Bond Index:
-
Security selection within the mortgage-backed security (MBS) sector and within AA-rated bonds held back the fund's relative performance.
-
FUND PERFORMANCE
The fund’s past performance is not a good predictor of the fund’s future performance. The graph and table below do not reflect the deduction of taxes that a shareholder would pay on fund distributions or the redemption of fund shares. The graph and table below assume reinvestment of dividends and capital gain distributions.
Growth of a Hypothetical $10,000 Investment*
This graph shows the performance of a hypothetical $10,000 investment in Class A over a ten year period or since inception, if shorter, in comparison to a broad measure of market performance. This graph includes the deduction of the maximum applicable sales charge.
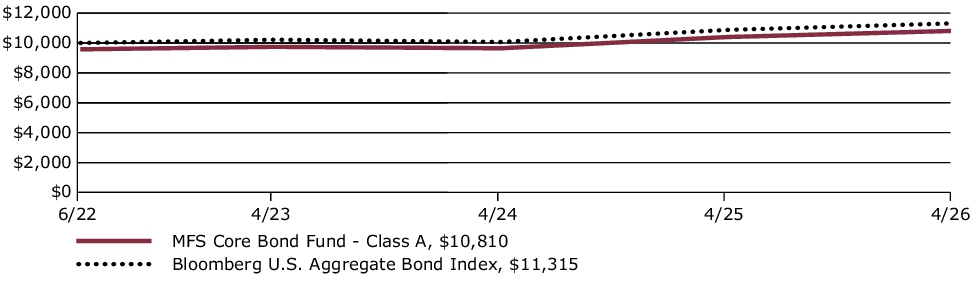
Average Annual Total Returns through 4/30/26
This table shows the average annual total returns of the class of shares noted for the periods shown, both with (if any) and without sales charges. It also shows the average annual total returns of a broad measure of market performance over the same periods.
| Share Class | 1-yr | Life* |
| A without sales charge | 3.97% | 3.19% |
| A with initial sales charge (4.25%) | (0.45)% | 2.04% |
| Comparative Benchmark(s) | ||
| Bloomberg U.S. Aggregate Bond Index ∆ | 4.06% | 3.25% |
|
*
|
For the period from the commencement of the class's investment operations, June 22, 2022 through April 30, 2026.
|
|
∆
|
Source: FactSet Research Systems Inc.
|
Visit mfs.com/perf/a for more recent performance information.
FUND STATISTICS AS OF 4/30/26
| Net Assets ($): | 33,917,711 | Average Effective Maturity (yrs): | 7.4 | |
| Total Number of Holdings: | 307 | Average Effective Duration (yrs): | 5.8 | |
| Total Management Fee ($)#: | 103,802 | |||
| Portfolio Turnover Rate (%): | 110 |
# Includes the effect of any management fee waivers, if applicable.
Where the fund holds derivatives, they are not included in the total number of portfolio holdings.
PORTFOLIO COMPOSITION (BASED ON TOTAL INVESTMENTS AS OF 4/30/26)
Portfolio structure
| Fixed Income | 95.4% |
| Money Market Funds | 4.6% |
Composition including fixed income credit quality
| AAA | 15.8% |
| AA | 4.0% |
| A | 14.3% |
| BBB | 17.1% |
| U.S. Government | 22.7% |
| Federal Agencies | 21.5% |
| Money Market Funds | 4.6% |
Ratings are assigned using Moody’s, Fitch, and Standard & Poor’s and applying a hierarchy: If all 3 agencies rate a security, the middle rating is assigned; if 2 agencies rate a security, the lower rating is assigned. If none of the 3 agencies rate a security, we use DBRS Morningstar. If none of the 4 agencies rate a security, we use Kroll Bond Rating Agency. Ratings are shown in the S&P and Fitch scale (e.g., AAA). All ratings are subject to change.
Ratings are assigned using Moody’s, Fitch, and Standard & Poor’s and applying a hierarchy: If all 3 agencies rate a security, the middle rating is assigned; if 2 agencies rate a security, the lower rating is assigned. If none of the 3 agencies rate a security, we use DBRS Morningstar. If none of the 4 agencies rate a security, we use Kroll Bond Rating Agency. Ratings are shown in the S&P and Fitch scale (e.g., AAA). All ratings are subject to change.
FUND EXPENSES
What were the fund costs for the last year?
| (based on a hypothetical $10,000 investment) | ||
| Class Name | Costs of a $10,000 investment | Costs paid as a percentage of a $10,000 investment |
| C | $138 | 1.36% |
MANAGEMENT'S DISCUSSION OF FUND PERFORMANCE
-
For the twelve months ended April 30, 2026, Class C shares of the MFS Core Bond Fund (fund) provided a total return of 3.29%, at net asset value. This compares with a return of 4.06% for the fund’s benchmark, the Bloomberg U.S. Aggregate Bond Index.
-
Global equity markets reached record levels during the period, withstanding considerable volatility amid tariffs, geopolitical conflict and high levels of uncertainty. A new geopolitical event distressed markets at the end of the period as US and Israeli forces launched strikes against Iran, disrupting Mideast oil and natural gas exports. During the period, a pro-growth tax and spending bill was signed into law in the US, while in Europe, renewed focus on defense and infrastructure spending brightened the economic outlook. In Japan, the election of a pro-growth prime minister sent stocks to new highs prior to the conflict in Iran. Optimism over artificial intelligence remained high.
-
Considerable progress was made in trade talks between the US and many major trading partners, with a fragile truce between the US and China extended through late 2026. While the US Supreme Court struck down part of the Trump administration’s tariff strategy, the administration began deploying other authorities to largely replace the ones that were ruled unconstitutional.
-
Early in the period, moderating inflation pressures allowed many global central banks to ease monetary policy. Amid a difficult policymaking environment and slower job growth, the Federal Reserve resumed easing policy in September and delivered quarter-point rate cuts in October and December before pausing.
-
In fixed income markets, previously range-bound global bond yields spiked following the onset of the Middle East conflict, as energy-driven inflation fears appeared to have rattled bond investors. US rate volatility (as measured by the Merrill Lynch Option Volatility Estimate (MOVE) Index) similarly rose from intra-period lows, reflecting uncertainty around the scope and duration of the conflict and its implications for global growth. However, volatility later retracted as the risk of a broader regional military escalation appeared less likely. Global credit spreads widened only modestly before stabilizing near prior levels, supported by strong demand and resilient underlying fundamentals.
-
Top contributors to performance relative to the Bloomberg U.S. Aggregate Bond Index:
-
The fund's underweight exposure to the treasury sector and out-of-benchmark exposure to the collateralized mortgage obligation (CMO) sector aided relative performance.
-
Yield curve positioning also benefited relative returns.
-
-
Top detractors from performance relative to the Bloomberg U.S. Aggregate Bond Index:
-
Security selection within the mortgage-backed security (MBS) sector and within AA-rated bonds held back the fund's relative performance.
-
FUND PERFORMANCE
The fund’s past performance is not a good predictor of the fund’s future performance. The graph and table below do not reflect the deduction of taxes that a shareholder would pay on fund distributions or the redemption of fund shares. The graph and table below assume reinvestment of dividends and capital gain distributions.
Growth of a Hypothetical $10,000 Investment*
This graph shows the performance of a hypothetical $10,000 investment in Class C over a ten year period or since inception, if shorter, in comparison to a broad measure of market performance.

Average Annual Total Returns through 4/30/26
This table shows the average annual total returns of the class of shares noted for the periods shown, both with (if any) and without sales charges. It also shows the average annual total returns of a broad measure of market performance over the same periods.
| Share Class | 1-yr | Life* |
| C without sales charge | 3.29% | 2.45% |
| C with CDSC (1% for 12 months)× | 2.30% | 2.45% |
| Comparative Benchmark(s) | ||
| Bloomberg U.S. Aggregate Bond Index ∆ | 4.06% | 3.25% |
|
*
|
For the period from the commencement of the class's investment operations, June 22, 2022 through April 30, 2026.
|
|
∆
|
Source: FactSet Research Systems Inc.
|
|
×
|
Assuming redemption at the end of the applicable period.
|
Visit mfs.com/perf/c for more recent performance information.
FUND STATISTICS AS OF 4/30/26
| Net Assets ($): | 33,917,711 | Average Effective Maturity (yrs): | 7.4 | |
| Total Number of Holdings: | 307 | Average Effective Duration (yrs): | 5.8 | |
| Total Management Fee ($)#: | 103,802 | |||
| Portfolio Turnover Rate (%): | 110 |
# Includes the effect of any management fee waivers, if applicable.
Where the fund holds derivatives, they are not included in the total number of portfolio holdings.
PORTFOLIO COMPOSITION (BASED ON TOTAL INVESTMENTS AS OF 4/30/26)
Portfolio structure
| Fixed Income | 95.4% |
| Money Market Funds | 4.6% |
Composition including fixed income credit
quality
quality
| AAA | 15.8% |
| AA | 4.0% |
| A | 14.3% |
| BBB | 17.1% |
| U.S. Government | 22.7% |
| Federal Agencies | 21.5% |
| Money Market Funds | 4.6% |
Ratings are assigned using Moody’s, Fitch, and Standard & Poor’s and applying a hierarchy: If all 3 agencies rate a security, the middle rating is assigned; if 2 agencies rate a security, the lower rating is assigned. If none of the 3 agencies rate a security, we use DBRS Morningstar. If none of the 4 agencies rate a security, we use Kroll Bond Rating Agency. Ratings are shown in the S&P and Fitch scale (e.g., AAA). All ratings are subject to change.
Ratings are assigned using Moody’s, Fitch, and Standard & Poor’s and applying a hierarchy: If all 3 agencies rate a security, the middle rating is assigned; if 2 agencies rate a security, the lower rating is assigned. If none of the 3 agencies rate a security, we use DBRS Morningstar. If none of the 4 agencies rate a security, we use Kroll Bond Rating Agency. Ratings are shown in the S&P and Fitch scale (e.g., AAA). All ratings are subject to change.
FUND EXPENSES
What were the fund costs for the last year?
| (based on a hypothetical $10,000 investment) | ||
| Class Name | Costs of a $10,000 investment | Costs paid as a percentage of a $10,000 investment |
| I | $37 | 0.36% |
MANAGEMENT'S DISCUSSION OF FUND PERFORMANCE
-
For the twelve months ended April 30, 2026, Class I shares of the MFS Core Bond Fund (fund) provided a total return of 4.22%, at net asset value. This compares with a return of 4.06% for the fund’s benchmark, the Bloomberg U.S. Aggregate Bond Index.
-
Global equity markets reached record levels during the period, withstanding considerable volatility amid tariffs, geopolitical conflict and high levels of uncertainty. A new geopolitical event distressed markets at the end of the period as US and Israeli forces launched strikes against Iran, disrupting Mideast oil and natural gas exports. During the period, a pro-growth tax and spending bill was signed into law in the US, while in Europe, renewed focus on defense and infrastructure spending brightened the economic outlook. In Japan, the election of a pro-growth prime minister sent stocks to new highs prior to the conflict in Iran. Optimism over artificial intelligence remained high.
-
Considerable progress was made in trade talks between the US and many major trading partners, with a fragile truce between the US and China extended through late 2026. While the US Supreme Court struck down part of the Trump administration’s tariff strategy, the administration began deploying other authorities to largely replace the ones that were ruled unconstitutional.
-
Early in the period, moderating inflation pressures allowed many global central banks to ease monetary policy. Amid a difficult policymaking environment and slower job growth, the Federal Reserve resumed easing policy in September and delivered quarter-point rate cuts in October and December before pausing.
-
In fixed income markets, previously range-bound global bond yields spiked following the onset of the Middle East conflict, as energy-driven inflation fears appeared to have rattled bond investors. US rate volatility (as measured by the Merrill Lynch Option Volatility Estimate (MOVE) Index) similarly rose from intra-period lows, reflecting uncertainty around the scope and duration of the conflict and its implications for global growth. However, volatility later retracted as the risk of a broader regional military escalation appeared less likely. Global credit spreads widened only modestly before stabilizing near prior levels, supported by strong demand and resilient underlying fundamentals.
-
Top contributors to performance relative to the Bloomberg U.S. Aggregate Bond Index:
-
The fund's underweight exposure to the treasury sector and out-of-benchmark exposure to the collateralized mortgage obligation (CMO) sector aided relative performance.
-
Yield curve positioning also benefited relative returns.
-
-
Top detractors from performance relative to the Bloomberg U.S. Aggregate Bond Index:
-
Security selection within the mortgage-backed security (MBS) sector and within AA-rated bonds held back the fund's relative performance.
-
FUND PERFORMANCE
The fund’s past performance is not a good predictor of the fund’s future performance. The graph and table below do not reflect the deduction of taxes that a shareholder would pay on fund distributions or the redemption of fund shares. The graph and table below assume reinvestment of dividends and capital gain distributions.
Growth of a Hypothetical $10,000 Investment*
This graph shows the performance of a hypothetical $10,000 investment in Class I over a ten year period or since inception, if shorter, in comparison to a broad measure of market performance.
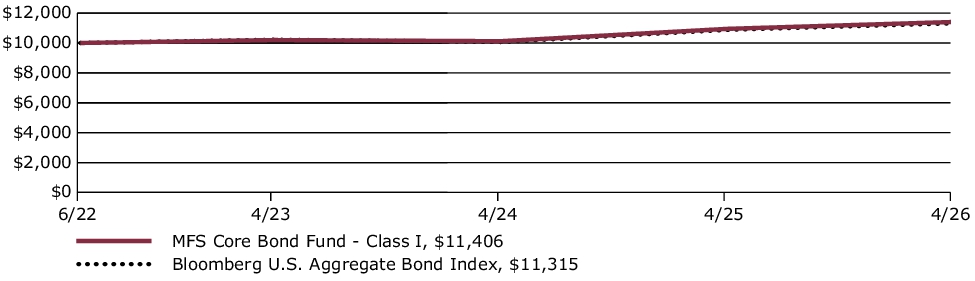
Average Annual Total Returns through 4/30/26
This table shows the average annual total returns of the class of shares noted for the periods shown, both with (if any) and without sales charges. It also shows the average annual total returns of a broad measure of market performance over the same periods.
| Share Class | 1-yr | Life* |
| I without sales charge | 4.22% | 3.47% |
| Comparative Benchmark(s) | ||
| Bloomberg U.S. Aggregate Bond Index ∆ | 4.06% | 3.25% |
|
*
|
For the period from the commencement of the class's investment operations, June 22, 2022 through April 30, 2026.
|
|
∆
|
Source: FactSet Research Systems Inc.
|
Visit mfs.com/perf/i for more recent performance information.
FUND STATISTICS AS OF 4/30/26
| Net Assets ($): | 33,917,711 | Average Effective Maturity (yrs): | 7.4 | |
| Total Number of Holdings: | 307 | Average Effective Duration (yrs): | 5.8 | |
| Total Management Fee ($)#: | 103,802 | |||
| Portfolio Turnover Rate (%): | 110 |
# Includes the effect of any management fee waivers, if applicable.
Where the fund holds derivatives, they are not included in the total number of portfolio holdings.
PORTFOLIO COMPOSITION (BASED ON TOTAL INVESTMENTS AS OF 4/30/26)
Portfolio structure
| Fixed Income | 95.4% |
| Money Market Funds | 4.6% |
Composition including fixed income credit quality
| AAA | 15.8% |
| AA | 4.0% |
| A | 14.3% |
| BBB | 17.1% |
| U.S. Government | 22.7% |
| Federal Agencies | 21.5% |
| Money Market Funds | 4.6% |
Ratings are assigned using Moody’s, Fitch, and Standard & Poor’s and applying a hierarchy: If all 3 agencies rate a security, the middle rating is assigned; if 2 agencies rate a security, the lower rating is assigned. If none of the 3 agencies rate a security, we use DBRS Morningstar. If none of the 4 agencies rate a security, we use Kroll Bond Rating Agency. Ratings are shown in the S&P and Fitch scale (e.g., AAA). All ratings are subject to change.
Ratings are assigned using Moody’s, Fitch, and Standard & Poor’s and applying a hierarchy: If all 3 agencies rate a security, the middle rating is assigned; if 2 agencies rate a security, the lower rating is assigned. If none of the 3 agencies rate a security, we use DBRS Morningstar. If none of the 4 agencies rate a security, we use Kroll Bond Rating Agency. Ratings are shown in the S&P and Fitch scale (e.g., AAA). All ratings are subject to change.
FUND EXPENSES
What were the fund costs for the last year?
| (based on a hypothetical $10,000 investment) | ||
| Class Name | Costs of a $10,000 investment ~ | Costs paid as a percentage of a $10,000 investment ~ |
| A | $28 | 0.25% |
˜ Expenses are direct expenses and do not include underlying fund fees and expenses.
MANAGEMENT'S DISCUSSION OF FUND PERFORMANCE
-
For the twelve months ended April 30, 2026, Class A shares of the MFS Lifetime 2060 Fund (fund) provided a total return of 24.43%, at net asset value. This compares with a return of 31.05% for the fund’s benchmark, the Standard & Poor's 500 Stock Index. The fund's other benchmark, the MFS Lifetime 2060 Fund Blended Index (Blended Index), generated a return of 28.01%. The Blended Index reflects the blended returns of broad asset class indices, with percentage allocations to each index designed to resemble the long term strategic allocations of the fund. The market indices and related percentage allocations used to compile the Blended Index are set forth in the Fund Performance.
-
Global equity markets reached record levels during the period, withstanding considerable volatility amid tariffs, geopolitical conflict and high levels of uncertainty. A new geopolitical event distressed markets at the end of the period as US and Israeli forces launched strikes against Iran, disrupting Mideast oil and natural gas exports. During the period, a pro-growth tax and spending bill was signed into law in the US, while in Europe, renewed focus on defense and infrastructure spending brightened the economic outlook. In Japan, the election of a pro-growth prime minister sent stocks to new highs prior to the conflict in Iran. Optimism over artificial intelligence remained high.
-
Considerable progress was made in trade talks between the US and many major trading partners, with a fragile truce between the US and China extended through late 2026. While the US Supreme Court struck down part of the Trump administration’s tariff strategy, the administration began deploying other authorities to largely replace the ones that were ruled unconstitutional.
-
Early in the period, moderating inflation pressures allowed many global central banks to ease monetary policy. Amid a difficult policymaking environment and slower job growth, the Federal Reserve resumed easing policy in September and delivered quarter-point rate cuts in October and December before pausing.
-
In fixed income markets, previously range-bound global bond yields spiked following the onset of the Middle East conflict, as energy-driven inflation fears appeared to have rattled bond investors. US rate volatility (as measured by the Merrill Lynch Option Volatility Estimate (MOVE) Index) similarly rose from intra-period lows, reflecting uncertainty around the scope and duration of the conflict and its implications for global growth. However, volatility later retracted as the risk of a broader regional military escalation appeared less likely. Global credit spreads widened only modestly before stabilizing near prior levels, supported by strong demand and resilient underlying fundamentals.
-
Top contributors to performance relative to the Blended Index:
-
The fund's international equity segment benefited relative performance, as the MFS Blended Research International Equity Fund outpaced its respective benchmark.
-
-
Top detractors from performance relative to the Blended Index:
-
Within the US equity segment, lagging relative performance across the majority of the strategies weighed on relative results as the funds generally underperformed their respective benchmarks. Style selection also held back relative performance as mid-cap growth and mid-cap core strategies underperformed the broader index.
-
FUND PERFORMANCE
The fund’s past performance is not a good predictor of the fund’s future performance. The graph and table below do not reflect the deduction of taxes that a shareholder would pay on fund distributions or the redemption of fund shares. The graph and table below assume reinvestment of dividends and capital gain distributions.
Growth of a Hypothetical $10,000 Investment*
This graph shows the performance of a hypothetical $10,000 investment in Class A over a ten year period or since inception, if shorter, in comparison to (i) a broad measure of market performance and (ii) an additional index that MFS believes more closely reflects the market segments in which the fund invests. This graph includes the deduction of the maximum applicable sales charge.
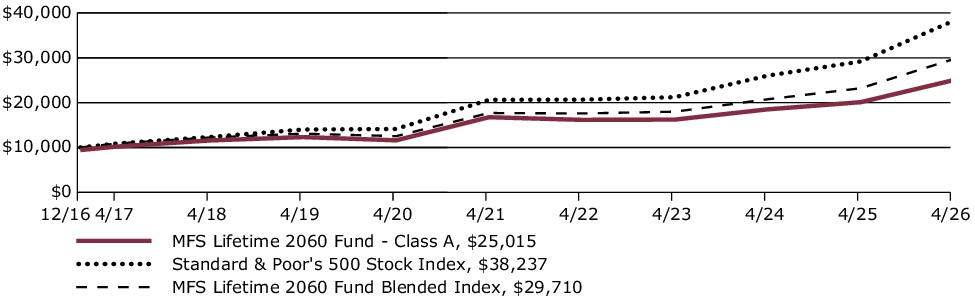
Average Annual Total Returns through 4/30/26
This table shows the average annual total returns of the class of shares noted for the periods shown, both with (if any) and without sales charges. It also shows the average annual total returns of (i) a broad measure of market performance and (ii) an additional index that MFS believes more closely reflects the market segments in which the fund invests, over the same periods.
| Share Class | 1-yr | 5-yr | Life* |
| A without sales charge | 24.43% | 8.35% | 10.94% |
| A with initial sales charge (5.75%) | 17.28% | 7.08% | 10.24% |
| Comparative Benchmark(s) | |||
| Standard & Poor's 500 Stock Index ∆ | 31.05% | 13.14% | 15.33% |
| MFS Lifetime 2060 Fund Blended Index ∆ | 28.01% | 10.93% | 12.27% |
|
*
|
For the period from the commencement of the class's investment operations, December 6, 2016 through April 30, 2026.
|
|
∆
|
Source: FactSet Research Systems Inc.
|
Visit mfs.com/perf/a for more recent performance information.
FUND STATISTICS AS OF 4/30/26
| Net Assets ($): | 271,624,282 | Total Management Fee ($)#: | 0 | |
| Total Number of Holdings: | 24 | Portfolio Turnover Rate (%): | 15 |
# The fund itself does not pay a management fee but the underlying funds in which the fund invests do pay management fees to MFS.
PORTFOLIO COMPOSITION (BASED ON TOTAL INVESTMENTS AS OF 4/30/26)
Portfolio allocation

Portfolio holdings
| MFS Blended Research International Equity Fund | 11.1% |
| MFS Blended Research Mid Cap Equity Fund | 10.0% |
| MFS Blended Research Value Equity Fund | 5.5% |
| MFS Value Fund | 5.5% |
| MFS Growth Fund | 5.2% |
| MFS Blended Research Growth Equity Fund | 5.2% |
| MFS Mid Cap Growth Fund | 5.0% |
| MFS Global Real Estate Fund | 5.0% |
| MFS Commodity Strategy Fund | 5.0% |
| MFS Mid Cap Value Fund | 5.0% |
| MFS Blended Research Core Equity Fund | 4.7% |
| MFS Research Fund | 4.6% |
| MFS International New Discovery Fund | 4.1% |
| MFS Research International Fund | 4.0% |
| MFS International Intrinsic Equity Fund | 3.5% |
| MFS International Growth Fund | 3.5% |
| MFS Blended Research Small Cap Equity Fund | 2.6% |
| MFS Inflation-Adjusted Bond Fund | 2.4% |
| MFS Total Return Bond Fund | 2.4% |
| MFS New Discovery Fund | 1.3% |
| MFS New Discovery Value Fund | 1.3% |
| MFS Blended Research Emerging Markets Equity Fund | 1.1% |
| MFS Emerging Markets Equity Fund | 1.0% |
| MFS Institutional Money Market Portfolio | 1.0% |
FUND EXPENSES
What were the fund costs for the last year?
| (based on a hypothetical $10,000 investment) | ||
| Class Name | Costs of a $10,000 investment ~ | Costs paid as a percentage of a $10,000 investment ~ |
| B | $28 | 0.25% |
˜ Expenses are direct expenses and do not include underlying fund fees and expenses.
MANAGEMENT'S DISCUSSION OF FUND PERFORMANCE
-
For the twelve months ended April 30, 2026, Class B shares of the MFS Lifetime 2060 Fund (fund) provided a total return of 24.39%, at net asset value. This compares with a return of 31.05% for the fund’s benchmark, the Standard & Poor's 500 Stock Index. The fund's other benchmark, the MFS Lifetime 2060 Fund Blended Index (Blended Index), generated a return of 28.01%. The Blended Index reflects the blended returns of broad asset class indices, with percentage allocations to each index designed to resemble the long term strategic allocations of the fund. The market indices and related percentage allocations used to compile the Blended Index are set forth in the Fund Performance.
-
Global equity markets reached record levels during the period, withstanding considerable volatility amid tariffs, geopolitical conflict and high levels of uncertainty. A new geopolitical event distressed markets at the end of the period as US and Israeli forces launched strikes against Iran, disrupting Mideast oil and natural gas exports. During the period, a pro-growth tax and spending bill was signed into law in the US, while in Europe, renewed focus on defense and infrastructure spending brightened the economic outlook. In Japan, the election of a pro-growth prime minister sent stocks to new highs prior to the conflict in Iran. Optimism over artificial intelligence remained high.
-
Considerable progress was made in trade talks between the US and many major trading partners, with a fragile truce between the US and China extended through late 2026. While the US Supreme Court struck down part of the Trump administration’s tariff strategy, the administration began deploying other authorities to largely replace the ones that were ruled unconstitutional.
-
Early in the period, moderating inflation pressures allowed many global central banks to ease monetary policy. Amid a difficult policymaking environment and slower job growth, the Federal Reserve resumed easing policy in September and delivered quarter-point rate cuts in October and December before pausing.
-
In fixed income markets, previously range-bound global bond yields spiked following the onset of the Middle East conflict, as energy-driven inflation fears appeared to have rattled bond investors. US rate volatility (as measured by the Merrill Lynch Option Volatility Estimate (MOVE) Index) similarly rose from intra-period lows, reflecting uncertainty around the scope and duration of the conflict and its implications for global growth. However, volatility later retracted as the risk of a broader regional military escalation appeared less likely. Global credit spreads widened only modestly before stabilizing near prior levels, supported by strong demand and resilient underlying fundamentals.
-
Top contributors to performance relative to the Blended Index:
-
The fund's international equity segment benefited relative performance, as the MFS Blended Research International Equity Fund outpaced its respective benchmark.
-
-
Top detractors from performance relative to the Blended Index:
-
Within the US equity segment, lagging relative performance across the majority of the strategies weighed on relative results as the funds generally underperformed their respective benchmarks. Style selection also held back relative performance as mid-cap growth and mid-cap core strategies underperformed the broader index.
-
FUND PERFORMANCE
The fund’s past performance is not a good predictor of the fund’s future performance. The graph and table below do not reflect the deduction of taxes that a shareholder would pay on fund distributions or the redemption of fund shares. The graph and table below assume reinvestment of dividends and capital gain distributions.
Growth of a Hypothetical $10,000 Investment*
This graph shows the performance of a hypothetical $10,000 investment in Class B over a ten year period or since inception, if shorter, in comparison to (i) a broad measure of market performance and (ii) an additional index that MFS believes more closely reflects the market segments in which the fund invests.
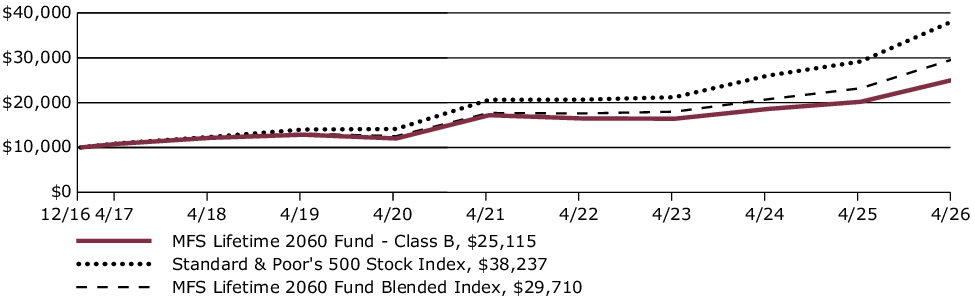
Average Annual Total Returns through 4/30/26
This table shows the average annual total returns of the class of shares noted for the periods shown, both with (if any) and without sales charges. It also shows the average annual total returns of (i) a broad measure of market performance and (ii) an additional index that MFS believes more closely reflects the market segments in which the fund invests, over the same periods.
| Share Class | 1-yr | 5-yr | Life* |
| B without sales charge | 24.39% | 7.87% | 10.29% |
| B with CDSC (declining over six years from 4% to 0%)× | 20.39% | 7.58% | 10.29% |
| Comparative Benchmark(s) | |||
| Standard & Poor's 500 Stock Index ∆ | 31.05% | 13.14% | 15.33% |
| MFS Lifetime 2060 Fund Blended Index ∆ | 28.01% | 10.93% | 12.27% |
|
*
|
For the period from the commencement of the class's investment operations, December 6, 2016 through April 30, 2026.
|
|
∆
|
Source: FactSet Research Systems Inc.
|
|
×
|
Assuming redemption at the end of the applicable period.
|
Visit mfs.com/perf/b for more recent performance information.
FUND STATISTICS AS OF 4/30/26
| Net Assets ($): | 271,624,282 | Total Management Fee ($)#: | 0 | |
| Total Number of Holdings: | 24 | Portfolio Turnover Rate (%): | 15 |
# The fund itself does not pay a management fee but the underlying funds in which the fund invests do pay management fees to MFS.
PORTFOLIO COMPOSITION (BASED ON TOTAL INVESTMENTS AS OF 4/30/26)
Portfolio allocation

Portfolio holdings
| MFS Blended Research International Equity Fund | 11.1% |
| MFS Blended Research Mid Cap Equity Fund | 10.0% |
| MFS Blended Research Value Equity Fund | 5.5% |
| MFS Value Fund | 5.5% |
| MFS Growth Fund | 5.2% |
| MFS Blended Research Growth Equity Fund | 5.2% |
| MFS Mid Cap Growth Fund | 5.0% |
| MFS Global Real Estate Fund | 5.0% |
| MFS Commodity Strategy Fund | 5.0% |
| MFS Mid Cap Value Fund | 5.0% |
| MFS Blended Research Core Equity Fund | 4.7% |
| MFS Research Fund | 4.6% |
| MFS International New Discovery Fund | 4.1% |
| MFS Research International Fund | 4.0% |
| MFS International Intrinsic Equity Fund | 3.5% |
| MFS International Growth Fund | 3.5% |
| MFS Blended Research Small Cap Equity Fund | 2.6% |
| MFS Inflation-Adjusted Bond Fund | 2.4% |
| MFS Total Return Bond Fund | 2.4% |
| MFS New Discovery Fund | 1.3% |
| MFS New Discovery Value Fund | 1.3% |
| MFS Blended Research Emerging Markets Equity Fund | 1.1% |
| MFS Emerging Markets Equity Fund | 1.0% |
| MFS Institutional Money Market Portfolio | 1.0% |
FUND EXPENSES
What were the fund costs for the last year?
| (based on a hypothetical $10,000 investment) | ||
| Class Name | Costs of a $10,000 investment ~ | Costs paid as a percentage of a $10,000 investment ~ |
| C | $111 | 0.99% |
˜ Expenses are direct expenses and do not include underlying fund fees and expenses.
MANAGEMENT'S DISCUSSION OF FUND PERFORMANCE
-
For the twelve months ended April 30, 2026, Class C shares of the MFS Lifetime 2060 Fund (fund) provided a total return of 23.48%, at net asset value. This compares with a return of 31.05% for the fund’s benchmark, the Standard & Poor's 500 Stock Index. The fund's other benchmark, the MFS Lifetime 2060 Fund Blended Index (Blended Index), generated a return of 28.01%. The Blended Index reflects the blended returns of broad asset class indices, with percentage allocations to each index designed to resemble the long term strategic allocations of the fund. The market indices and related percentage allocations used to compile the Blended Index are set forth in the Fund Performance.
-
Global equity markets reached record levels during the period, withstanding considerable volatility amid tariffs, geopolitical conflict and high levels of uncertainty. A new geopolitical event distressed markets at the end of the period as US and Israeli forces launched strikes against Iran, disrupting Mideast oil and natural gas exports. During the period, a pro-growth tax and spending bill was signed into law in the US, while in Europe, renewed focus on defense and infrastructure spending brightened the economic outlook. In Japan, the election of a pro-growth prime minister sent stocks to new highs prior to the conflict in Iran. Optimism over artificial intelligence remained high.
-
Considerable progress was made in trade talks between the US and many major trading partners, with a fragile truce between the US and China extended through late 2026. While the US Supreme Court struck down part of the Trump administration’s tariff strategy, the administration began deploying other authorities to largely replace the ones that were ruled unconstitutional.
-
Early in the period, moderating inflation pressures allowed many global central banks to ease monetary policy. Amid a difficult policymaking environment and slower job growth, the Federal Reserve resumed easing policy in September and delivered quarter-point rate cuts in October and December before pausing.
-
In fixed income markets, previously range-bound global bond yields spiked following the onset of the Middle East conflict, as energy-driven inflation fears appeared to have rattled bond investors. US rate volatility (as measured by the Merrill Lynch Option Volatility Estimate (MOVE) Index) similarly rose from intra-period lows, reflecting uncertainty around the scope and duration of the conflict and its implications for global growth. However, volatility later retracted as the risk of a broader regional military escalation appeared less likely. Global credit spreads widened only modestly before stabilizing near prior levels, supported by strong demand and resilient underlying fundamentals.
-
Top contributors to performance relative to the Blended Index:
-
The fund's international equity segment benefited relative performance, as the MFS Blended Research International Equity Fund outpaced its respective benchmark.
-
-
Top detractors from performance relative to the Blended Index:
-
Within the US equity segment, lagging relative performance across the majority of the strategies weighed on relative results as the funds generally underperformed their respective benchmarks. Style selection also held back relative performance as mid-cap growth and mid-cap core strategies underperformed the broader index.
-
FUND PERFORMANCE
The fund’s past performance is not a good predictor of the fund’s future performance. The graph and table below do not reflect the deduction of taxes that a shareholder would pay on fund distributions or the redemption of fund shares. The graph and table below assume reinvestment of dividends and capital gain distributions.
Growth of a Hypothetical $10,000 Investment*
This graph shows the performance of a hypothetical $10,000 investment in Class C over a ten year period or since inception, if shorter, in comparison to (i) a broad measure of market performance and (ii) an additional index that MFS believes more closely reflects the market segments in which the fund invests.

Average Annual Total Returns through 4/30/26
This table shows the average annual total returns of the class of shares noted for the periods shown, both with (if any) and without sales charges. It also shows the average annual total returns of (i) a broad measure of market performance and (ii) an additional index that MFS believes more closely reflects the market segments in which the fund invests, over the same periods.
| Share Class | 1-yr | 5-yr | Life* |
| C without sales charge | 23.48% | 7.55% | 10.12% |
| C with CDSC (1% for 12 months)× | 22.48% | 7.55% | 10.12% |
| Comparative Benchmark(s) | |||
| Standard & Poor's 500 Stock Index ∆ | 31.05% | 13.14% | 15.33% |
| MFS Lifetime 2060 Fund Blended Index ∆ | 28.01% | 10.93% | 12.27% |
|
*
|
For the period from the commencement of the class's investment operations, December 6, 2016 through April 30, 2026.
|
|
∆
|
Source: FactSet Research Systems Inc.
|
|
×
|
Assuming redemption at the end of the applicable period.
|
Visit mfs.com/perf/c for more recent performance information.
FUND STATISTICS AS OF 4/30/26
| Net Assets ($): | 271,624,282 | Total Management Fee ($)#: | 0 | |
| Total Number of Holdings: | 24 | Portfolio Turnover Rate (%): | 15 |
# The fund itself does not pay a management fee but the underlying funds in which the fund invests do pay management fees to MFS.
PORTFOLIO COMPOSITION (BASED ON TOTAL INVESTMENTS AS OF 4/30/26)
Portfolio allocation

Portfolio holdings
| MFS Blended Research International Equity Fund | 11.1% |
| MFS Blended Research Mid Cap Equity Fund | 10.0% |
| MFS Blended Research Value Equity Fund | 5.5% |
| MFS Value Fund | 5.5% |
| MFS Growth Fund | 5.2% |
| MFS Blended Research Growth Equity Fund | 5.2% |
| MFS Mid Cap Growth Fund | 5.0% |
| MFS Global Real Estate Fund | 5.0% |
| MFS Commodity Strategy Fund | 5.0% |
| MFS Mid Cap Value Fund | 5.0% |
| MFS Blended Research Core Equity Fund | 4.7% |
| MFS Research Fund | 4.6% |
| MFS International New Discovery Fund | 4.1% |
| MFS Research International Fund | 4.0% |
| MFS International Intrinsic Equity Fund | 3.5% |
| MFS International Growth Fund | 3.5% |
| MFS Blended Research Small Cap Equity Fund | 2.6% |
| MFS Inflation-Adjusted Bond Fund | 2.4% |
| MFS Total Return Bond Fund | 2.4% |
| MFS New Discovery Fund | 1.3% |
| MFS New Discovery Value Fund | 1.3% |
| MFS Blended Research Emerging Markets Equity Fund | 1.1% |
| MFS Emerging Markets Equity Fund | 1.0% |
| MFS Institutional Money Market Portfolio | 1.0% |
FUND EXPENSES
What were the fund costs for the last year?
| (based on a hypothetical $10,000 investment) | ||
| Class Name | Costs of a $10,000 investment ~ | Costs paid as a percentage of a $10,000 investment ~ |
| I | $0 | 0.00% |
˜ Expenses are direct expenses and do not include underlying fund fees and expenses.
MANAGEMENT'S DISCUSSION OF FUND PERFORMANCE
-
For the twelve months ended April 30, 2026, Class I shares of the MFS Lifetime 2060 Fund (fund) provided a total return of 24.67%, at net asset value. This compares with a return of 31.05% for the fund’s benchmark, the Standard & Poor's 500 Stock Index. The fund's other benchmark, the MFS Lifetime 2060 Fund Blended Index (Blended Index), generated a return of 28.01%. The Blended Index reflects the blended returns of broad asset class indices, with percentage allocations to each index designed to resemble the long term strategic allocations of the fund. The market indices and related percentage allocations used to compile the Blended Index are set forth in the Fund Performance.
-
Global equity markets reached record levels during the period, withstanding considerable volatility amid tariffs, geopolitical conflict and high levels of uncertainty. A new geopolitical event distressed markets at the end of the period as US and Israeli forces launched strikes against Iran, disrupting Mideast oil and natural gas exports. During the period, a pro-growth tax and spending bill was signed into law in the US, while in Europe, renewed focus on defense and infrastructure spending brightened the economic outlook. In Japan, the election of a pro-growth prime minister sent stocks to new highs prior to the conflict in Iran. Optimism over artificial intelligence remained high.
-
Considerable progress was made in trade talks between the US and many major trading partners, with a fragile truce between the US and China extended through late 2026. While the US Supreme Court struck down part of the Trump administration’s tariff strategy, the administration began deploying other authorities to largely replace the ones that were ruled unconstitutional.
-
Early in the period, moderating inflation pressures allowed many global central banks to ease monetary policy. Amid a difficult policymaking environment and slower job growth, the Federal Reserve resumed easing policy in September and delivered quarter-point rate cuts in October and December before pausing.
-
In fixed income markets, previously range-bound global bond yields spiked following the onset of the Middle East conflict, as energy-driven inflation fears appeared to have rattled bond investors. US rate volatility (as measured by the Merrill Lynch Option Volatility Estimate (MOVE) Index) similarly rose from intra-period lows, reflecting uncertainty around the scope and duration of the conflict and its implications for global growth. However, volatility later retracted as the risk of a broader regional military escalation appeared less likely. Global credit spreads widened only modestly before stabilizing near prior levels, supported by strong demand and resilient underlying fundamentals.
-
Top contributors to performance relative to the Blended Index:
-
The fund's international equity segment benefited relative performance, as the MFS Blended Research International Equity Fund outpaced its respective benchmark.
-
-
Top detractors from performance relative to the Blended Index:
-
Within the US equity segment, lagging relative performance across the majority of the strategies weighed on relative results as the funds generally underperformed their respective benchmarks. Style selection also held back relative performance as mid-cap growth and mid-cap core strategies underperformed the broader index.
-
FUND PERFORMANCE
The fund’s past performance is not a good predictor of the fund’s future performance. The graph and table below do not reflect the deduction of taxes that a shareholder would pay on fund distributions or the redemption of fund shares. The graph and table below assume reinvestment of dividends and capital gain distributions.
Growth of a Hypothetical $10,000 Investment*
This graph shows the performance of a hypothetical $10,000 investment in Class I over a ten year period or since inception, if shorter, in comparison to (i) a broad measure of market performance and (ii) an additional index that MFS believes more closely reflects the market segments in which the fund invests.
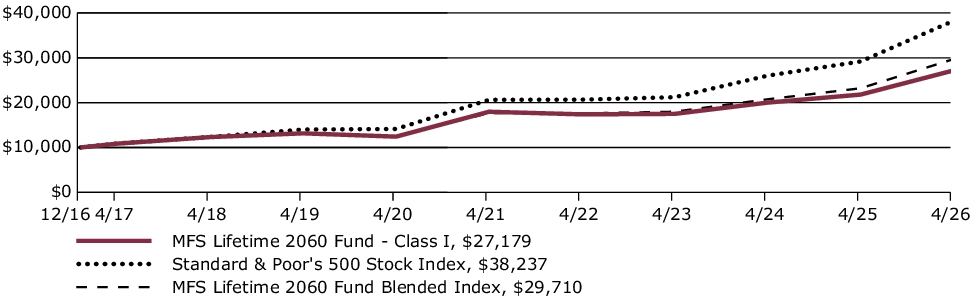
Average Annual Total Returns through 4/30/26
This table shows the average annual total returns of the class of shares noted for the periods shown, both with (if any) and without sales charges. It also shows the average annual total returns of (i) a broad measure of market performance and (ii) an additional index that MFS believes more closely reflects the market segments in which the fund invests, over the same periods.
| Share Class | 1-yr | 5-yr | Life* |
| I without sales charge | 24.67% | 8.63% | 11.22% |
| Comparative Benchmark(s) | |||
| Standard & Poor's 500 Stock Index ∆ | 31.05% | 13.14% | 15.33% |
| MFS Lifetime 2060 Fund Blended Index ∆ | 28.01% | 10.93% | 12.27% |
|
*
|
For the period from the commencement of the class's investment operations, December 6, 2016 through April 30, 2026.
|
|
∆
|
Source: FactSet Research Systems Inc.
|
Visit mfs.com/perf/i for more recent performance information.
FUND STATISTICS AS OF 4/30/26
| Net Assets ($): | 271,624,282 | Total Management Fee ($)#: | 0 | |
| Total Number of Holdings: | 24 | Portfolio Turnover Rate (%): | 15 |
# The fund itself does not pay a management fee but the underlying funds in which the fund invests do pay management fees to MFS.
PORTFOLIO COMPOSITION (BASED ON TOTAL INVESTMENTS AS OF 4/30/26)
Portfolio allocation

Portfolio holdings
| MFS Blended Research International Equity Fund | 11.1% |
| MFS Blended Research Mid Cap Equity Fund | 10.0% |
| MFS Blended Research Value Equity Fund | 5.5% |
| MFS Value Fund | 5.5% |
| MFS Growth Fund | 5.2% |
| MFS Blended Research Growth Equity Fund | 5.2% |
| MFS Mid Cap Growth Fund | 5.0% |
| MFS Global Real Estate Fund | 5.0% |
| MFS Commodity Strategy Fund | 5.0% |
| MFS Mid Cap Value Fund | 5.0% |
| MFS Blended Research Core Equity Fund | 4.7% |
| MFS Research Fund | 4.6% |
| MFS International New Discovery Fund | 4.1% |
| MFS Research International Fund | 4.0% |
| MFS International Intrinsic Equity Fund | 3.5% |
| MFS International Growth Fund | 3.5% |
| MFS Blended Research Small Cap Equity Fund | 2.6% |
| MFS Inflation-Adjusted Bond Fund | 2.4% |
| MFS Total Return Bond Fund | 2.4% |
| MFS New Discovery Fund | 1.3% |
| MFS New Discovery Value Fund | 1.3% |
| MFS Blended Research Emerging Markets Equity Fund | 1.1% |
| MFS Emerging Markets Equity Fund | 1.0% |
| MFS Institutional Money Market Portfolio | 1.0% |
FUND EXPENSES
What were the fund costs for the last year?
| (based on a hypothetical $10,000 investment) | ||
| Class Name | Costs of a $10,000 investment ~ | Costs paid as a percentage of a $10,000 investment ~ |
| R3 | $28 | 0.25% |
˜ Expenses are direct expenses and do not include underlying fund fees and expenses.
MANAGEMENT'S DISCUSSION OF FUND PERFORMANCE
-
For the twelve months ended April 30, 2026, Class R3 shares of the MFS Lifetime 2055 Fund (fund) provided a total return of 24.44%, at net asset value. This compares with a return of 31.05% for the fund’s benchmark, the Standard & Poor's 500 Stock Index. The fund's other benchmark, the MFS Lifetime 2055 Fund Blended Index (Blended Index), generated a return of 28.01%. The Blended Index reflects the blended returns of broad asset class indices, with percentage allocations to each index designed to resemble the long term strategic allocations of the fund. The market indices and related percentage allocations used to compile the Blended Index are set forth in the Fund Performance.
-
Global equity markets reached record levels during the period, withstanding considerable volatility amid tariffs, geopolitical conflict and high levels of uncertainty. A new geopolitical event distressed markets at the end of the period as US and Israeli forces launched strikes against Iran, disrupting Mideast oil and natural gas exports. During the period, a pro-growth tax and spending bill was signed into law in the US, while in Europe, renewed focus on defense and infrastructure spending brightened the economic outlook. In Japan, the election of a pro-growth prime minister sent stocks to new highs prior to the conflict in Iran. Optimism over artificial intelligence remained high.
-
Considerable progress was made in trade talks between the US and many major trading partners, with a fragile truce between the US and China extended through late 2026. While the US Supreme Court struck down part of the Trump administration’s tariff strategy, the administration began deploying other authorities to largely replace the ones that were ruled unconstitutional.
-
Early in the period, moderating inflation pressures allowed many global central banks to ease monetary policy. Amid a difficult policymaking environment and slower job growth, the Federal Reserve resumed easing policy in September and delivered quarter-point rate cuts in October and December before pausing.
-
In fixed income markets, previously range-bound global bond yields spiked following the onset of the Middle East conflict, as energy-driven inflation fears appeared to have rattled bond investors. US rate volatility (as measured by the Merrill Lynch Option Volatility Estimate (MOVE) Index) similarly rose from intra-period lows, reflecting uncertainty around the scope and duration of the conflict and its implications for global growth. However, volatility later retracted as the risk of a broader regional military escalation appeared less likely. Global credit spreads widened only modestly before stabilizing near prior levels, supported by strong demand and resilient underlying fundamentals.
-
Top contributors to performance relative to the Blended Index:
-
The fund's international equity segment benefited relative performance, as the MFS Blended Research International Equity Fund outpaced its respective benchmark.
-
-
Top detractors from performance relative to the Blended Index:
-
Within the US equity segment, lagging relative performance across the majority of the strategies weighed on relative results as the funds generally underperformed their respective benchmarks. Style selection also held back relative performance as mid-cap growth and mid-cap core strategies underperformed the broader index.
-
FUND PERFORMANCE
The fund’s past performance is not a good predictor of the fund’s future performance. The graph and table below do not reflect the deduction of taxes that a shareholder would pay on fund distributions or the redemption of fund shares. The graph and table below assume reinvestment of dividends and capital gain distributions.
Growth of a Hypothetical $10,000 Investment
This graph shows the performance of a hypothetical $10,000 investment in Class R3 over a ten year period or since inception, if shorter, in comparison to (i) a broad measure of market performance and (ii) an additional index that MFS believes more closely reflects the market segments in which the fund invests.
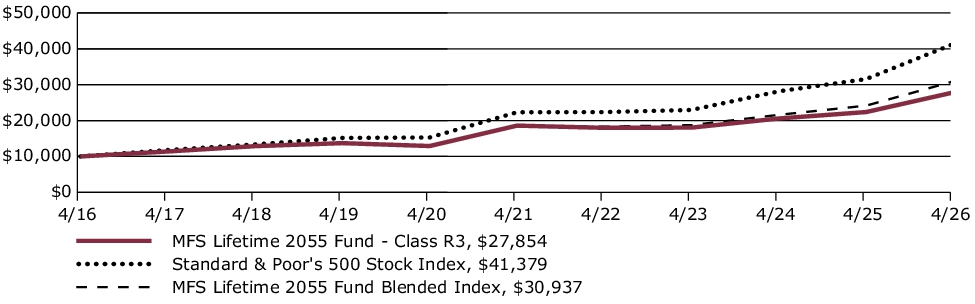
Average Annual Total Returns through 4/30/26
This table shows the average annual total returns of the class of shares noted for the periods shown, both with (if any) and without sales charges. It also shows the average annual total returns of (i) a broad measure of market performance and (ii) an additional index that MFS believes more closely reflects the market segments in which the fund invests, over the same periods.
| Share Class | 1-yr | 5-yr | 10-yr |
| R3 without sales charge | 24.44% | 8.42% | 10.79% |
| Comparative Benchmark(s) | |||
| Standard & Poor's 500 Stock Index ∆ | 31.05% | 13.14% | 15.26% |
| MFS Lifetime 2055 Fund Blended Index ∆ | 28.01% | 10.93% | 11.96% |
|
∆
|
Source: FactSet Research Systems Inc.
|
Visit mfs.com/perf/r3 for more recent performance information.
FUND STATISTICS AS OF 4/30/26
| Net Assets ($): | 451,499,822 | Total Management Fee ($)#: | 0 | |
| Total Number of Holdings: | 24 | Portfolio Turnover Rate (%): | 10 |
# The fund itself does not pay a management fee but the underlying funds in which the fund invests do pay management fees to MFS.
PORTFOLIO COMPOSITION (BASED ON TOTAL INVESTMENTS AS OF 4/30/26)
Portfolio allocation

Portfolio holdings
| MFS Blended Research International Equity Fund | 11.2% |
| MFS Blended Research Mid Cap Equity Fund | 10.1% |
| MFS Blended Research Value Equity Fund | 5.5% |
| MFS Value Fund | 5.5% |
| MFS Growth Fund | 5.2% |
| MFS Blended Research Growth Equity Fund | 5.2% |
| MFS Mid Cap Growth Fund | 5.0% |
| MFS Commodity Strategy Fund | 5.0% |
| MFS Global Real Estate Fund | 5.0% |
| MFS Mid Cap Value Fund | 5.0% |
| MFS Blended Research Core Equity Fund | 4.7% |
| MFS Research Fund | 4.6% |
| MFS International New Discovery Fund | 4.1% |
| MFS Research International Fund | 4.0% |
| MFS International Intrinsic Equity Fund | 3.5% |
| MFS International Growth Fund | 3.5% |
| MFS Blended Research Small Cap Equity Fund | 2.5% |
| MFS Inflation-Adjusted Bond Fund | 2.5% |
| MFS Total Return Bond Fund | 2.4% |
| MFS New Discovery Fund | 1.3% |
| MFS New Discovery Value Fund | 1.2% |
| MFS Blended Research Emerging Markets Equity Fund | 1.0% |
| MFS Emerging Markets Equity Fund | 1.0% |
| MFS Institutional Money Market Portfolio | 1.0% |
FUND EXPENSES
What were the fund costs for the last year?
| (based on a hypothetical $10,000 investment) | ||
| Class Name | Costs of a $10,000 investment ~ | Costs paid as a percentage of a $10,000 investment ~ |
| R4 | $0 | 0.00% |
˜ Expenses are direct expenses and do not include underlying fund fees and expenses.
MANAGEMENT'S DISCUSSION OF FUND PERFORMANCE
-
For the twelve months ended April 30, 2026, Class R4 shares of the MFS Lifetime 2055 Fund (fund) provided a total return of 24.73%, at net asset value. This compares with a return of 31.05% for the fund’s benchmark, the Standard & Poor's 500 Stock Index. The fund's other benchmark, the MFS Lifetime 2055 Fund Blended Index (Blended Index), generated a return of 28.01%. The Blended Index reflects the blended returns of broad asset class indices, with percentage allocations to each index designed to resemble the long term strategic allocations of the fund. The market indices and related percentage allocations used to compile the Blended Index are set forth in the Fund Performance.
-
Global equity markets reached record levels during the period, withstanding considerable volatility amid tariffs, geopolitical conflict and high levels of uncertainty. A new geopolitical event distressed markets at the end of the period as US and Israeli forces launched strikes against Iran, disrupting Mideast oil and natural gas exports. During the period, a pro-growth tax and spending bill was signed into law in the US, while in Europe, renewed focus on defense and infrastructure spending brightened the economic outlook. In Japan, the election of a pro-growth prime minister sent stocks to new highs prior to the conflict in Iran. Optimism over artificial intelligence remained high.
-
Considerable progress was made in trade talks between the US and many major trading partners, with a fragile truce between the US and China extended through late 2026. While the US Supreme Court struck down part of the Trump administration’s tariff strategy, the administration began deploying other authorities to largely replace the ones that were ruled unconstitutional.
-
Early in the period, moderating inflation pressures allowed many global central banks to ease monetary policy. Amid a difficult policymaking environment and slower job growth, the Federal Reserve resumed easing policy in September and delivered quarter-point rate cuts in October and December before pausing.
-
In fixed income markets, previously range-bound global bond yields spiked following the onset of the Middle East conflict, as energy-driven inflation fears appeared to have rattled bond investors. US rate volatility (as measured by the Merrill Lynch Option Volatility Estimate (MOVE) Index) similarly rose from intra-period lows, reflecting uncertainty around the scope and duration of the conflict and its implications for global growth. However, volatility later retracted as the risk of a broader regional military escalation appeared less likely. Global credit spreads widened only modestly before stabilizing near prior levels, supported by strong demand and resilient underlying fundamentals.
-
Top contributors to performance relative to the Blended Index:
-
The fund's international equity segment benefited relative performance, as the MFS Blended Research International Equity Fund outpaced its respective benchmark.
-
-
Top detractors from performance relative to the Blended Index:
-
Within the US equity segment, lagging relative performance across the majority of the strategies weighed on relative results as the funds generally underperformed their respective benchmarks. Style selection also held back relative performance as mid-cap growth and mid-cap core strategies underperformed the broader index.
-
FUND PERFORMANCE
The fund’s past performance is not a good predictor of the fund’s future performance. The graph and table below do not reflect the deduction of taxes that a shareholder would pay on fund distributions or the redemption of fund shares. The graph and table below assume reinvestment of dividends and capital gain distributions.
Growth of a Hypothetical $10,000 Investment
This graph shows the performance of a hypothetical $10,000 investment in Class R4 over a ten year period or since inception, if shorter, in comparison to (i) a broad measure of market performance and (ii) an additional index that MFS believes more closely reflects the market segments in which the fund invests.
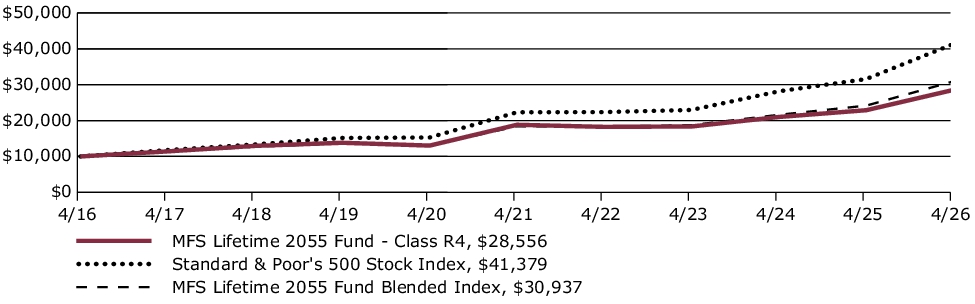
Average Annual Total Returns through 4/30/26
This table shows the average annual total returns of the class of shares noted for the periods shown, both with (if any) and without sales charges. It also shows the average annual total returns of (i) a broad measure of market performance and (ii) an additional index that MFS believes more closely reflects the market segments in which the fund invests, over the same periods.
| Share Class | 1-yr | 5-yr | 10-yr |
| R4 without sales charge | 24.73% | 8.69% | 11.06% |
| Comparative Benchmark(s) | |||
| Standard & Poor's 500 Stock Index ∆ | 31.05% | 13.14% | 15.26% |
| MFS Lifetime 2055 Fund Blended Index ∆ | 28.01% | 10.93% | 11.96% |
|
∆
|
Source: FactSet Research Systems Inc.
|
Visit mfs.com/perf/r4 for more recent performance information.
FUND STATISTICS AS OF 4/30/26
| Net Assets ($): | 451,499,822 | Total Management Fee ($)#: | 0 | |
| Total Number of Holdings: | 24 | Portfolio Turnover Rate (%): | 10 |
# The fund itself does not pay a management fee but the underlying funds in which the fund invests do pay management fees to MFS.
PORTFOLIO COMPOSITION (BASED ON TOTAL INVESTMENTS AS OF 4/30/26)
Portfolio allocation

Portfolio holdings
| MFS Blended Research International Equity Fund | 11.2% |
| MFS Blended Research Mid Cap Equity Fund | 10.1% |
| MFS Blended Research Value Equity Fund | 5.5% |
| MFS Value Fund | 5.5% |
| MFS Growth Fund | 5.2% |
| MFS Blended Research Growth Equity Fund | 5.2% |
| MFS Mid Cap Growth Fund | 5.0% |
| MFS Commodity Strategy Fund | 5.0% |
| MFS Global Real Estate Fund | 5.0% |
| MFS Mid Cap Value Fund | 5.0% |
| MFS Blended Research Core Equity Fund | 4.7% |
| MFS Research Fund | 4.6% |
| MFS International New Discovery Fund | 4.1% |
| MFS Research International Fund | 4.0% |
| MFS International Intrinsic Equity Fund | 3.5% |
| MFS International Growth Fund | 3.5% |
| MFS Blended Research Small Cap Equity Fund | 2.5% |
| MFS Inflation-Adjusted Bond Fund | 2.5% |
| MFS Total Return Bond Fund | 2.4% |
| MFS New Discovery Fund | 1.3% |
| MFS New Discovery Value Fund | 1.2% |
| MFS Blended Research Emerging Markets Equity Fund | 1.0% |
| MFS Emerging Markets Equity Fund | 1.0% |
| MFS Institutional Money Market Portfolio | 1.0% |
FUND EXPENSES
What were the fund costs for the last year?
| (based on a hypothetical $10,000 investment) | ||
| Class Name | Costs of a $10,000 investment ~ | Costs paid as a percentage of a $10,000 investment ~ |
| R6 | $0 | 0.00% |
˜ Expenses are direct expenses and do not include underlying fund fees and expenses.
MANAGEMENT'S DISCUSSION OF FUND PERFORMANCE
-
For the twelve months ended April 30, 2026, Class R6 shares of the MFS Lifetime 2055 Fund (fund) provided a total return of 24.94%, at net asset value. This compares with a return of 31.05% for the fund’s benchmark, the Standard & Poor's 500 Stock Index. The fund's other benchmark, the MFS Lifetime 2055 Fund Blended Index (Blended Index), generated a return of 28.01%. The Blended Index reflects the blended returns of broad asset class indices, with percentage allocations to each index designed to resemble the long term strategic allocations of the fund. The market indices and related percentage allocations used to compile the Blended Index are set forth in the Fund Performance.
-
Global equity markets reached record levels during the period, withstanding considerable volatility amid tariffs, geopolitical conflict and high levels of uncertainty. A new geopolitical event distressed markets at the end of the period as US and Israeli forces launched strikes against Iran, disrupting Mideast oil and natural gas exports. During the period, a pro-growth tax and spending bill was signed into law in the US, while in Europe, renewed focus on defense and infrastructure spending brightened the economic outlook. In Japan, the election of a pro-growth prime minister sent stocks to new highs prior to the conflict in Iran. Optimism over artificial intelligence remained high.
-
Considerable progress was made in trade talks between the US and many major trading partners, with a fragile truce between the US and China extended through late 2026. While the US Supreme Court struck down part of the Trump administration’s tariff strategy, the administration began deploying other authorities to largely replace the ones that were ruled unconstitutional.
-
Early in the period, moderating inflation pressures allowed many global central banks to ease monetary policy. Amid a difficult policymaking environment and slower job growth, the Federal Reserve resumed easing policy in September and delivered quarter-point rate cuts in October and December before pausing.
-
In fixed income markets, previously range-bound global bond yields spiked following the onset of the Middle East conflict, as energy-driven inflation fears appeared to have rattled bond investors. US rate volatility (as measured by the Merrill Lynch Option Volatility Estimate (MOVE) Index) similarly rose from intra-period lows, reflecting uncertainty around the scope and duration of the conflict and its implications for global growth. However, volatility later retracted as the risk of a broader regional military escalation appeared less likely. Global credit spreads widened only modestly before stabilizing near prior levels, supported by strong demand and resilient underlying fundamentals.
-
Top contributors to performance relative to the Blended Index:
-
The fund's international equity segment benefited relative performance, as the MFS Blended Research International Equity Fund outpaced its respective benchmark.
-
-
Top detractors from performance relative to the Blended Index:
-
Within the US equity segment, lagging relative performance across the majority of the strategies weighed on relative results as the funds generally underperformed their respective benchmarks. Style selection also held back relative performance as mid-cap growth and mid-cap core strategies underperformed the broader index.
-
FUND PERFORMANCE
The fund’s past performance is not a good predictor of the fund’s future performance. The graph and table below do not reflect the deduction of taxes that a shareholder would pay on fund distributions or the redemption of fund shares. The graph and table below assume reinvestment of dividends and capital gain distributions.
Growth of a Hypothetical $10,000 Investment*
This graph shows the performance of a hypothetical $10,000 investment in Class R6 over a ten year period or since inception, if shorter, in comparison to (i) a broad measure of market performance and (ii) an additional index that MFS believes more closely reflects the market segments in which the fund invests.
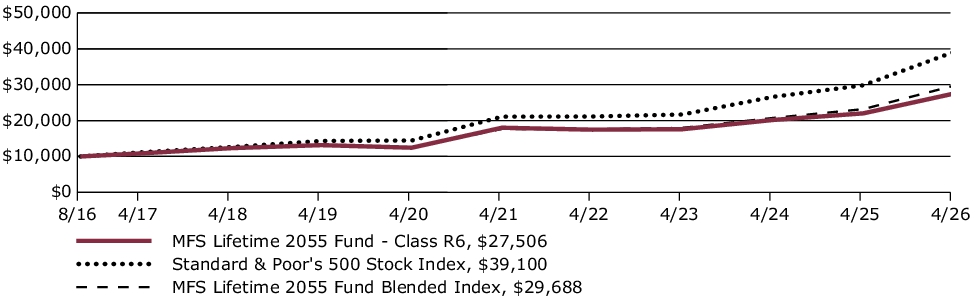
Average Annual Total Returns through 4/30/26
This table shows the average annual total returns of the class of shares noted for the periods shown, both with (if any) and without sales charges. It also shows the average annual total returns of (i) a broad measure of market performance and (ii) an additional index that MFS believes more closely reflects the market segments in which the fund invests, over the same periods.
| Share Class | 1-yr | 5-yr | Life* |
| R6 without sales charge | 24.94% | 8.84% | 11.02% |
| Comparative Benchmark(s) | |||
| Standard & Poor's 500 Stock Index ∆ | 31.05% | 13.14% | 15.13% |
| MFS Lifetime 2055 Fund Blended Index ∆ | 28.01% | 10.93% | 11.90% |
|
*
|
For the period from the commencement of the class's investment operations, August 29, 2016 through April 30, 2026.
|
|
∆
|
Source: FactSet Research Systems Inc.
|
Visit mfs.com/perf/r6 for more recent performance information.
FUND STATISTICS AS OF 4/30/26
| Net Assets ($): | 451,499,822 | Total Management Fee ($)#: | 0 | |
| Total Number of Holdings: | 24 | Portfolio Turnover Rate (%): | 10 |
# The fund itself does not pay a management fee but the underlying funds in which the fund invests do pay management fees to MFS.
PORTFOLIO COMPOSITION (BASED ON TOTAL INVESTMENTS AS OF 4/30/26)
Portfolio allocation

Portfolio holdings
| MFS Blended Research International Equity Fund | 11.2% |
| MFS Blended Research Mid Cap Equity Fund | 10.1% |
| MFS Blended Research Value Equity Fund | 5.5% |
| MFS Value Fund | 5.5% |
| MFS Growth Fund | 5.2% |
| MFS Blended Research Growth Equity Fund | 5.2% |
| MFS Mid Cap Growth Fund | 5.0% |
| MFS Commodity Strategy Fund | 5.0% |
| MFS Global Real Estate Fund | 5.0% |
| MFS Mid Cap Value Fund | 5.0% |
| MFS Blended Research Core Equity Fund | 4.7% |
| MFS Research Fund | 4.6% |
| MFS International New Discovery Fund | 4.1% |
| MFS Research International Fund | 4.0% |
| MFS International Intrinsic Equity Fund | 3.5% |
| MFS International Growth Fund | 3.5% |
| MFS Blended Research Small Cap Equity Fund | 2.5% |
| MFS Inflation-Adjusted Bond Fund | 2.5% |
| MFS Total Return Bond Fund | 2.4% |
| MFS New Discovery Fund | 1.3% |
| MFS New Discovery Value Fund | 1.2% |
| MFS Blended Research Emerging Markets Equity Fund | 1.0% |
| MFS Emerging Markets Equity Fund | 1.0% |
| MFS Institutional Money Market Portfolio | 1.0% |
FUND EXPENSES
What were the fund costs for the last year?
| (based on a hypothetical $10,000 investment) | ||
| Class Name | Costs of a $10,000 investment ~ | Costs paid as a percentage of a $10,000 investment ~ |
| R6 | $0 | 0.00% |
˜ Expenses are direct expenses and do not include underlying fund fees and expenses.
MANAGEMENT'S DISCUSSION OF FUND PERFORMANCE
-
For the twelve months ended April 30, 2026, Class R6 shares of the MFS Lifetime 2060 Fund (fund) provided a total return of 24.83%, at net asset value. This compares with a return of 31.05% for the fund’s benchmark, the Standard & Poor's 500 Stock Index. The fund's other benchmark, the MFS Lifetime 2060 Fund Blended Index (Blended Index), generated a return of 28.01%. The Blended Index reflects the blended returns of broad asset class indices, with percentage allocations to each index designed to resemble the long term strategic allocations of the fund. The market indices and related percentage allocations used to compile the Blended Index are set forth in the Fund Performance.
-
Global equity markets reached record levels during the period, withstanding considerable volatility amid tariffs, geopolitical conflict and high levels of uncertainty. A new geopolitical event distressed markets at the end of the period as US and Israeli forces launched strikes against Iran, disrupting Mideast oil and natural gas exports. During the period, a pro-growth tax and spending bill was signed into law in the US, while in Europe, renewed focus on defense and infrastructure spending brightened the economic outlook. In Japan, the election of a pro-growth prime minister sent stocks to new highs prior to the conflict in Iran. Optimism over artificial intelligence remained high.
-
Considerable progress was made in trade talks between the US and many major trading partners, with a fragile truce between the US and China extended through late 2026. While the US Supreme Court struck down part of the Trump administration’s tariff strategy, the administration began deploying other authorities to largely replace the ones that were ruled unconstitutional.
-
Early in the period, moderating inflation pressures allowed many global central banks to ease monetary policy. Amid a difficult policymaking environment and slower job growth, the Federal Reserve resumed easing policy in September and delivered quarter-point rate cuts in October and December before pausing.
-
In fixed income markets, previously range-bound global bond yields spiked following the onset of the Middle East conflict, as energy-driven inflation fears appeared to have rattled bond investors. US rate volatility (as measured by the Merrill Lynch Option Volatility Estimate (MOVE) Index) similarly rose from intra-period lows, reflecting uncertainty around the scope and duration of the conflict and its implications for global growth. However, volatility later retracted as the risk of a broader regional military escalation appeared less likely. Global credit spreads widened only modestly before stabilizing near prior levels, supported by strong demand and resilient underlying fundamentals.
-
Top contributors to performance relative to the Blended Index:
-
The fund's international equity segment benefited relative performance, as the MFS Blended Research International Equity Fund outpaced its respective benchmark.
-
-
Top detractors from performance relative to the Blended Index:
-
Within the US equity segment, lagging relative performance across the majority of the strategies weighed on relative results as the funds generally underperformed their respective benchmarks. Style selection also held back relative performance as mid-cap growth and mid-cap core strategies underperformed the broader index.
-
FUND PERFORMANCE
The fund’s past performance is not a good predictor of the fund’s future performance. The graph and table below do not reflect the deduction of taxes that a shareholder would pay on fund distributions or the redemption of fund shares. The graph and table below assume reinvestment of dividends and capital gain distributions.
Growth of a Hypothetical $10,000 Investment*
This graph shows the performance of a hypothetical $10,000 investment in Class R6 over a ten year period or since inception, if shorter, in comparison to (i) a broad measure of market performance and (ii) an additional index that MFS believes more closely reflects the market segments in which the fund invests.
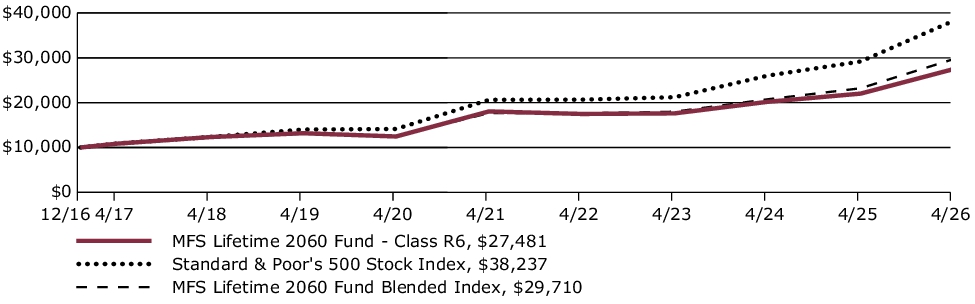
Average Annual Total Returns through 4/30/26
This table shows the average annual total returns of the class of shares noted for the periods shown, both with (if any) and without sales charges. It also shows the average annual total returns of (i) a broad measure of market performance and (ii) an additional index that MFS believes more closely reflects the market segments in which the fund invests, over the same periods.
| Share Class | 1-yr | 5-yr | Life* |
| R6 without sales charge | 24.83% | 8.78% | 11.35% |
| Comparative Benchmark(s) | |||
| Standard & Poor's 500 Stock Index ∆ | 31.05% | 13.14% | 15.33% |
| MFS Lifetime 2060 Fund Blended Index ∆ | 28.01% | 10.93% | 12.27% |
|
*
|
For the period from the commencement of the class's investment operations, December 6, 2016 through April 30, 2026.
|
|
∆
|
Source: FactSet Research Systems Inc.
|
Visit mfs.com/perf/r6 for more recent performance information.
FUND STATISTICS AS OF 4/30/26
| Net Assets ($): | 271,624,282 | Total Management Fee ($)#: | 0 | |
| Total Number of Holdings: | 24 | Portfolio Turnover Rate (%): | 15 |
# The fund itself does not pay a management fee but the underlying funds in which the fund invests do pay management fees to MFS.
PORTFOLIO COMPOSITION (BASED ON TOTAL INVESTMENTS AS OF 4/30/26)
Portfolio allocation

Portfolio holdings
| MFS Blended Research International Equity Fund | 11.1% |
| MFS Blended Research Mid Cap Equity Fund | 10.0% |
| MFS Blended Research Value Equity Fund | 5.5% |
| MFS Value Fund | 5.5% |
| MFS Growth Fund | 5.2% |
| MFS Blended Research Growth Equity Fund | 5.2% |
| MFS Mid Cap Growth Fund | 5.0% |
| MFS Global Real Estate Fund | 5.0% |
| MFS Commodity Strategy Fund | 5.0% |
| MFS Mid Cap Value Fund | 5.0% |
| MFS Blended Research Core Equity Fund | 4.7% |
| MFS Research Fund | 4.6% |
| MFS International New Discovery Fund | 4.1% |
| MFS Research International Fund | 4.0% |
| MFS International Intrinsic Equity Fund | 3.5% |
| MFS International Growth Fund | 3.5% |
| MFS Blended Research Small Cap Equity Fund | 2.6% |
| MFS Inflation-Adjusted Bond Fund | 2.4% |
| MFS Total Return Bond Fund | 2.4% |
| MFS New Discovery Fund | 1.3% |
| MFS New Discovery Value Fund | 1.3% |
| MFS Blended Research Emerging Markets Equity Fund | 1.1% |
| MFS Emerging Markets Equity Fund | 1.0% |
| MFS Institutional Money Market Portfolio | 1.0% |
FUND EXPENSES
What were the fund costs for the last year?
| (based on a hypothetical $10,000 investment) | ||
| Class Name | Costs of a $10,000 investment ~ | Costs paid as a percentage of a $10,000 investment ~ |
| R4 | $0 | 0.00% |
˜ Expenses are direct expenses and do not include underlying fund fees and expenses.
MANAGEMENT'S DISCUSSION OF FUND PERFORMANCE
-
For the twelve months ended April 30, 2026, Class R4 shares of the MFS Lifetime 2060 Fund (fund) provided a total return of 24.71%, at net asset value. This compares with a return of 31.05% for the fund’s benchmark, the Standard & Poor's 500 Stock Index. The fund's other benchmark, the MFS Lifetime 2060 Fund Blended Index (Blended Index), generated a return of 28.01%. The Blended Index reflects the blended returns of broad asset class indices, with percentage allocations to each index designed to resemble the long term strategic allocations of the fund. The market indices and related percentage allocations used to compile the Blended Index are set forth in the Fund Performance.
-
Global equity markets reached record levels during the period, withstanding considerable volatility amid tariffs, geopolitical conflict and high levels of uncertainty. A new geopolitical event distressed markets at the end of the period as US and Israeli forces launched strikes against Iran, disrupting Mideast oil and natural gas exports. During the period, a pro-growth tax and spending bill was signed into law in the US, while in Europe, renewed focus on defense and infrastructure spending brightened the economic outlook. In Japan, the election of a pro-growth prime minister sent stocks to new highs prior to the conflict in Iran. Optimism over artificial intelligence remained high.
-
Considerable progress was made in trade talks between the US and many major trading partners, with a fragile truce between the US and China extended through late 2026. While the US Supreme Court struck down part of the Trump administration’s tariff strategy, the administration began deploying other authorities to largely replace the ones that were ruled unconstitutional.
-
Early in the period, moderating inflation pressures allowed many global central banks to ease monetary policy. Amid a difficult policymaking environment and slower job growth, the Federal Reserve resumed easing policy in September and delivered quarter-point rate cuts in October and December before pausing.
-
In fixed income markets, previously range-bound global bond yields spiked following the onset of the Middle East conflict, as energy-driven inflation fears appeared to have rattled bond investors. US rate volatility (as measured by the Merrill Lynch Option Volatility Estimate (MOVE) Index) similarly rose from intra-period lows, reflecting uncertainty around the scope and duration of the conflict and its implications for global growth. However, volatility later retracted as the risk of a broader regional military escalation appeared less likely. Global credit spreads widened only modestly before stabilizing near prior levels, supported by strong demand and resilient underlying fundamentals.
-
Top contributors to performance relative to the Blended Index:
-
The fund's international equity segment benefited relative performance, as the MFS Blended Research International Equity Fund outpaced its respective benchmark.
-
-
Top detractors from performance relative to the Blended Index:
-
Within the US equity segment, lagging relative performance across the majority of the strategies weighed on relative results as the funds generally underperformed their respective benchmarks. Style selection also held back relative performance as mid-cap growth and mid-cap core strategies underperformed the broader index.
-
FUND PERFORMANCE
The fund’s past performance is not a good predictor of the fund’s future performance. The graph and table below do not reflect the deduction of taxes that a shareholder would pay on fund distributions or the redemption of fund shares. The graph and table below assume reinvestment of dividends and capital gain distributions.
Growth of a Hypothetical $10,000 Investment*
This graph shows the performance of a hypothetical $10,000 investment in Class R4 over a ten year period or since inception, if shorter, in comparison to (i) a broad measure of market performance and (ii) an additional index that MFS believes more closely reflects the market segments in which the fund invests.
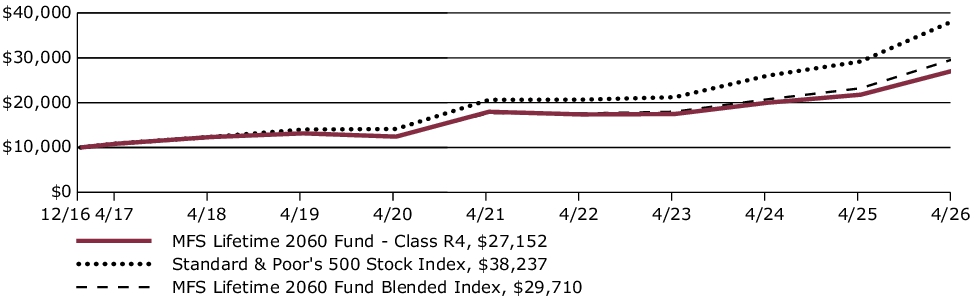
Average Annual Total Returns through 4/30/26
This table shows the average annual total returns of the class of shares noted for the periods shown, both with (if any) and without sales charges. It also shows the average annual total returns of (i) a broad measure of market performance and (ii) an additional index that MFS believes more closely reflects the market segments in which the fund invests, over the same periods.
| Share Class | 1-yr | 5-yr | Life* |
| R4 without sales charge | 24.71% | 8.61% | 11.21% |
| Comparative Benchmark(s) | |||
| Standard & Poor's 500 Stock Index ∆ | 31.05% | 13.14% | 15.33% |
| MFS Lifetime 2060 Fund Blended Index ∆ | 28.01% | 10.93% | 12.27% |
|
*
|
For the period from the commencement of the class's investment operations, December 6, 2016 through April 30, 2026.
|
|
∆
|
Source: FactSet Research Systems Inc.
|
Visit mfs.com/perf/r4 for more recent performance information.
FUND STATISTICS AS OF 4/30/26
| Net Assets ($): | 271,624,282 | Total Management Fee ($)#: | 0 | |
| Total Number of Holdings: | 24 | Portfolio Turnover Rate (%): | 15 |
# The fund itself does not pay a management fee but the underlying funds in which the fund invests do pay management fees to MFS.
PORTFOLIO COMPOSITION (BASED ON TOTAL INVESTMENTS AS OF 4/30/26)
Portfolio allocation

Portfolio holdings
| MFS Blended Research International Equity Fund | 11.1% |
| MFS Blended Research Mid Cap Equity Fund | 10.0% |
| MFS Blended Research Value Equity Fund | 5.5% |
| MFS Value Fund | 5.5% |
| MFS Growth Fund | 5.2% |
| MFS Blended Research Growth Equity Fund | 5.2% |
| MFS Mid Cap Growth Fund | 5.0% |
| MFS Global Real Estate Fund | 5.0% |
| MFS Commodity Strategy Fund | 5.0% |
| MFS Mid Cap Value Fund | 5.0% |
| MFS Blended Research Core Equity Fund | 4.7% |
| MFS Research Fund | 4.6% |
| MFS International New Discovery Fund | 4.1% |
| MFS Research International Fund | 4.0% |
| MFS International Intrinsic Equity Fund | 3.5% |
| MFS International Growth Fund | 3.5% |
| MFS Blended Research Small Cap Equity Fund | 2.6% |
| MFS Inflation-Adjusted Bond Fund | 2.4% |
| MFS Total Return Bond Fund | 2.4% |
| MFS New Discovery Fund | 1.3% |
| MFS New Discovery Value Fund | 1.3% |
| MFS Blended Research Emerging Markets Equity Fund | 1.1% |
| MFS Emerging Markets Equity Fund | 1.0% |
| MFS Institutional Money Market Portfolio | 1.0% |
FUND EXPENSES
What were the fund costs for the last year?
| (based on a hypothetical $10,000 investment) | ||
| Class Name | Costs of a $10,000 investment ~ | Costs paid as a percentage of a $10,000 investment ~ |
| R1 | $28 | 0.25% |
˜ Expenses are direct expenses and do not include underlying fund fees and expenses.
MANAGEMENT'S DISCUSSION OF FUND PERFORMANCE
-
For the twelve months ended April 30, 2026, Class R1 shares of the MFS Lifetime 2060 Fund (fund) provided a total return of 24.44%, at net asset value. This compares with a return of 31.05% for the fund’s benchmark, the Standard & Poor's 500 Stock Index. The fund's other benchmark, the MFS Lifetime 2060 Fund Blended Index (Blended Index), generated a return of 28.01%. The Blended Index reflects the blended returns of broad asset class indices, with percentage allocations to each index designed to resemble the long term strategic allocations of the fund. The market indices and related percentage allocations used to compile the Blended Index are set forth in the Fund Performance.
-
Global equity markets reached record levels during the period, withstanding considerable volatility amid tariffs, geopolitical conflict and high levels of uncertainty. A new geopolitical event distressed markets at the end of the period as US and Israeli forces launched strikes against Iran, disrupting Mideast oil and natural gas exports. During the period, a pro-growth tax and spending bill was signed into law in the US, while in Europe, renewed focus on defense and infrastructure spending brightened the economic outlook. In Japan, the election of a pro-growth prime minister sent stocks to new highs prior to the conflict in Iran. Optimism over artificial intelligence remained high.
-
Considerable progress was made in trade talks between the US and many major trading partners, with a fragile truce between the US and China extended through late 2026. While the US Supreme Court struck down part of the Trump administration’s tariff strategy, the administration began deploying other authorities to largely replace the ones that were ruled unconstitutional.
-
Early in the period, moderating inflation pressures allowed many global central banks to ease monetary policy. Amid a difficult policymaking environment and slower job growth, the Federal Reserve resumed easing policy in September and delivered quarter-point rate cuts in October and December before pausing.
-
In fixed income markets, previously range-bound global bond yields spiked following the onset of the Middle East conflict, as energy-driven inflation fears appeared to have rattled bond investors. US rate volatility (as measured by the Merrill Lynch Option Volatility Estimate (MOVE) Index) similarly rose from intra-period lows, reflecting uncertainty around the scope and duration of the conflict and its implications for global growth. However, volatility later retracted as the risk of a broader regional military escalation appeared less likely. Global credit spreads widened only modestly before stabilizing near prior levels, supported by strong demand and resilient underlying fundamentals.
-
Top contributors to performance relative to the Blended Index:
-
The fund's international equity segment benefited relative performance, as the MFS Blended Research International Equity Fund outpaced its respective benchmark.
-
-
Top detractors from performance relative to the Blended Index:
-
Within the US equity segment, lagging relative performance across the majority of the strategies weighed on relative results as the funds generally underperformed their respective benchmarks. Style selection also held back relative performance as mid-cap growth and mid-cap core strategies underperformed the broader index.
-
FUND PERFORMANCE
The fund’s past performance is not a good predictor of the fund’s future performance. The graph and table below do not reflect the deduction of taxes that a shareholder would pay on fund distributions or the redemption of fund shares. The graph and table below assume reinvestment of dividends and capital gain distributions.
Growth of a Hypothetical $10,000 Investment*
This graph shows the performance of a hypothetical $10,000 investment in Class R1 over a ten year period or since inception, if shorter, in comparison to (i) a broad measure of market performance and (ii) an additional index that MFS believes more closely reflects the market segments in which the fund invests.
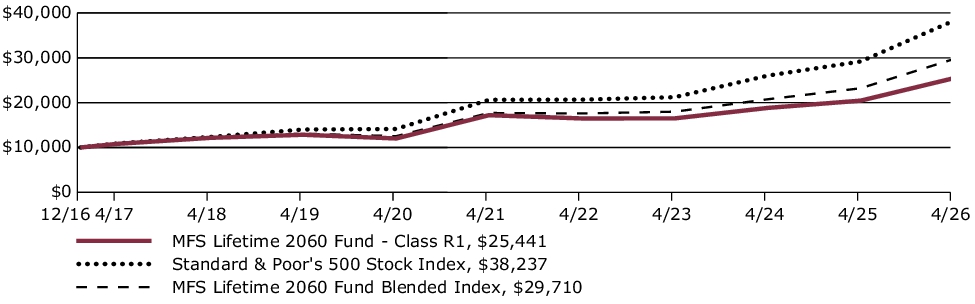
Average Annual Total Returns through 4/30/26
This table shows the average annual total returns of the class of shares noted for the periods shown, both with (if any) and without sales charges. It also shows the average annual total returns of (i) a broad measure of market performance and (ii) an additional index that MFS believes more closely reflects the market segments in which the fund invests, over the same periods.
| Share Class | 1-yr | 5-yr | Life* |
| R1 without sales charge | 24.44% | 8.14% | 10.44% |
| Comparative Benchmark(s) | |||
| Standard & Poor's 500 Stock Index ∆ | 31.05% | 13.14% | 15.33% |
| MFS Lifetime 2060 Fund Blended Index ∆ | 28.01% | 10.93% | 12.27% |
|
*
|
For the period from the commencement of the class's investment operations, December 6, 2016 through April 30, 2026.
|
|
∆
|
Source: FactSet Research Systems Inc.
|
Visit mfs.com/perf/r1 for more recent performance information.
FUND STATISTICS AS OF 4/30/26
| Net Assets ($): | 271,624,282 | Total Management Fee ($)#: | 0 | |
| Total Number of Holdings: | 24 | Portfolio Turnover Rate (%): | 15 |
# The fund itself does not pay a management fee but the underlying funds in which the fund invests do pay management fees to MFS.
PORTFOLIO COMPOSITION (BASED ON TOTAL INVESTMENTS AS OF 4/30/26)
Portfolio allocation

Portfolio holdings
| MFS Blended Research International Equity Fund | 11.1% |
| MFS Blended Research Mid Cap Equity Fund | 10.0% |
| MFS Blended Research Value Equity Fund | 5.5% |
| MFS Value Fund | 5.5% |
| MFS Growth Fund | 5.2% |
| MFS Blended Research Growth Equity Fund | 5.2% |
| MFS Mid Cap Growth Fund | 5.0% |
| MFS Global Real Estate Fund | 5.0% |
| MFS Commodity Strategy Fund | 5.0% |
| MFS Mid Cap Value Fund | 5.0% |
| MFS Blended Research Core Equity Fund | 4.7% |
| MFS Research Fund | 4.6% |
| MFS International New Discovery Fund | 4.1% |
| MFS Research International Fund | 4.0% |
| MFS International Intrinsic Equity Fund | 3.5% |
| MFS International Growth Fund | 3.5% |
| MFS Blended Research Small Cap Equity Fund | 2.6% |
| MFS Inflation-Adjusted Bond Fund | 2.4% |
| MFS Total Return Bond Fund | 2.4% |
| MFS New Discovery Fund | 1.3% |
| MFS New Discovery Value Fund | 1.3% |
| MFS Blended Research Emerging Markets Equity Fund | 1.1% |
| MFS Emerging Markets Equity Fund | 1.0% |
| MFS Institutional Money Market Portfolio | 1.0% |
FUND EXPENSES
What were the fund costs for the last year?
| (based on a hypothetical $10,000 investment) | ||
| Class Name | Costs of a $10,000 investment ~ | Costs paid as a percentage of a $10,000 investment ~ |
| R2 | $56 | 0.50% |
˜ Expenses are direct expenses and do not include underlying fund fees and expenses.
MANAGEMENT'S DISCUSSION OF FUND PERFORMANCE
-
For the twelve months ended April 30, 2026, Class R2 shares of the MFS Lifetime 2060 Fund (fund) provided a total return of 24.05%, at net asset value. This compares with a return of 31.05% for the fund’s benchmark, the Standard & Poor's 500 Stock Index. The fund's other benchmark, the MFS Lifetime 2060 Fund Blended Index (Blended Index), generated a return of 28.01%. The Blended Index reflects the blended returns of broad asset class indices, with percentage allocations to each index designed to resemble the long term strategic allocations of the fund. The market indices and related percentage allocations used to compile the Blended Index are set forth in the Fund Performance.
-
Global equity markets reached record levels during the period, withstanding considerable volatility amid tariffs, geopolitical conflict and high levels of uncertainty. A new geopolitical event distressed markets at the end of the period as US and Israeli forces launched strikes against Iran, disrupting Mideast oil and natural gas exports. During the period, a pro-growth tax and spending bill was signed into law in the US, while in Europe, renewed focus on defense and infrastructure spending brightened the economic outlook. In Japan, the election of a pro-growth prime minister sent stocks to new highs prior to the conflict in Iran. Optimism over artificial intelligence remained high.
-
Considerable progress was made in trade talks between the US and many major trading partners, with a fragile truce between the US and China extended through late 2026. While the US Supreme Court struck down part of the Trump administration’s tariff strategy, the administration began deploying other authorities to largely replace the ones that were ruled unconstitutional.
-
Early in the period, moderating inflation pressures allowed many global central banks to ease monetary policy. Amid a difficult policymaking environment and slower job growth, the Federal Reserve resumed easing policy in September and delivered quarter-point rate cuts in October and December before pausing.
-
In fixed income markets, previously range-bound global bond yields spiked following the onset of the Middle East conflict, as energy-driven inflation fears appeared to have rattled bond investors. US rate volatility (as measured by the Merrill Lynch Option Volatility Estimate (MOVE) Index) similarly rose from intra-period lows, reflecting uncertainty around the scope and duration of the conflict and its implications for global growth. However, volatility later retracted as the risk of a broader regional military escalation appeared less likely. Global credit spreads widened only modestly before stabilizing near prior levels, supported by strong demand and resilient underlying fundamentals.
-
Top contributors to performance relative to the Blended Index:
-
The fund's international equity segment benefited relative performance, as the MFS Blended Research International Equity Fund outpaced its respective benchmark.
-
-
Top detractors from performance relative to the Blended Index:
-
Within the US equity segment, lagging relative performance across the majority of the strategies weighed on relative results as the funds generally underperformed their respective benchmarks. Style selection also held back relative performance as mid-cap growth and mid-cap core strategies underperformed the broader index.
-
FUND PERFORMANCE
The fund’s past performance is not a good predictor of the fund’s future performance. The graph and table below do not reflect the deduction of taxes that a shareholder would pay on fund distributions or the redemption of fund shares. The graph and table below assume reinvestment of dividends and capital gain distributions.
Growth of a Hypothetical $10,000 Investment*
This graph shows the performance of a hypothetical $10,000 investment in Class R2 over a ten year period or since inception, if shorter, in comparison to (i) a broad measure of market performance and (ii) an additional index that MFS believes more closely reflects the market segments in which the fund invests.
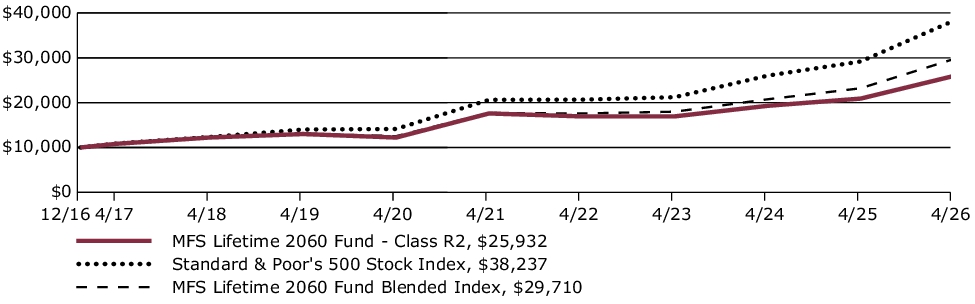
Average Annual Total Returns through 4/30/26
This table shows the average annual total returns of the class of shares noted for the periods shown, both with (if any) and without sales charges. It also shows the average annual total returns of (i) a broad measure of market performance and (ii) an additional index that MFS believes more closely reflects the market segments in which the fund invests, over the same periods.
| Share Class | 1-yr | 5-yr | Life* |
| R2 without sales charge | 24.05% | 8.07% | 10.66% |
| Comparative Benchmark(s) | |||
| Standard & Poor's 500 Stock Index ∆ | 31.05% | 13.14% | 15.33% |
| MFS Lifetime 2060 Fund Blended Index ∆ | 28.01% | 10.93% | 12.27% |
|
*
|
For the period from the commencement of the class's investment operations, December 6, 2016 through April 30, 2026.
|
|
∆
|
Source: FactSet Research Systems Inc.
|
Visit mfs.com/perf/r2 for more recent performance information.
FUND STATISTICS AS OF 4/30/26
| Net Assets ($): | 271,624,282 | Total Management Fee ($)#: | 0 | |
| Total Number of Holdings: | 24 | Portfolio Turnover Rate (%): | 15 |
# The fund itself does not pay a management fee but the underlying funds in which the fund invests do pay management fees to MFS.
PORTFOLIO COMPOSITION (BASED ON TOTAL INVESTMENTS AS OF 4/30/26)
Portfolio allocation

Portfolio holdings
| MFS Blended Research International Equity Fund | 11.1% |
| MFS Blended Research Mid Cap Equity Fund | 10.0% |
| MFS Blended Research Value Equity Fund | 5.5% |
| MFS Value Fund | 5.5% |
| MFS Growth Fund | 5.2% |
| MFS Blended Research Growth Equity Fund | 5.2% |
| MFS Mid Cap Growth Fund | 5.0% |
| MFS Global Real Estate Fund | 5.0% |
| MFS Commodity Strategy Fund | 5.0% |
| MFS Mid Cap Value Fund | 5.0% |
| MFS Blended Research Core Equity Fund | 4.7% |
| MFS Research Fund | 4.6% |
| MFS International New Discovery Fund | 4.1% |
| MFS Research International Fund | 4.0% |
| MFS International Intrinsic Equity Fund | 3.5% |
| MFS International Growth Fund | 3.5% |
| MFS Blended Research Small Cap Equity Fund | 2.6% |
| MFS Inflation-Adjusted Bond Fund | 2.4% |
| MFS Total Return Bond Fund | 2.4% |
| MFS New Discovery Fund | 1.3% |
| MFS New Discovery Value Fund | 1.3% |
| MFS Blended Research Emerging Markets Equity Fund | 1.1% |
| MFS Emerging Markets Equity Fund | 1.0% |
| MFS Institutional Money Market Portfolio | 1.0% |
FUND EXPENSES
What were the fund costs for the last year?
| (based on a hypothetical $10,000 investment) | ||
| Class Name | Costs of a $10,000 investment ~ | Costs paid as a percentage of a $10,000 investment ~ |
| R3 | $28 | 0.25% |
˜ Expenses are direct expenses and do not include underlying fund fees and expenses.
MANAGEMENT'S DISCUSSION OF FUND PERFORMANCE
-
For the twelve months ended April 30, 2026, Class R3 shares of the MFS Lifetime 2060 Fund (fund) provided a total return of 24.38%, at net asset value. This compares with a return of 31.05% for the fund’s benchmark, the Standard & Poor's 500 Stock Index. The fund's other benchmark, the MFS Lifetime 2060 Fund Blended Index (Blended Index), generated a return of 28.01%. The Blended Index reflects the blended returns of broad asset class indices, with percentage allocations to each index designed to resemble the long term strategic allocations of the fund. The market indices and related percentage allocations used to compile the Blended Index are set forth in the Fund Performance.
-
Global equity markets reached record levels during the period, withstanding considerable volatility amid tariffs, geopolitical conflict and high levels of uncertainty. A new geopolitical event distressed markets at the end of the period as US and Israeli forces launched strikes against Iran, disrupting Mideast oil and natural gas exports. During the period, a pro-growth tax and spending bill was signed into law in the US, while in Europe, renewed focus on defense and infrastructure spending brightened the economic outlook. In Japan, the election of a pro-growth prime minister sent stocks to new highs prior to the conflict in Iran. Optimism over artificial intelligence remained high.
-
Considerable progress was made in trade talks between the US and many major trading partners, with a fragile truce between the US and China extended through late 2026. While the US Supreme Court struck down part of the Trump administration’s tariff strategy, the administration began deploying other authorities to largely replace the ones that were ruled unconstitutional.
-
Early in the period, moderating inflation pressures allowed many global central banks to ease monetary policy. Amid a difficult policymaking environment and slower job growth, the Federal Reserve resumed easing policy in September and delivered quarter-point rate cuts in October and December before pausing.
-
In fixed income markets, previously range-bound global bond yields spiked following the onset of the Middle East conflict, as energy-driven inflation fears appeared to have rattled bond investors. US rate volatility (as measured by the Merrill Lynch Option Volatility Estimate (MOVE) Index) similarly rose from intra-period lows, reflecting uncertainty around the scope and duration of the conflict and its implications for global growth. However, volatility later retracted as the risk of a broader regional military escalation appeared less likely. Global credit spreads widened only modestly before stabilizing near prior levels, supported by strong demand and resilient underlying fundamentals.
-
Top contributors to performance relative to the Blended Index:
-
The fund's international equity segment benefited relative performance, as the MFS Blended Research International Equity Fund outpaced its respective benchmark.
-
-
Top detractors from performance relative to the Blended Index:
-
Within the US equity segment, lagging relative performance across the majority of the strategies weighed on relative results as the funds generally underperformed their respective benchmarks. Style selection also held back relative performance as mid-cap growth and mid-cap core strategies underperformed the broader index.
-
FUND PERFORMANCE
The fund’s past performance is not a good predictor of the fund’s future performance. The graph and table below do not reflect the deduction of taxes that a shareholder would pay on fund distributions or the redemption of fund shares. The graph and table below assume reinvestment of dividends and capital gain distributions.
Growth of a Hypothetical $10,000 Investment*
This graph shows the performance of a hypothetical $10,000 investment in Class R3 over a ten year period or since inception, if shorter, in comparison to (i) a broad measure of market performance and (ii) an additional index that MFS believes more closely reflects the market segments in which the fund invests.

Average Annual Total Returns through 4/30/26
This table shows the average annual total returns of the class of shares noted for the periods shown, both with (if any) and without sales charges. It also shows the average annual total returns of (i) a broad measure of market performance and (ii) an additional index that MFS believes more closely reflects the market segments in which the fund invests, over the same periods.
| Share Class | 1-yr | 5-yr | Life* |
| R3 without sales charge | 24.38% | 8.36% | 10.94% |
| Comparative Benchmark(s) | |||
| Standard & Poor's 500 Stock Index ∆ | 31.05% | 13.14% | 15.33% |
| MFS Lifetime 2060 Fund Blended Index ∆ | 28.01% | 10.93% | 12.27% |
|
*
|
For the period from the commencement of the class's investment operations, December 6, 2016 through April 30, 2026.
|
|
∆
|
Source: FactSet Research Systems Inc.
|
Visit mfs.com/perf/r3 for more recent performance information.
FUND STATISTICS AS OF 4/30/26
| Net Assets ($): | 271,624,282 | Total Management Fee ($)#: | 0 | |
| Total Number of Holdings: | 24 | Portfolio Turnover Rate (%): | 15 |
# The fund itself does not pay a management fee but the underlying funds in which the fund invests do pay management fees to MFS.
PORTFOLIO COMPOSITION (BASED ON TOTAL INVESTMENTS AS OF 4/30/26)
Portfolio allocation

Portfolio holdings
| MFS Blended Research International Equity Fund | 11.1% |
| MFS Blended Research Mid Cap Equity Fund | 10.0% |
| MFS Blended Research Value Equity Fund | 5.5% |
| MFS Value Fund | 5.5% |
| MFS Growth Fund | 5.2% |
| MFS Blended Research Growth Equity Fund | 5.2% |
| MFS Mid Cap Growth Fund | 5.0% |
| MFS Global Real Estate Fund | 5.0% |
| MFS Commodity Strategy Fund | 5.0% |
| MFS Mid Cap Value Fund | 5.0% |
| MFS Blended Research Core Equity Fund | 4.7% |
| MFS Research Fund | 4.6% |
| MFS International New Discovery Fund | 4.1% |
| MFS Research International Fund | 4.0% |
| MFS International Intrinsic Equity Fund | 3.5% |
| MFS International Growth Fund | 3.5% |
| MFS Blended Research Small Cap Equity Fund | 2.6% |
| MFS Inflation-Adjusted Bond Fund | 2.4% |
| MFS Total Return Bond Fund | 2.4% |
| MFS New Discovery Fund | 1.3% |
| MFS New Discovery Value Fund | 1.3% |
| MFS Blended Research Emerging Markets Equity Fund | 1.1% |
| MFS Emerging Markets Equity Fund | 1.0% |
| MFS Institutional Money Market Portfolio | 1.0% |
FUND EXPENSES
What were the fund costs for the last year?
| (based on a hypothetical $10,000 investment) | ||
| Class Name | Costs of a $10,000 investment ~ | Costs paid as a percentage of a $10,000 investment ~ |
| R6 | $0 | 0.00% |
˜ Expenses are direct expenses and do not include underlying fund fees and expenses.
MANAGEMENT'S DISCUSSION OF FUND PERFORMANCE
-
For the twelve months ended April 30, 2026, Class R6 shares of the MFS Lifetime 2045 Fund (fund) provided a total return of 23.47%, at net asset value. This compares with a return of 31.05% for the fund’s benchmark, the Standard & Poor's 500 Stock Index. The fund's other benchmark, the MFS Lifetime 2045 Fund Blended Index (Blended Index), generated a return of 26.11%. The Blended Index reflects the blended returns of broad asset class indices, with percentage allocations to each index designed to resemble the long term strategic allocations of the fund. The market indices and related percentage allocations used to compile the Blended Index are set forth in the Fund Performance.
-
Global equity markets reached record levels during the period, withstanding considerable volatility amid tariffs, geopolitical conflict and high levels of uncertainty. A new geopolitical event distressed markets at the end of the period as US and Israeli forces launched strikes against Iran, disrupting Mideast oil and natural gas exports. During the period, a pro-growth tax and spending bill was signed into law in the US, while in Europe, renewed focus on defense and infrastructure spending brightened the economic outlook. In Japan, the election of a pro-growth prime minister sent stocks to new highs prior to the conflict in Iran. Optimism over artificial intelligence remained high.
-
Considerable progress was made in trade talks between the US and many major trading partners, with a fragile truce between the US and China extended through late 2026. While the US Supreme Court struck down part of the Trump administration’s tariff strategy, the administration began deploying other authorities to largely replace the ones that were ruled unconstitutional.
-
Early in the period, moderating inflation pressures allowed many global central banks to ease monetary policy. Amid a difficult policymaking environment and slower job growth, the Federal Reserve resumed easing policy in September and delivered quarter-point rate cuts in October and December before pausing.
-
In fixed income markets, previously range-bound global bond yields spiked following the onset of the Middle East conflict, as energy-driven inflation fears appeared to have rattled bond investors. US rate volatility (as measured by the Merrill Lynch Option Volatility Estimate (MOVE) Index) similarly rose from intra-period lows, reflecting uncertainty around the scope and duration of the conflict and its implications for global growth. However, volatility later retracted as the risk of a broader regional military escalation appeared less likely. Global credit spreads widened only modestly before stabilizing near prior levels, supported by strong demand and resilient underlying fundamentals.
-
Top contributors to performance relative to the Blended Index:
-
The fund's international equity segment benefited relative performance, as the MFS Blended Research International Equity Fund outpaced its respective benchmark.
-
The fund's fixed income segment also aided relative performance, led by allocations to emerging markets debt and high yield credit.
-
-
Top detractors from performance relative to the Blended Index:
-
Within the US equity segment, lagging relative performance across the majority of the strategies weighed on relative results as the funds generally underperformed their respective benchmarks. Style selection also held back relative performance as mid-cap growth and mid-cap core strategies underperformed the broader index.
-
FUND PERFORMANCE
The fund’s past performance is not a good predictor of the fund’s future performance. The graph and table below do not reflect the deduction of taxes that a shareholder would pay on fund distributions or the redemption of fund shares. The graph and table below assume reinvestment of dividends and capital gain distributions.
Growth of a Hypothetical $10,000 Investment*
This graph shows the performance of a hypothetical $10,000 investment in Class R6 over a ten year period or since inception, if shorter, in comparison to (i) a broad measure of market performance and (ii) an additional index that MFS believes more closely reflects the market segments in which the fund invests.
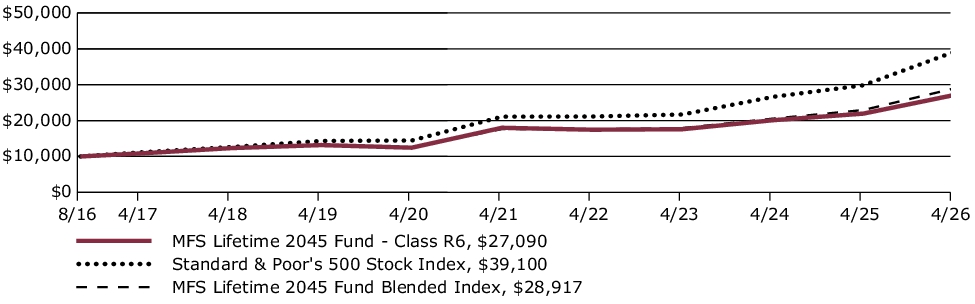
Average Annual Total Returns through 4/30/26
This table shows the average annual total returns of the class of shares noted for the periods shown, both with (if any) and without sales charges. It also shows the average annual total returns of (i) a broad measure of market performance and (ii) an additional index that MFS believes more closely reflects the market segments in which the fund invests, over the same periods.
| Share Class | 1-yr | 5-yr | Life* |
| R6 without sales charge | 23.47% | 8.53% | 10.84% |
| Comparative Benchmark(s) | |||
| Standard & Poor's 500 Stock Index ∆ | 31.05% | 13.14% | 15.13% |
| MFS Lifetime 2045 Fund Blended Index ∆ | 26.11% | 10.36% | 11.60% |
|
*
|
For the period from the commencement of the class's investment operations, August 29, 2016 through April 30, 2026.
|
|
∆
|
Source: FactSet Research Systems Inc.
|
Visit mfs.com/perf/r6 for more recent performance information.
FUND STATISTICS AS OF 4/30/26
| Net Assets ($): | 562,120,845 | Total Management Fee ($)#: | 0 | |
| Total Number of Holdings: | 28 | Portfolio Turnover Rate (%): | 8 |
# The fund itself does not pay a management fee but the underlying funds in which the fund invests do pay management fees to MFS.
PORTFOLIO COMPOSITION (BASED ON TOTAL INVESTMENTS AS OF 4/30/26)
Portfolio allocation

Portfolio holdings
| MFS Blended Research International Equity Fund | 9.8% |
| MFS Blended Research Mid Cap Equity Fund | 9.5% |
| MFS Blended Research Value Equity Fund | 5.2% |
| MFS Value Fund | 5.2% |
| MFS Growth Fund | 5.0% |
| MFS Blended Research Growth Equity Fund | 5.0% |
| MFS Mid Cap Growth Fund | 4.8% |
| MFS Blended Research Core Equity Fund | 4.7% |
| MFS Mid Cap Value Fund | 4.7% |
| MFS Research Fund | 4.7% |
| MFS Global Real Estate Fund | 4.5% |
| MFS Commodity Strategy Fund | 4.4% |
| MFS Research International Fund | 3.8% |
| MFS Inflation-Adjusted Bond Fund | 3.7% |
| MFS International Intrinsic Equity Fund | 3.0% |
| MFS International Growth Fund | 3.0% |
| MFS International New Discovery Fund | 2.9% |
| MFS Total Return Bond Fund | 2.7% |
| MFS Blended Research Small Cap Equity Fund | 2.3% |
| MFS High Income Fund | 2.1% |
| MFS Emerging Markets Debt Fund | 1.6% |
| MFS Global Opportunistic Bond Fund | 1.6% |
| MFS New Discovery Fund | 1.1% |
| MFS New Discovery Value Fund | 1.1% |
| MFS Emerging Markets Debt Local Currency Fund | 1.1% |
| MFS Institutional Money Market Portfolio | 1.0% |
| MFS Blended Research Emerging Markets Equity Fund | 0.8% |
| MFS Emerging Markets Equity Fund | 0.7% |
FUND EXPENSES
What were the fund costs for the last year?
| (based on a hypothetical $10,000 investment) | ||
| Class Name | Costs of a $10,000 investment ~ | Costs paid as a percentage of a $10,000 investment ~ |
| R4 | $0 | 0.00% |
˜ Expenses are direct expenses and do not include underlying fund fees and expenses.
MANAGEMENT'S DISCUSSION OF FUND PERFORMANCE
-
For the twelve months ended April 30, 2026, Class R4 shares of the MFS Lifetime 2045 Fund (fund) provided a total return of 23.32%, at net asset value. This compares with a return of 31.05% for the fund’s benchmark, the Standard & Poor's 500 Stock Index. The fund's other benchmark, the MFS Lifetime 2045 Fund Blended Index (Blended Index), generated a return of 26.11%. The Blended Index reflects the blended returns of broad asset class indices, with percentage allocations to each index designed to resemble the long term strategic allocations of the fund. The market indices and related percentage allocations used to compile the Blended Index are set forth in the Fund Performance.
-
Global equity markets reached record levels during the period, withstanding considerable volatility amid tariffs, geopolitical conflict and high levels of uncertainty. A new geopolitical event distressed markets at the end of the period as US and Israeli forces launched strikes against Iran, disrupting Mideast oil and natural gas exports. During the period, a pro-growth tax and spending bill was signed into law in the US, while in Europe, renewed focus on defense and infrastructure spending brightened the economic outlook. In Japan, the election of a pro-growth prime minister sent stocks to new highs prior to the conflict in Iran. Optimism over artificial intelligence remained high.
-
Considerable progress was made in trade talks between the US and many major trading partners, with a fragile truce between the US and China extended through late 2026. While the US Supreme Court struck down part of the Trump administration’s tariff strategy, the administration began deploying other authorities to largely replace the ones that were ruled unconstitutional.
-
Early in the period, moderating inflation pressures allowed many global central banks to ease monetary policy. Amid a difficult policymaking environment and slower job growth, the Federal Reserve resumed easing policy in September and delivered quarter-point rate cuts in October and December before pausing.
-
In fixed income markets, previously range-bound global bond yields spiked following the onset of the Middle East conflict, as energy-driven inflation fears appeared to have rattled bond investors. US rate volatility (as measured by the Merrill Lynch Option Volatility Estimate (MOVE) Index) similarly rose from intra-period lows, reflecting uncertainty around the scope and duration of the conflict and its implications for global growth. However, volatility later retracted as the risk of a broader regional military escalation appeared less likely. Global credit spreads widened only modestly before stabilizing near prior levels, supported by strong demand and resilient underlying fundamentals.
-
Top contributors to performance relative to the Blended Index:
-
The fund's international equity segment benefited relative performance, as the MFS Blended Research International Equity Fund outpaced its respective benchmark.
-
The fund's fixed income segment also aided relative performance, led by allocations to emerging markets debt and high yield credit.
-
-
Top detractors from performance relative to the Blended Index:
-
Within the US equity segment, lagging relative performance across the majority of the strategies weighed on relative results as the funds generally underperformed their respective benchmarks. Style selection also held back relative performance as mid-cap growth and mid-cap core strategies underperformed the broader index.
-
FUND PERFORMANCE
The fund’s past performance is not a good predictor of the fund’s future performance. The graph and table below do not reflect the deduction of taxes that a shareholder would pay on fund distributions or the redemption of fund shares. The graph and table below assume reinvestment of dividends and capital gain distributions.
Growth of a Hypothetical $10,000 Investment
This graph shows the performance of a hypothetical $10,000 investment in Class R4 over a ten year period or since inception, if shorter, in comparison to (i) a broad measure of market performance and (ii) an additional index that MFS believes more closely reflects the market segments in which the fund invests.
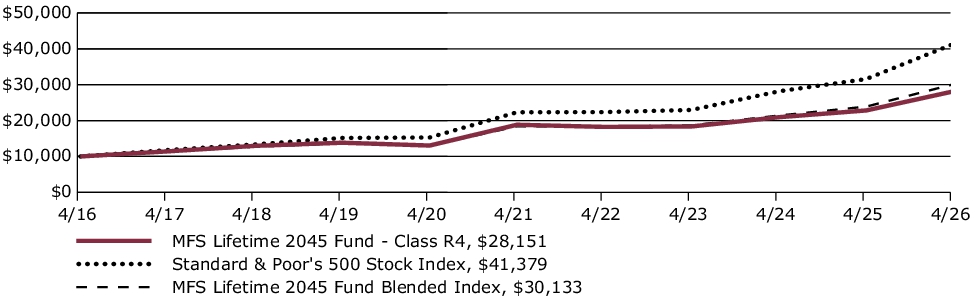
Average Annual Total Returns through 4/30/26
This table shows the average annual total returns of the class of shares noted for the periods shown, both with (if any) and without sales charges. It also shows the average annual total returns of (i) a broad measure of market performance and (ii) an additional index that MFS believes more closely reflects the market segments in which the fund invests, over the same periods.
| Share Class | 1-yr | 5-yr | 10-yr |
| R4 without sales charge | 23.32% | 8.37% | 10.90% |
| Comparative Benchmark(s) | |||
| Standard & Poor's 500 Stock Index ∆ | 31.05% | 13.14% | 15.26% |
| MFS Lifetime 2045 Fund Blended Index ∆ | 26.11% | 10.36% | 11.66% |
|
∆
|
Source: FactSet Research Systems Inc.
|
Visit mfs.com/perf/r4 for more recent performance information.
FUND STATISTICS AS OF 4/30/26
| Net Assets ($): | 562,120,845 | Total Management Fee ($)#: | 0 | |
| Total Number of Holdings: | 28 | Portfolio Turnover Rate (%): | 8 |
# The fund itself does not pay a management fee but the underlying funds in which the fund invests do pay management fees to MFS.
PORTFOLIO COMPOSITION (BASED ON TOTAL INVESTMENTS AS OF 4/30/26)
Portfolio allocation
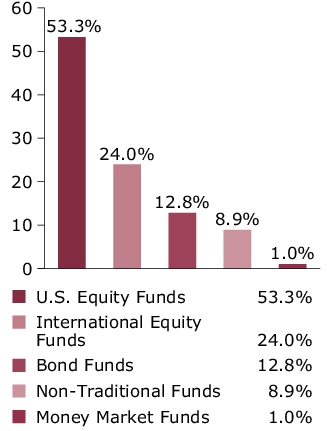
Portfolio holdings
| MFS Blended Research International Equity Fund | 9.8% |
| MFS Blended Research Mid Cap Equity Fund | 9.5% |
| MFS Blended Research Value Equity Fund | 5.2% |
| MFS Value Fund | 5.2% |
| MFS Growth Fund | 5.0% |
| MFS Blended Research Growth Equity Fund | 5.0% |
| MFS Mid Cap Growth Fund | 4.8% |
| MFS Blended Research Core Equity Fund | 4.7% |
| MFS Mid Cap Value Fund | 4.7% |
| MFS Research Fund | 4.7% |
| MFS Global Real Estate Fund | 4.5% |
| MFS Commodity Strategy Fund | 4.4% |
| MFS Research International Fund | 3.8% |
| MFS Inflation-Adjusted Bond Fund | 3.7% |
| MFS International Intrinsic Equity Fund | 3.0% |
| MFS International Growth Fund | 3.0% |
| MFS International New Discovery Fund | 2.9% |
| MFS Total Return Bond Fund | 2.7% |
| MFS Blended Research Small Cap Equity Fund | 2.3% |
| MFS High Income Fund | 2.1% |
| MFS Emerging Markets Debt Fund | 1.6% |
| MFS Global Opportunistic Bond Fund | 1.6% |
| MFS New Discovery Fund | 1.1% |
| MFS New Discovery Value Fund | 1.1% |
| MFS Emerging Markets Debt Local Currency Fund | 1.1% |
| MFS Institutional Money Market Portfolio | 1.0% |
| MFS Blended Research Emerging Markets Equity Fund | 0.8% |
| MFS Emerging Markets Equity Fund | 0.7% |
FUND EXPENSES
What were the fund costs for the last year?
| (based on a hypothetical $10,000 investment) | ||
| Class Name | Costs of a $10,000 investment ~ | Costs paid as a percentage of a $10,000 investment ~ |
| I | $0 | 0.00% |
˜ Expenses are direct expenses and do not include underlying fund fees and expenses.
MANAGEMENT'S DISCUSSION OF FUND PERFORMANCE
-
For the twelve months ended April 30, 2026, Class I shares of the MFS Lifetime 2045 Fund (fund) provided a total return of 23.31%, at net asset value. This compares with a return of 31.05% for the fund’s benchmark, the Standard & Poor's 500 Stock Index. The fund's other benchmark, the MFS Lifetime 2045 Fund Blended Index (Blended Index), generated a return of 26.11%. The Blended Index reflects the blended returns of broad asset class indices, with percentage allocations to each index designed to resemble the long term strategic allocations of the fund. The market indices and related percentage allocations used to compile the Blended Index are set forth in the Fund Performance.
-
Global equity markets reached record levels during the period, withstanding considerable volatility amid tariffs, geopolitical conflict and high levels of uncertainty. A new geopolitical event distressed markets at the end of the period as US and Israeli forces launched strikes against Iran, disrupting Mideast oil and natural gas exports. During the period, a pro-growth tax and spending bill was signed into law in the US, while in Europe, renewed focus on defense and infrastructure spending brightened the economic outlook. In Japan, the election of a pro-growth prime minister sent stocks to new highs prior to the conflict in Iran. Optimism over artificial intelligence remained high.
-
Considerable progress was made in trade talks between the US and many major trading partners, with a fragile truce between the US and China extended through late 2026. While the US Supreme Court struck down part of the Trump administration’s tariff strategy, the administration began deploying other authorities to largely replace the ones that were ruled unconstitutional.
-
Early in the period, moderating inflation pressures allowed many global central banks to ease monetary policy. Amid a difficult policymaking environment and slower job growth, the Federal Reserve resumed easing policy in September and delivered quarter-point rate cuts in October and December before pausing.
-
In fixed income markets, previously range-bound global bond yields spiked following the onset of the Middle East conflict, as energy-driven inflation fears appeared to have rattled bond investors. US rate volatility (as measured by the Merrill Lynch Option Volatility Estimate (MOVE) Index) similarly rose from intra-period lows, reflecting uncertainty around the scope and duration of the conflict and its implications for global growth. However, volatility later retracted as the risk of a broader regional military escalation appeared less likely. Global credit spreads widened only modestly before stabilizing near prior levels, supported by strong demand and resilient underlying fundamentals.
-
Top contributors to performance relative to the Blended Index:
-
The fund's international equity segment benefited relative performance, as the MFS Blended Research International Equity Fund outpaced its respective benchmark.
-
The fund's fixed income segment also aided relative performance, led by allocations to emerging markets debt and high yield credit.
-
-
Top detractors from performance relative to the Blended Index:
-
Within the US equity segment, lagging relative performance across the majority of the strategies weighed on relative results as the funds generally underperformed their respective benchmarks. Style selection also held back relative performance as mid-cap growth and mid-cap core strategies underperformed the broader index.
-
FUND PERFORMANCE
The fund’s past performance is not a good predictor of the fund’s future performance. The graph and table below do not reflect the deduction of taxes that a shareholder would pay on fund distributions or the redemption of fund shares. The graph and table below assume reinvestment of dividends and capital gain distributions.
Growth of a Hypothetical $10,000 Investment
This graph shows the performance of a hypothetical $10,000 investment in Class I over a ten year period or since inception, if shorter, in comparison to (i) a broad measure of market performance and (ii) an additional index that MFS believes more closely reflects the market segments in which the fund invests.
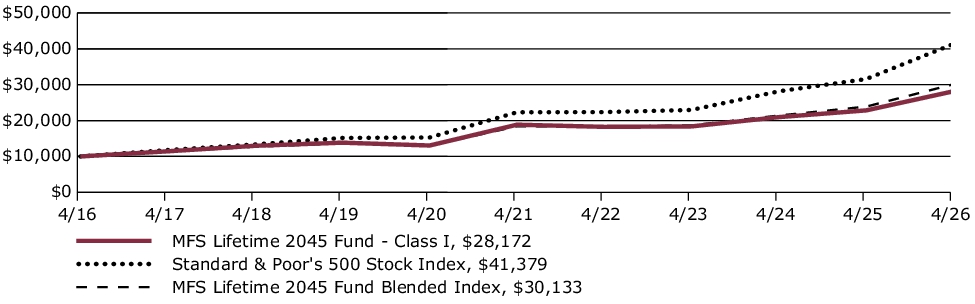
Average Annual Total Returns through 4/30/26
This table shows the average annual total returns of the class of shares noted for the periods shown, both with (if any) and without sales charges. It also shows the average annual total returns of (i) a broad measure of market performance and (ii) an additional index that MFS believes more closely reflects the market segments in which the fund invests, over the same periods.
| Share Class | 1-yr | 5-yr | 10-yr |
| I without sales charge | 23.31% | 8.37% | 10.91% |
| Comparative Benchmark(s) | |||
| Standard & Poor's 500 Stock Index ∆ | 31.05% | 13.14% | 15.26% |
| MFS Lifetime 2045 Fund Blended Index ∆ | 26.11% | 10.36% | 11.66% |
|
∆
|
Source: FactSet Research Systems Inc.
|
Visit mfs.com/perf/i for more recent performance information.
FUND STATISTICS AS OF 4/30/26
| Net Assets ($): | 562,120,845 | Total Management Fee ($)#: | 0 | |
| Total Number of Holdings: | 28 | Portfolio Turnover Rate (%): | 8 |
# The fund itself does not pay a management fee but the underlying funds in which the fund invests do pay management fees to MFS.
PORTFOLIO COMPOSITION (BASED ON TOTAL INVESTMENTS AS OF 4/30/26)
Portfolio allocation

Portfolio holdings
| MFS Blended Research International Equity Fund | 9.8% |
| MFS Blended Research Mid Cap Equity Fund | 9.5% |
| MFS Blended Research Value Equity Fund | 5.2% |
| MFS Value Fund | 5.2% |
| MFS Growth Fund | 5.0% |
| MFS Blended Research Growth Equity Fund | 5.0% |
| MFS Mid Cap Growth Fund | 4.8% |
| MFS Blended Research Core Equity Fund | 4.7% |
| MFS Mid Cap Value Fund | 4.7% |
| MFS Research Fund | 4.7% |
| MFS Global Real Estate Fund | 4.5% |
| MFS Commodity Strategy Fund | 4.4% |
| MFS Research International Fund | 3.8% |
| MFS Inflation-Adjusted Bond Fund | 3.7% |
| MFS International Intrinsic Equity Fund | 3.0% |
| MFS International Growth Fund | 3.0% |
| MFS International New Discovery Fund | 2.9% |
| MFS Total Return Bond Fund | 2.7% |
| MFS Blended Research Small Cap Equity Fund | 2.3% |
| MFS High Income Fund | 2.1% |
| MFS Emerging Markets Debt Fund | 1.6% |
| MFS Global Opportunistic Bond Fund | 1.6% |
| MFS New Discovery Fund | 1.1% |
| MFS New Discovery Value Fund | 1.1% |
| MFS Emerging Markets Debt Local Currency Fund | 1.1% |
| MFS Institutional Money Market Portfolio | 1.0% |
| MFS Blended Research Emerging Markets Equity Fund | 0.8% |
| MFS Emerging Markets Equity Fund | 0.7% |
FUND EXPENSES
What were the fund costs for the last year?
| (based on a hypothetical $10,000 investment) | ||
| Class Name | Costs of a $10,000 investment ~ | Costs paid as a percentage of a $10,000 investment ~ |
| R1 | $111 | 1.00% |
˜ Expenses are direct expenses and do not include underlying fund fees and expenses.
MANAGEMENT'S DISCUSSION OF FUND PERFORMANCE
-
For the twelve months ended April 30, 2026, Class R1 shares of the MFS Lifetime 2045 Fund (fund) provided a total return of 22.22%, at net asset value. This compares with a return of 31.05% for the fund’s benchmark, the Standard & Poor's 500 Stock Index. The fund's other benchmark, the MFS Lifetime 2045 Fund Blended Index (Blended Index), generated a return of 26.11%. The Blended Index reflects the blended returns of broad asset class indices, with percentage allocations to each index designed to resemble the long term strategic allocations of the fund. The market indices and related percentage allocations used to compile the Blended Index are set forth in the Fund Performance.
-
Global equity markets reached record levels during the period, withstanding considerable volatility amid tariffs, geopolitical conflict and high levels of uncertainty. A new geopolitical event distressed markets at the end of the period as US and Israeli forces launched strikes against Iran, disrupting Mideast oil and natural gas exports. During the period, a pro-growth tax and spending bill was signed into law in the US, while in Europe, renewed focus on defense and infrastructure spending brightened the economic outlook. In Japan, the election of a pro-growth prime minister sent stocks to new highs prior to the conflict in Iran. Optimism over artificial intelligence remained high.
-
Considerable progress was made in trade talks between the US and many major trading partners, with a fragile truce between the US and China extended through late 2026. While the US Supreme Court struck down part of the Trump administration’s tariff strategy, the administration began deploying other authorities to largely replace the ones that were ruled unconstitutional.
-
Early in the period, moderating inflation pressures allowed many global central banks to ease monetary policy. Amid a difficult policymaking environment and slower job growth, the Federal Reserve resumed easing policy in September and delivered quarter-point rate cuts in October and December before pausing.
-
In fixed income markets, previously range-bound global bond yields spiked following the onset of the Middle East conflict, as energy-driven inflation fears appeared to have rattled bond investors. US rate volatility (as measured by the Merrill Lynch Option Volatility Estimate (MOVE) Index) similarly rose from intra-period lows, reflecting uncertainty around the scope and duration of the conflict and its implications for global growth. However, volatility later retracted as the risk of a broader regional military escalation appeared less likely. Global credit spreads widened only modestly before stabilizing near prior levels, supported by strong demand and resilient underlying fundamentals.
-
Top contributors to performance relative to the Blended Index:
-
The fund's international equity segment benefited relative performance, as the MFS Blended Research International Equity Fund outpaced its respective benchmark.
-
The fund's fixed income segment also aided relative performance, led by allocations to emerging markets debt and high yield credit.
-
-
Top detractors from performance relative to the Blended Index:
-
Within the US equity segment, lagging relative performance across the majority of the strategies weighed on relative results as the funds generally underperformed their respective benchmarks. Style selection also held back relative performance as mid-cap growth and mid-cap core strategies underperformed the broader index.
-
FUND PERFORMANCE
The fund’s past performance is not a good predictor of the fund’s future performance. The graph and table below do not reflect the deduction of taxes that a shareholder would pay on fund distributions or the redemption of fund shares. The graph and table below assume reinvestment of dividends and capital gain distributions.
Growth of a Hypothetical $10,000 Investment
This graph shows the performance of a hypothetical $10,000 investment in Class R1 over a ten year period or since inception, if shorter, in comparison to (i) a broad measure of market performance and (ii) an additional index that MFS believes more closely reflects the market segments in which the fund invests.

Average Annual Total Returns through 4/30/26
This table shows the average annual total returns of the class of shares noted for the periods shown, both with (if any) and without sales charges. It also shows the average annual total returns of (i) a broad measure of market performance and (ii) an additional index that MFS believes more closely reflects the market segments in which the fund invests, over the same periods.
| Share Class | 1-yr | 5-yr | 10-yr |
| R1 without sales charge | 22.22% | 7.31% | 9.80% |
| Comparative Benchmark(s) | |||
| Standard & Poor's 500 Stock Index ∆ | 31.05% | 13.14% | 15.26% |
| MFS Lifetime 2045 Fund Blended Index ∆ | 26.11% | 10.36% | 11.66% |
|
∆
|
Source: FactSet Research Systems Inc.
|
Visit mfs.com/perf/r1 for more recent performance information.
FUND STATISTICS AS OF 4/30/26
| Net Assets ($): | 562,120,845 | Total Management Fee ($)#: | 0 | |
| Total Number of Holdings: | 28 | Portfolio Turnover Rate (%): | 8 |
# The fund itself does not pay a management fee but the underlying funds in which the fund invests do pay management fees to MFS.
PORTFOLIO COMPOSITION (BASED ON TOTAL INVESTMENTS AS OF 4/30/26)
Portfolio allocation

Portfolio holdings
| MFS Blended Research International Equity Fund | 9.8% |
| MFS Blended Research Mid Cap Equity Fund | 9.5% |
| MFS Blended Research Value Equity Fund | 5.2% |
| MFS Value Fund | 5.2% |
| MFS Growth Fund | 5.0% |
| MFS Blended Research Growth Equity Fund | 5.0% |
| MFS Mid Cap Growth Fund | 4.8% |
| MFS Blended Research Core Equity Fund | 4.7% |
| MFS Mid Cap Value Fund | 4.7% |
| MFS Research Fund | 4.7% |
| MFS Global Real Estate Fund | 4.5% |
| MFS Commodity Strategy Fund | 4.4% |
| MFS Research International Fund | 3.8% |
| MFS Inflation-Adjusted Bond Fund | 3.7% |
| MFS International Intrinsic Equity Fund | 3.0% |
| MFS International Growth Fund | 3.0% |
| MFS International New Discovery Fund | 2.9% |
| MFS Total Return Bond Fund | 2.7% |
| MFS Blended Research Small Cap Equity Fund | 2.3% |
| MFS High Income Fund | 2.1% |
| MFS Emerging Markets Debt Fund | 1.6% |
| MFS Global Opportunistic Bond Fund | 1.6% |
| MFS New Discovery Fund | 1.1% |
| MFS New Discovery Value Fund | 1.1% |
| MFS Emerging Markets Debt Local Currency Fund | 1.1% |
| MFS Institutional Money Market Portfolio | 1.0% |
| MFS Blended Research Emerging Markets Equity Fund | 0.8% |
| MFS Emerging Markets Equity Fund | 0.7% |
FUND EXPENSES
What were the fund costs for the last year?
| (based on a hypothetical $10,000 investment) | ||
| Class Name | Costs of a $10,000 investment ~ | Costs paid as a percentage of a $10,000 investment ~ |
| R2 | $56 | 0.50% |
˜ Expenses are direct expenses and do not include underlying fund fees and expenses.
MANAGEMENT'S DISCUSSION OF FUND PERFORMANCE
-
For the twelve months ended April 30, 2026, Class R2 shares of the MFS Lifetime 2045 Fund (fund) provided a total return of 22.69%, at net asset value. This compares with a return of 31.05% for the fund’s benchmark, the Standard & Poor's 500 Stock Index. The fund's other benchmark, the MFS Lifetime 2045 Fund Blended Index (Blended Index), generated a return of 26.11%. The Blended Index reflects the blended returns of broad asset class indices, with percentage allocations to each index designed to resemble the long term strategic allocations of the fund. The market indices and related percentage allocations used to compile the Blended Index are set forth in the Fund Performance.
-
Global equity markets reached record levels during the period, withstanding considerable volatility amid tariffs, geopolitical conflict and high levels of uncertainty. A new geopolitical event distressed markets at the end of the period as US and Israeli forces launched strikes against Iran, disrupting Mideast oil and natural gas exports. During the period, a pro-growth tax and spending bill was signed into law in the US, while in Europe, renewed focus on defense and infrastructure spending brightened the economic outlook. In Japan, the election of a pro-growth prime minister sent stocks to new highs prior to the conflict in Iran. Optimism over artificial intelligence remained high.
-
Considerable progress was made in trade talks between the US and many major trading partners, with a fragile truce between the US and China extended through late 2026. While the US Supreme Court struck down part of the Trump administration’s tariff strategy, the administration began deploying other authorities to largely replace the ones that were ruled unconstitutional.
-
Early in the period, moderating inflation pressures allowed many global central banks to ease monetary policy. Amid a difficult policymaking environment and slower job growth, the Federal Reserve resumed easing policy in September and delivered quarter-point rate cuts in October and December before pausing.
-
In fixed income markets, previously range-bound global bond yields spiked following the onset of the Middle East conflict, as energy-driven inflation fears appeared to have rattled bond investors. US rate volatility (as measured by the Merrill Lynch Option Volatility Estimate (MOVE) Index) similarly rose from intra-period lows, reflecting uncertainty around the scope and duration of the conflict and its implications for global growth. However, volatility later retracted as the risk of a broader regional military escalation appeared less likely. Global credit spreads widened only modestly before stabilizing near prior levels, supported by strong demand and resilient underlying fundamentals.
-
Top contributors to performance relative to the Blended Index:
-
The fund's international equity segment benefited relative performance, as the MFS Blended Research International Equity Fund outpaced its respective benchmark.
-
The fund's fixed income segment also aided relative performance, led by allocations to emerging markets debt and high yield credit.
-
-
Top detractors from performance relative to the Blended Index:
-
Within the US equity segment, lagging relative performance across the majority of the strategies weighed on relative results as the funds generally underperformed their respective benchmarks. Style selection also held back relative performance as mid-cap growth and mid-cap core strategies underperformed the broader index.
-
FUND PERFORMANCE
The fund’s past performance is not a good predictor of the fund’s future performance. The graph and table below do not reflect the deduction of taxes that a shareholder would pay on fund distributions or the redemption of fund shares. The graph and table below assume reinvestment of dividends and capital gain distributions.
Growth of a Hypothetical $10,000 Investment
This graph shows the performance of a hypothetical $10,000 investment in Class R2 over a ten year period or since inception, if shorter, in comparison to (i) a broad measure of market performance and (ii) an additional index that MFS believes more closely reflects the market segments in which the fund invests.
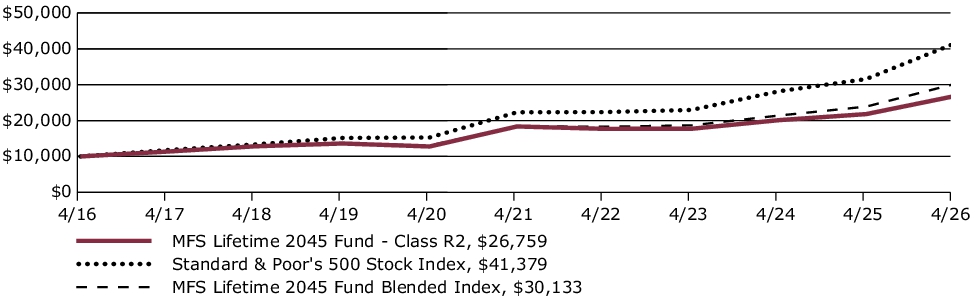
Average Annual Total Returns through 4/30/26
This table shows the average annual total returns of the class of shares noted for the periods shown, both with (if any) and without sales charges. It also shows the average annual total returns of (i) a broad measure of market performance and (ii) an additional index that MFS believes more closely reflects the market segments in which the fund invests, over the same periods.
| Share Class | 1-yr | 5-yr | 10-yr |
| R2 without sales charge | 22.69% | 7.82% | 10.34% |
| Comparative Benchmark(s) | |||
| Standard & Poor's 500 Stock Index ∆ | 31.05% | 13.14% | 15.26% |
| MFS Lifetime 2045 Fund Blended Index ∆ | 26.11% | 10.36% | 11.66% |
|
∆
|
Source: FactSet Research Systems Inc.
|
Visit mfs.com/perf/r2 for more recent performance information.
FUND STATISTICS AS OF 4/30/26
| Net Assets ($): | 562,120,845 | Total Management Fee ($)#: | 0 | |
| Total Number of Holdings: | 28 | Portfolio Turnover Rate (%): | 8 |
# The fund itself does not pay a management fee but the underlying funds in which the fund invests do pay management fees to MFS.
PORTFOLIO COMPOSITION (BASED ON TOTAL INVESTMENTS AS OF 4/30/26)
Portfolio allocation

Portfolio holdings
| MFS Blended Research International Equity Fund | 9.8% |
| MFS Blended Research Mid Cap Equity Fund | 9.5% |
| MFS Blended Research Value Equity Fund | 5.2% |
| MFS Value Fund | 5.2% |
| MFS Growth Fund | 5.0% |
| MFS Blended Research Growth Equity Fund | 5.0% |
| MFS Mid Cap Growth Fund | 4.8% |
| MFS Blended Research Core Equity Fund | 4.7% |
| MFS Mid Cap Value Fund | 4.7% |
| MFS Research Fund | 4.7% |
| MFS Global Real Estate Fund | 4.5% |
| MFS Commodity Strategy Fund | 4.4% |
| MFS Research International Fund | 3.8% |
| MFS Inflation-Adjusted Bond Fund | 3.7% |
| MFS International Intrinsic Equity Fund | 3.0% |
| MFS International Growth Fund | 3.0% |
| MFS International New Discovery Fund | 2.9% |
| MFS Total Return Bond Fund | 2.7% |
| MFS Blended Research Small Cap Equity Fund | 2.3% |
| MFS High Income Fund | 2.1% |
| MFS Emerging Markets Debt Fund | 1.6% |
| MFS Global Opportunistic Bond Fund | 1.6% |
| MFS New Discovery Fund | 1.1% |
| MFS New Discovery Value Fund | 1.1% |
| MFS Emerging Markets Debt Local Currency Fund | 1.1% |
| MFS Institutional Money Market Portfolio | 1.0% |
| MFS Blended Research Emerging Markets Equity Fund | 0.8% |
| MFS Emerging Markets Equity Fund | 0.7% |
FUND EXPENSES
What were the fund costs for the last year?
| (based on a hypothetical $10,000 investment) | ||
| Class Name | Costs of a $10,000 investment ~ | Costs paid as a percentage of a $10,000 investment ~ |
| R3 | $28 | 0.25% |
˜ Expenses are direct expenses and do not include underlying fund fees and expenses.
MANAGEMENT'S DISCUSSION OF FUND PERFORMANCE
-
For the twelve months ended April 30, 2026, Class R3 shares of the MFS Lifetime 2045 Fund (fund) provided a total return of 22.97%, at net asset value. This compares with a return of 31.05% for the fund’s benchmark, the Standard & Poor's 500 Stock Index. The fund's other benchmark, the MFS Lifetime 2045 Fund Blended Index (Blended Index), generated a return of 26.11%. The Blended Index reflects the blended returns of broad asset class indices, with percentage allocations to each index designed to resemble the long term strategic allocations of the fund. The market indices and related percentage allocations used to compile the Blended Index are set forth in the Fund Performance.
-
Global equity markets reached record levels during the period, withstanding considerable volatility amid tariffs, geopolitical conflict and high levels of uncertainty. A new geopolitical event distressed markets at the end of the period as US and Israeli forces launched strikes against Iran, disrupting Mideast oil and natural gas exports. During the period, a pro-growth tax and spending bill was signed into law in the US, while in Europe, renewed focus on defense and infrastructure spending brightened the economic outlook. In Japan, the election of a pro-growth prime minister sent stocks to new highs prior to the conflict in Iran. Optimism over artificial intelligence remained high.
-
Considerable progress was made in trade talks between the US and many major trading partners, with a fragile truce between the US and China extended through late 2026. While the US Supreme Court struck down part of the Trump administration’s tariff strategy, the administration began deploying other authorities to largely replace the ones that were ruled unconstitutional.
-
Early in the period, moderating inflation pressures allowed many global central banks to ease monetary policy. Amid a difficult policymaking environment and slower job growth, the Federal Reserve resumed easing policy in September and delivered quarter-point rate cuts in October and December before pausing.
-
In fixed income markets, previously range-bound global bond yields spiked following the onset of the Middle East conflict, as energy-driven inflation fears appeared to have rattled bond investors. US rate volatility (as measured by the Merrill Lynch Option Volatility Estimate (MOVE) Index) similarly rose from intra-period lows, reflecting uncertainty around the scope and duration of the conflict and its implications for global growth. However, volatility later retracted as the risk of a broader regional military escalation appeared less likely. Global credit spreads widened only modestly before stabilizing near prior levels, supported by strong demand and resilient underlying fundamentals.
-
Top contributors to performance relative to the Blended Index:
-
The fund's international equity segment benefited relative performance, as the MFS Blended Research International Equity Fund outpaced its respective benchmark.
-
The fund's fixed income segment also aided relative performance, led by allocations to emerging markets debt and high yield credit.
-
-
Top detractors from performance relative to the Blended Index:
-
Within the US equity segment, lagging relative performance across the majority of the strategies weighed on relative results as the funds generally underperformed their respective benchmarks. Style selection also held back relative performance as mid-cap growth and mid-cap core strategies underperformed the broader index.
-
FUND PERFORMANCE
The fund’s past performance is not a good predictor of the fund’s future performance. The graph and table below do not reflect the deduction of taxes that a shareholder would pay on fund distributions or the redemption of fund shares. The graph and table below assume reinvestment of dividends and capital gain distributions.
Growth of a Hypothetical $10,000 Investment
This graph shows the performance of a hypothetical $10,000 investment in Class R3 over a ten year period or since inception, if shorter, in comparison to (i) a broad measure of market performance and (ii) an additional index that MFS believes more closely reflects the market segments in which the fund invests.
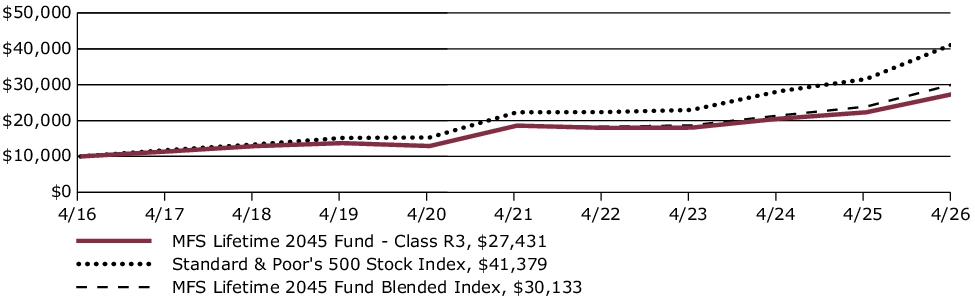
Average Annual Total Returns through 4/30/26
This table shows the average annual total returns of the class of shares noted for the periods shown, both with (if any) and without sales charges. It also shows the average annual total returns of (i) a broad measure of market performance and (ii) an additional index that MFS believes more closely reflects the market segments in which the fund invests, over the same periods.
| Share Class | 1-yr | 5-yr | 10-yr |
| R3 without sales charge | 22.97% | 8.09% | 10.62% |
| Comparative Benchmark(s) | |||
| Standard & Poor's 500 Stock Index ∆ | 31.05% | 13.14% | 15.26% |
| MFS Lifetime 2045 Fund Blended Index ∆ | 26.11% | 10.36% | 11.66% |
|
∆
|
Source: FactSet Research Systems Inc.
|
Visit mfs.com/perf/r3 for more recent performance information.
FUND STATISTICS AS OF 4/30/26
| Net Assets ($): | 562,120,845 | Total Management Fee ($)#: | 0 | |
| Total Number of Holdings: | 28 | Portfolio Turnover Rate (%): | 8 |
# The fund itself does not pay a management fee but the underlying funds in which the fund invests do pay management fees to MFS.
PORTFOLIO COMPOSITION (BASED ON TOTAL INVESTMENTS AS OF 4/30/26)
Portfolio allocation

Portfolio holdings
| MFS Blended Research International Equity Fund | 9.8% |
| MFS Blended Research Mid Cap Equity Fund | 9.5% |
| MFS Blended Research Value Equity Fund | 5.2% |
| MFS Value Fund | 5.2% |
| MFS Growth Fund | 5.0% |
| MFS Blended Research Growth Equity Fund | 5.0% |
| MFS Mid Cap Growth Fund | 4.8% |
| MFS Blended Research Core Equity Fund | 4.7% |
| MFS Mid Cap Value Fund | 4.7% |
| MFS Research Fund | 4.7% |
| MFS Global Real Estate Fund | 4.5% |
| MFS Commodity Strategy Fund | 4.4% |
| MFS Research International Fund | 3.8% |
| MFS Inflation-Adjusted Bond Fund | 3.7% |
| MFS International Intrinsic Equity Fund | 3.0% |
| MFS International Growth Fund | 3.0% |
| MFS International New Discovery Fund | 2.9% |
| MFS Total Return Bond Fund | 2.7% |
| MFS Blended Research Small Cap Equity Fund | 2.3% |
| MFS High Income Fund | 2.1% |
| MFS Emerging Markets Debt Fund | 1.6% |
| MFS Global Opportunistic Bond Fund | 1.6% |
| MFS New Discovery Fund | 1.1% |
| MFS New Discovery Value Fund | 1.1% |
| MFS Emerging Markets Debt Local Currency Fund | 1.1% |
| MFS Institutional Money Market Portfolio | 1.0% |
| MFS Blended Research Emerging Markets Equity Fund | 0.8% |
| MFS Emerging Markets Equity Fund | 0.7% |
FUND EXPENSES
What were the fund costs for the last year?
| (based on a hypothetical $10,000 investment) | ||
| Class Name | Costs of a $10,000 investment ~ | Costs paid as a percentage of a $10,000 investment ~ |
| A | $28 | 0.25% |
˜ Expenses are direct expenses and do not include underlying fund fees and expenses.
MANAGEMENT'S DISCUSSION OF FUND PERFORMANCE
-
For the twelve months ended April 30, 2026, Class A shares of the MFS Lifetime 2055 Fund (fund) provided a total return of 24.44%, at net asset value. This compares with a return of 31.05% for the fund’s benchmark, the Standard & Poor's 500 Stock Index. The fund's other benchmark, the MFS Lifetime 2055 Fund Blended Index (Blended Index), generated a return of 28.01%. The Blended Index reflects the blended returns of broad asset class indices, with percentage allocations to each index designed to resemble the long term strategic allocations of the fund. The market indices and related percentage allocations used to compile the Blended Index are set forth in the Fund Performance.
-
Global equity markets reached record levels during the period, withstanding considerable volatility amid tariffs, geopolitical conflict and high levels of uncertainty. A new geopolitical event distressed markets at the end of the period as US and Israeli forces launched strikes against Iran, disrupting Mideast oil and natural gas exports. During the period, a pro-growth tax and spending bill was signed into law in the US, while in Europe, renewed focus on defense and infrastructure spending brightened the economic outlook. In Japan, the election of a pro-growth prime minister sent stocks to new highs prior to the conflict in Iran. Optimism over artificial intelligence remained high.
-
Considerable progress was made in trade talks between the US and many major trading partners, with a fragile truce between the US and China extended through late 2026. While the US Supreme Court struck down part of the Trump administration’s tariff strategy, the administration began deploying other authorities to largely replace the ones that were ruled unconstitutional.
-
Early in the period, moderating inflation pressures allowed many global central banks to ease monetary policy. Amid a difficult policymaking environment and slower job growth, the Federal Reserve resumed easing policy in September and delivered quarter-point rate cuts in October and December before pausing.
-
In fixed income markets, previously range-bound global bond yields spiked following the onset of the Middle East conflict, as energy-driven inflation fears appeared to have rattled bond investors. US rate volatility (as measured by the Merrill Lynch Option Volatility Estimate (MOVE) Index) similarly rose from intra-period lows, reflecting uncertainty around the scope and duration of the conflict and its implications for global growth. However, volatility later retracted as the risk of a broader regional military escalation appeared less likely. Global credit spreads widened only modestly before stabilizing near prior levels, supported by strong demand and resilient underlying fundamentals.
-
Top contributors to performance relative to the Blended Index:
-
The fund's international equity segment benefited relative performance, as the MFS Blended Research International Equity Fund outpaced its respective benchmark.
-
-
Top detractors from performance relative to the Blended Index:
-
Within the US equity segment, lagging relative performance across the majority of the strategies weighed on relative results as the funds generally underperformed their respective benchmarks. Style selection also held back relative performance as mid-cap growth and mid-cap core strategies underperformed the broader index.
-
FUND PERFORMANCE
The fund’s past performance is not a good predictor of the fund’s future performance. The graph and table below do not reflect the deduction of taxes that a shareholder would pay on fund distributions or the redemption of fund shares. The graph and table below assume reinvestment of dividends and capital gain distributions.
Growth of a Hypothetical $10,000 Investment
This graph shows the performance of a hypothetical $10,000 investment in Class A over a ten year period or since inception, if shorter, in comparison to (i) a broad measure of market performance and (ii) an additional index that MFS believes more closely reflects the market segments in which the fund invests. This graph includes the deduction of the maximum applicable sales charge.
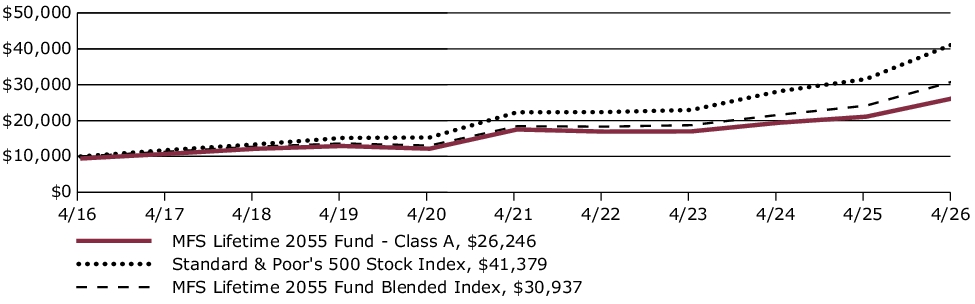
Average Annual Total Returns through 4/30/26
This table shows the average annual total returns of the class of shares noted for the periods shown, both with (if any) and without sales charges. It also shows the average annual total returns of (i) a broad measure of market performance and (ii) an additional index that MFS believes more closely reflects the market segments in which the fund invests, over the same periods.
| Share Class | 1-yr | 5-yr | 10-yr |
| A without sales charge | 24.44% | 8.42% | 10.78% |
| A with initial sales charge (5.75%) | 17.29% | 7.15% | 10.13% |
| Comparative Benchmark(s) | |||
| Standard & Poor's 500 Stock Index ∆ | 31.05% | 13.14% | 15.26% |
| MFS Lifetime 2055 Fund Blended Index ∆ | 28.01% | 10.93% | 11.96% |
|
∆
|
Source: FactSet Research Systems Inc.
|
Visit mfs.com/perf/a for more recent performance information.
FUND STATISTICS AS OF 4/30/26
| Net Assets ($): | 451,499,822 | Total Management Fee ($)#: | 0 | |
| Total Number of Holdings: | 24 | Portfolio Turnover Rate (%): | 10 |
# The fund itself does not pay a management fee but the underlying funds in which the fund invests do pay management fees to MFS.
PORTFOLIO COMPOSITION (BASED ON TOTAL INVESTMENTS AS OF 4/30/26)
Portfolio allocation

Portfolio holdings
| MFS Blended Research International Equity Fund | 11.2% |
| MFS Blended Research Mid Cap Equity Fund | 10.1% |
| MFS Blended Research Value Equity Fund | 5.5% |
| MFS Value Fund | 5.5% |
| MFS Growth Fund | 5.2% |
| MFS Blended Research Growth Equity Fund | 5.2% |
| MFS Mid Cap Growth Fund | 5.0% |
| MFS Commodity Strategy Fund | 5.0% |
| MFS Global Real Estate Fund | 5.0% |
| MFS Mid Cap Value Fund | 5.0% |
| MFS Blended Research Core Equity Fund | 4.7% |
| MFS Research Fund | 4.6% |
| MFS International New Discovery Fund | 4.1% |
| MFS Research International Fund | 4.0% |
| MFS International Intrinsic Equity Fund | 3.5% |
| MFS International Growth Fund | 3.5% |
| MFS Blended Research Small Cap Equity Fund | 2.5% |
| MFS Inflation-Adjusted Bond Fund | 2.5% |
| MFS Total Return Bond Fund | 2.4% |
| MFS New Discovery Fund | 1.3% |
| MFS New Discovery Value Fund | 1.2% |
| MFS Blended Research Emerging Markets Equity Fund | 1.0% |
| MFS Emerging Markets Equity Fund | 1.0% |
| MFS Institutional Money Market Portfolio | 1.0% |
FUND EXPENSES
What were the fund costs for the last year?
| (based on a hypothetical $10,000 investment) | ||
| Class Name | Costs of a $10,000 investment ~ | Costs paid as a percentage of a $10,000 investment ~ |
| B | $106 | 0.95% |
˜ Expenses are direct expenses and do not include underlying fund fees and expenses.
MANAGEMENT'S DISCUSSION OF FUND PERFORMANCE
-
For the twelve months ended April 30, 2026, Class B shares of the MFS Lifetime 2055 Fund (fund) provided a total return of 23.59%, at net asset value. This compares with a return of 31.05% for the fund’s benchmark, the Standard & Poor's 500 Stock Index. The fund's other benchmark, the MFS Lifetime 2055 Fund Blended Index (Blended Index), generated a return of 28.01%. The Blended Index reflects the blended returns of broad asset class indices, with percentage allocations to each index designed to resemble the long term strategic allocations of the fund. The market indices and related percentage allocations used to compile the Blended Index are set forth in the Fund Performance.
-
Global equity markets reached record levels during the period, withstanding considerable volatility amid tariffs, geopolitical conflict and high levels of uncertainty. A new geopolitical event distressed markets at the end of the period as US and Israeli forces launched strikes against Iran, disrupting Mideast oil and natural gas exports. During the period, a pro-growth tax and spending bill was signed into law in the US, while in Europe, renewed focus on defense and infrastructure spending brightened the economic outlook. In Japan, the election of a pro-growth prime minister sent stocks to new highs prior to the conflict in Iran. Optimism over artificial intelligence remained high.
-
Considerable progress was made in trade talks between the US and many major trading partners, with a fragile truce between the US and China extended through late 2026. While the US Supreme Court struck down part of the Trump administration’s tariff strategy, the administration began deploying other authorities to largely replace the ones that were ruled unconstitutional.
-
Early in the period, moderating inflation pressures allowed many global central banks to ease monetary policy. Amid a difficult policymaking environment and slower job growth, the Federal Reserve resumed easing policy in September and delivered quarter-point rate cuts in October and December before pausing.
-
In fixed income markets, previously range-bound global bond yields spiked following the onset of the Middle East conflict, as energy-driven inflation fears appeared to have rattled bond investors. US rate volatility (as measured by the Merrill Lynch Option Volatility Estimate (MOVE) Index) similarly rose from intra-period lows, reflecting uncertainty around the scope and duration of the conflict and its implications for global growth. However, volatility later retracted as the risk of a broader regional military escalation appeared less likely. Global credit spreads widened only modestly before stabilizing near prior levels, supported by strong demand and resilient underlying fundamentals.
-
Top contributors to performance relative to the Blended Index:
-
The fund's international equity segment benefited relative performance, as the MFS Blended Research International Equity Fund outpaced its respective benchmark.
-
-
Top detractors from performance relative to the Blended Index:
-
Within the US equity segment, lagging relative performance across the majority of the strategies weighed on relative results as the funds generally underperformed their respective benchmarks. Style selection also held back relative performance as mid-cap growth and mid-cap core strategies underperformed the broader index.
-
FUND PERFORMANCE
The fund’s past performance is not a good predictor of the fund’s future performance. The graph and table below do not reflect the deduction of taxes that a shareholder would pay on fund distributions or the redemption of fund shares. The graph and table below assume reinvestment of dividends and capital gain distributions.
Growth of a Hypothetical $10,000 Investment
This graph shows the performance of a hypothetical $10,000 investment in Class B over a ten year period or since inception, if shorter, in comparison to (i) a broad measure of market performance and (ii) an additional index that MFS believes more closely reflects the market segments in which the fund invests.

Average Annual Total Returns through 4/30/26
This table shows the average annual total returns of the class of shares noted for the periods shown, both with (if any) and without sales charges. It also shows the average annual total returns of (i) a broad measure of market performance and (ii) an additional index that MFS believes more closely reflects the market segments in which the fund invests, over the same periods.
| Share Class | 1-yr | 5-yr | 10-yr |
| B without sales charge | 23.59% | 7.62% | 9.97% |
| B with CDSC (declining over six years from 4% to 0%)× | 19.59% | 7.32% | 9.97% |
| Comparative Benchmark(s) | |||
| Standard & Poor's 500 Stock Index ∆ | 31.05% | 13.14% | 15.26% |
| MFS Lifetime 2055 Fund Blended Index ∆ | 28.01% | 10.93% | 11.96% |
|
∆
|
Source: FactSet Research Systems Inc.
|
|
×
|
Assuming redemption at the end of the applicable period.
|
Visit mfs.com/perf/b for more recent performance information.
FUND STATISTICS AS OF 4/30/26
| Net Assets ($): | 451,499,822 | Total Management Fee ($)#: | 0 | |
| Total Number of Holdings: | 24 | Portfolio Turnover Rate (%): | 10 |
# The fund itself does not pay a management fee but the underlying funds in which the fund invests do pay management fees to MFS.
PORTFOLIO COMPOSITION (BASED ON TOTAL INVESTMENTS AS OF 4/30/26)
Portfolio allocation

Portfolio holdings
| MFS Blended Research International Equity Fund | 11.2% |
| MFS Blended Research Mid Cap Equity Fund | 10.1% |
| MFS Blended Research Value Equity Fund | 5.5% |
| MFS Value Fund | 5.5% |
| MFS Growth Fund | 5.2% |
| MFS Blended Research Growth Equity Fund | 5.2% |
| MFS Mid Cap Growth Fund | 5.0% |
| MFS Commodity Strategy Fund | 5.0% |
| MFS Global Real Estate Fund | 5.0% |
| MFS Mid Cap Value Fund | 5.0% |
| MFS Blended Research Core Equity Fund | 4.7% |
| MFS Research Fund | 4.6% |
| MFS International New Discovery Fund | 4.1% |
| MFS Research International Fund | 4.0% |
| MFS International Intrinsic Equity Fund | 3.5% |
| MFS International Growth Fund | 3.5% |
| MFS Blended Research Small Cap Equity Fund | 2.5% |
| MFS Inflation-Adjusted Bond Fund | 2.5% |
| MFS Total Return Bond Fund | 2.4% |
| MFS New Discovery Fund | 1.3% |
| MFS New Discovery Value Fund | 1.2% |
| MFS Blended Research Emerging Markets Equity Fund | 1.0% |
| MFS Emerging Markets Equity Fund | 1.0% |
| MFS Institutional Money Market Portfolio | 1.0% |
FUND EXPENSES
What were the fund costs for the last year?
| (based on a hypothetical $10,000 investment) | ||
| Class Name | Costs of a $10,000 investment ~ | Costs paid as a percentage of a $10,000 investment ~ |
| C | $112 | 1.00% |
˜ Expenses are direct expenses and do not include underlying fund fees and expenses.
MANAGEMENT'S DISCUSSION OF FUND PERFORMANCE
-
For the twelve months ended April 30, 2026, Class C shares of the MFS Lifetime 2055 Fund (fund) provided a total return of 23.50%, at net asset value. This compares with a return of 31.05% for the fund’s benchmark, the Standard & Poor's 500 Stock Index. The fund's other benchmark, the MFS Lifetime 2055 Fund Blended Index (Blended Index), generated a return of 28.01%. The Blended Index reflects the blended returns of broad asset class indices, with percentage allocations to each index designed to resemble the long term strategic allocations of the fund. The market indices and related percentage allocations used to compile the Blended Index are set forth in the Fund Performance.
-
Global equity markets reached record levels during the period, withstanding considerable volatility amid tariffs, geopolitical conflict and high levels of uncertainty. A new geopolitical event distressed markets at the end of the period as US and Israeli forces launched strikes against Iran, disrupting Mideast oil and natural gas exports. During the period, a pro-growth tax and spending bill was signed into law in the US, while in Europe, renewed focus on defense and infrastructure spending brightened the economic outlook. In Japan, the election of a pro-growth prime minister sent stocks to new highs prior to the conflict in Iran. Optimism over artificial intelligence remained high.
-
Considerable progress was made in trade talks between the US and many major trading partners, with a fragile truce between the US and China extended through late 2026. While the US Supreme Court struck down part of the Trump administration’s tariff strategy, the administration began deploying other authorities to largely replace the ones that were ruled unconstitutional.
-
Early in the period, moderating inflation pressures allowed many global central banks to ease monetary policy. Amid a difficult policymaking environment and slower job growth, the Federal Reserve resumed easing policy in September and delivered quarter-point rate cuts in October and December before pausing.
-
In fixed income markets, previously range-bound global bond yields spiked following the onset of the Middle East conflict, as energy-driven inflation fears appeared to have rattled bond investors. US rate volatility (as measured by the Merrill Lynch Option Volatility Estimate (MOVE) Index) similarly rose from intra-period lows, reflecting uncertainty around the scope and duration of the conflict and its implications for global growth. However, volatility later retracted as the risk of a broader regional military escalation appeared less likely. Global credit spreads widened only modestly before stabilizing near prior levels, supported by strong demand and resilient underlying fundamentals.
-
Top contributors to performance relative to the Blended Index:
-
The fund's international equity segment benefited relative performance, as the MFS Blended Research International Equity Fund outpaced its respective benchmark.
-
-
Top detractors from performance relative to the Blended Index:
-
Within the US equity segment, lagging relative performance across the majority of the strategies weighed on relative results as the funds generally underperformed their respective benchmarks. Style selection also held back relative performance as mid-cap growth and mid-cap core strategies underperformed the broader index.
-
FUND PERFORMANCE
The fund’s past performance is not a good predictor of the fund’s future performance. The graph and table below do not reflect the deduction of taxes that a shareholder would pay on fund distributions or the redemption of fund shares. The graph and table below assume reinvestment of dividends and capital gain distributions.
Growth of a Hypothetical $10,000 Investment
This graph shows the performance of a hypothetical $10,000 investment in Class C over a ten year period or since inception, if shorter, in comparison to (i) a broad measure of market performance and (ii) an additional index that MFS believes more closely reflects the market segments in which the fund invests.

Average Annual Total Returns through 4/30/26
This table shows the average annual total returns of the class of shares noted for the periods shown, both with (if any) and without sales charges. It also shows the average annual total returns of (i) a broad measure of market performance and (ii) an additional index that MFS believes more closely reflects the market segments in which the fund invests, over the same periods.
| Share Class | 1-yr | 5-yr | 10-yr |
| C without sales charge | 23.50% | 7.60% | 9.96% |
| C with CDSC (1% for 12 months)× | 22.50% | 7.60% | 9.96% |
| Comparative Benchmark(s) | |||
| Standard & Poor's 500 Stock Index ∆ | 31.05% | 13.14% | 15.26% |
| MFS Lifetime 2055 Fund Blended Index ∆ | 28.01% | 10.93% | 11.96% |
|
∆
|
Source: FactSet Research Systems Inc.
|
|
×
|
Assuming redemption at the end of the applicable period.
|
Visit mfs.com/perf/c for more recent performance information.
FUND STATISTICS AS OF 4/30/26
| Net Assets ($): | 451,499,822 | Total Management Fee ($)#: | 0 | |
| Total Number of Holdings: | 24 | Portfolio Turnover Rate (%): | 10 |
# The fund itself does not pay a management fee but the underlying funds in which the fund invests do pay management fees to MFS.
PORTFOLIO COMPOSITION (BASED ON TOTAL INVESTMENTS AS OF 4/30/26)
Portfolio allocation

Portfolio holdings
| MFS Blended Research International Equity Fund | 11.2% |
| MFS Blended Research Mid Cap Equity Fund | 10.1% |
| MFS Blended Research Value Equity Fund | 5.5% |
| MFS Value Fund | 5.5% |
| MFS Growth Fund | 5.2% |
| MFS Blended Research Growth Equity Fund | 5.2% |
| MFS Mid Cap Growth Fund | 5.0% |
| MFS Commodity Strategy Fund | 5.0% |
| MFS Global Real Estate Fund | 5.0% |
| MFS Mid Cap Value Fund | 5.0% |
| MFS Blended Research Core Equity Fund | 4.7% |
| MFS Research Fund | 4.6% |
| MFS International New Discovery Fund | 4.1% |
| MFS Research International Fund | 4.0% |
| MFS International Intrinsic Equity Fund | 3.5% |
| MFS International Growth Fund | 3.5% |
| MFS Blended Research Small Cap Equity Fund | 2.5% |
| MFS Inflation-Adjusted Bond Fund | 2.5% |
| MFS Total Return Bond Fund | 2.4% |
| MFS New Discovery Fund | 1.3% |
| MFS New Discovery Value Fund | 1.2% |
| MFS Blended Research Emerging Markets Equity Fund | 1.0% |
| MFS Emerging Markets Equity Fund | 1.0% |
| MFS Institutional Money Market Portfolio | 1.0% |
FUND EXPENSES
What were the fund costs for the last year?
| (based on a hypothetical $10,000 investment) | ||
| Class Name | Costs of a $10,000 investment ~ | Costs paid as a percentage of a $10,000 investment ~ |
| I | $0 | 0.00% |
˜ Expenses are direct expenses and do not include underlying fund fees and expenses.
MANAGEMENT'S DISCUSSION OF FUND PERFORMANCE
-
For the twelve months ended April 30, 2026, Class I shares of the MFS Lifetime 2055 Fund (fund) provided a total return of 24.75%, at net asset value. This compares with a return of 31.05% for the fund’s benchmark, the Standard & Poor's 500 Stock Index. The fund's other benchmark, the MFS Lifetime 2055 Fund Blended Index (Blended Index), generated a return of 28.01%. The Blended Index reflects the blended returns of broad asset class indices, with percentage allocations to each index designed to resemble the long term strategic allocations of the fund. The market indices and related percentage allocations used to compile the Blended Index are set forth in the Fund Performance.
-
Global equity markets reached record levels during the period, withstanding considerable volatility amid tariffs, geopolitical conflict and high levels of uncertainty. A new geopolitical event distressed markets at the end of the period as US and Israeli forces launched strikes against Iran, disrupting Mideast oil and natural gas exports. During the period, a pro-growth tax and spending bill was signed into law in the US, while in Europe, renewed focus on defense and infrastructure spending brightened the economic outlook. In Japan, the election of a pro-growth prime minister sent stocks to new highs prior to the conflict in Iran. Optimism over artificial intelligence remained high.
-
Considerable progress was made in trade talks between the US and many major trading partners, with a fragile truce between the US and China extended through late 2026. While the US Supreme Court struck down part of the Trump administration’s tariff strategy, the administration began deploying other authorities to largely replace the ones that were ruled unconstitutional.
-
Early in the period, moderating inflation pressures allowed many global central banks to ease monetary policy. Amid a difficult policymaking environment and slower job growth, the Federal Reserve resumed easing policy in September and delivered quarter-point rate cuts in October and December before pausing.
-
In fixed income markets, previously range-bound global bond yields spiked following the onset of the Middle East conflict, as energy-driven inflation fears appeared to have rattled bond investors. US rate volatility (as measured by the Merrill Lynch Option Volatility Estimate (MOVE) Index) similarly rose from intra-period lows, reflecting uncertainty around the scope and duration of the conflict and its implications for global growth. However, volatility later retracted as the risk of a broader regional military escalation appeared less likely. Global credit spreads widened only modestly before stabilizing near prior levels, supported by strong demand and resilient underlying fundamentals.
-
Top contributors to performance relative to the Blended Index:
-
The fund's international equity segment benefited relative performance, as the MFS Blended Research International Equity Fund outpaced its respective benchmark.
-
-
Top detractors from performance relative to the Blended Index:
-
Within the US equity segment, lagging relative performance across the majority of the strategies weighed on relative results as the funds generally underperformed their respective benchmarks. Style selection also held back relative performance as mid-cap growth and mid-cap core strategies underperformed the broader index.
-
FUND PERFORMANCE
The fund’s past performance is not a good predictor of the fund’s future performance. The graph and table below do not reflect the deduction of taxes that a shareholder would pay on fund distributions or the redemption of fund shares. The graph and table below assume reinvestment of dividends and capital gain distributions.
Growth of a Hypothetical $10,000 Investment
This graph shows the performance of a hypothetical $10,000 investment in Class I over a ten year period or since inception, if shorter, in comparison to (i) a broad measure of market performance and (ii) an additional index that MFS believes more closely reflects the market segments in which the fund invests.
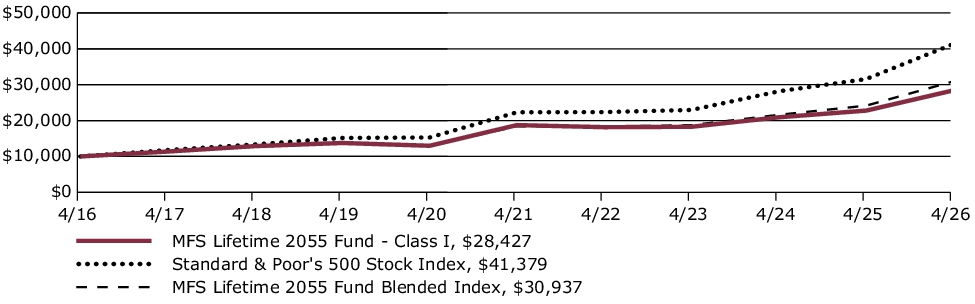
Average Annual Total Returns through 4/30/26
This table shows the average annual total returns of the class of shares noted for the periods shown, both with (if any) and without sales charges. It also shows the average annual total returns of (i) a broad measure of market performance and (ii) an additional index that MFS believes more closely reflects the market segments in which the fund invests, over the same periods.
| Share Class | 1-yr | 5-yr | 10-yr |
| I without sales charge | 24.75% | 8.68% | 11.01% |
| Comparative Benchmark(s) | |||
| Standard & Poor's 500 Stock Index ∆ | 31.05% | 13.14% | 15.26% |
| MFS Lifetime 2055 Fund Blended Index ∆ | 28.01% | 10.93% | 11.96% |
|
∆
|
Source: FactSet Research Systems Inc.
|
Visit mfs.com/perf/i for more recent performance information.
FUND STATISTICS AS OF 4/30/26
| Net Assets ($): | 451,499,822 | Total Management Fee ($)#: | 0 | |
| Total Number of Holdings: | 24 | Portfolio Turnover Rate (%): | 10 |
# The fund itself does not pay a management fee but the underlying funds in which the fund invests do pay management fees to MFS.
PORTFOLIO COMPOSITION (BASED ON TOTAL INVESTMENTS AS OF 4/30/26)
Portfolio allocation
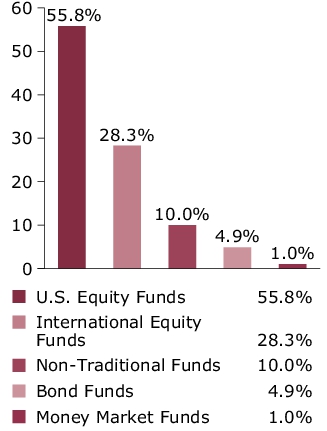
Portfolio holdings
| MFS Blended Research International Equity Fund | 11.2% |
| MFS Blended Research Mid Cap Equity Fund | 10.1% |
| MFS Blended Research Value Equity Fund | 5.5% |
| MFS Value Fund | 5.5% |
| MFS Growth Fund | 5.2% |
| MFS Blended Research Growth Equity Fund | 5.2% |
| MFS Mid Cap Growth Fund | 5.0% |
| MFS Commodity Strategy Fund | 5.0% |
| MFS Global Real Estate Fund | 5.0% |
| MFS Mid Cap Value Fund | 5.0% |
| MFS Blended Research Core Equity Fund | 4.7% |
| MFS Research Fund | 4.6% |
| MFS International New Discovery Fund | 4.1% |
| MFS Research International Fund | 4.0% |
| MFS International Intrinsic Equity Fund | 3.5% |
| MFS International Growth Fund | 3.5% |
| MFS Blended Research Small Cap Equity Fund | 2.5% |
| MFS Inflation-Adjusted Bond Fund | 2.5% |
| MFS Total Return Bond Fund | 2.4% |
| MFS New Discovery Fund | 1.3% |
| MFS New Discovery Value Fund | 1.2% |
| MFS Blended Research Emerging Markets Equity Fund | 1.0% |
| MFS Emerging Markets Equity Fund | 1.0% |
| MFS Institutional Money Market Portfolio | 1.0% |
FUND EXPENSES
What were the fund costs for the last year?
| (based on a hypothetical $10,000 investment) | ||
| Class Name | Costs of a $10,000 investment ~ | Costs paid as a percentage of a $10,000 investment ~ |
| R1 | $112 | 1.00% |
˜ Expenses are direct expenses and do not include underlying fund fees and expenses.
MANAGEMENT'S DISCUSSION OF FUND PERFORMANCE
-
For the twelve months ended April 30, 2026, Class R1 shares of the MFS Lifetime 2055 Fund (fund) provided a total return of 23.66%, at net asset value. This compares with a return of 31.05% for the fund’s benchmark, the Standard & Poor's 500 Stock Index. The fund's other benchmark, the MFS Lifetime 2055 Fund Blended Index (Blended Index), generated a return of 28.01%. The Blended Index reflects the blended returns of broad asset class indices, with percentage allocations to each index designed to resemble the long term strategic allocations of the fund. The market indices and related percentage allocations used to compile the Blended Index are set forth in the Fund Performance.
-
Global equity markets reached record levels during the period, withstanding considerable volatility amid tariffs, geopolitical conflict and high levels of uncertainty. A new geopolitical event distressed markets at the end of the period as US and Israeli forces launched strikes against Iran, disrupting Mideast oil and natural gas exports. During the period, a pro-growth tax and spending bill was signed into law in the US, while in Europe, renewed focus on defense and infrastructure spending brightened the economic outlook. In Japan, the election of a pro-growth prime minister sent stocks to new highs prior to the conflict in Iran. Optimism over artificial intelligence remained high.
-
Considerable progress was made in trade talks between the US and many major trading partners, with a fragile truce between the US and China extended through late 2026. While the US Supreme Court struck down part of the Trump administration’s tariff strategy, the administration began deploying other authorities to largely replace the ones that were ruled unconstitutional.
-
Early in the period, moderating inflation pressures allowed many global central banks to ease monetary policy. Amid a difficult policymaking environment and slower job growth, the Federal Reserve resumed easing policy in September and delivered quarter-point rate cuts in October and December before pausing.
-
In fixed income markets, previously range-bound global bond yields spiked following the onset of the Middle East conflict, as energy-driven inflation fears appeared to have rattled bond investors. US rate volatility (as measured by the Merrill Lynch Option Volatility Estimate (MOVE) Index) similarly rose from intra-period lows, reflecting uncertainty around the scope and duration of the conflict and its implications for global growth. However, volatility later retracted as the risk of a broader regional military escalation appeared less likely. Global credit spreads widened only modestly before stabilizing near prior levels, supported by strong demand and resilient underlying fundamentals.
-
Top contributors to performance relative to the Blended Index:
-
The fund's international equity segment benefited relative performance, as the MFS Blended Research International Equity Fund outpaced its respective benchmark.
-
-
Top detractors from performance relative to the Blended Index:
-
Within the US equity segment, lagging relative performance across the majority of the strategies weighed on relative results as the funds generally underperformed their respective benchmarks. Style selection also held back relative performance as mid-cap growth and mid-cap core strategies underperformed the broader index.
-
FUND PERFORMANCE
The fund’s past performance is not a good predictor of the fund’s future performance. The graph and table below do not reflect the deduction of taxes that a shareholder would pay on fund distributions or the redemption of fund shares. The graph and table below assume reinvestment of dividends and capital gain distributions.
Growth of a Hypothetical $10,000 Investment
This graph shows the performance of a hypothetical $10,000 investment in Class R1 over a ten year period or since inception, if shorter, in comparison to (i) a broad measure of market performance and (ii) an additional index that MFS believes more closely reflects the market segments in which the fund invests.
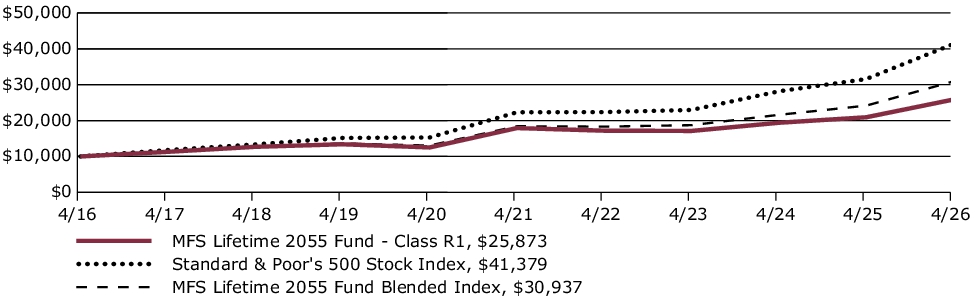
Average Annual Total Returns through 4/30/26
This table shows the average annual total returns of the class of shares noted for the periods shown, both with (if any) and without sales charges. It also shows the average annual total returns of (i) a broad measure of market performance and (ii) an additional index that MFS believes more closely reflects the market segments in which the fund invests, over the same periods.
| Share Class | 1-yr | 5-yr | 10-yr |
| R1 without sales charge | 23.66% | 7.63% | 9.97% |
| Comparative Benchmark(s) | |||
| Standard & Poor's 500 Stock Index ∆ | 31.05% | 13.14% | 15.26% |
| MFS Lifetime 2055 Fund Blended Index ∆ | 28.01% | 10.93% | 11.96% |
|
∆
|
Source: FactSet Research Systems Inc.
|
Visit mfs.com/perf/r1 for more recent performance information.
FUND STATISTICS AS OF 4/30/26
| Net Assets ($): | 451,499,822 | Total Management Fee ($)#: | 0 | |
| Total Number of Holdings: | 24 | Portfolio Turnover Rate (%): | 10 |
# The fund itself does not pay a management fee but the underlying funds in which the fund invests do pay management fees to MFS.
PORTFOLIO COMPOSITION (BASED ON TOTAL INVESTMENTS AS OF 4/30/26)
Portfolio allocation

Portfolio holdings
| MFS Blended Research International Equity Fund | 11.2% |
| MFS Blended Research Mid Cap Equity Fund | 10.1% |
| MFS Blended Research Value Equity Fund | 5.5% |
| MFS Value Fund | 5.5% |
| MFS Growth Fund | 5.2% |
| MFS Blended Research Growth Equity Fund | 5.2% |
| MFS Mid Cap Growth Fund | 5.0% |
| MFS Commodity Strategy Fund | 5.0% |
| MFS Global Real Estate Fund | 5.0% |
| MFS Mid Cap Value Fund | 5.0% |
| MFS Blended Research Core Equity Fund | 4.7% |
| MFS Research Fund | 4.6% |
| MFS International New Discovery Fund | 4.1% |
| MFS Research International Fund | 4.0% |
| MFS International Intrinsic Equity Fund | 3.5% |
| MFS International Growth Fund | 3.5% |
| MFS Blended Research Small Cap Equity Fund | 2.5% |
| MFS Inflation-Adjusted Bond Fund | 2.5% |
| MFS Total Return Bond Fund | 2.4% |
| MFS New Discovery Fund | 1.3% |
| MFS New Discovery Value Fund | 1.2% |
| MFS Blended Research Emerging Markets Equity Fund | 1.0% |
| MFS Emerging Markets Equity Fund | 1.0% |
| MFS Institutional Money Market Portfolio | 1.0% |
FUND EXPENSES
What were the fund costs for the last year?
| (based on a hypothetical $10,000 investment) | ||
| Class Name | Costs of a $10,000 investment ~ | Costs paid as a percentage of a $10,000 investment ~ |
| R2 | $56 | 0.50% |
˜ Expenses are direct expenses and do not include underlying fund fees and expenses.
MANAGEMENT'S DISCUSSION OF FUND PERFORMANCE
-
For the twelve months ended April 30, 2026, Class R2 shares of the MFS Lifetime 2055 Fund (fund) provided a total return of 24.13%, at net asset value. This compares with a return of 31.05% for the fund’s benchmark, the Standard & Poor's 500 Stock Index. The fund's other benchmark, the MFS Lifetime 2055 Fund Blended Index (Blended Index), generated a return of 28.01%. The Blended Index reflects the blended returns of broad asset class indices, with percentage allocations to each index designed to resemble the long term strategic allocations of the fund. The market indices and related percentage allocations used to compile the Blended Index are set forth in the Fund Performance.
-
Global equity markets reached record levels during the period, withstanding considerable volatility amid tariffs, geopolitical conflict and high levels of uncertainty. A new geopolitical event distressed markets at the end of the period as US and Israeli forces launched strikes against Iran, disrupting Mideast oil and natural gas exports. During the period, a pro-growth tax and spending bill was signed into law in the US, while in Europe, renewed focus on defense and infrastructure spending brightened the economic outlook. In Japan, the election of a pro-growth prime minister sent stocks to new highs prior to the conflict in Iran. Optimism over artificial intelligence remained high.
-
Considerable progress was made in trade talks between the US and many major trading partners, with a fragile truce between the US and China extended through late 2026. While the US Supreme Court struck down part of the Trump administration’s tariff strategy, the administration began deploying other authorities to largely replace the ones that were ruled unconstitutional.
-
Early in the period, moderating inflation pressures allowed many global central banks to ease monetary policy. Amid a difficult policymaking environment and slower job growth, the Federal Reserve resumed easing policy in September and delivered quarter-point rate cuts in October and December before pausing.
-
In fixed income markets, previously range-bound global bond yields spiked following the onset of the Middle East conflict, as energy-driven inflation fears appeared to have rattled bond investors. US rate volatility (as measured by the Merrill Lynch Option Volatility Estimate (MOVE) Index) similarly rose from intra-period lows, reflecting uncertainty around the scope and duration of the conflict and its implications for global growth. However, volatility later retracted as the risk of a broader regional military escalation appeared less likely. Global credit spreads widened only modestly before stabilizing near prior levels, supported by strong demand and resilient underlying fundamentals.
-
Top contributors to performance relative to the Blended Index:
-
The fund's international equity segment benefited relative performance, as the MFS Blended Research International Equity Fund outpaced its respective benchmark.
-
-
Top detractors from performance relative to the Blended Index:
-
Within the US equity segment, lagging relative performance across the majority of the strategies weighed on relative results as the funds generally underperformed their respective benchmarks. Style selection also held back relative performance as mid-cap growth and mid-cap core strategies underperformed the broader index.
-
FUND PERFORMANCE
The fund’s past performance is not a good predictor of the fund’s future performance. The graph and table below do not reflect the deduction of taxes that a shareholder would pay on fund distributions or the redemption of fund shares. The graph and table below assume reinvestment of dividends and capital gain distributions.
Growth of a Hypothetical $10,000 Investment
This graph shows the performance of a hypothetical $10,000 investment in Class R2 over a ten year period or since inception, if shorter, in comparison to (i) a broad measure of market performance and (ii) an additional index that MFS believes more closely reflects the market segments in which the fund invests.
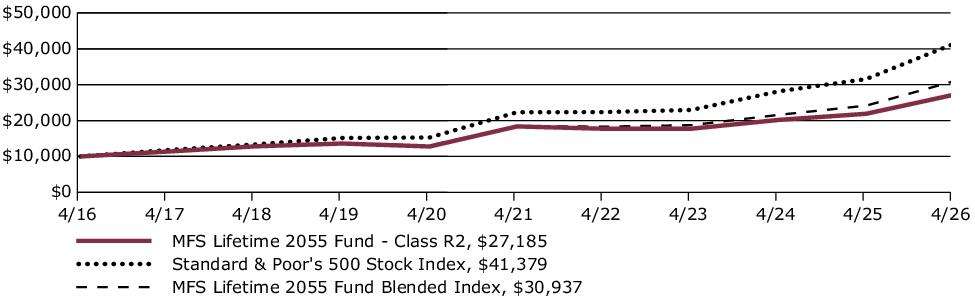
Average Annual Total Returns through 4/30/26
This table shows the average annual total returns of the class of shares noted for the periods shown, both with (if any) and without sales charges. It also shows the average annual total returns of (i) a broad measure of market performance and (ii) an additional index that MFS believes more closely reflects the market segments in which the fund invests, over the same periods.
| Share Class | 1-yr | 5-yr | 10-yr |
| R2 without sales charge | 24.13% | 8.15% | 10.52% |
| Comparative Benchmark(s) | |||
| Standard & Poor's 500 Stock Index ∆ | 31.05% | 13.14% | 15.26% |
| MFS Lifetime 2055 Fund Blended Index ∆ | 28.01% | 10.93% | 11.96% |
|
∆
|
Source: FactSet Research Systems Inc.
|
Visit mfs.com/perf/r2 for more recent performance information.
FUND STATISTICS AS OF 4/30/26
| Net Assets ($): | 451,499,822 | Total Management Fee ($)#: | 0 | |
| Total Number of Holdings: | 24 | Portfolio Turnover Rate (%): | 10 |
# The fund itself does not pay a management fee but the underlying funds in which the fund invests do pay management fees to MFS.
PORTFOLIO COMPOSITION (BASED ON TOTAL INVESTMENTS AS OF 4/30/26)
Portfolio allocation

Portfolio holdings
| MFS Blended Research International Equity Fund | 11.2% |
| MFS Blended Research Mid Cap Equity Fund | 10.1% |
| MFS Blended Research Value Equity Fund | 5.5% |
| MFS Value Fund | 5.5% |
| MFS Growth Fund | 5.2% |
| MFS Blended Research Growth Equity Fund | 5.2% |
| MFS Mid Cap Growth Fund | 5.0% |
| MFS Commodity Strategy Fund | 5.0% |
| MFS Global Real Estate Fund | 5.0% |
| MFS Mid Cap Value Fund | 5.0% |
| MFS Blended Research Core Equity Fund | 4.7% |
| MFS Research Fund | 4.6% |
| MFS International New Discovery Fund | 4.1% |
| MFS Research International Fund | 4.0% |
| MFS International Intrinsic Equity Fund | 3.5% |
| MFS International Growth Fund | 3.5% |
| MFS Blended Research Small Cap Equity Fund | 2.5% |
| MFS Inflation-Adjusted Bond Fund | 2.5% |
| MFS Total Return Bond Fund | 2.4% |
| MFS New Discovery Fund | 1.3% |
| MFS New Discovery Value Fund | 1.2% |
| MFS Blended Research Emerging Markets Equity Fund | 1.0% |
| MFS Emerging Markets Equity Fund | 1.0% |
| MFS Institutional Money Market Portfolio | 1.0% |
FUND EXPENSES
What were the fund costs for the last year?
| (based on a hypothetical $10,000 investment) | ||
| Class Name | Costs of a $10,000 investment ~ | Costs paid as a percentage of a $10,000 investment ~ |
| R6 | $0 | 0.00% |
˜ Expenses are direct expenses and do not include underlying fund fees and expenses.
MANAGEMENT'S DISCUSSION OF FUND PERFORMANCE
-
For the twelve months ended April 30, 2026, Class R6 shares of the MFS Lifetime 2050 Fund (fund) provided a total return of 24.83%, at net asset value. This compares with a return of 31.05% for the fund’s benchmark, the Standard & Poor's 500 Stock Index. The fund's other benchmark, the MFS Lifetime 2050 Fund Blended Index (Blended Index), generated a return of 27.95%. The Blended Index reflects the blended returns of broad asset class indices, with percentage allocations to each index designed to resemble the long term strategic allocations of the fund. The market indices and related percentage allocations used to compile the Blended Index are set forth in the Fund Performance.
-
Global equity markets reached record levels during the period, withstanding considerable volatility amid tariffs, geopolitical conflict and high levels of uncertainty. A new geopolitical event distressed markets at the end of the period as US and Israeli forces launched strikes against Iran, disrupting Mideast oil and natural gas exports. During the period, a pro-growth tax and spending bill was signed into law in the US, while in Europe, renewed focus on defense and infrastructure spending brightened the economic outlook. In Japan, the election of a pro-growth prime minister sent stocks to new highs prior to the conflict in Iran. Optimism over artificial intelligence remained high.
-
Considerable progress was made in trade talks between the US and many major trading partners, with a fragile truce between the US and China extended through late 2026. While the US Supreme Court struck down part of the Trump administration’s tariff strategy, the administration began deploying other authorities to largely replace the ones that were ruled unconstitutional.
-
Early in the period, moderating inflation pressures allowed many global central banks to ease monetary policy. Amid a difficult policymaking environment and slower job growth, the Federal Reserve resumed easing policy in September and delivered quarter-point rate cuts in October and December before pausing.
-
In fixed income markets, previously range-bound global bond yields spiked following the onset of the Middle East conflict, as energy-driven inflation fears appeared to have rattled bond investors. US rate volatility (as measured by the Merrill Lynch Option Volatility Estimate (MOVE) Index) similarly rose from intra-period lows, reflecting uncertainty around the scope and duration of the conflict and its implications for global growth. However, volatility later retracted as the risk of a broader regional military escalation appeared less likely. Global credit spreads widened only modestly before stabilizing near prior levels, supported by strong demand and resilient underlying fundamentals.
-
Top contributors to performance relative to the Blended Index:
-
The fund's international equity segment benefited relative performance, as the MFS Blended Research International Equity Fund outpaced its respective benchmark.
-
-
Top detractors from performance relative to the Blended Index:
-
Within the US equity segment, lagging relative performance across the majority of the strategies weighed on relative results as the funds generally underperformed their respective benchmarks. Style selection also held back relative performance as mid-cap growth and mid-cap core strategies underperformed the broader index.
-
FUND PERFORMANCE
The fund’s past performance is not a good predictor of the fund’s future performance. The graph and table below do not reflect the deduction of taxes that a shareholder would pay on fund distributions or the redemption of fund shares. The graph and table below assume reinvestment of dividends and capital gain distributions.
Growth of a Hypothetical $10,000 Investment*
This graph shows the performance of a hypothetical $10,000 investment in Class R6 over a ten year period or since inception, if shorter, in comparison to (i) a broad measure of market performance and (ii) an additional index that MFS believes more closely reflects the market segments in which the fund invests.
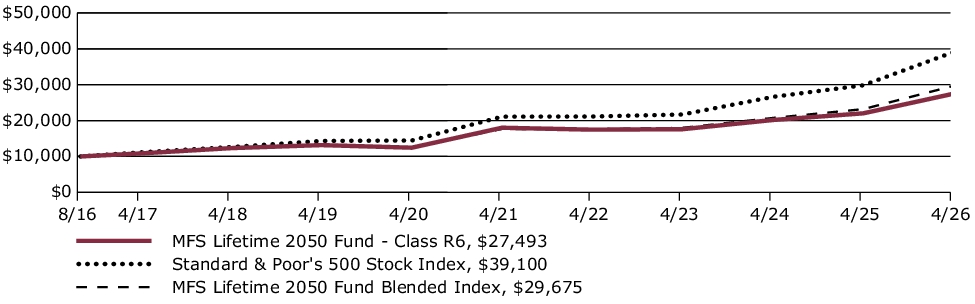
Average Annual Total Returns through 4/30/26
This table shows the average annual total returns of the class of shares noted for the periods shown, both with (if any) and without sales charges. It also shows the average annual total returns of (i) a broad measure of market performance and (ii) an additional index that MFS believes more closely reflects the market segments in which the fund invests, over the same periods.
| Share Class | 1-yr | 5-yr | Life* |
| R6 without sales charge | 24.83% | 8.84% | 11.01% |
| Comparative Benchmark(s) | |||
| Standard & Poor's 500 Stock Index ∆ | 31.05% | 13.14% | 15.13% |
| MFS Lifetime 2050 Fund Blended Index ∆ | 27.95% | 10.92% | 11.90% |
|
*
|
For the period from the commencement of the class's investment operations, August 29, 2016 through April 30, 2026.
|
|
∆
|
Source: FactSet Research Systems Inc.
|
Visit mfs.com/perf/r6 for more recent performance information.
FUND STATISTICS AS OF 4/30/26
| Net Assets ($): | 619,835,238 | Total Management Fee ($)#: | 0 | |
| Total Number of Holdings: | 28 | Portfolio Turnover Rate (%): | 7 |
# The fund itself does not pay a management fee but the underlying funds in which the fund invests do pay management fees to MFS.
PORTFOLIO COMPOSITION (BASED ON TOTAL INVESTMENTS AS OF 4/30/26)
Portfolio allocation

Portfolio holdings
| MFS Blended Research International Equity Fund | 11.0% |
| MFS Blended Research Mid Cap Equity Fund | 10.0% |
| MFS Blended Research Value Equity Fund | 5.5% |
| MFS Value Fund | 5.4% |
| MFS Growth Fund | 5.3% |
| MFS Blended Research Growth Equity Fund | 5.2% |
| MFS Mid Cap Growth Fund | 5.0% |
| MFS Global Real Estate Fund | 5.0% |
| MFS Commodity Strategy Fund | 4.9% |
| MFS Mid Cap Value Fund | 4.9% |
| MFS Blended Research Core Equity Fund | 4.7% |
| MFS Research Fund | 4.7% |
| MFS Research International Fund | 4.0% |
| MFS International New Discovery Fund | 4.0% |
| MFS International Intrinsic Equity Fund | 3.5% |
| MFS International Growth Fund | 3.4% |
| MFS Blended Research Small Cap Equity Fund | 2.5% |
| MFS Inflation-Adjusted Bond Fund | 2.5% |
| MFS Total Return Bond Fund | 2.4% |
| MFS New Discovery Fund | 1.3% |
| MFS New Discovery Value Fund | 1.2% |
| MFS Blended Research Emerging Markets Equity Fund | 1.0% |
| MFS Emerging Markets Equity Fund | 1.0% |
| MFS Institutional Money Market Portfolio | 1.0% |
| MFS High Income Fund | 0.2% |
| MFS Emerging Markets Debt Fund | 0.2% |
| MFS Global Opportunistic Bond Fund | 0.1% |
| MFS Emerging Markets Debt Local Currency Fund | 0.1% |
This report describes planned changes to the Fund since May 1, 2025.
FUND EXPENSES
What were the fund costs for the last year?
| (based on a hypothetical $10,000 investment) | ||
| Class Name | Costs of a $10,000 investment ~ | Costs paid as a percentage of a $10,000 investment ~ |
| B | $104 | 0.99% |
˜ Expenses are direct expenses and do not include underlying fund fees and expenses.
MANAGEMENT'S DISCUSSION OF FUND PERFORMANCE
-
For the twelve months ended April 30, 2026, Class B shares of the MFS Lifetime 2025 Fund (fund) provided a total return of 9.25%, at net asset value. This compares with a return of 31.05% for the fund’s benchmark, the Standard & Poor's 500 Stock Index. The fund's other benchmark, the MFS Lifetime 2025 Fund Blended Index (Blended Index), generated a return of 11.31%. The Blended Index reflects the blended returns of broad asset class indices, with percentage allocations to each index designed to resemble the long term strategic allocations of the fund. The market indices and related percentage allocations used to compile the Blended Index are set forth in the Fund Performance.
-
Global equity markets reached record levels during the period, withstanding considerable volatility amid tariffs, geopolitical conflict and high levels of uncertainty. A new geopolitical event distressed markets at the end of the period as US and Israeli forces launched strikes against Iran, disrupting Mideast oil and natural gas exports. During the period, a pro-growth tax and spending bill was signed into law in the US, while in Europe, renewed focus on defense and infrastructure spending brightened the economic outlook. In Japan, the election of a pro-growth prime minister sent stocks to new highs prior to the conflict in Iran. Optimism over artificial intelligence remained high.
-
Considerable progress was made in trade talks between the US and many major trading partners, with a fragile truce between the US and China extended through late 2026. While the US Supreme Court struck down part of the Trump administration’s tariff strategy, the administration began deploying other authorities to largely replace the ones that were ruled unconstitutional.
-
Early in the period, moderating inflation pressures allowed many global central banks to ease monetary policy. Amid a difficult policymaking environment and slower job growth, the Federal Reserve resumed easing policy in September and delivered quarter-point rate cuts in October and December before pausing.
-
In fixed income markets, previously range-bound global bond yields spiked following the onset of the Middle East conflict, as energy-driven inflation fears appeared to have rattled bond investors. US rate volatility (as measured by the Merrill Lynch Option Volatility Estimate (MOVE) Index) similarly rose from intra-period lows, reflecting uncertainty around the scope and duration of the conflict and its implications for global growth. However, volatility later retracted as the risk of a broader regional military escalation appeared less likely. Global credit spreads widened only modestly before stabilizing near prior levels, supported by strong demand and resilient underlying fundamentals.
-
Top contributors to performance relative to the Blended Index:
-
The fund's fixed income segment was a primary contributor to relative performance, as the MFS Total Return Bond Fund outpaced its respective benchmark. From a style perspective, both emerging markets debt and high yield credit outperformed the broader index.
-
The international equity segment also benefited the fund's relative performance, as the MFS Blended Research International Equity Fund outperformed its respective benchmark.
-
-
Top detractors from performance relative to the Blended Index:
-
Within the US equity segment, lagging relative performance across the majority of the strategies weighed on relative results as the funds generally underperformed their respective benchmarks. Style selection also held back relative performance as mid-cap strategies underperformed the broader index.
-
FUND PERFORMANCE
The fund’s past performance is not a good predictor of the fund’s future performance. The graph and table below do not reflect the deduction of taxes that a shareholder would pay on fund distributions or the redemption of fund shares. The graph and table below assume reinvestment of dividends and capital gain distributions.
Growth of a Hypothetical $10,000 Investment
This graph shows the performance of a hypothetical $10,000 investment in Class B over a ten year period or since inception, if shorter, in comparison to (i) a broad measure of market performance and (ii) an additional index that MFS believes more closely reflects the market segments in which the fund invests.
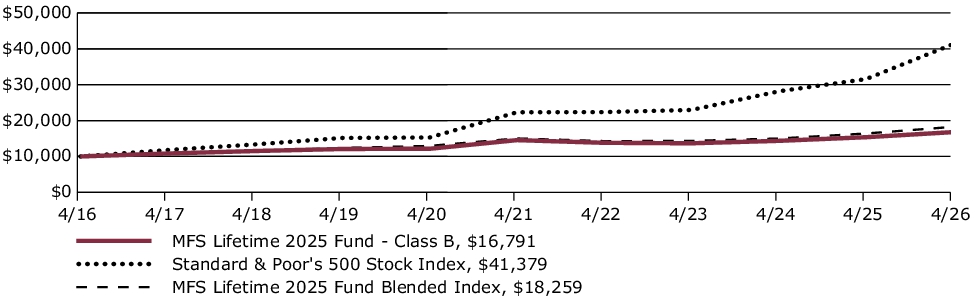
Average Annual Total Returns through 4/30/26
This table shows the average annual total returns of the class of shares noted for the periods shown, both with (if any) and without sales charges. It also shows the average annual total returns of (i) a broad measure of market performance and (ii) an additional index that MFS believes more closely reflects the market segments in which the fund invests, over the same periods.
| Share Class | 1-yr | 5-yr | 10-yr |
| B without sales charge | 9.25% | 2.90% | 5.32% |
| B with CDSC (declining over six years from 4% to 0%)× | 5.25% | 2.58% | 5.32% |
| Comparative Benchmark(s) | |||
| Standard & Poor's 500 Stock Index ∆ | 31.05% | 13.14% | 15.26% |
| MFS Lifetime 2025 Fund Blended Index ∆ | 11.31% | 3.98% | 6.21% |
|
∆
|
Source: FactSet Research Systems Inc.
|
|
×
|
Assuming redemption at the end of the applicable period.
|
Visit mfs.com/perf/b for more recent performance information.
FUND STATISTICS AS OF 4/30/26
| Net Assets ($): | 286,512,731 | Total Management Fee ($)#: | 0 | |
| Total Number of Holdings: | 27 | Portfolio Turnover Rate (%): | 6 |
# The fund itself does not pay a management fee but the underlying funds in which the fund invests do pay management fees to MFS.
PORTFOLIO COMPOSITION (BASED ON TOTAL INVESTMENTS AS OF 4/30/26)
Portfolio allocation

Portfolio holdings
| MFS Total Return Bond Fund | 20.0% |
| MFS Limited Maturity Fund | 20.0% |
| MFS Government Securities Fund | 10.0% |
| MFS Inflation-Adjusted Bond Fund | 9.9% |
| MFS Global Opportunistic Bond Fund | 7.0% |
| MFS Blended Research Mid Cap Equity Fund | 3.1% |
| MFS Blended Research International Equity Fund | 2.8% |
| MFS Blended Research Value Equity Fund | 2.0% |
| MFS Global Real Estate Fund | 2.0% |
| MFS Value Fund | 2.0% |
| MFS Commodity Strategy Fund | 2.0% |
| MFS High Income Fund | 2.0% |
| MFS Research International Fund | 1.7% |
| MFS Blended Research Core Equity Fund | 1.7% |
| MFS Research Fund | 1.6% |
| MFS Growth Fund | 1.6% |
| MFS Blended Research Growth Equity Fund | 1.6% |
| MFS Mid Cap Growth Fund | 1.5% |
| MFS Mid Cap Value Fund | 1.5% |
| MFS Blended Research Small Cap Equity Fund | 1.0% |
| MFS Emerging Markets Debt Fund | 1.0% |
| MFS Emerging Markets Debt Local Currency Fund | 1.0% |
| MFS Institutional Money Market Portfolio | 1.0% |
| MFS International Intrinsic Equity Fund | 0.5% |
| MFS International Growth Fund | 0.5% |
| MFS New Discovery Fund | 0.5% |
| MFS New Discovery Value Fund | 0.5% |
MATERIAL FUND CHANGES
This is a summary of certain changes to the fund since May 1, 2025. For more complete information, you may review the fund's prospectus as amended, which is available at funds.mfs.com or upon request at 1‑800‑225‑2606.
Effective May 22, 2026, the fund was reorganized into and with the MFS Lifetime Income Fund.
Effective May 22, 2026, the fund was reorganized into and with the MFS Lifetime Income Fund.
This is a summary of certain changes to the fund since May 1, 2025. For more complete information, you may review the fund's prospectus as amended, which is available at funds.mfs.com or upon request at 1‑800‑225‑2606.
This report describes planned changes to the Fund since May 1, 2025.
FUND EXPENSES
What were the fund costs for the last year?
| (based on a hypothetical $10,000 investment) | ||
| Class Name | Costs of a $10,000 investment ~ | Costs paid as a percentage of a $10,000 investment ~ |
| A | $26 | 0.25% |
˜ Expenses are direct expenses and do not include underlying fund fees and expenses.
MANAGEMENT'S DISCUSSION OF FUND PERFORMANCE
-
For the twelve months ended April 30, 2026, Class A shares of the MFS Lifetime 2025 Fund (fund) provided a total return of 10.00%, at net asset value. This compares with a return of 31.05% for the fund’s benchmark, the Standard & Poor's 500 Stock Index. The fund's other benchmark, the MFS Lifetime 2025 Fund Blended Index (Blended Index), generated a return of 11.31%. The Blended Index reflects the blended returns of broad asset class indices, with percentage allocations to each index designed to resemble the long term strategic allocations of the fund. The market indices and related percentage allocations used to compile the Blended Index are set forth in the Fund Performance.
-
Global equity markets reached record levels during the period, withstanding considerable volatility amid tariffs, geopolitical conflict and high levels of uncertainty. A new geopolitical event distressed markets at the end of the period as US and Israeli forces launched strikes against Iran, disrupting Mideast oil and natural gas exports. During the period, a pro-growth tax and spending bill was signed into law in the US, while in Europe, renewed focus on defense and infrastructure spending brightened the economic outlook. In Japan, the election of a pro-growth prime minister sent stocks to new highs prior to the conflict in Iran. Optimism over artificial intelligence remained high.
-
Considerable progress was made in trade talks between the US and many major trading partners, with a fragile truce between the US and China extended through late 2026. While the US Supreme Court struck down part of the Trump administration’s tariff strategy, the administration began deploying other authorities to largely replace the ones that were ruled unconstitutional.
-
Early in the period, moderating inflation pressures allowed many global central banks to ease monetary policy. Amid a difficult policymaking environment and slower job growth, the Federal Reserve resumed easing policy in September and delivered quarter-point rate cuts in October and December before pausing.
-
In fixed income markets, previously range-bound global bond yields spiked following the onset of the Middle East conflict, as energy-driven inflation fears appeared to have rattled bond investors. US rate volatility (as measured by the Merrill Lynch Option Volatility Estimate (MOVE) Index) similarly rose from intra-period lows, reflecting uncertainty around the scope and duration of the conflict and its implications for global growth. However, volatility later retracted as the risk of a broader regional military escalation appeared less likely. Global credit spreads widened only modestly before stabilizing near prior levels, supported by strong demand and resilient underlying fundamentals.
-
Top contributors to performance relative to the Blended Index:
-
The fund's fixed income segment was a primary contributor to relative performance, as the MFS Total Return Bond Fund outpaced its respective benchmark. From a style perspective, both emerging markets debt and high yield credit outperformed the broader index.
-
The international equity segment also benefited the fund's relative performance, as the MFS Blended Research International Equity Fund outperformed its respective benchmark.
-
-
Top detractors from performance relative to the Blended Index:
-
Within the US equity segment, lagging relative performance across the majority of the strategies weighed on relative results as the funds generally underperformed their respective benchmarks. Style selection also held back relative performance as mid-cap strategies underperformed the broader index.
-
FUND PERFORMANCE
The fund’s past performance is not a good predictor of the fund’s future performance. The graph and table below do not reflect the deduction of taxes that a shareholder would pay on fund distributions or the redemption of fund shares. The graph and table below assume reinvestment of dividends and capital gain distributions.
Growth of a Hypothetical $10,000 Investment
This graph shows the performance of a hypothetical $10,000 investment in Class A over a ten year period or since inception, if shorter, in comparison to (i) a broad measure of market performance and (ii) an additional index that MFS believes more closely reflects the market segments in which the fund invests. This graph includes the deduction of the maximum applicable sales charge.
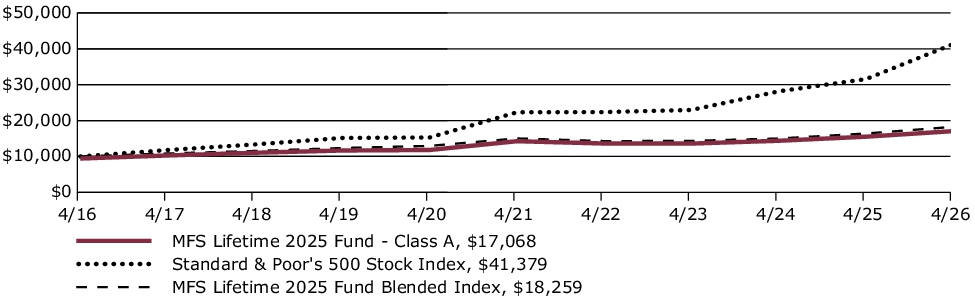
Average Annual Total Returns through 4/30/26
This table shows the average annual total returns of the class of shares noted for the periods shown, both with (if any) and without sales charges. It also shows the average annual total returns of (i) a broad measure of market performance and (ii) an additional index that MFS believes more closely reflects the market segments in which the fund invests, over the same periods.
| Share Class | 1-yr | 5-yr | 10-yr |
| A without sales charge | 10.00% | 3.68% | 6.12% |
| A with initial sales charge (5.75%) | 3.67% | 2.46% | 5.49% |
| Comparative Benchmark(s) | |||
| Standard & Poor's 500 Stock Index ∆ | 31.05% | 13.14% | 15.26% |
| MFS Lifetime 2025 Fund Blended Index ∆ | 11.31% | 3.98% | 6.21% |
|
∆
|
Source: FactSet Research Systems Inc.
|
Visit mfs.com/perf/a for more recent performance information.
FUND STATISTICS AS OF 4/30/26
| Net Assets ($): | 286,512,731 | Total Management Fee ($)#: | 0 | |
| Total Number of Holdings: | 27 | Portfolio Turnover Rate (%): | 6 |
# The fund itself does not pay a management fee but the underlying funds in which the fund invests do pay management fees to MFS.
PORTFOLIO COMPOSITION (BASED ON TOTAL INVESTMENTS AS OF 4/30/26)
Portfolio allocation

Portfolio holdings
| MFS Total Return Bond Fund | 20.0% |
| MFS Limited Maturity Fund | 20.0% |
| MFS Government Securities Fund | 10.0% |
| MFS Inflation-Adjusted Bond Fund | 9.9% |
| MFS Global Opportunistic Bond Fund | 7.0% |
| MFS Blended Research Mid Cap Equity Fund | 3.1% |
| MFS Blended Research International Equity Fund | 2.8% |
| MFS Blended Research Value Equity Fund | 2.0% |
| MFS Global Real Estate Fund | 2.0% |
| MFS Value Fund | 2.0% |
| MFS Commodity Strategy Fund | 2.0% |
| MFS High Income Fund | 2.0% |
| MFS Research International Fund | 1.7% |
| MFS Blended Research Core Equity Fund | 1.7% |
| MFS Research Fund | 1.6% |
| MFS Growth Fund | 1.6% |
| MFS Blended Research Growth Equity Fund | 1.6% |
| MFS Mid Cap Growth Fund | 1.5% |
| MFS Mid Cap Value Fund | 1.5% |
| MFS Blended Research Small Cap Equity Fund | 1.0% |
| MFS Emerging Markets Debt Fund | 1.0% |
| MFS Emerging Markets Debt Local Currency Fund | 1.0% |
| MFS Institutional Money Market Portfolio | 1.0% |
| MFS International Intrinsic Equity Fund | 0.5% |
| MFS International Growth Fund | 0.5% |
| MFS New Discovery Fund | 0.5% |
| MFS New Discovery Value Fund | 0.5% |
MATERIAL FUND CHANGES
This is a summary of certain changes to the fund since May 1, 2025. For more complete information, you may review the fund's prospectus as amended, which is available at funds.mfs.com or upon request at 1‑800‑225‑2606.
Effective May 22, 2026, the fund was reorganized into and with the MFS Lifetime Income Fund.
Effective May 22, 2026, the fund was reorganized into and with the MFS Lifetime Income Fund.
This is a summary of certain changes to the fund since May 1, 2025. For more complete information, you may review the fund's prospectus as amended, which is available at funds.mfs.com or upon request at 1‑800‑225‑2606.
This report describes planned changes to the Fund since May 1, 2025.
FUND EXPENSES
What were the fund costs for the last year?
| (based on a hypothetical $10,000 investment) | ||
| Class Name | Costs of a $10,000 investment ~ | Costs paid as a percentage of a $10,000 investment ~ |
| C | $104 | 0.99% |
˜ Expenses are direct expenses and do not include underlying fund fees and expenses.
MANAGEMENT'S DISCUSSION OF FUND PERFORMANCE
-
For the twelve months ended April 30, 2026, Class C shares of the MFS Lifetime 2025 Fund (fund) provided a total return of 9.24%, at net asset value. This compares with a return of 31.05% for the fund’s benchmark, the Standard & Poor's 500 Stock Index. The fund's other benchmark, the MFS Lifetime 2025 Fund Blended Index (Blended Index), generated a return of 11.31%. The Blended Index reflects the blended returns of broad asset class indices, with percentage allocations to each index designed to resemble the long term strategic allocations of the fund. The market indices and related percentage allocations used to compile the Blended Index are set forth in the Fund Performance.
-
Global equity markets reached record levels during the period, withstanding considerable volatility amid tariffs, geopolitical conflict and high levels of uncertainty. A new geopolitical event distressed markets at the end of the period as US and Israeli forces launched strikes against Iran, disrupting Mideast oil and natural gas exports. During the period, a pro-growth tax and spending bill was signed into law in the US, while in Europe, renewed focus on defense and infrastructure spending brightened the economic outlook. In Japan, the election of a pro-growth prime minister sent stocks to new highs prior to the conflict in Iran. Optimism over artificial intelligence remained high.
-
Considerable progress was made in trade talks between the US and many major trading partners, with a fragile truce between the US and China extended through late 2026. While the US Supreme Court struck down part of the Trump administration’s tariff strategy, the administration began deploying other authorities to largely replace the ones that were ruled unconstitutional.
-
Early in the period, moderating inflation pressures allowed many global central banks to ease monetary policy. Amid a difficult policymaking environment and slower job growth, the Federal Reserve resumed easing policy in September and delivered quarter-point rate cuts in October and December before pausing.
-
In fixed income markets, previously range-bound global bond yields spiked following the onset of the Middle East conflict, as energy-driven inflation fears appeared to have rattled bond investors. US rate volatility (as measured by the Merrill Lynch Option Volatility Estimate (MOVE) Index) similarly rose from intra-period lows, reflecting uncertainty around the scope and duration of the conflict and its implications for global growth. However, volatility later retracted as the risk of a broader regional military escalation appeared less likely. Global credit spreads widened only modestly before stabilizing near prior levels, supported by strong demand and resilient underlying fundamentals.
-
Top contributors to performance relative to the Blended Index:
-
The fund's fixed income segment was a primary contributor to relative performance, as the MFS Total Return Bond Fund outpaced its respective benchmark. From a style perspective, both emerging markets debt and high yield credit outperformed the broader index.
-
The international equity segment also benefited the fund's relative performance, as the MFS Blended Research International Equity Fund outperformed its respective benchmark.
-
-
Top detractors from performance relative to the Blended Index:
-
Within the US equity segment, lagging relative performance across the majority of the strategies weighed on relative results as the funds generally underperformed their respective benchmarks. Style selection also held back relative performance as mid-cap strategies underperformed the broader index.
-
FUND PERFORMANCE
The fund’s past performance is not a good predictor of the fund’s future performance. The graph and table below do not reflect the deduction of taxes that a shareholder would pay on fund distributions or the redemption of fund shares. The graph and table below assume reinvestment of dividends and capital gain distributions.
Growth of a Hypothetical $10,000 Investment
This graph shows the performance of a hypothetical $10,000 investment in Class C over a ten year period or since inception, if shorter, in comparison to (i) a broad measure of market performance and (ii) an additional index that MFS believes more closely reflects the market segments in which the fund invests.

Average Annual Total Returns through 4/30/26
This table shows the average annual total returns of the class of shares noted for the periods shown, both with (if any) and without sales charges. It also shows the average annual total returns of (i) a broad measure of market performance and (ii) an additional index that MFS believes more closely reflects the market segments in which the fund invests, over the same periods.
| Share Class | 1-yr | 5-yr | 10-yr |
| C without sales charge | 9.24% | 2.90% | 5.32% |
| C with CDSC (1% for 12 months)× | 8.24% | 2.90% | 5.32% |
| Comparative Benchmark(s) | |||
| Standard & Poor's 500 Stock Index ∆ | 31.05% | 13.14% | 15.26% |
| MFS Lifetime 2025 Fund Blended Index ∆ | 11.31% | 3.98% | 6.21% |
|
∆
|
Source: FactSet Research Systems Inc.
|
|
×
|
Assuming redemption at the end of the applicable period.
|
Visit mfs.com/perf/c for more recent performance information.
FUND STATISTICS AS OF 4/30/26
| Net Assets ($): | 286,512,731 | Total Management Fee ($)#: | 0 | |
| Total Number of Holdings: | 27 | Portfolio Turnover Rate (%): | 6 |
# The fund itself does not pay a management fee but the underlying funds in which the fund invests do pay management fees to MFS.
PORTFOLIO COMPOSITION (BASED ON TOTAL INVESTMENTS AS OF 4/30/26)
Portfolio allocation

Portfolio holdings
| MFS Total Return Bond Fund | 20.0% |
| MFS Limited Maturity Fund | 20.0% |
| MFS Government Securities Fund | 10.0% |
| MFS Inflation-Adjusted Bond Fund | 9.9% |
| MFS Global Opportunistic Bond Fund | 7.0% |
| MFS Blended Research Mid Cap Equity Fund | 3.1% |
| MFS Blended Research International Equity Fund | 2.8% |
| MFS Blended Research Value Equity Fund | 2.0% |
| MFS Global Real Estate Fund | 2.0% |
| MFS Value Fund | 2.0% |
| MFS Commodity Strategy Fund | 2.0% |
| MFS High Income Fund | 2.0% |
| MFS Research International Fund | 1.7% |
| MFS Blended Research Core Equity Fund | 1.7% |
| MFS Research Fund | 1.6% |
| MFS Growth Fund | 1.6% |
| MFS Blended Research Growth Equity Fund | 1.6% |
| MFS Mid Cap Growth Fund | 1.5% |
| MFS Mid Cap Value Fund | 1.5% |
| MFS Blended Research Small Cap Equity Fund | 1.0% |
| MFS Emerging Markets Debt Fund | 1.0% |
| MFS Emerging Markets Debt Local Currency Fund | 1.0% |
| MFS Institutional Money Market Portfolio | 1.0% |
| MFS International Intrinsic Equity Fund | 0.5% |
| MFS International Growth Fund | 0.5% |
| MFS New Discovery Fund | 0.5% |
| MFS New Discovery Value Fund | 0.5% |
MATERIAL FUND CHANGES
This is a summary of certain changes to the fund since May 1, 2025. For more complete information, you may review the fund's prospectus as amended, which is available at funds.mfs.com or upon request at 1‑800‑225‑2606.
Effective May 22, 2026, the fund was reorganized into and with the MFS Lifetime Income Fund.
Effective May 22, 2026, the fund was reorganized into and with the MFS Lifetime Income Fund.
This is a summary of certain changes to the fund since May 1, 2025. For more complete information, you may review the fund's prospectus as amended, which is available at funds.mfs.com or upon request at 1‑800‑225‑2606.
This report describes planned changes to the Fund since May 1, 2025.
FUND EXPENSES
What were the fund costs for the last year?
| (based on a hypothetical $10,000 investment) | ||
| Class Name | Costs of a $10,000 investment ~ | Costs paid as a percentage of a $10,000 investment ~ |
| I | $0 | 0.00% |
˜ Expenses are direct expenses and do not include underlying fund fees and expenses.
MANAGEMENT'S DISCUSSION OF FUND PERFORMANCE
-
For the twelve months ended April 30, 2026, Class I shares of the MFS Lifetime 2025 Fund (fund) provided a total return of 10.33%, at net asset value. This compares with a return of 31.05% for the fund’s benchmark, the Standard & Poor's 500 Stock Index. The fund's other benchmark, the MFS Lifetime 2025 Fund Blended Index (Blended Index), generated a return of 11.31%. The Blended Index reflects the blended returns of broad asset class indices, with percentage allocations to each index designed to resemble the long term strategic allocations of the fund. The market indices and related percentage allocations used to compile the Blended Index are set forth in the Fund Performance.
-
Global equity markets reached record levels during the period, withstanding considerable volatility amid tariffs, geopolitical conflict and high levels of uncertainty. A new geopolitical event distressed markets at the end of the period as US and Israeli forces launched strikes against Iran, disrupting Mideast oil and natural gas exports. During the period, a pro-growth tax and spending bill was signed into law in the US, while in Europe, renewed focus on defense and infrastructure spending brightened the economic outlook. In Japan, the election of a pro-growth prime minister sent stocks to new highs prior to the conflict in Iran. Optimism over artificial intelligence remained high.
-
Considerable progress was made in trade talks between the US and many major trading partners, with a fragile truce between the US and China extended through late 2026. While the US Supreme Court struck down part of the Trump administration’s tariff strategy, the administration began deploying other authorities to largely replace the ones that were ruled unconstitutional.
-
Early in the period, moderating inflation pressures allowed many global central banks to ease monetary policy. Amid a difficult policymaking environment and slower job growth, the Federal Reserve resumed easing policy in September and delivered quarter-point rate cuts in October and December before pausing.
-
In fixed income markets, previously range-bound global bond yields spiked following the onset of the Middle East conflict, as energy-driven inflation fears appeared to have rattled bond investors. US rate volatility (as measured by the Merrill Lynch Option Volatility Estimate (MOVE) Index) similarly rose from intra-period lows, reflecting uncertainty around the scope and duration of the conflict and its implications for global growth. However, volatility later retracted as the risk of a broader regional military escalation appeared less likely. Global credit spreads widened only modestly before stabilizing near prior levels, supported by strong demand and resilient underlying fundamentals.
-
Top contributors to performance relative to the Blended Index:
-
The fund's fixed income segment was a primary contributor to relative performance, as the MFS Total Return Bond Fund outpaced its respective benchmark. From a style perspective, both emerging markets debt and high yield credit outperformed the broader index.
-
The international equity segment also benefited the fund's relative performance, as the MFS Blended Research International Equity Fund outperformed its respective benchmark.
-
-
Top detractors from performance relative to the Blended Index:
-
Within the US equity segment, lagging relative performance across the majority of the strategies weighed on relative results as the funds generally underperformed their respective benchmarks. Style selection also held back relative performance as mid-cap strategies underperformed the broader index.
-
FUND PERFORMANCE
The fund’s past performance is not a good predictor of the fund’s future performance. The graph and table below do not reflect the deduction of taxes that a shareholder would pay on fund distributions or the redemption of fund shares. The graph and table below assume reinvestment of dividends and capital gain distributions.
Growth of a Hypothetical $10,000 Investment
This graph shows the performance of a hypothetical $10,000 investment in Class I over a ten year period or since inception, if shorter, in comparison to (i) a broad measure of market performance and (ii) an additional index that MFS believes more closely reflects the market segments in which the fund invests.
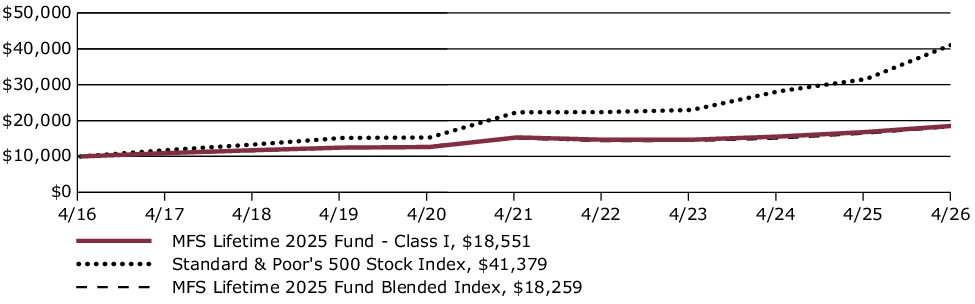
Average Annual Total Returns through 4/30/26
This table shows the average annual total returns of the class of shares noted for the periods shown, both with (if any) and without sales charges. It also shows the average annual total returns of (i) a broad measure of market performance and (ii) an additional index that MFS believes more closely reflects the market segments in which the fund invests, over the same periods.
| Share Class | 1-yr | 5-yr | 10-yr |
| I without sales charge | 10.33% | 3.92% | 6.37% |
| Comparative Benchmark(s) | |||
| Standard & Poor's 500 Stock Index ∆ | 31.05% | 13.14% | 15.26% |
| MFS Lifetime 2025 Fund Blended Index ∆ | 11.31% | 3.98% | 6.21% |
|
∆
|
Source: FactSet Research Systems Inc.
|
Visit mfs.com/perf/i for more recent performance information.
FUND STATISTICS AS OF 4/30/26
| Net Assets ($): | 286,512,731 | Total Management Fee ($)#: | 0 | |
| Total Number of Holdings: | 27 | Portfolio Turnover Rate (%): | 6 |
# The fund itself does not pay a management fee but the underlying funds in which the fund invests do pay management fees to MFS.
PORTFOLIO COMPOSITION (BASED ON TOTAL INVESTMENTS AS OF 4/30/26)
Portfolio allocation

Portfolio holdings
| MFS Total Return Bond Fund | 20.0% |
| MFS Limited Maturity Fund | 20.0% |
| MFS Government Securities Fund | 10.0% |
| MFS Inflation-Adjusted Bond Fund | 9.9% |
| MFS Global Opportunistic Bond Fund | 7.0% |
| MFS Blended Research Mid Cap Equity Fund | 3.1% |
| MFS Blended Research International Equity Fund | 2.8% |
| MFS Blended Research Value Equity Fund | 2.0% |
| MFS Global Real Estate Fund | 2.0% |
| MFS Value Fund | 2.0% |
| MFS Commodity Strategy Fund | 2.0% |
| MFS High Income Fund | 2.0% |
| MFS Research International Fund | 1.7% |
| MFS Blended Research Core Equity Fund | 1.7% |
| MFS Research Fund | 1.6% |
| MFS Growth Fund | 1.6% |
| MFS Blended Research Growth Equity Fund | 1.6% |
| MFS Mid Cap Growth Fund | 1.5% |
| MFS Mid Cap Value Fund | 1.5% |
| MFS Blended Research Small Cap Equity Fund | 1.0% |
| MFS Emerging Markets Debt Fund | 1.0% |
| MFS Emerging Markets Debt Local Currency Fund | 1.0% |
| MFS Institutional Money Market Portfolio | 1.0% |
| MFS International Intrinsic Equity Fund | 0.5% |
| MFS International Growth Fund | 0.5% |
| MFS New Discovery Fund | 0.5% |
| MFS New Discovery Value Fund | 0.5% |
MATERIAL FUND CHANGES
This is a summary of certain changes to the fund since May 1, 2025. For more complete information, you may review the fund's prospectus as amended, which is available at funds.mfs.com or upon request at 1‑800‑225‑2606.
Effective May 22, 2026, the fund was reorganized into and with the MFS Lifetime Income Fund.
Effective May 22, 2026, the fund was reorganized into and with the MFS Lifetime Income Fund.
This is a summary of certain changes to the fund since May 1, 2025. For more complete information, you may review the fund's prospectus as amended, which is available at funds.mfs.com or upon request at 1‑800‑225‑2606.
This report describes planned changes to the Fund since May 1, 2025.
FUND EXPENSES
What were the fund costs for the last year?
| (based on a hypothetical $10,000 investment) | ||
| Class Name | Costs of a $10,000 investment ~ | Costs paid as a percentage of a $10,000 investment ~ |
| R1 | $104 | 1.00% |
˜ Expenses are direct expenses and do not include underlying fund fees and expenses.
MANAGEMENT'S DISCUSSION OF FUND PERFORMANCE
-
For the twelve months ended April 30, 2026, Class R1 shares of the MFS Lifetime 2025 Fund (fund) provided a total return of 7.86%, at net asset value. This compares with a return of 31.05% for the fund’s benchmark, the Standard & Poor's 500 Stock Index. The fund's other benchmark, the MFS Lifetime 2025 Fund Blended Index (Blended Index), generated a return of 11.31%. The Blended Index reflects the blended returns of broad asset class indices, with percentage allocations to each index designed to resemble the long term strategic allocations of the fund. The market indices and related percentage allocations used to compile the Blended Index are set forth in the Fund Performance.
-
Global equity markets reached record levels during the period, withstanding considerable volatility amid tariffs, geopolitical conflict and high levels of uncertainty. A new geopolitical event distressed markets at the end of the period as US and Israeli forces launched strikes against Iran, disrupting Mideast oil and natural gas exports. During the period, a pro-growth tax and spending bill was signed into law in the US, while in Europe, renewed focus on defense and infrastructure spending brightened the economic outlook. In Japan, the election of a pro-growth prime minister sent stocks to new highs prior to the conflict in Iran. Optimism over artificial intelligence remained high.
-
Considerable progress was made in trade talks between the US and many major trading partners, with a fragile truce between the US and China extended through late 2026. While the US Supreme Court struck down part of the Trump administration’s tariff strategy, the administration began deploying other authorities to largely replace the ones that were ruled unconstitutional.
-
Early in the period, moderating inflation pressures allowed many global central banks to ease monetary policy. Amid a difficult policymaking environment and slower job growth, the Federal Reserve resumed easing policy in September and delivered quarter-point rate cuts in October and December before pausing.
-
In fixed income markets, previously range-bound global bond yields spiked following the onset of the Middle East conflict, as energy-driven inflation fears appeared to have rattled bond investors. US rate volatility (as measured by the Merrill Lynch Option Volatility Estimate (MOVE) Index) similarly rose from intra-period lows, reflecting uncertainty around the scope and duration of the conflict and its implications for global growth. However, volatility later retracted as the risk of a broader regional military escalation appeared less likely. Global credit spreads widened only modestly before stabilizing near prior levels, supported by strong demand and resilient underlying fundamentals.
-
Top contributors to performance relative to the Blended Index:
-
The fund's fixed income segment was a primary contributor to relative performance, as the MFS Total Return Bond Fund outpaced its respective benchmark. From a style perspective, both emerging markets debt and high yield credit outperformed the broader index.
-
The international equity segment also benefited the fund's relative performance, as the MFS Blended Research International Equity Fund outperformed its respective benchmark.
-
-
Top detractors from performance relative to the Blended Index:
-
Within the US equity segment, lagging relative performance across the majority of the strategies weighed on relative results as the funds generally underperformed their respective benchmarks. Style selection also held back relative performance as mid-cap strategies underperformed the broader index.
-
FUND PERFORMANCE
The fund’s past performance is not a good predictor of the fund’s future performance. The graph and table below do not reflect the deduction of taxes that a shareholder would pay on fund distributions or the redemption of fund shares. The graph and table below assume reinvestment of dividends and capital gain distributions.
Growth of a Hypothetical $10,000 Investment
This graph shows the performance of a hypothetical $10,000 investment in Class R1 over a ten year period or since inception, if shorter, in comparison to (i) a broad measure of market performance and (ii) an additional index that MFS believes more closely reflects the market segments in which the fund invests.
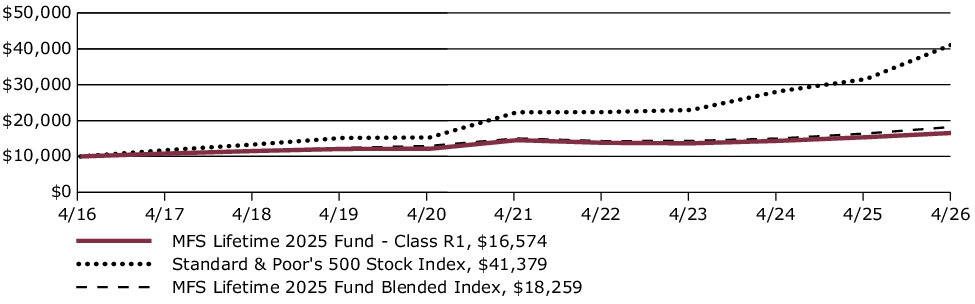
Average Annual Total Returns through 4/30/26
This table shows the average annual total returns of the class of shares noted for the periods shown, both with (if any) and without sales charges. It also shows the average annual total returns of (i) a broad measure of market performance and (ii) an additional index that MFS believes more closely reflects the market segments in which the fund invests, over the same periods.
| Share Class | 1-yr | 5-yr | 10-yr |
| R1 without sales charge | 7.86% | 2.65% | 5.18% |
| Comparative Benchmark(s) | |||
| Standard & Poor's 500 Stock Index ∆ | 31.05% | 13.14% | 15.26% |
| MFS Lifetime 2025 Fund Blended Index ∆ | 11.31% | 3.98% | 6.21% |
|
∆
|
Source: FactSet Research Systems Inc.
|
Visit mfs.com/perf/r1 for more recent performance information.
FUND STATISTICS AS OF 4/30/26
| Net Assets ($): | 286,512,731 | Total Management Fee ($)#: | 0 | |
| Total Number of Holdings: | 27 | Portfolio Turnover Rate (%): | 6 |
# The fund itself does not pay a management fee but the underlying funds in which the fund invests do pay management fees to MFS.
PORTFOLIO COMPOSITION (BASED ON TOTAL INVESTMENTS AS OF 4/30/26)
Portfolio allocation
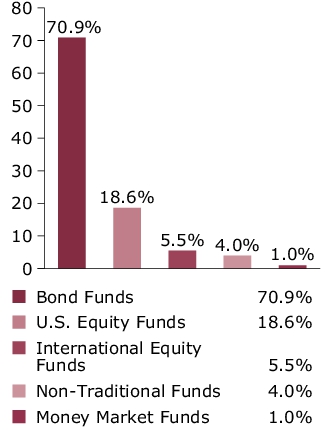
Portfolio holdings
| MFS Total Return Bond Fund | 20.0% |
| MFS Limited Maturity Fund | 20.0% |
| MFS Government Securities Fund | 10.0% |
| MFS Inflation-Adjusted Bond Fund | 9.9% |
| MFS Global Opportunistic Bond Fund | 7.0% |
| MFS Blended Research Mid Cap Equity Fund | 3.1% |
| MFS Blended Research International Equity Fund | 2.8% |
| MFS Blended Research Value Equity Fund | 2.0% |
| MFS Global Real Estate Fund | 2.0% |
| MFS Value Fund | 2.0% |
| MFS Commodity Strategy Fund | 2.0% |
| MFS High Income Fund | 2.0% |
| MFS Research International Fund | 1.7% |
| MFS Blended Research Core Equity Fund | 1.7% |
| MFS Research Fund | 1.6% |
| MFS Growth Fund | 1.6% |
| MFS Blended Research Growth Equity Fund | 1.6% |
| MFS Mid Cap Growth Fund | 1.5% |
| MFS Mid Cap Value Fund | 1.5% |
| MFS Blended Research Small Cap Equity Fund | 1.0% |
| MFS Emerging Markets Debt Fund | 1.0% |
| MFS Emerging Markets Debt Local Currency Fund | 1.0% |
| MFS Institutional Money Market Portfolio | 1.0% |
| MFS International Intrinsic Equity Fund | 0.5% |
| MFS International Growth Fund | 0.5% |
| MFS New Discovery Fund | 0.5% |
| MFS New Discovery Value Fund | 0.5% |
MATERIAL FUND CHANGES
This is a summary of certain changes to the fund since May 1, 2025. For more complete information, you may review the fund's prospectus as amended, which is available at funds.mfs.com or upon request at 1‑800‑225‑2606.
Effective May 22, 2026, the fund was reorganized into and with the MFS Lifetime Income Fund.
Effective May 22, 2026, the fund was reorganized into and with the MFS Lifetime Income Fund.
This is a summary of certain changes to the fund since May 1, 2025. For more complete information, you may review the fund's prospectus as amended, which is available at funds.mfs.com or upon request at 1‑800‑225‑2606.
This report describes planned changes to the Fund since May 1, 2025.
FUND EXPENSES
What were the fund costs for the last year?
| (based on a hypothetical $10,000 investment) | ||
| Class Name | Costs of a $10,000 investment ~ | Costs paid as a percentage of a $10,000 investment ~ |
| R2 | $52 | 0.50% |
˜ Expenses are direct expenses and do not include underlying fund fees and expenses.
MANAGEMENT'S DISCUSSION OF FUND PERFORMANCE
-
For the twelve months ended April 30, 2026, Class R2 shares of the MFS Lifetime 2025 Fund (fund) provided a total return of 9.79%, at net asset value. This compares with a return of 31.05% for the fund’s benchmark, the Standard & Poor's 500 Stock Index. The fund's other benchmark, the MFS Lifetime 2025 Fund Blended Index (Blended Index), generated a return of 11.31%. The Blended Index reflects the blended returns of broad asset class indices, with percentage allocations to each index designed to resemble the long term strategic allocations of the fund. The market indices and related percentage allocations used to compile the Blended Index are set forth in the Fund Performance.
-
Global equity markets reached record levels during the period, withstanding considerable volatility amid tariffs, geopolitical conflict and high levels of uncertainty. A new geopolitical event distressed markets at the end of the period as US and Israeli forces launched strikes against Iran, disrupting Mideast oil and natural gas exports. During the period, a pro-growth tax and spending bill was signed into law in the US, while in Europe, renewed focus on defense and infrastructure spending brightened the economic outlook. In Japan, the election of a pro-growth prime minister sent stocks to new highs prior to the conflict in Iran. Optimism over artificial intelligence remained high.
-
Considerable progress was made in trade talks between the US and many major trading partners, with a fragile truce between the US and China extended through late 2026. While the US Supreme Court struck down part of the Trump administration’s tariff strategy, the administration began deploying other authorities to largely replace the ones that were ruled unconstitutional.
-
Early in the period, moderating inflation pressures allowed many global central banks to ease monetary policy. Amid a difficult policymaking environment and slower job growth, the Federal Reserve resumed easing policy in September and delivered quarter-point rate cuts in October and December before pausing.
-
In fixed income markets, previously range-bound global bond yields spiked following the onset of the Middle East conflict, as energy-driven inflation fears appeared to have rattled bond investors. US rate volatility (as measured by the Merrill Lynch Option Volatility Estimate (MOVE) Index) similarly rose from intra-period lows, reflecting uncertainty around the scope and duration of the conflict and its implications for global growth. However, volatility later retracted as the risk of a broader regional military escalation appeared less likely. Global credit spreads widened only modestly before stabilizing near prior levels, supported by strong demand and resilient underlying fundamentals.
-
Top contributors to performance relative to the Blended Index:
-
The fund's fixed income segment was a primary contributor to relative performance, as the MFS Total Return Bond Fund outpaced its respective benchmark. From a style perspective, both emerging markets debt and high yield credit outperformed the broader index.
-
The international equity segment also benefited the fund's relative performance, as the MFS Blended Research International Equity Fund outperformed its respective benchmark.
-
-
Top detractors from performance relative to the Blended Index:
-
Within the US equity segment, lagging relative performance across the majority of the strategies weighed on relative results as the funds generally underperformed their respective benchmarks. Style selection also held back relative performance as mid-cap strategies underperformed the broader index.
-
FUND PERFORMANCE
The fund’s past performance is not a good predictor of the fund’s future performance. The graph and table below do not reflect the deduction of taxes that a shareholder would pay on fund distributions or the redemption of fund shares. The graph and table below assume reinvestment of dividends and capital gain distributions.
Growth of a Hypothetical $10,000 Investment
This graph shows the performance of a hypothetical $10,000 investment in Class R2 over a ten year period or since inception, if shorter, in comparison to (i) a broad measure of market performance and (ii) an additional index that MFS believes more closely reflects the market segments in which the fund invests.
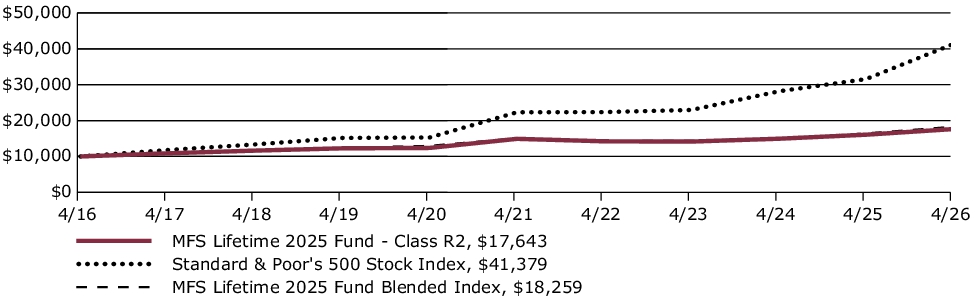
Average Annual Total Returns through 4/30/26
This table shows the average annual total returns of the class of shares noted for the periods shown, both with (if any) and without sales charges. It also shows the average annual total returns of (i) a broad measure of market performance and (ii) an additional index that MFS believes more closely reflects the market segments in which the fund invests, over the same periods.
| Share Class | 1-yr | 5-yr | 10-yr |
| R2 without sales charge | 9.79% | 3.42% | 5.84% |
| Comparative Benchmark(s) | |||
| Standard & Poor's 500 Stock Index ∆ | 31.05% | 13.14% | 15.26% |
| MFS Lifetime 2025 Fund Blended Index ∆ | 11.31% | 3.98% | 6.21% |
|
∆
|
Source: FactSet Research Systems Inc.
|
Visit mfs.com/perf/r2 for more recent performance information.
FUND STATISTICS AS OF 4/30/26
| Net Assets ($): | 286,512,731 | Total Management Fee ($)#: | 0 | |
| Total Number of Holdings: | 27 | Portfolio Turnover Rate (%): | 6 |
# The fund itself does not pay a management fee but the underlying funds in which the fund invests do pay management fees to MFS.
PORTFOLIO COMPOSITION (BASED ON TOTAL INVESTMENTS AS OF 4/30/26)
Portfolio allocation

Portfolio holdings
| MFS Total Return Bond Fund | 20.0% |
| MFS Limited Maturity Fund | 20.0% |
| MFS Government Securities Fund | 10.0% |
| MFS Inflation-Adjusted Bond Fund | 9.9% |
| MFS Global Opportunistic Bond Fund | 7.0% |
| MFS Blended Research Mid Cap Equity Fund | 3.1% |
| MFS Blended Research International Equity Fund | 2.8% |
| MFS Blended Research Value Equity Fund | 2.0% |
| MFS Global Real Estate Fund | 2.0% |
| MFS Value Fund | 2.0% |
| MFS Commodity Strategy Fund | 2.0% |
| MFS High Income Fund | 2.0% |
| MFS Research International Fund | 1.7% |
| MFS Blended Research Core Equity Fund | 1.7% |
| MFS Research Fund | 1.6% |
| MFS Growth Fund | 1.6% |
| MFS Blended Research Growth Equity Fund | 1.6% |
| MFS Mid Cap Growth Fund | 1.5% |
| MFS Mid Cap Value Fund | 1.5% |
| MFS Blended Research Small Cap Equity Fund | 1.0% |
| MFS Emerging Markets Debt Fund | 1.0% |
| MFS Emerging Markets Debt Local Currency Fund | 1.0% |
| MFS Institutional Money Market Portfolio | 1.0% |
| MFS International Intrinsic Equity Fund | 0.5% |
| MFS International Growth Fund | 0.5% |
| MFS New Discovery Fund | 0.5% |
| MFS New Discovery Value Fund | 0.5% |
MATERIAL FUND CHANGES
This is a summary of certain changes to the fund since May 1, 2025. For more complete information, you may review the fund's prospectus as amended, which is available at funds.mfs.com or upon request at 1‑800‑225‑2606.
Effective May 22, 2026, the fund was reorganized into and with the MFS Lifetime Income Fund.
Effective May 22, 2026, the fund was reorganized into and with the MFS Lifetime Income Fund.
This is a summary of certain changes to the fund since May 1, 2025. For more complete information, you may review the fund's prospectus as amended, which is available at funds.mfs.com or upon request at 1‑800‑225‑2606.
This report describes planned changes to the Fund since May 1, 2025.
FUND EXPENSES
What were the fund costs for the last year?
| (based on a hypothetical $10,000 investment) | ||
| Class Name | Costs of a $10,000 investment ~ | Costs paid as a percentage of a $10,000 investment ~ |
| R3 | $26 | 0.25% |
˜ Expenses are direct expenses and do not include underlying fund fees and expenses.
MANAGEMENT'S DISCUSSION OF FUND PERFORMANCE
-
For the twelve months ended April 30, 2026, Class R3 shares of the MFS Lifetime 2025 Fund (fund) provided a total return of 10.06%, at net asset value. This compares with a return of 31.05% for the fund’s benchmark, the Standard & Poor's 500 Stock Index. The fund's other benchmark, the MFS Lifetime 2025 Fund Blended Index (Blended Index), generated a return of 11.31%. The Blended Index reflects the blended returns of broad asset class indices, with percentage allocations to each index designed to resemble the long term strategic allocations of the fund. The market indices and related percentage allocations used to compile the Blended Index are set forth in the Fund Performance.
-
Global equity markets reached record levels during the period, withstanding considerable volatility amid tariffs, geopolitical conflict and high levels of uncertainty. A new geopolitical event distressed markets at the end of the period as US and Israeli forces launched strikes against Iran, disrupting Mideast oil and natural gas exports. During the period, a pro-growth tax and spending bill was signed into law in the US, while in Europe, renewed focus on defense and infrastructure spending brightened the economic outlook. In Japan, the election of a pro-growth prime minister sent stocks to new highs prior to the conflict in Iran. Optimism over artificial intelligence remained high.
-
Considerable progress was made in trade talks between the US and many major trading partners, with a fragile truce between the US and China extended through late 2026. While the US Supreme Court struck down part of the Trump administration’s tariff strategy, the administration began deploying other authorities to largely replace the ones that were ruled unconstitutional.
-
Early in the period, moderating inflation pressures allowed many global central banks to ease monetary policy. Amid a difficult policymaking environment and slower job growth, the Federal Reserve resumed easing policy in September and delivered quarter-point rate cuts in October and December before pausing.
-
In fixed income markets, previously range-bound global bond yields spiked following the onset of the Middle East conflict, as energy-driven inflation fears appeared to have rattled bond investors. US rate volatility (as measured by the Merrill Lynch Option Volatility Estimate (MOVE) Index) similarly rose from intra-period lows, reflecting uncertainty around the scope and duration of the conflict and its implications for global growth. However, volatility later retracted as the risk of a broader regional military escalation appeared less likely. Global credit spreads widened only modestly before stabilizing near prior levels, supported by strong demand and resilient underlying fundamentals.
-
Top contributors to performance relative to the Blended Index:
-
The fund's fixed income segment was a primary contributor to relative performance, as the MFS Total Return Bond Fund outpaced its respective benchmark. From a style perspective, both emerging markets debt and high yield credit outperformed the broader index.
-
The international equity segment also benefited the fund's relative performance, as the MFS Blended Research International Equity Fund outperformed its respective benchmark.
-
-
Top detractors from performance relative to the Blended Index:
-
Within the US equity segment, lagging relative performance across the majority of the strategies weighed on relative results as the funds generally underperformed their respective benchmarks. Style selection also held back relative performance as mid-cap strategies underperformed the broader index.
-
FUND PERFORMANCE
The fund’s past performance is not a good predictor of the fund’s future performance. The graph and table below do not reflect the deduction of taxes that a shareholder would pay on fund distributions or the redemption of fund shares. The graph and table below assume reinvestment of dividends and capital gain distributions.
Growth of a Hypothetical $10,000 Investment
This graph shows the performance of a hypothetical $10,000 investment in Class R3 over a ten year period or since inception, if shorter, in comparison to (i) a broad measure of market performance and (ii) an additional index that MFS believes more closely reflects the market segments in which the fund invests.
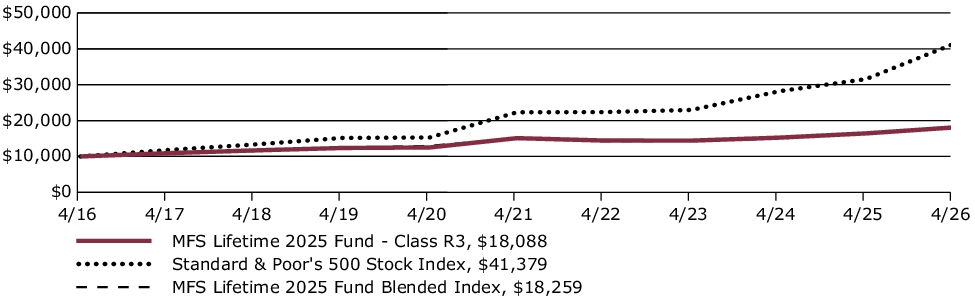
Average Annual Total Returns through 4/30/26
This table shows the average annual total returns of the class of shares noted for the periods shown, both with (if any) and without sales charges. It also shows the average annual total returns of (i) a broad measure of market performance and (ii) an additional index that MFS believes more closely reflects the market segments in which the fund invests, over the same periods.
| Share Class | 1-yr | 5-yr | 10-yr |
| R3 without sales charge | 10.06% | 3.67% | 6.11% |
| Comparative Benchmark(s) | |||
| Standard & Poor's 500 Stock Index ∆ | 31.05% | 13.14% | 15.26% |
| MFS Lifetime 2025 Fund Blended Index ∆ | 11.31% | 3.98% | 6.21% |
|
∆
|
Source: FactSet Research Systems Inc.
|
Visit mfs.com/perf/r3 for more recent performance information.
FUND STATISTICS AS OF 4/30/26
| Net Assets ($): | 286,512,731 | Total Management Fee ($)#: | 0 | |
| Total Number of Holdings: | 27 | Portfolio Turnover Rate (%): | 6 |
# The fund itself does not pay a management fee but the underlying funds in which the fund invests do pay management fees to MFS.
PORTFOLIO COMPOSITION (BASED ON TOTAL INVESTMENTS AS OF 4/30/26)
Portfolio allocation

Portfolio holdings
| MFS Total Return Bond Fund | 20.0% |
| MFS Limited Maturity Fund | 20.0% |
| MFS Government Securities Fund | 10.0% |
| MFS Inflation-Adjusted Bond Fund | 9.9% |
| MFS Global Opportunistic Bond Fund | 7.0% |
| MFS Blended Research Mid Cap Equity Fund | 3.1% |
| MFS Blended Research International Equity Fund | 2.8% |
| MFS Blended Research Value Equity Fund | 2.0% |
| MFS Global Real Estate Fund | 2.0% |
| MFS Value Fund | 2.0% |
| MFS Commodity Strategy Fund | 2.0% |
| MFS High Income Fund | 2.0% |
| MFS Research International Fund | 1.7% |
| MFS Blended Research Core Equity Fund | 1.7% |
| MFS Research Fund | 1.6% |
| MFS Growth Fund | 1.6% |
| MFS Blended Research Growth Equity Fund | 1.6% |
| MFS Mid Cap Growth Fund | 1.5% |
| MFS Mid Cap Value Fund | 1.5% |
| MFS Blended Research Small Cap Equity Fund | 1.0% |
| MFS Emerging Markets Debt Fund | 1.0% |
| MFS Emerging Markets Debt Local Currency Fund | 1.0% |
| MFS Institutional Money Market Portfolio | 1.0% |
| MFS International Intrinsic Equity Fund | 0.5% |
| MFS International Growth Fund | 0.5% |
| MFS New Discovery Fund | 0.5% |
| MFS New Discovery Value Fund | 0.5% |
MATERIAL FUND CHANGES
This is a summary of certain changes to the fund since May 1, 2025. For more complete information, you may review the fund's prospectus as amended, which is available at funds.mfs.com or upon request at 1‑800‑225‑2606.
Effective May 22, 2026, the fund was reorganized into and with the MFS Lifetime Income Fund.
Effective May 22, 2026, the fund was reorganized into and with the MFS Lifetime Income Fund.
This is a summary of certain changes to the fund since May 1, 2025. For more complete information, you may review the fund's prospectus as amended, which is available at funds.mfs.com or upon request at 1‑800‑225‑2606.
This report describes planned changes to the Fund since May 1, 2025.
FUND EXPENSES
What were the fund costs for the last year?
| (based on a hypothetical $10,000 investment) | ||
| Class Name | Costs of a $10,000 investment ~ | Costs paid as a percentage of a $10,000 investment ~ |
| R4 | $0 | 0.00% |
˜ Expenses are direct expenses and do not include underlying fund fees and expenses.
MANAGEMENT'S DISCUSSION OF FUND PERFORMANCE
-
For the twelve months ended April 30, 2026, Class R4 shares of the MFS Lifetime 2025 Fund (fund) provided a total return of 10.25%, at net asset value. This compares with a return of 31.05% for the fund’s benchmark, the Standard & Poor's 500 Stock Index. The fund's other benchmark, the MFS Lifetime 2025 Fund Blended Index (Blended Index), generated a return of 11.31%. The Blended Index reflects the blended returns of broad asset class indices, with percentage allocations to each index designed to resemble the long term strategic allocations of the fund. The market indices and related percentage allocations used to compile the Blended Index are set forth in the Fund Performance.
-
Global equity markets reached record levels during the period, withstanding considerable volatility amid tariffs, geopolitical conflict and high levels of uncertainty. A new geopolitical event distressed markets at the end of the period as US and Israeli forces launched strikes against Iran, disrupting Mideast oil and natural gas exports. During the period, a pro-growth tax and spending bill was signed into law in the US, while in Europe, renewed focus on defense and infrastructure spending brightened the economic outlook. In Japan, the election of a pro-growth prime minister sent stocks to new highs prior to the conflict in Iran. Optimism over artificial intelligence remained high.
-
Considerable progress was made in trade talks between the US and many major trading partners, with a fragile truce between the US and China extended through late 2026. While the US Supreme Court struck down part of the Trump administration’s tariff strategy, the administration began deploying other authorities to largely replace the ones that were ruled unconstitutional.
-
Early in the period, moderating inflation pressures allowed many global central banks to ease monetary policy. Amid a difficult policymaking environment and slower job growth, the Federal Reserve resumed easing policy in September and delivered quarter-point rate cuts in October and December before pausing.
-
In fixed income markets, previously range-bound global bond yields spiked following the onset of the Middle East conflict, as energy-driven inflation fears appeared to have rattled bond investors. US rate volatility (as measured by the Merrill Lynch Option Volatility Estimate (MOVE) Index) similarly rose from intra-period lows, reflecting uncertainty around the scope and duration of the conflict and its implications for global growth. However, volatility later retracted as the risk of a broader regional military escalation appeared less likely. Global credit spreads widened only modestly before stabilizing near prior levels, supported by strong demand and resilient underlying fundamentals.
-
Top contributors to performance relative to the Blended Index:
-
The fund's fixed income segment was a primary contributor to relative performance, as the MFS Total Return Bond Fund outpaced its respective benchmark. From a style perspective, both emerging markets debt and high yield credit outperformed the broader index.
-
The international equity segment also benefited the fund's relative performance, as the MFS Blended Research International Equity Fund outperformed its respective benchmark.
-
-
Top detractors from performance relative to the Blended Index:
-
Within the US equity segment, lagging relative performance across the majority of the strategies weighed on relative results as the funds generally underperformed their respective benchmarks. Style selection also held back relative performance as mid-cap strategies underperformed the broader index.
-
FUND PERFORMANCE
The fund’s past performance is not a good predictor of the fund’s future performance. The graph and table below do not reflect the deduction of taxes that a shareholder would pay on fund distributions or the redemption of fund shares. The graph and table below assume reinvestment of dividends and capital gain distributions.
Growth of a Hypothetical $10,000 Investment
This graph shows the performance of a hypothetical $10,000 investment in Class R4 over a ten year period or since inception, if shorter, in comparison to (i) a broad measure of market performance and (ii) an additional index that MFS believes more closely reflects the market segments in which the fund invests.
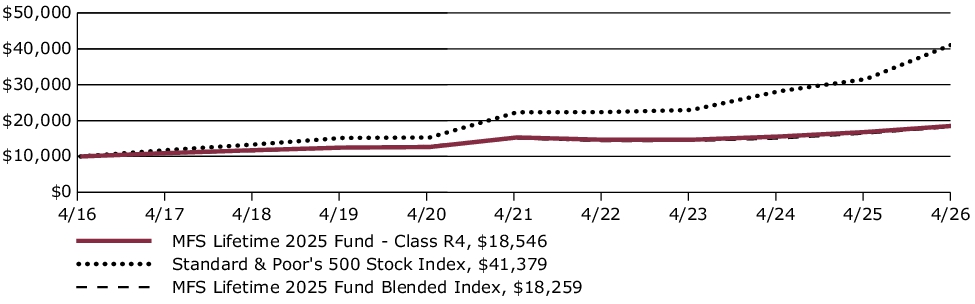
Average Annual Total Returns through 4/30/26
This table shows the average annual total returns of the class of shares noted for the periods shown, both with (if any) and without sales charges. It also shows the average annual total returns of (i) a broad measure of market performance and (ii) an additional index that MFS believes more closely reflects the market segments in which the fund invests, over the same periods.
| Share Class | 1-yr | 5-yr | 10-yr |
| R4 without sales charge | 10.25% | 3.92% | 6.37% |
| Comparative Benchmark(s) | |||
| Standard & Poor's 500 Stock Index ∆ | 31.05% | 13.14% | 15.26% |
| MFS Lifetime 2025 Fund Blended Index ∆ | 11.31% | 3.98% | 6.21% |
|
∆
|
Source: FactSet Research Systems Inc.
|
Visit mfs.com/perf/r4 for more recent performance information.
FUND STATISTICS AS OF 4/30/26
| Net Assets ($): | 286,512,731 | Total Management Fee ($)#: | 0 | |
| Total Number of Holdings: | 27 | Portfolio Turnover Rate (%): | 6 |
# The fund itself does not pay a management fee but the underlying funds in which the fund invests do pay management fees to MFS.
PORTFOLIO COMPOSITION (BASED ON TOTAL INVESTMENTS AS OF 4/30/26)
Portfolio allocation

Portfolio holdings
| MFS Total Return Bond Fund | 20.0% |
| MFS Limited Maturity Fund | 20.0% |
| MFS Government Securities Fund | 10.0% |
| MFS Inflation-Adjusted Bond Fund | 9.9% |
| MFS Global Opportunistic Bond Fund | 7.0% |
| MFS Blended Research Mid Cap Equity Fund | 3.1% |
| MFS Blended Research International Equity Fund | 2.8% |
| MFS Blended Research Value Equity Fund | 2.0% |
| MFS Global Real Estate Fund | 2.0% |
| MFS Value Fund | 2.0% |
| MFS Commodity Strategy Fund | 2.0% |
| MFS High Income Fund | 2.0% |
| MFS Research International Fund | 1.7% |
| MFS Blended Research Core Equity Fund | 1.7% |
| MFS Research Fund | 1.6% |
| MFS Growth Fund | 1.6% |
| MFS Blended Research Growth Equity Fund | 1.6% |
| MFS Mid Cap Growth Fund | 1.5% |
| MFS Mid Cap Value Fund | 1.5% |
| MFS Blended Research Small Cap Equity Fund | 1.0% |
| MFS Emerging Markets Debt Fund | 1.0% |
| MFS Emerging Markets Debt Local Currency Fund | 1.0% |
| MFS Institutional Money Market Portfolio | 1.0% |
| MFS International Intrinsic Equity Fund | 0.5% |
| MFS International Growth Fund | 0.5% |
| MFS New Discovery Fund | 0.5% |
| MFS New Discovery Value Fund | 0.5% |
MATERIAL FUND CHANGES
This is a summary of certain changes to the fund since May 1, 2025. For more complete information, you may review the fund's prospectus as amended, which is available at funds.mfs.com or upon request at 1‑800‑225‑2606.
Effective May 22, 2026, the fund was reorganized into and with the MFS Lifetime Income Fund.
Effective May 22, 2026, the fund was reorganized into and with the MFS Lifetime Income Fund.
This is a summary of certain changes to the fund since May 1, 2025. For more complete information, you may review the fund's prospectus as amended, which is available at funds.mfs.com or upon request at 1‑800‑225‑2606.
This report describes planned changes to the Fund since May 1, 2025.
FUND EXPENSES
What were the fund costs for the last year?
| (based on a hypothetical $10,000 investment) | ||
| Class Name | Costs of a $10,000 investment ~ | Costs paid as a percentage of a $10,000 investment ~ |
| R6 | $0 | 0.00% |
˜ Expenses are direct expenses and do not include underlying fund fees and expenses.
MANAGEMENT'S DISCUSSION OF FUND PERFORMANCE
-
For the twelve months ended April 30, 2026, Class R6 shares of the MFS Lifetime 2025 Fund (fund) provided a total return of 10.45%, at net asset value. This compares with a return of 31.05% for the fund’s benchmark, the Standard & Poor's 500 Stock Index. The fund's other benchmark, the MFS Lifetime 2025 Fund Blended Index (Blended Index), generated a return of 11.31%. The Blended Index reflects the blended returns of broad asset class indices, with percentage allocations to each index designed to resemble the long term strategic allocations of the fund. The market indices and related percentage allocations used to compile the Blended Index are set forth in the Fund Performance.
-
Global equity markets reached record levels during the period, withstanding considerable volatility amid tariffs, geopolitical conflict and high levels of uncertainty. A new geopolitical event distressed markets at the end of the period as US and Israeli forces launched strikes against Iran, disrupting Mideast oil and natural gas exports. During the period, a pro-growth tax and spending bill was signed into law in the US, while in Europe, renewed focus on defense and infrastructure spending brightened the economic outlook. In Japan, the election of a pro-growth prime minister sent stocks to new highs prior to the conflict in Iran. Optimism over artificial intelligence remained high.
-
Considerable progress was made in trade talks between the US and many major trading partners, with a fragile truce between the US and China extended through late 2026. While the US Supreme Court struck down part of the Trump administration’s tariff strategy, the administration began deploying other authorities to largely replace the ones that were ruled unconstitutional.
-
Early in the period, moderating inflation pressures allowed many global central banks to ease monetary policy. Amid a difficult policymaking environment and slower job growth, the Federal Reserve resumed easing policy in September and delivered quarter-point rate cuts in October and December before pausing.
-
In fixed income markets, previously range-bound global bond yields spiked following the onset of the Middle East conflict, as energy-driven inflation fears appeared to have rattled bond investors. US rate volatility (as measured by the Merrill Lynch Option Volatility Estimate (MOVE) Index) similarly rose from intra-period lows, reflecting uncertainty around the scope and duration of the conflict and its implications for global growth. However, volatility later retracted as the risk of a broader regional military escalation appeared less likely. Global credit spreads widened only modestly before stabilizing near prior levels, supported by strong demand and resilient underlying fundamentals.
-
Top contributors to performance relative to the Blended Index:
-
The fund's fixed income segment was a primary contributor to relative performance, as the MFS Total Return Bond Fund outpaced its respective benchmark. From a style perspective, both emerging markets debt and high yield credit outperformed the broader index.
-
The international equity segment also benefited the fund's relative performance, as the MFS Blended Research International Equity Fund outperformed its respective benchmark.
-
-
Top detractors from performance relative to the Blended Index:
-
Within the US equity segment, lagging relative performance across the majority of the strategies weighed on relative results as the funds generally underperformed their respective benchmarks. Style selection also held back relative performance as mid-cap strategies underperformed the broader index.
-
FUND PERFORMANCE
The fund’s past performance is not a good predictor of the fund’s future performance. The graph and table below do not reflect the deduction of taxes that a shareholder would pay on fund distributions or the redemption of fund shares. The graph and table below assume reinvestment of dividends and capital gain distributions.
Growth of a Hypothetical $10,000 Investment*
This graph shows the performance of a hypothetical $10,000 investment in Class R6 over a ten year period or since inception, if shorter, in comparison to (i) a broad measure of market performance and (ii) an additional index that MFS believes more closely reflects the market segments in which the fund invests.
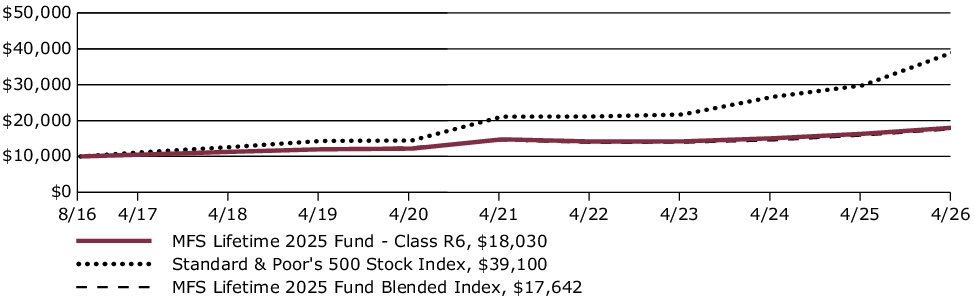
Average Annual Total Returns through 4/30/26
This table shows the average annual total returns of the class of shares noted for the periods shown, both with (if any) and without sales charges. It also shows the average annual total returns of (i) a broad measure of market performance and (ii) an additional index that MFS believes more closely reflects the market segments in which the fund invests, over the same periods.
| Share Class | 1-yr | 5-yr | Life* |
| R6 without sales charge | 10.45% | 4.07% | 6.28% |
| Comparative Benchmark(s) | |||
| Standard & Poor's 500 Stock Index ∆ | 31.05% | 13.14% | 15.13% |
| MFS Lifetime 2025 Fund Blended Index ∆ | 11.31% | 3.98% | 6.04% |
|
*
|
For the period from the commencement of the class's investment operations, August 29, 2016 through April 30, 2026.
|
|
∆
|
Source: FactSet Research Systems Inc.
|
Visit mfs.com/perf/r6 for more recent performance information.
FUND STATISTICS AS OF 4/30/26
| Net Assets ($): | 286,512,731 | Total Management Fee ($)#: | 0 | |
| Total Number of Holdings: | 27 | Portfolio Turnover Rate (%): | 6 |
# The fund itself does not pay a management fee but the underlying funds in which the fund invests do pay management fees to MFS.
PORTFOLIO COMPOSITION (BASED ON TOTAL INVESTMENTS AS OF 4/30/26)
Portfolio allocation

Portfolio holdings
| MFS Total Return Bond Fund | 20.0% |
| MFS Limited Maturity Fund | 20.0% |
| MFS Government Securities Fund | 10.0% |
| MFS Inflation-Adjusted Bond Fund | 9.9% |
| MFS Global Opportunistic Bond Fund | 7.0% |
| MFS Blended Research Mid Cap Equity Fund | 3.1% |
| MFS Blended Research International Equity Fund | 2.8% |
| MFS Blended Research Value Equity Fund | 2.0% |
| MFS Global Real Estate Fund | 2.0% |
| MFS Value Fund | 2.0% |
| MFS Commodity Strategy Fund | 2.0% |
| MFS High Income Fund | 2.0% |
| MFS Research International Fund | 1.7% |
| MFS Blended Research Core Equity Fund | 1.7% |
| MFS Research Fund | 1.6% |
| MFS Growth Fund | 1.6% |
| MFS Blended Research Growth Equity Fund | 1.6% |
| MFS Mid Cap Growth Fund | 1.5% |
| MFS Mid Cap Value Fund | 1.5% |
| MFS Blended Research Small Cap Equity Fund | 1.0% |
| MFS Emerging Markets Debt Fund | 1.0% |
| MFS Emerging Markets Debt Local Currency Fund | 1.0% |
| MFS Institutional Money Market Portfolio | 1.0% |
| MFS International Intrinsic Equity Fund | 0.5% |
| MFS International Growth Fund | 0.5% |
| MFS New Discovery Fund | 0.5% |
| MFS New Discovery Value Fund | 0.5% |
MATERIAL FUND CHANGES
This is a summary of certain changes to the fund since May 1, 2025. For more complete information, you may review the fund's prospectus as amended, which is available at funds.mfs.com or upon request at 1‑800‑225‑2606.
Effective May 22, 2026, the fund was reorganized into and with the MFS Lifetime Income Fund.
Effective May 22, 2026, the fund was reorganized into and with the MFS Lifetime Income Fund.
This is a summary of certain changes to the fund since May 1, 2025. For more complete information, you may review the fund's prospectus as amended, which is available at funds.mfs.com or upon request at 1‑800‑225‑2606.
FUND EXPENSES
What were the fund costs for the last year?
| (based on a hypothetical $10,000 investment) | ||
| Class Name | Costs of a $10,000 investment ~ | Costs paid as a percentage of a $10,000 investment ~ |
| A | $28 | 0.25% |
˜ Expenses are direct expenses and do not include underlying fund fees and expenses.
MANAGEMENT'S DISCUSSION OF FUND PERFORMANCE
-
For the twelve months ended April 30, 2026, Class A shares of the MFS Lifetime 2050 Fund (fund) provided a total return of 24.39%, at net asset value. This compares with a return of 31.05% for the fund’s benchmark, the Standard & Poor's 500 Stock Index. The fund's other benchmark, the MFS Lifetime 2050 Fund Blended Index (Blended Index), generated a return of 27.95%. The Blended Index reflects the blended returns of broad asset class indices, with percentage allocations to each index designed to resemble the long term strategic allocations of the fund. The market indices and related percentage allocations used to compile the Blended Index are set forth in the Fund Performance.
-
Global equity markets reached record levels during the period, withstanding considerable volatility amid tariffs, geopolitical conflict and high levels of uncertainty. A new geopolitical event distressed markets at the end of the period as US and Israeli forces launched strikes against Iran, disrupting Mideast oil and natural gas exports. During the period, a pro-growth tax and spending bill was signed into law in the US, while in Europe, renewed focus on defense and infrastructure spending brightened the economic outlook. In Japan, the election of a pro-growth prime minister sent stocks to new highs prior to the conflict in Iran. Optimism over artificial intelligence remained high.
-
Considerable progress was made in trade talks between the US and many major trading partners, with a fragile truce between the US and China extended through late 2026. While the US Supreme Court struck down part of the Trump administration’s tariff strategy, the administration began deploying other authorities to largely replace the ones that were ruled unconstitutional.
-
Early in the period, moderating inflation pressures allowed many global central banks to ease monetary policy. Amid a difficult policymaking environment and slower job growth, the Federal Reserve resumed easing policy in September and delivered quarter-point rate cuts in October and December before pausing.
-
In fixed income markets, previously range-bound global bond yields spiked following the onset of the Middle East conflict, as energy-driven inflation fears appeared to have rattled bond investors. US rate volatility (as measured by the Merrill Lynch Option Volatility Estimate (MOVE) Index) similarly rose from intra-period lows, reflecting uncertainty around the scope and duration of the conflict and its implications for global growth. However, volatility later retracted as the risk of a broader regional military escalation appeared less likely. Global credit spreads widened only modestly before stabilizing near prior levels, supported by strong demand and resilient underlying fundamentals.
-
Top contributors to performance relative to the Blended Index:
-
The fund's international equity segment benefited relative performance, as the MFS Blended Research International Equity Fund outpaced its respective benchmark.
-
-
Top detractors from performance relative to the Blended Index:
-
Within the US equity segment, lagging relative performance across the majority of the strategies weighed on relative results as the funds generally underperformed their respective benchmarks. Style selection also held back relative performance as mid-cap growth and mid-cap core strategies underperformed the broader index.
-
FUND PERFORMANCE
The fund’s past performance is not a good predictor of the fund’s future performance. The graph and table below do not reflect the deduction of taxes that a shareholder would pay on fund distributions or the redemption of fund shares. The graph and table below assume reinvestment of dividends and capital gain distributions.
Growth of a Hypothetical $10,000 Investment
This graph shows the performance of a hypothetical $10,000 investment in Class A over a ten year period or since inception, if shorter, in comparison to (i) a broad measure of market performance and (ii) an additional index that MFS believes more closely reflects the market segments in which the fund invests. This graph includes the deduction of the maximum applicable sales charge.

Average Annual Total Returns through 4/30/26
This table shows the average annual total returns of the class of shares noted for the periods shown, both with (if any) and without sales charges. It also shows the average annual total returns of (i) a broad measure of market performance and (ii) an additional index that MFS believes more closely reflects the market segments in which the fund invests, over the same periods.
| Share Class | 1-yr | 5-yr | 10-yr |
| A without sales charge | 24.39% | 8.41% | 10.79% |
| A with initial sales charge (5.75%) | 17.24% | 7.13% | 10.14% |
| Comparative Benchmark(s) | |||
| Standard & Poor's 500 Stock Index ∆ | 31.05% | 13.14% | 15.26% |
| MFS Lifetime 2050 Fund Blended Index ∆ | 27.95% | 10.92% | 11.95% |
|
∆
|
Source: FactSet Research Systems Inc.
|
Visit mfs.com/perf/a for more recent performance information.
FUND STATISTICS AS OF 4/30/26
| Net Assets ($): | 619,835,238 | Total Management Fee ($)#: | 0 | |
| Total Number of Holdings: | 28 | Portfolio Turnover Rate (%): | 7 |
# The fund itself does not pay a management fee but the underlying funds in which the fund invests do pay management fees to MFS.
PORTFOLIO COMPOSITION (BASED ON TOTAL INVESTMENTS AS OF 4/30/26)
Portfolio allocation

Portfolio holdings
| MFS Blended Research International Equity Fund | 11.0% |
| MFS Blended Research Mid Cap Equity Fund | 10.0% |
| MFS Blended Research Value Equity Fund | 5.5% |
| MFS Value Fund | 5.4% |
| MFS Growth Fund | 5.3% |
| MFS Blended Research Growth Equity Fund | 5.2% |
| MFS Mid Cap Growth Fund | 5.0% |
| MFS Global Real Estate Fund | 5.0% |
| MFS Commodity Strategy Fund | 4.9% |
| MFS Mid Cap Value Fund | 4.9% |
| MFS Blended Research Core Equity Fund | 4.7% |
| MFS Research Fund | 4.7% |
| MFS Research International Fund | 4.0% |
| MFS International New Discovery Fund | 4.0% |
| MFS International Intrinsic Equity Fund | 3.5% |
| MFS International Growth Fund | 3.4% |
| MFS Blended Research Small Cap Equity Fund | 2.5% |
| MFS Inflation-Adjusted Bond Fund | 2.5% |
| MFS Total Return Bond Fund | 2.4% |
| MFS New Discovery Fund | 1.3% |
| MFS New Discovery Value Fund | 1.2% |
| MFS Blended Research Emerging Markets Equity Fund | 1.0% |
| MFS Emerging Markets Equity Fund | 1.0% |
| MFS Institutional Money Market Portfolio | 1.0% |
| MFS High Income Fund | 0.2% |
| MFS Emerging Markets Debt Fund | 0.2% |
| MFS Global Opportunistic Bond Fund | 0.1% |
| MFS Emerging Markets Debt Local Currency Fund | 0.1% |
FUND EXPENSES
What were the fund costs for the last year?
| (based on a hypothetical $10,000 investment) | ||
| Class Name | Costs of a $10,000 investment ~ | Costs paid as a percentage of a $10,000 investment ~ |
| B | $112 | 1.00% |
˜ Expenses are direct expenses and do not include underlying fund fees and expenses.
MANAGEMENT'S DISCUSSION OF FUND PERFORMANCE
-
For the twelve months ended April 30, 2026, Class B shares of the MFS Lifetime 2050 Fund (fund) provided a total return of 23.44%, at net asset value. This compares with a return of 31.05% for the fund’s benchmark, the Standard & Poor's 500 Stock Index. The fund's other benchmark, the MFS Lifetime 2050 Fund Blended Index (Blended Index), generated a return of 27.95%. The Blended Index reflects the blended returns of broad asset class indices, with percentage allocations to each index designed to resemble the long term strategic allocations of the fund. The market indices and related percentage allocations used to compile the Blended Index are set forth in the Fund Performance.
-
Global equity markets reached record levels during the period, withstanding considerable volatility amid tariffs, geopolitical conflict and high levels of uncertainty. A new geopolitical event distressed markets at the end of the period as US and Israeli forces launched strikes against Iran, disrupting Mideast oil and natural gas exports. During the period, a pro-growth tax and spending bill was signed into law in the US, while in Europe, renewed focus on defense and infrastructure spending brightened the economic outlook. In Japan, the election of a pro-growth prime minister sent stocks to new highs prior to the conflict in Iran. Optimism over artificial intelligence remained high.
-
Considerable progress was made in trade talks between the US and many major trading partners, with a fragile truce between the US and China extended through late 2026. While the US Supreme Court struck down part of the Trump administration’s tariff strategy, the administration began deploying other authorities to largely replace the ones that were ruled unconstitutional.
-
Early in the period, moderating inflation pressures allowed many global central banks to ease monetary policy. Amid a difficult policymaking environment and slower job growth, the Federal Reserve resumed easing policy in September and delivered quarter-point rate cuts in October and December before pausing.
-
In fixed income markets, previously range-bound global bond yields spiked following the onset of the Middle East conflict, as energy-driven inflation fears appeared to have rattled bond investors. US rate volatility (as measured by the Merrill Lynch Option Volatility Estimate (MOVE) Index) similarly rose from intra-period lows, reflecting uncertainty around the scope and duration of the conflict and its implications for global growth. However, volatility later retracted as the risk of a broader regional military escalation appeared less likely. Global credit spreads widened only modestly before stabilizing near prior levels, supported by strong demand and resilient underlying fundamentals.
-
Top contributors to performance relative to the Blended Index:
-
The fund's international equity segment benefited relative performance, as the MFS Blended Research International Equity Fund outpaced its respective benchmark.
-
-
Top detractors from performance relative to the Blended Index:
-
Within the US equity segment, lagging relative performance across the majority of the strategies weighed on relative results as the funds generally underperformed their respective benchmarks. Style selection also held back relative performance as mid-cap growth and mid-cap core strategies underperformed the broader index.
-
FUND PERFORMANCE
The fund’s past performance is not a good predictor of the fund’s future performance. The graph and table below do not reflect the deduction of taxes that a shareholder would pay on fund distributions or the redemption of fund shares. The graph and table below assume reinvestment of dividends and capital gain distributions.
Growth of a Hypothetical $10,000 Investment
This graph shows the performance of a hypothetical $10,000 investment in Class B over a ten year period or since inception, if shorter, in comparison to (i) a broad measure of market performance and (ii) an additional index that MFS believes more closely reflects the market segments in which the fund invests.
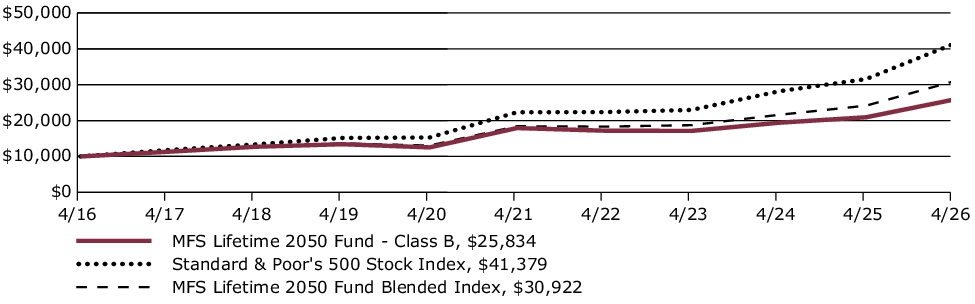
Average Annual Total Returns through 4/30/26
This table shows the average annual total returns of the class of shares noted for the periods shown, both with (if any) and without sales charges. It also shows the average annual total returns of (i) a broad measure of market performance and (ii) an additional index that MFS believes more closely reflects the market segments in which the fund invests, over the same periods.
| Share Class | 1-yr | 5-yr | 10-yr |
| B without sales charge | 23.44% | 7.59% | 9.96% |
| B with CDSC (declining over six years from 4% to 0%)× | 19.44% | 7.29% | 9.96% |
| Comparative Benchmark(s) | |||
| Standard & Poor's 500 Stock Index ∆ | 31.05% | 13.14% | 15.26% |
| MFS Lifetime 2050 Fund Blended Index ∆ | 27.95% | 10.92% | 11.95% |
|
∆
|
Source: FactSet Research Systems Inc.
|
|
×
|
Assuming redemption at the end of the applicable period.
|
Visit mfs.com/perf/b for more recent performance information.
FUND STATISTICS AS OF 4/30/26
| Net Assets ($): | 619,835,238 | Total Management Fee ($)#: | 0 | |
| Total Number of Holdings: | 28 | Portfolio Turnover Rate (%): | 7 |
# The fund itself does not pay a management fee but the underlying funds in which the fund invests do pay management fees to MFS.
PORTFOLIO COMPOSITION (BASED ON TOTAL INVESTMENTS AS OF 4/30/26)
Portfolio allocation

Portfolio holdings
| MFS Blended Research International Equity Fund | 11.0% |
| MFS Blended Research Mid Cap Equity Fund | 10.0% |
| MFS Blended Research Value Equity Fund | 5.5% |
| MFS Value Fund | 5.4% |
| MFS Growth Fund | 5.3% |
| MFS Blended Research Growth Equity Fund | 5.2% |
| MFS Mid Cap Growth Fund | 5.0% |
| MFS Global Real Estate Fund | 5.0% |
| MFS Commodity Strategy Fund | 4.9% |
| MFS Mid Cap Value Fund | 4.9% |
| MFS Blended Research Core Equity Fund | 4.7% |
| MFS Research Fund | 4.7% |
| MFS Research International Fund | 4.0% |
| MFS International New Discovery Fund | 4.0% |
| MFS International Intrinsic Equity Fund | 3.5% |
| MFS International Growth Fund | 3.4% |
| MFS Blended Research Small Cap Equity Fund | 2.5% |
| MFS Inflation-Adjusted Bond Fund | 2.5% |
| MFS Total Return Bond Fund | 2.4% |
| MFS New Discovery Fund | 1.3% |
| MFS New Discovery Value Fund | 1.2% |
| MFS Blended Research Emerging Markets Equity Fund | 1.0% |
| MFS Emerging Markets Equity Fund | 1.0% |
| MFS Institutional Money Market Portfolio | 1.0% |
| MFS High Income Fund | 0.2% |
| MFS Emerging Markets Debt Fund | 0.2% |
| MFS Global Opportunistic Bond Fund | 0.1% |
| MFS Emerging Markets Debt Local Currency Fund | 0.1% |
FUND EXPENSES
What were the fund costs for the last year?
| (based on a hypothetical $10,000 investment) | ||
| Class Name | Costs of a $10,000 investment ~ | Costs paid as a percentage of a $10,000 investment ~ |
| C | $112 | 1.00% |
˜ Expenses are direct expenses and do not include underlying fund fees and expenses.
MANAGEMENT'S DISCUSSION OF FUND PERFORMANCE
-
For the twelve months ended April 30, 2026, Class C shares of the MFS Lifetime 2050 Fund (fund) provided a total return of 23.44%, at net asset value. This compares with a return of 31.05% for the fund’s benchmark, the Standard & Poor's 500 Stock Index. The fund's other benchmark, the MFS Lifetime 2050 Fund Blended Index (Blended Index), generated a return of 27.95%. The Blended Index reflects the blended returns of broad asset class indices, with percentage allocations to each index designed to resemble the long term strategic allocations of the fund. The market indices and related percentage allocations used to compile the Blended Index are set forth in the Fund Performance.
-
Global equity markets reached record levels during the period, withstanding considerable volatility amid tariffs, geopolitical conflict and high levels of uncertainty. A new geopolitical event distressed markets at the end of the period as US and Israeli forces launched strikes against Iran, disrupting Mideast oil and natural gas exports. During the period, a pro-growth tax and spending bill was signed into law in the US, while in Europe, renewed focus on defense and infrastructure spending brightened the economic outlook. In Japan, the election of a pro-growth prime minister sent stocks to new highs prior to the conflict in Iran. Optimism over artificial intelligence remained high.
-
Considerable progress was made in trade talks between the US and many major trading partners, with a fragile truce between the US and China extended through late 2026. While the US Supreme Court struck down part of the Trump administration’s tariff strategy, the administration began deploying other authorities to largely replace the ones that were ruled unconstitutional.
-
Early in the period, moderating inflation pressures allowed many global central banks to ease monetary policy. Amid a difficult policymaking environment and slower job growth, the Federal Reserve resumed easing policy in September and delivered quarter-point rate cuts in October and December before pausing.
-
In fixed income markets, previously range-bound global bond yields spiked following the onset of the Middle East conflict, as energy-driven inflation fears appeared to have rattled bond investors. US rate volatility (as measured by the Merrill Lynch Option Volatility Estimate (MOVE) Index) similarly rose from intra-period lows, reflecting uncertainty around the scope and duration of the conflict and its implications for global growth. However, volatility later retracted as the risk of a broader regional military escalation appeared less likely. Global credit spreads widened only modestly before stabilizing near prior levels, supported by strong demand and resilient underlying fundamentals.
-
Top contributors to performance relative to the Blended Index:
-
The fund's international equity segment benefited relative performance, as the MFS Blended Research International Equity Fund outpaced its respective benchmark.
-
-
Top detractors from performance relative to the Blended Index:
-
Within the US equity segment, lagging relative performance across the majority of the strategies weighed on relative results as the funds generally underperformed their respective benchmarks. Style selection also held back relative performance as mid-cap growth and mid-cap core strategies underperformed the broader index.
-
FUND PERFORMANCE
The fund’s past performance is not a good predictor of the fund’s future performance. The graph and table below do not reflect the deduction of taxes that a shareholder would pay on fund distributions or the redemption of fund shares. The graph and table below assume reinvestment of dividends and capital gain distributions.
Growth of a Hypothetical $10,000 Investment
This graph shows the performance of a hypothetical $10,000 investment in Class C over a ten year period or since inception, if shorter, in comparison to (i) a broad measure of market performance and (ii) an additional index that MFS believes more closely reflects the market segments in which the fund invests.

Average Annual Total Returns through 4/30/26
This table shows the average annual total returns of the class of shares noted for the periods shown, both with (if any) and without sales charges. It also shows the average annual total returns of (i) a broad measure of market performance and (ii) an additional index that MFS believes more closely reflects the market segments in which the fund invests, over the same periods.
| Share Class | 1-yr | 5-yr | 10-yr |
| C without sales charge | 23.44% | 7.59% | 9.96% |
| C with CDSC (1% for 12 months)× | 22.44% | 7.59% | 9.96% |
| Comparative Benchmark(s) | |||
| Standard & Poor's 500 Stock Index ∆ | 31.05% | 13.14% | 15.26% |
| MFS Lifetime 2050 Fund Blended Index ∆ | 27.95% | 10.92% | 11.95% |
|
∆
|
Source: FactSet Research Systems Inc.
|
|
×
|
Assuming redemption at the end of the applicable period.
|
Visit mfs.com/perf/c for more recent performance information.
FUND STATISTICS AS OF 4/30/26
| Net Assets ($): | 619,835,238 | Total Management Fee ($)#: | 0 | |
| Total Number of Holdings: | 28 | Portfolio Turnover Rate (%): | 7 |
# The fund itself does not pay a management fee but the underlying funds in which the fund invests do pay management fees to MFS.
PORTFOLIO COMPOSITION (BASED ON TOTAL INVESTMENTS AS OF 4/30/26)
Portfolio allocation
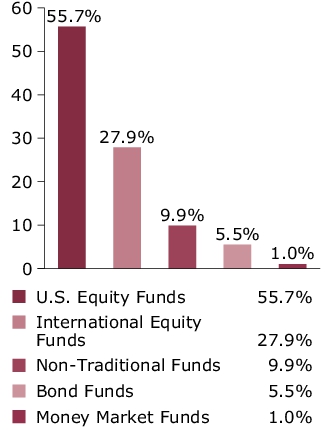
Portfolio holdings
| MFS Blended Research International Equity Fund | 11.0% |
| MFS Blended Research Mid Cap Equity Fund | 10.0% |
| MFS Blended Research Value Equity Fund | 5.5% |
| MFS Value Fund | 5.4% |
| MFS Growth Fund | 5.3% |
| MFS Blended Research Growth Equity Fund | 5.2% |
| MFS Mid Cap Growth Fund | 5.0% |
| MFS Global Real Estate Fund | 5.0% |
| MFS Commodity Strategy Fund | 4.9% |
| MFS Mid Cap Value Fund | 4.9% |
| MFS Blended Research Core Equity Fund | 4.7% |
| MFS Research Fund | 4.7% |
| MFS Research International Fund | 4.0% |
| MFS International New Discovery Fund | 4.0% |
| MFS International Intrinsic Equity Fund | 3.5% |
| MFS International Growth Fund | 3.4% |
| MFS Blended Research Small Cap Equity Fund | 2.5% |
| MFS Inflation-Adjusted Bond Fund | 2.5% |
| MFS Total Return Bond Fund | 2.4% |
| MFS New Discovery Fund | 1.3% |
| MFS New Discovery Value Fund | 1.2% |
| MFS Blended Research Emerging Markets Equity Fund | 1.0% |
| MFS Emerging Markets Equity Fund | 1.0% |
| MFS Institutional Money Market Portfolio | 1.0% |
| MFS High Income Fund | 0.2% |
| MFS Emerging Markets Debt Fund | 0.2% |
| MFS Global Opportunistic Bond Fund | 0.1% |
| MFS Emerging Markets Debt Local Currency Fund | 0.1% |
FUND EXPENSES
What were the fund costs for the last year?
| (based on a hypothetical $10,000 investment) | ||
| Class Name | Costs of a $10,000 investment ~ | Costs paid as a percentage of a $10,000 investment ~ |
| I | $0 | 0.00% |
˜ Expenses are direct expenses and do not include underlying fund fees and expenses.
MANAGEMENT'S DISCUSSION OF FUND PERFORMANCE
-
For the twelve months ended April 30, 2026, Class I shares of the MFS Lifetime 2050 Fund (fund) provided a total return of 24.65%, at net asset value. This compares with a return of 31.05% for the fund’s benchmark, the Standard & Poor's 500 Stock Index. The fund's other benchmark, the MFS Lifetime 2050 Fund Blended Index (Blended Index), generated a return of 27.95%. The Blended Index reflects the blended returns of broad asset class indices, with percentage allocations to each index designed to resemble the long term strategic allocations of the fund. The market indices and related percentage allocations used to compile the Blended Index are set forth in the Fund Performance.
-
Global equity markets reached record levels during the period, withstanding considerable volatility amid tariffs, geopolitical conflict and high levels of uncertainty. A new geopolitical event distressed markets at the end of the period as US and Israeli forces launched strikes against Iran, disrupting Mideast oil and natural gas exports. During the period, a pro-growth tax and spending bill was signed into law in the US, while in Europe, renewed focus on defense and infrastructure spending brightened the economic outlook. In Japan, the election of a pro-growth prime minister sent stocks to new highs prior to the conflict in Iran. Optimism over artificial intelligence remained high.
-
Considerable progress was made in trade talks between the US and many major trading partners, with a fragile truce between the US and China extended through late 2026. While the US Supreme Court struck down part of the Trump administration’s tariff strategy, the administration began deploying other authorities to largely replace the ones that were ruled unconstitutional.
-
Early in the period, moderating inflation pressures allowed many global central banks to ease monetary policy. Amid a difficult policymaking environment and slower job growth, the Federal Reserve resumed easing policy in September and delivered quarter-point rate cuts in October and December before pausing.
-
In fixed income markets, previously range-bound global bond yields spiked following the onset of the Middle East conflict, as energy-driven inflation fears appeared to have rattled bond investors. US rate volatility (as measured by the Merrill Lynch Option Volatility Estimate (MOVE) Index) similarly rose from intra-period lows, reflecting uncertainty around the scope and duration of the conflict and its implications for global growth. However, volatility later retracted as the risk of a broader regional military escalation appeared less likely. Global credit spreads widened only modestly before stabilizing near prior levels, supported by strong demand and resilient underlying fundamentals.
-
Top contributors to performance relative to the Blended Index:
-
The fund's international equity segment benefited relative performance, as the MFS Blended Research International Equity Fund outpaced its respective benchmark.
-
-
Top detractors from performance relative to the Blended Index:
-
Within the US equity segment, lagging relative performance across the majority of the strategies weighed on relative results as the funds generally underperformed their respective benchmarks. Style selection also held back relative performance as mid-cap growth and mid-cap core strategies underperformed the broader index.
-
FUND PERFORMANCE
The fund’s past performance is not a good predictor of the fund’s future performance. The graph and table below do not reflect the deduction of taxes that a shareholder would pay on fund distributions or the redemption of fund shares. The graph and table below assume reinvestment of dividends and capital gain distributions.
Growth of a Hypothetical $10,000 Investment
This graph shows the performance of a hypothetical $10,000 investment in Class I over a ten year period or since inception, if shorter, in comparison to (i) a broad measure of market performance and (ii) an additional index that MFS believes more closely reflects the market segments in which the fund invests.

Average Annual Total Returns through 4/30/26
This table shows the average annual total returns of the class of shares noted for the periods shown, both with (if any) and without sales charges. It also shows the average annual total returns of (i) a broad measure of market performance and (ii) an additional index that MFS believes more closely reflects the market segments in which the fund invests, over the same periods.
| Share Class | 1-yr | 5-yr | 10-yr |
| I without sales charge | 24.65% | 8.68% | 11.06% |
| Comparative Benchmark(s) | |||
| Standard & Poor's 500 Stock Index ∆ | 31.05% | 13.14% | 15.26% |
| MFS Lifetime 2050 Fund Blended Index ∆ | 27.95% | 10.92% | 11.95% |
|
∆
|
Source: FactSet Research Systems Inc.
|
Visit mfs.com/perf/i for more recent performance information.
FUND STATISTICS AS OF 4/30/26
| Net Assets ($): | 619,835,238 | Total Management Fee ($)#: | 0 | |
| Total Number of Holdings: | 28 | Portfolio Turnover Rate (%): | 7 |
# The fund itself does not pay a management fee but the underlying funds in which the fund invests do pay management fees to MFS.
PORTFOLIO COMPOSITION (BASED ON TOTAL INVESTMENTS AS OF 4/30/26)
Portfolio allocation

Portfolio holdings
| MFS Blended Research International Equity Fund | 11.0% |
| MFS Blended Research Mid Cap Equity Fund | 10.0% |
| MFS Blended Research Value Equity Fund | 5.5% |
| MFS Value Fund | 5.4% |
| MFS Growth Fund | 5.3% |
| MFS Blended Research Growth Equity Fund | 5.2% |
| MFS Mid Cap Growth Fund | 5.0% |
| MFS Global Real Estate Fund | 5.0% |
| MFS Commodity Strategy Fund | 4.9% |
| MFS Mid Cap Value Fund | 4.9% |
| MFS Blended Research Core Equity Fund | 4.7% |
| MFS Research Fund | 4.7% |
| MFS Research International Fund | 4.0% |
| MFS International New Discovery Fund | 4.0% |
| MFS International Intrinsic Equity Fund | 3.5% |
| MFS International Growth Fund | 3.4% |
| MFS Blended Research Small Cap Equity Fund | 2.5% |
| MFS Inflation-Adjusted Bond Fund | 2.5% |
| MFS Total Return Bond Fund | 2.4% |
| MFS New Discovery Fund | 1.3% |
| MFS New Discovery Value Fund | 1.2% |
| MFS Blended Research Emerging Markets Equity Fund | 1.0% |
| MFS Emerging Markets Equity Fund | 1.0% |
| MFS Institutional Money Market Portfolio | 1.0% |
| MFS High Income Fund | 0.2% |
| MFS Emerging Markets Debt Fund | 0.2% |
| MFS Global Opportunistic Bond Fund | 0.1% |
| MFS Emerging Markets Debt Local Currency Fund | 0.1% |
FUND EXPENSES
What were the fund costs for the last year?
| (based on a hypothetical $10,000 investment) | ||
| Class Name | Costs of a $10,000 investment ~ | Costs paid as a percentage of a $10,000 investment ~ |
| R1 | $112 | 1.00% |
˜ Expenses are direct expenses and do not include underlying fund fees and expenses.
MANAGEMENT'S DISCUSSION OF FUND PERFORMANCE
-
For the twelve months ended April 30, 2026, Class R1 shares of the MFS Lifetime 2050 Fund (fund) provided a total return of 23.46%, at net asset value. This compares with a return of 31.05% for the fund’s benchmark, the Standard & Poor's 500 Stock Index. The fund's other benchmark, the MFS Lifetime 2050 Fund Blended Index (Blended Index), generated a return of 27.95%. The Blended Index reflects the blended returns of broad asset class indices, with percentage allocations to each index designed to resemble the long term strategic allocations of the fund. The market indices and related percentage allocations used to compile the Blended Index are set forth in the Fund Performance.
-
Global equity markets reached record levels during the period, withstanding considerable volatility amid tariffs, geopolitical conflict and high levels of uncertainty. A new geopolitical event distressed markets at the end of the period as US and Israeli forces launched strikes against Iran, disrupting Mideast oil and natural gas exports. During the period, a pro-growth tax and spending bill was signed into law in the US, while in Europe, renewed focus on defense and infrastructure spending brightened the economic outlook. In Japan, the election of a pro-growth prime minister sent stocks to new highs prior to the conflict in Iran. Optimism over artificial intelligence remained high.
-
Considerable progress was made in trade talks between the US and many major trading partners, with a fragile truce between the US and China extended through late 2026. While the US Supreme Court struck down part of the Trump administration’s tariff strategy, the administration began deploying other authorities to largely replace the ones that were ruled unconstitutional.
-
Early in the period, moderating inflation pressures allowed many global central banks to ease monetary policy. Amid a difficult policymaking environment and slower job growth, the Federal Reserve resumed easing policy in September and delivered quarter-point rate cuts in October and December before pausing.
-
In fixed income markets, previously range-bound global bond yields spiked following the onset of the Middle East conflict, as energy-driven inflation fears appeared to have rattled bond investors. US rate volatility (as measured by the Merrill Lynch Option Volatility Estimate (MOVE) Index) similarly rose from intra-period lows, reflecting uncertainty around the scope and duration of the conflict and its implications for global growth. However, volatility later retracted as the risk of a broader regional military escalation appeared less likely. Global credit spreads widened only modestly before stabilizing near prior levels, supported by strong demand and resilient underlying fundamentals.
-
Top contributors to performance relative to the Blended Index:
-
The fund's international equity segment benefited relative performance, as the MFS Blended Research International Equity Fund outpaced its respective benchmark.
-
-
Top detractors from performance relative to the Blended Index:
-
Within the US equity segment, lagging relative performance across the majority of the strategies weighed on relative results as the funds generally underperformed their respective benchmarks. Style selection also held back relative performance as mid-cap growth and mid-cap core strategies underperformed the broader index.
-
FUND PERFORMANCE
The fund’s past performance is not a good predictor of the fund’s future performance. The graph and table below do not reflect the deduction of taxes that a shareholder would pay on fund distributions or the redemption of fund shares. The graph and table below assume reinvestment of dividends and capital gain distributions.
Growth of a Hypothetical $10,000 Investment
This graph shows the performance of a hypothetical $10,000 investment in Class R1 over a ten year period or since inception, if shorter, in comparison to (i) a broad measure of market performance and (ii) an additional index that MFS believes more closely reflects the market segments in which the fund invests.

Average Annual Total Returns through 4/30/26
This table shows the average annual total returns of the class of shares noted for the periods shown, both with (if any) and without sales charges. It also shows the average annual total returns of (i) a broad measure of market performance and (ii) an additional index that MFS believes more closely reflects the market segments in which the fund invests, over the same periods.
| Share Class | 1-yr | 5-yr | 10-yr |
| R1 without sales charge | 23.46% | 7.60% | 9.96% |
| Comparative Benchmark(s) | |||
| Standard & Poor's 500 Stock Index ∆ | 31.05% | 13.14% | 15.26% |
| MFS Lifetime 2050 Fund Blended Index ∆ | 27.95% | 10.92% | 11.95% |
|
∆
|
Source: FactSet Research Systems Inc.
|
Visit mfs.com/perf/r1 for more recent performance information.
FUND STATISTICS AS OF 4/30/26
| Net Assets ($): | 619,835,238 | Total Management Fee ($)#: | 0 | |
| Total Number of Holdings: | 28 | Portfolio Turnover Rate (%): | 7 |
# The fund itself does not pay a management fee but the underlying funds in which the fund invests do pay management fees to MFS.
PORTFOLIO COMPOSITION (BASED ON TOTAL INVESTMENTS AS OF 4/30/26)
Portfolio allocation

Portfolio holdings
| MFS Blended Research International Equity Fund | 11.0% |
| MFS Blended Research Mid Cap Equity Fund | 10.0% |
| MFS Blended Research Value Equity Fund | 5.5% |
| MFS Value Fund | 5.4% |
| MFS Growth Fund | 5.3% |
| MFS Blended Research Growth Equity Fund | 5.2% |
| MFS Mid Cap Growth Fund | 5.0% |
| MFS Global Real Estate Fund | 5.0% |
| MFS Commodity Strategy Fund | 4.9% |
| MFS Mid Cap Value Fund | 4.9% |
| MFS Blended Research Core Equity Fund | 4.7% |
| MFS Research Fund | 4.7% |
| MFS Research International Fund | 4.0% |
| MFS International New Discovery Fund | 4.0% |
| MFS International Intrinsic Equity Fund | 3.5% |
| MFS International Growth Fund | 3.4% |
| MFS Blended Research Small Cap Equity Fund | 2.5% |
| MFS Inflation-Adjusted Bond Fund | 2.5% |
| MFS Total Return Bond Fund | 2.4% |
| MFS New Discovery Fund | 1.3% |
| MFS New Discovery Value Fund | 1.2% |
| MFS Blended Research Emerging Markets Equity Fund | 1.0% |
| MFS Emerging Markets Equity Fund | 1.0% |
| MFS Institutional Money Market Portfolio | 1.0% |
| MFS High Income Fund | 0.2% |
| MFS Emerging Markets Debt Fund | 0.2% |
| MFS Global Opportunistic Bond Fund | 0.1% |
| MFS Emerging Markets Debt Local Currency Fund | 0.1% |
FUND EXPENSES
What were the fund costs for the last year?
| (based on a hypothetical $10,000 investment) | ||
| Class Name | Costs of a $10,000 investment ~ | Costs paid as a percentage of a $10,000 investment ~ |
| R2 | $56 | 0.50% |
˜ Expenses are direct expenses and do not include underlying fund fees and expenses.
MANAGEMENT'S DISCUSSION OF FUND PERFORMANCE
-
For the twelve months ended April 30, 2026, Class R2 shares of the MFS Lifetime 2050 Fund (fund) provided a total return of 24.05%, at net asset value. This compares with a return of 31.05% for the fund’s benchmark, the Standard & Poor's 500 Stock Index. The fund's other benchmark, the MFS Lifetime 2050 Fund Blended Index (Blended Index), generated a return of 27.95%. The Blended Index reflects the blended returns of broad asset class indices, with percentage allocations to each index designed to resemble the long term strategic allocations of the fund. The market indices and related percentage allocations used to compile the Blended Index are set forth in the Fund Performance.
-
Global equity markets reached record levels during the period, withstanding considerable volatility amid tariffs, geopolitical conflict and high levels of uncertainty. A new geopolitical event distressed markets at the end of the period as US and Israeli forces launched strikes against Iran, disrupting Mideast oil and natural gas exports. During the period, a pro-growth tax and spending bill was signed into law in the US, while in Europe, renewed focus on defense and infrastructure spending brightened the economic outlook. In Japan, the election of a pro-growth prime minister sent stocks to new highs prior to the conflict in Iran. Optimism over artificial intelligence remained high.
-
Considerable progress was made in trade talks between the US and many major trading partners, with a fragile truce between the US and China extended through late 2026. While the US Supreme Court struck down part of the Trump administration’s tariff strategy, the administration began deploying other authorities to largely replace the ones that were ruled unconstitutional.
-
Early in the period, moderating inflation pressures allowed many global central banks to ease monetary policy. Amid a difficult policymaking environment and slower job growth, the Federal Reserve resumed easing policy in September and delivered quarter-point rate cuts in October and December before pausing.
-
In fixed income markets, previously range-bound global bond yields spiked following the onset of the Middle East conflict, as energy-driven inflation fears appeared to have rattled bond investors. US rate volatility (as measured by the Merrill Lynch Option Volatility Estimate (MOVE) Index) similarly rose from intra-period lows, reflecting uncertainty around the scope and duration of the conflict and its implications for global growth. However, volatility later retracted as the risk of a broader regional military escalation appeared less likely. Global credit spreads widened only modestly before stabilizing near prior levels, supported by strong demand and resilient underlying fundamentals.
-
Top contributors to performance relative to the Blended Index:
-
The fund's international equity segment benefited relative performance, as the MFS Blended Research International Equity Fund outpaced its respective benchmark.
-
-
Top detractors from performance relative to the Blended Index:
-
Within the US equity segment, lagging relative performance across the majority of the strategies weighed on relative results as the funds generally underperformed their respective benchmarks. Style selection also held back relative performance as mid-cap growth and mid-cap core strategies underperformed the broader index.
-
FUND PERFORMANCE
The fund’s past performance is not a good predictor of the fund’s future performance. The graph and table below do not reflect the deduction of taxes that a shareholder would pay on fund distributions or the redemption of fund shares. The graph and table below assume reinvestment of dividends and capital gain distributions.
Growth of a Hypothetical $10,000 Investment
This graph shows the performance of a hypothetical $10,000 investment in Class R2 over a ten year period or since inception, if shorter, in comparison to (i) a broad measure of market performance and (ii) an additional index that MFS believes more closely reflects the market segments in which the fund invests.
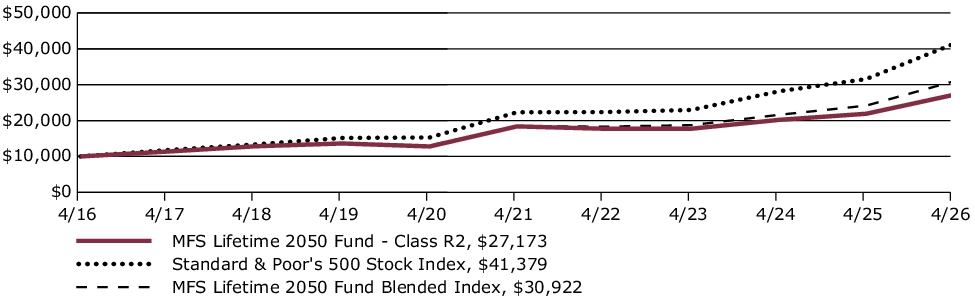
Average Annual Total Returns through 4/30/26
This table shows the average annual total returns of the class of shares noted for the periods shown, both with (if any) and without sales charges. It also shows the average annual total returns of (i) a broad measure of market performance and (ii) an additional index that MFS believes more closely reflects the market segments in which the fund invests, over the same periods.
| Share Class | 1-yr | 5-yr | 10-yr |
| R2 without sales charge | 24.05% | 8.13% | 10.51% |
| Comparative Benchmark(s) | |||
| Standard & Poor's 500 Stock Index ∆ | 31.05% | 13.14% | 15.26% |
| MFS Lifetime 2050 Fund Blended Index ∆ | 27.95% | 10.92% | 11.95% |
|
∆
|
Source: FactSet Research Systems Inc.
|
Visit mfs.com/perf/r2 for more recent performance information.
FUND STATISTICS AS OF 4/30/26
| Net Assets ($): | 619,835,238 | Total Management Fee ($)#: | 0 | |
| Total Number of Holdings: | 28 | Portfolio Turnover Rate (%): | 7 |
# The fund itself does not pay a management fee but the underlying funds in which the fund invests do pay management fees to MFS.
PORTFOLIO COMPOSITION (BASED ON TOTAL INVESTMENTS AS OF 4/30/26)
Portfolio allocation

Portfolio holdings
| MFS Blended Research International Equity Fund | 11.0% |
| MFS Blended Research Mid Cap Equity Fund | 10.0% |
| MFS Blended Research Value Equity Fund | 5.5% |
| MFS Value Fund | 5.4% |
| MFS Growth Fund | 5.3% |
| MFS Blended Research Growth Equity Fund | 5.2% |
| MFS Mid Cap Growth Fund | 5.0% |
| MFS Global Real Estate Fund | 5.0% |
| MFS Commodity Strategy Fund | 4.9% |
| MFS Mid Cap Value Fund | 4.9% |
| MFS Blended Research Core Equity Fund | 4.7% |
| MFS Research Fund | 4.7% |
| MFS Research International Fund | 4.0% |
| MFS International New Discovery Fund | 4.0% |
| MFS International Intrinsic Equity Fund | 3.5% |
| MFS International Growth Fund | 3.4% |
| MFS Blended Research Small Cap Equity Fund | 2.5% |
| MFS Inflation-Adjusted Bond Fund | 2.5% |
| MFS Total Return Bond Fund | 2.4% |
| MFS New Discovery Fund | 1.3% |
| MFS New Discovery Value Fund | 1.2% |
| MFS Blended Research Emerging Markets Equity Fund | 1.0% |
| MFS Emerging Markets Equity Fund | 1.0% |
| MFS Institutional Money Market Portfolio | 1.0% |
| MFS High Income Fund | 0.2% |
| MFS Emerging Markets Debt Fund | 0.2% |
| MFS Global Opportunistic Bond Fund | 0.1% |
| MFS Emerging Markets Debt Local Currency Fund | 0.1% |
FUND EXPENSES
What were the fund costs for the last year?
| (based on a hypothetical $10,000 investment) | ||
| Class Name | Costs of a $10,000 investment ~ | Costs paid as a percentage of a $10,000 investment ~ |
| R3 | $28 | 0.25% |
˜ Expenses are direct expenses and do not include underlying fund fees and expenses.
MANAGEMENT'S DISCUSSION OF FUND PERFORMANCE
-
For the twelve months ended April 30, 2026, Class R3 shares of the MFS Lifetime 2050 Fund (fund) provided a total return of 24.34%, at net asset value. This compares with a return of 31.05% for the fund’s benchmark, the Standard & Poor's 500 Stock Index. The fund's other benchmark, the MFS Lifetime 2050 Fund Blended Index (Blended Index), generated a return of 27.95%. The Blended Index reflects the blended returns of broad asset class indices, with percentage allocations to each index designed to resemble the long term strategic allocations of the fund. The market indices and related percentage allocations used to compile the Blended Index are set forth in the Fund Performance.
-
Global equity markets reached record levels during the period, withstanding considerable volatility amid tariffs, geopolitical conflict and high levels of uncertainty. A new geopolitical event distressed markets at the end of the period as US and Israeli forces launched strikes against Iran, disrupting Mideast oil and natural gas exports. During the period, a pro-growth tax and spending bill was signed into law in the US, while in Europe, renewed focus on defense and infrastructure spending brightened the economic outlook. In Japan, the election of a pro-growth prime minister sent stocks to new highs prior to the conflict in Iran. Optimism over artificial intelligence remained high.
-
Considerable progress was made in trade talks between the US and many major trading partners, with a fragile truce between the US and China extended through late 2026. While the US Supreme Court struck down part of the Trump administration’s tariff strategy, the administration began deploying other authorities to largely replace the ones that were ruled unconstitutional.
-
Early in the period, moderating inflation pressures allowed many global central banks to ease monetary policy. Amid a difficult policymaking environment and slower job growth, the Federal Reserve resumed easing policy in September and delivered quarter-point rate cuts in October and December before pausing.
-
In fixed income markets, previously range-bound global bond yields spiked following the onset of the Middle East conflict, as energy-driven inflation fears appeared to have rattled bond investors. US rate volatility (as measured by the Merrill Lynch Option Volatility Estimate (MOVE) Index) similarly rose from intra-period lows, reflecting uncertainty around the scope and duration of the conflict and its implications for global growth. However, volatility later retracted as the risk of a broader regional military escalation appeared less likely. Global credit spreads widened only modestly before stabilizing near prior levels, supported by strong demand and resilient underlying fundamentals.
-
Top contributors to performance relative to the Blended Index:
-
The fund's international equity segment benefited relative performance, as the MFS Blended Research International Equity Fund outpaced its respective benchmark.
-
-
Top detractors from performance relative to the Blended Index:
-
Within the US equity segment, lagging relative performance across the majority of the strategies weighed on relative results as the funds generally underperformed their respective benchmarks. Style selection also held back relative performance as mid-cap growth and mid-cap core strategies underperformed the broader index.
-
FUND PERFORMANCE
The fund’s past performance is not a good predictor of the fund’s future performance. The graph and table below do not reflect the deduction of taxes that a shareholder would pay on fund distributions or the redemption of fund shares. The graph and table below assume reinvestment of dividends and capital gain distributions.
Growth of a Hypothetical $10,000 Investment
This graph shows the performance of a hypothetical $10,000 investment in Class R3 over a ten year period or since inception, if shorter, in comparison to (i) a broad measure of market performance and (ii) an additional index that MFS believes more closely reflects the market segments in which the fund invests.

Average Annual Total Returns through 4/30/26
This table shows the average annual total returns of the class of shares noted for the periods shown, both with (if any) and without sales charges. It also shows the average annual total returns of (i) a broad measure of market performance and (ii) an additional index that MFS believes more closely reflects the market segments in which the fund invests, over the same periods.
| Share Class | 1-yr | 5-yr | 10-yr |
| R3 without sales charge | 24.34% | 8.40% | 10.79% |
| Comparative Benchmark(s) | |||
| Standard & Poor's 500 Stock Index ∆ | 31.05% | 13.14% | 15.26% |
| MFS Lifetime 2050 Fund Blended Index ∆ | 27.95% | 10.92% | 11.95% |
|
∆
|
Source: FactSet Research Systems Inc.
|
Visit mfs.com/perf/r3 for more recent performance information.
FUND STATISTICS AS OF 4/30/26
| Net Assets ($): | 619,835,238 | Total Management Fee ($)#: | 0 | |
| Total Number of Holdings: | 28 | Portfolio Turnover Rate (%): | 7 |
# The fund itself does not pay a management fee but the underlying funds in which the fund invests do pay management fees to MFS.
PORTFOLIO COMPOSITION (BASED ON TOTAL INVESTMENTS AS OF 4/30/26)
Portfolio allocation

Portfolio holdings
| MFS Blended Research International Equity Fund | 11.0% |
| MFS Blended Research Mid Cap Equity Fund | 10.0% |
| MFS Blended Research Value Equity Fund | 5.5% |
| MFS Value Fund | 5.4% |
| MFS Growth Fund | 5.3% |
| MFS Blended Research Growth Equity Fund | 5.2% |
| MFS Mid Cap Growth Fund | 5.0% |
| MFS Global Real Estate Fund | 5.0% |
| MFS Commodity Strategy Fund | 4.9% |
| MFS Mid Cap Value Fund | 4.9% |
| MFS Blended Research Core Equity Fund | 4.7% |
| MFS Research Fund | 4.7% |
| MFS Research International Fund | 4.0% |
| MFS International New Discovery Fund | 4.0% |
| MFS International Intrinsic Equity Fund | 3.5% |
| MFS International Growth Fund | 3.4% |
| MFS Blended Research Small Cap Equity Fund | 2.5% |
| MFS Inflation-Adjusted Bond Fund | 2.5% |
| MFS Total Return Bond Fund | 2.4% |
| MFS New Discovery Fund | 1.3% |
| MFS New Discovery Value Fund | 1.2% |
| MFS Blended Research Emerging Markets Equity Fund | 1.0% |
| MFS Emerging Markets Equity Fund | 1.0% |
| MFS Institutional Money Market Portfolio | 1.0% |
| MFS High Income Fund | 0.2% |
| MFS Emerging Markets Debt Fund | 0.2% |
| MFS Global Opportunistic Bond Fund | 0.1% |
| MFS Emerging Markets Debt Local Currency Fund | 0.1% |
FUND EXPENSES
What were the fund costs for the last year?
| (based on a hypothetical $10,000 investment) | ||
| Class Name | Costs of a $10,000 investment ~ | Costs paid as a percentage of a $10,000 investment ~ |
| R4 | $0 | 0.00% |
˜ Expenses are direct expenses and do not include underlying fund fees and expenses.
MANAGEMENT'S DISCUSSION OF FUND PERFORMANCE
-
For the twelve months ended April 30, 2026, Class R4 shares of the MFS Lifetime 2050 Fund (fund) provided a total return of 24.68%, at net asset value. This compares with a return of 31.05% for the fund’s benchmark, the Standard & Poor's 500 Stock Index. The fund's other benchmark, the MFS Lifetime 2050 Fund Blended Index (Blended Index), generated a return of 27.95%. The Blended Index reflects the blended returns of broad asset class indices, with percentage allocations to each index designed to resemble the long term strategic allocations of the fund. The market indices and related percentage allocations used to compile the Blended Index are set forth in the Fund Performance.
-
Global equity markets reached record levels during the period, withstanding considerable volatility amid tariffs, geopolitical conflict and high levels of uncertainty. A new geopolitical event distressed markets at the end of the period as US and Israeli forces launched strikes against Iran, disrupting Mideast oil and natural gas exports. During the period, a pro-growth tax and spending bill was signed into law in the US, while in Europe, renewed focus on defense and infrastructure spending brightened the economic outlook. In Japan, the election of a pro-growth prime minister sent stocks to new highs prior to the conflict in Iran. Optimism over artificial intelligence remained high.
-
Considerable progress was made in trade talks between the US and many major trading partners, with a fragile truce between the US and China extended through late 2026. While the US Supreme Court struck down part of the Trump administration’s tariff strategy, the administration began deploying other authorities to largely replace the ones that were ruled unconstitutional.
-
Early in the period, moderating inflation pressures allowed many global central banks to ease monetary policy. Amid a difficult policymaking environment and slower job growth, the Federal Reserve resumed easing policy in September and delivered quarter-point rate cuts in October and December before pausing.
-
In fixed income markets, previously range-bound global bond yields spiked following the onset of the Middle East conflict, as energy-driven inflation fears appeared to have rattled bond investors. US rate volatility (as measured by the Merrill Lynch Option Volatility Estimate (MOVE) Index) similarly rose from intra-period lows, reflecting uncertainty around the scope and duration of the conflict and its implications for global growth. However, volatility later retracted as the risk of a broader regional military escalation appeared less likely. Global credit spreads widened only modestly before stabilizing near prior levels, supported by strong demand and resilient underlying fundamentals.
-
Top contributors to performance relative to the Blended Index:
-
The fund's international equity segment benefited relative performance, as the MFS Blended Research International Equity Fund outpaced its respective benchmark.
-
-
Top detractors from performance relative to the Blended Index:
-
Within the US equity segment, lagging relative performance across the majority of the strategies weighed on relative results as the funds generally underperformed their respective benchmarks. Style selection also held back relative performance as mid-cap growth and mid-cap core strategies underperformed the broader index.
-
FUND PERFORMANCE
The fund’s past performance is not a good predictor of the fund’s future performance. The graph and table below do not reflect the deduction of taxes that a shareholder would pay on fund distributions or the redemption of fund shares. The graph and table below assume reinvestment of dividends and capital gain distributions.
Growth of a Hypothetical $10,000 Investment
This graph shows the performance of a hypothetical $10,000 investment in Class R4 over a ten year period or since inception, if shorter, in comparison to (i) a broad measure of market performance and (ii) an additional index that MFS believes more closely reflects the market segments in which the fund invests.

Average Annual Total Returns through 4/30/26
This table shows the average annual total returns of the class of shares noted for the periods shown, both with (if any) and without sales charges. It also shows the average annual total returns of (i) a broad measure of market performance and (ii) an additional index that MFS believes more closely reflects the market segments in which the fund invests, over the same periods.
| Share Class | 1-yr | 5-yr | 10-yr |
| R4 without sales charge | 24.68% | 8.66% | 11.06% |
| Comparative Benchmark(s) | |||
| Standard & Poor's 500 Stock Index ∆ | 31.05% | 13.14% | 15.26% |
| MFS Lifetime 2050 Fund Blended Index ∆ | 27.95% | 10.92% | 11.95% |
|
∆
|
Source: FactSet Research Systems Inc.
|
Visit mfs.com/perf/r4 for more recent performance information.
FUND STATISTICS AS OF 4/30/26
| Net Assets ($): | 619,835,238 | Total Management Fee ($)#: | 0 | |
| Total Number of Holdings: | 28 | Portfolio Turnover Rate (%): | 7 |
# The fund itself does not pay a management fee but the underlying funds in which the fund invests do pay management fees to MFS.
PORTFOLIO COMPOSITION (BASED ON TOTAL INVESTMENTS AS OF 4/30/26)
Portfolio allocation

Portfolio holdings
| MFS Blended Research International Equity Fund | 11.0% |
| MFS Blended Research Mid Cap Equity Fund | 10.0% |
| MFS Blended Research Value Equity Fund | 5.5% |
| MFS Value Fund | 5.4% |
| MFS Growth Fund | 5.3% |
| MFS Blended Research Growth Equity Fund | 5.2% |
| MFS Mid Cap Growth Fund | 5.0% |
| MFS Global Real Estate Fund | 5.0% |
| MFS Commodity Strategy Fund | 4.9% |
| MFS Mid Cap Value Fund | 4.9% |
| MFS Blended Research Core Equity Fund | 4.7% |
| MFS Research Fund | 4.7% |
| MFS Research International Fund | 4.0% |
| MFS International New Discovery Fund | 4.0% |
| MFS International Intrinsic Equity Fund | 3.5% |
| MFS International Growth Fund | 3.4% |
| MFS Blended Research Small Cap Equity Fund | 2.5% |
| MFS Inflation-Adjusted Bond Fund | 2.5% |
| MFS Total Return Bond Fund | 2.4% |
| MFS New Discovery Fund | 1.3% |
| MFS New Discovery Value Fund | 1.2% |
| MFS Blended Research Emerging Markets Equity Fund | 1.0% |
| MFS Emerging Markets Equity Fund | 1.0% |
| MFS Institutional Money Market Portfolio | 1.0% |
| MFS High Income Fund | 0.2% |
| MFS Emerging Markets Debt Fund | 0.2% |
| MFS Global Opportunistic Bond Fund | 0.1% |
| MFS Emerging Markets Debt Local Currency Fund | 0.1% |
FUND EXPENSES
What were the fund costs for the last year?
| (based on a hypothetical $10,000 investment) | ||
| Class Name | Costs of a $10,000 investment ~ | Costs paid as a percentage of a $10,000 investment ~ |
| R3 | $27 | 0.25% |
˜ Expenses are direct expenses and do not include underlying fund fees and expenses.
MANAGEMENT'S DISCUSSION OF FUND PERFORMANCE
-
For the twelve months ended April 30, 2026, Class R3 shares of the MFS Lifetime 2035 Fund (fund) provided a total return of 17.01%, at net asset value. This compares with a return of 31.05% for the fund’s benchmark, the Standard & Poor's 500 Stock Index. The fund's other benchmark, the MFS Lifetime 2035 Fund Blended Index (Blended Index), generated a return of 19.08%. The Blended Index reflects the blended returns of broad asset class indices, with percentage allocations to each index designed to resemble the long term strategic allocations of the fund. The market indices and related percentage allocations used to compile the Blended Index are set forth in the Fund Performance.
-
Global equity markets reached record levels during the period, withstanding considerable volatility amid tariffs, geopolitical conflict and high levels of uncertainty. A new geopolitical event distressed markets at the end of the period as US and Israeli forces launched strikes against Iran, disrupting Mideast oil and natural gas exports. During the period, a pro-growth tax and spending bill was signed into law in the US, while in Europe, renewed focus on defense and infrastructure spending brightened the economic outlook. In Japan, the election of a pro-growth prime minister sent stocks to new highs prior to the conflict in Iran. Optimism over artificial intelligence remained high.
-
Considerable progress was made in trade talks between the US and many major trading partners, with a fragile truce between the US and China extended through late 2026. While the US Supreme Court struck down part of the Trump administration’s tariff strategy, the administration began deploying other authorities to largely replace the ones that were ruled unconstitutional.
-
Early in the period, moderating inflation pressures allowed many global central banks to ease monetary policy. Amid a difficult policymaking environment and slower job growth, the Federal Reserve resumed easing policy in September and delivered quarter-point rate cuts in October and December before pausing.
-
In fixed income markets, previously range-bound global bond yields spiked following the onset of the Middle East conflict, as energy-driven inflation fears appeared to have rattled bond investors. US rate volatility (as measured by the Merrill Lynch Option Volatility Estimate (MOVE) Index) similarly rose from intra-period lows, reflecting uncertainty around the scope and duration of the conflict and its implications for global growth. However, volatility later retracted as the risk of a broader regional military escalation appeared less likely. Global credit spreads widened only modestly before stabilizing near prior levels, supported by strong demand and resilient underlying fundamentals.
-
Top contributors to performance relative to the Blended Index:
-
The fund's fixed income segment was a primary contributor to relative performance, led by allocations to emerging markets debt and high yield credit.
-
The international equity segment also benefited the fund's relative performance, as the MFS Blended Research International Equity Fund outpaced its respective benchmark.
-
-
Top detractors from performance relative to the Blended Index:
-
Within the US equity segment, lagging relative performance across the majority of the strategies weighed on relative results as the funds generally underperformed their respective benchmarks. Style selection also held back relative performance as mid-cap growth and mid-cap core strategies underperformed the broader index.
-
FUND PERFORMANCE
The fund’s past performance is not a good predictor of the fund’s future performance. The graph and table below do not reflect the deduction of taxes that a shareholder would pay on fund distributions or the redemption of fund shares. The graph and table below assume reinvestment of dividends and capital gain distributions.
Growth of a Hypothetical $10,000 Investment
This graph shows the performance of a hypothetical $10,000 investment in Class R3 over a ten year period or since inception, if shorter, in comparison to (i) a broad measure of market performance and (ii) an additional index that MFS believes more closely reflects the market segments in which the fund invests.

Average Annual Total Returns through 4/30/26
This table shows the average annual total returns of the class of shares noted for the periods shown, both with (if any) and without sales charges. It also shows the average annual total returns of (i) a broad measure of market performance and (ii) an additional index that MFS believes more closely reflects the market segments in which the fund invests, over the same periods.
| Share Class | 1-yr | 5-yr | 10-yr |
| R3 without sales charge | 17.01% | 6.38% | 9.29% |
| Comparative Benchmark(s) | |||
| Standard & Poor's 500 Stock Index ∆ | 31.05% | 13.14% | 15.26% |
| MFS Lifetime 2035 Fund Blended Index ∆ | 19.08% | 7.83% | 9.90% |
|
∆
|
Source: FactSet Research Systems Inc.
|
Visit mfs.com/perf/r3 for more recent performance information.
FUND STATISTICS AS OF 4/30/26
| Net Assets ($): | 639,913,190 | Total Management Fee ($)#: | 0 | |
| Total Number of Holdings: | 28 | Portfolio Turnover Rate (%): | 11 |
# The fund itself does not pay a management fee but the underlying funds in which the fund invests do pay management fees to MFS.
PORTFOLIO COMPOSITION (BASED ON TOTAL INVESTMENTS AS OF 4/30/26)
Portfolio allocation

Portfolio holdings
| MFS Government Securities Fund | 9.8% |
| MFS Total Return Bond Fund | 9.4% |
| MFS Inflation-Adjusted Bond Fund | 7.2% |
| MFS Blended Research Mid Cap Equity Fund | 6.8% |
| MFS Blended Research International Equity Fund | 6.1% |
| MFS Global Opportunistic Bond Fund | 5.1% |
| MFS Blended Research Value Equity Fund | 4.0% |
| MFS High Income Fund | 3.9% |
| MFS Value Fund | 3.9% |
| MFS Growth Fund | 3.7% |
| MFS Blended Research Growth Equity Fund | 3.6% |
| MFS Blended Research Core Equity Fund | 3.6% |
| MFS Research Fund | 3.6% |
| MFS Mid Cap Growth Fund | 3.4% |
| MFS Mid Cap Value Fund | 3.4% |
| MFS Research International Fund | 3.0% |
| MFS Global Real Estate Fund | 3.0% |
| MFS Commodity Strategy Fund | 2.9% |
| MFS Emerging Markets Debt Fund | 2.8% |
| MFS Emerging Markets Debt Local Currency Fund | 1.9% |
| MFS International Intrinsic Equity Fund | 1.5% |
| MFS Blended Research Small Cap Equity Fund | 1.5% |
| MFS International Growth Fund | 1.5% |
| MFS Institutional Money Market Portfolio | 1.0% |
| MFS Limited Maturity Fund | 1.0% |
| MFS International New Discovery Fund | 0.9% |
| MFS New Discovery Fund | 0.8% |
| MFS New Discovery Value Fund | 0.7% |
FUND EXPENSES
What were the fund costs for the last year?
| (based on a hypothetical $10,000 investment) | ||
| Class Name | Costs of a $10,000 investment ~ | Costs paid as a percentage of a $10,000 investment ~ |
| R4 | $0 | 0.00% |
˜ Expenses are direct expenses and do not include underlying fund fees and expenses.
MANAGEMENT'S DISCUSSION OF FUND PERFORMANCE
-
For the twelve months ended April 30, 2026, Class R4 shares of the MFS Lifetime 2035 Fund (fund) provided a total return of 17.30%, at net asset value. This compares with a return of 31.05% for the fund’s benchmark, the Standard & Poor's 500 Stock Index. The fund's other benchmark, the MFS Lifetime 2035 Fund Blended Index (Blended Index), generated a return of 19.08%. The Blended Index reflects the blended returns of broad asset class indices, with percentage allocations to each index designed to resemble the long term strategic allocations of the fund. The market indices and related percentage allocations used to compile the Blended Index are set forth in the Fund Performance.
-
Global equity markets reached record levels during the period, withstanding considerable volatility amid tariffs, geopolitical conflict and high levels of uncertainty. A new geopolitical event distressed markets at the end of the period as US and Israeli forces launched strikes against Iran, disrupting Mideast oil and natural gas exports. During the period, a pro-growth tax and spending bill was signed into law in the US, while in Europe, renewed focus on defense and infrastructure spending brightened the economic outlook. In Japan, the election of a pro-growth prime minister sent stocks to new highs prior to the conflict in Iran. Optimism over artificial intelligence remained high.
-
Considerable progress was made in trade talks between the US and many major trading partners, with a fragile truce between the US and China extended through late 2026. While the US Supreme Court struck down part of the Trump administration’s tariff strategy, the administration began deploying other authorities to largely replace the ones that were ruled unconstitutional.
-
Early in the period, moderating inflation pressures allowed many global central banks to ease monetary policy. Amid a difficult policymaking environment and slower job growth, the Federal Reserve resumed easing policy in September and delivered quarter-point rate cuts in October and December before pausing.
-
In fixed income markets, previously range-bound global bond yields spiked following the onset of the Middle East conflict, as energy-driven inflation fears appeared to have rattled bond investors. US rate volatility (as measured by the Merrill Lynch Option Volatility Estimate (MOVE) Index) similarly rose from intra-period lows, reflecting uncertainty around the scope and duration of the conflict and its implications for global growth. However, volatility later retracted as the risk of a broader regional military escalation appeared less likely. Global credit spreads widened only modestly before stabilizing near prior levels, supported by strong demand and resilient underlying fundamentals.
-
Top contributors to performance relative to the Blended Index:
-
The fund's fixed income segment was a primary contributor to relative performance, led by allocations to emerging markets debt and high yield credit.
-
The international equity segment also benefited the fund's relative performance, as the MFS Blended Research International Equity Fund outpaced its respective benchmark.
-
-
Top detractors from performance relative to the Blended Index:
-
Within the US equity segment, lagging relative performance across the majority of the strategies weighed on relative results as the funds generally underperformed their respective benchmarks. Style selection also held back relative performance as mid-cap growth and mid-cap core strategies underperformed the broader index.
-
FUND PERFORMANCE
The fund’s past performance is not a good predictor of the fund’s future performance. The graph and table below do not reflect the deduction of taxes that a shareholder would pay on fund distributions or the redemption of fund shares. The graph and table below assume reinvestment of dividends and capital gain distributions.
Growth of a Hypothetical $10,000 Investment
This graph shows the performance of a hypothetical $10,000 investment in Class R4 over a ten year period or since inception, if shorter, in comparison to (i) a broad measure of market performance and (ii) an additional index that MFS believes more closely reflects the market segments in which the fund invests.
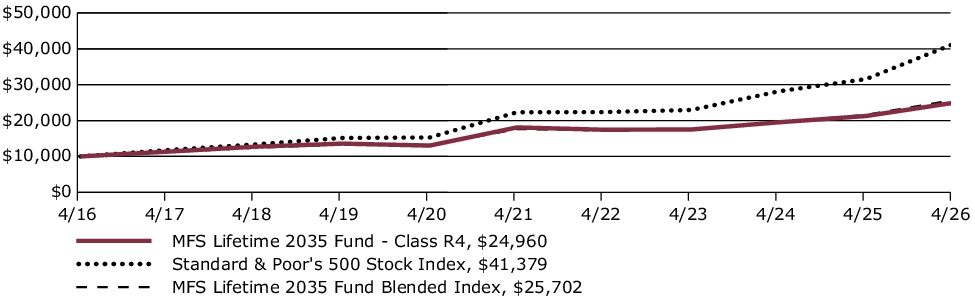
Average Annual Total Returns through 4/30/26
This table shows the average annual total returns of the class of shares noted for the periods shown, both with (if any) and without sales charges. It also shows the average annual total returns of (i) a broad measure of market performance and (ii) an additional index that MFS believes more closely reflects the market segments in which the fund invests, over the same periods.
| Share Class | 1-yr | 5-yr | 10-yr |
| R4 without sales charge | 17.30% | 6.65% | 9.58% |
| Comparative Benchmark(s) | |||
| Standard & Poor's 500 Stock Index ∆ | 31.05% | 13.14% | 15.26% |
| MFS Lifetime 2035 Fund Blended Index ∆ | 19.08% | 7.83% | 9.90% |
|
∆
|
Source: FactSet Research Systems Inc.
|
Visit mfs.com/perf/r4 for more recent performance information.
FUND STATISTICS AS OF 4/30/26
| Net Assets ($): | 639,913,190 | Total Management Fee ($)#: | 0 | |
| Total Number of Holdings: | 28 | Portfolio Turnover Rate (%): | 11 |
# The fund itself does not pay a management fee but the underlying funds in which the fund invests do pay management fees to MFS.
PORTFOLIO COMPOSITION (BASED ON TOTAL INVESTMENTS AS OF 4/30/26)
Portfolio allocation

Portfolio holdings
| MFS Government Securities Fund | 9.8% |
| MFS Total Return Bond Fund | 9.4% |
| MFS Inflation-Adjusted Bond Fund | 7.2% |
| MFS Blended Research Mid Cap Equity Fund | 6.8% |
| MFS Blended Research International Equity Fund | 6.1% |
| MFS Global Opportunistic Bond Fund | 5.1% |
| MFS Blended Research Value Equity Fund | 4.0% |
| MFS High Income Fund | 3.9% |
| MFS Value Fund | 3.9% |
| MFS Growth Fund | 3.7% |
| MFS Blended Research Growth Equity Fund | 3.6% |
| MFS Blended Research Core Equity Fund | 3.6% |
| MFS Research Fund | 3.6% |
| MFS Mid Cap Growth Fund | 3.4% |
| MFS Mid Cap Value Fund | 3.4% |
| MFS Research International Fund | 3.0% |
| MFS Global Real Estate Fund | 3.0% |
| MFS Commodity Strategy Fund | 2.9% |
| MFS Emerging Markets Debt Fund | 2.8% |
| MFS Emerging Markets Debt Local Currency Fund | 1.9% |
| MFS International Intrinsic Equity Fund | 1.5% |
| MFS Blended Research Small Cap Equity Fund | 1.5% |
| MFS International Growth Fund | 1.5% |
| MFS Institutional Money Market Portfolio | 1.0% |
| MFS Limited Maturity Fund | 1.0% |
| MFS International New Discovery Fund | 0.9% |
| MFS New Discovery Fund | 0.8% |
| MFS New Discovery Value Fund | 0.7% |
FUND EXPENSES
What were the fund costs for the last year?
| (based on a hypothetical $10,000 investment) | ||
| Class Name | Costs of a $10,000 investment ~ | Costs paid as a percentage of a $10,000 investment ~ |
| R6 | $0 | 0.00% |
˜ Expenses are direct expenses and do not include underlying fund fees and expenses.
MANAGEMENT'S DISCUSSION OF FUND PERFORMANCE
-
For the twelve months ended April 30, 2026, Class R6 shares of the MFS Lifetime 2035 Fund (fund) provided a total return of 17.45%, at net asset value. This compares with a return of 31.05% for the fund’s benchmark, the Standard & Poor's 500 Stock Index. The fund's other benchmark, the MFS Lifetime 2035 Fund Blended Index (Blended Index), generated a return of 19.08%. The Blended Index reflects the blended returns of broad asset class indices, with percentage allocations to each index designed to resemble the long term strategic allocations of the fund. The market indices and related percentage allocations used to compile the Blended Index are set forth in the Fund Performance.
-
Global equity markets reached record levels during the period, withstanding considerable volatility amid tariffs, geopolitical conflict and high levels of uncertainty. A new geopolitical event distressed markets at the end of the period as US and Israeli forces launched strikes against Iran, disrupting Mideast oil and natural gas exports. During the period, a pro-growth tax and spending bill was signed into law in the US, while in Europe, renewed focus on defense and infrastructure spending brightened the economic outlook. In Japan, the election of a pro-growth prime minister sent stocks to new highs prior to the conflict in Iran. Optimism over artificial intelligence remained high.
-
Considerable progress was made in trade talks between the US and many major trading partners, with a fragile truce between the US and China extended through late 2026. While the US Supreme Court struck down part of the Trump administration’s tariff strategy, the administration began deploying other authorities to largely replace the ones that were ruled unconstitutional.
-
Early in the period, moderating inflation pressures allowed many global central banks to ease monetary policy. Amid a difficult policymaking environment and slower job growth, the Federal Reserve resumed easing policy in September and delivered quarter-point rate cuts in October and December before pausing.
-
In fixed income markets, previously range-bound global bond yields spiked following the onset of the Middle East conflict, as energy-driven inflation fears appeared to have rattled bond investors. US rate volatility (as measured by the Merrill Lynch Option Volatility Estimate (MOVE) Index) similarly rose from intra-period lows, reflecting uncertainty around the scope and duration of the conflict and its implications for global growth. However, volatility later retracted as the risk of a broader regional military escalation appeared less likely. Global credit spreads widened only modestly before stabilizing near prior levels, supported by strong demand and resilient underlying fundamentals.
-
Top contributors to performance relative to the Blended Index:
-
The fund's fixed income segment was a primary contributor to relative performance, led by allocations to emerging markets debt and high yield credit.
-
The international equity segment also benefited the fund's relative performance, as the MFS Blended Research International Equity Fund outpaced its respective benchmark.
-
-
Top detractors from performance relative to the Blended Index:
-
Within the US equity segment, lagging relative performance across the majority of the strategies weighed on relative results as the funds generally underperformed their respective benchmarks. Style selection also held back relative performance as mid-cap growth and mid-cap core strategies underperformed the broader index.
-
FUND PERFORMANCE
The fund’s past performance is not a good predictor of the fund’s future performance. The graph and table below do not reflect the deduction of taxes that a shareholder would pay on fund distributions or the redemption of fund shares. The graph and table below assume reinvestment of dividends and capital gain distributions.
Growth of a Hypothetical $10,000 Investment*
This graph shows the performance of a hypothetical $10,000 investment in Class R6 over a ten year period or since inception, if shorter, in comparison to (i) a broad measure of market performance and (ii) an additional index that MFS believes more closely reflects the market segments in which the fund invests.

Average Annual Total Returns through 4/30/26
This table shows the average annual total returns of the class of shares noted for the periods shown, both with (if any) and without sales charges. It also shows the average annual total returns of (i) a broad measure of market performance and (ii) an additional index that MFS believes more closely reflects the market segments in which the fund invests, over the same periods.
| Share Class | 1-yr | 5-yr | Life* |
| R6 without sales charge | 17.45% | 6.80% | 9.49% |
| Comparative Benchmark(s) | |||
| Standard & Poor's 500 Stock Index ∆ | 31.05% | 13.14% | 15.13% |
| MFS Lifetime 2035 Fund Blended Index ∆ | 19.08% | 7.83% | 9.79% |
|
*
|
For the period from the commencement of the class's investment operations, August 29, 2016 through April 30, 2026.
|
|
∆
|
Source: FactSet Research Systems Inc.
|
Visit mfs.com/perf/r6 for more recent performance information.
FUND STATISTICS AS OF 4/30/26
| Net Assets ($): | 639,913,190 | Total Management Fee ($)#: | 0 | |
| Total Number of Holdings: | 28 | Portfolio Turnover Rate (%): | 11 |
# The fund itself does not pay a management fee but the underlying funds in which the fund invests do pay management fees to MFS.
PORTFOLIO COMPOSITION (BASED ON TOTAL INVESTMENTS AS OF 4/30/26)
Portfolio allocation
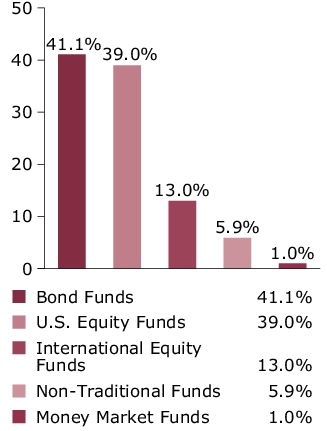
Portfolio holdings
| MFS Government Securities Fund | 9.8% |
| MFS Total Return Bond Fund | 9.4% |
| MFS Inflation-Adjusted Bond Fund | 7.2% |
| MFS Blended Research Mid Cap Equity Fund | 6.8% |
| MFS Blended Research International Equity Fund | 6.1% |
| MFS Global Opportunistic Bond Fund | 5.1% |
| MFS Blended Research Value Equity Fund | 4.0% |
| MFS High Income Fund | 3.9% |
| MFS Value Fund | 3.9% |
| MFS Growth Fund | 3.7% |
| MFS Blended Research Growth Equity Fund | 3.6% |
| MFS Blended Research Core Equity Fund | 3.6% |
| MFS Research Fund | 3.6% |
| MFS Mid Cap Growth Fund | 3.4% |
| MFS Mid Cap Value Fund | 3.4% |
| MFS Research International Fund | 3.0% |
| MFS Global Real Estate Fund | 3.0% |
| MFS Commodity Strategy Fund | 2.9% |
| MFS Emerging Markets Debt Fund | 2.8% |
| MFS Emerging Markets Debt Local Currency Fund | 1.9% |
| MFS International Intrinsic Equity Fund | 1.5% |
| MFS Blended Research Small Cap Equity Fund | 1.5% |
| MFS International Growth Fund | 1.5% |
| MFS Institutional Money Market Portfolio | 1.0% |
| MFS Limited Maturity Fund | 1.0% |
| MFS International New Discovery Fund | 0.9% |
| MFS New Discovery Fund | 0.8% |
| MFS New Discovery Value Fund | 0.7% |
FUND EXPENSES
What were the fund costs for the last year?
| (based on a hypothetical $10,000 investment) | ||
| Class Name | Costs of a $10,000 investment ~ | Costs paid as a percentage of a $10,000 investment ~ |
| A | $28 | 0.25% |
˜ Expenses are direct expenses and do not include underlying fund fees and expenses.
MANAGEMENT'S DISCUSSION OF FUND PERFORMANCE
-
For the twelve months ended April 30, 2026, Class A shares of the MFS Lifetime 2045 Fund (fund) provided a total return of 23.03%, at net asset value. This compares with a return of 31.05% for the fund’s benchmark, the Standard & Poor's 500 Stock Index. The fund's other benchmark, the MFS Lifetime 2045 Fund Blended Index (Blended Index), generated a return of 26.11%. The Blended Index reflects the blended returns of broad asset class indices, with percentage allocations to each index designed to resemble the long term strategic allocations of the fund. The market indices and related percentage allocations used to compile the Blended Index are set forth in the Fund Performance.
-
Global equity markets reached record levels during the period, withstanding considerable volatility amid tariffs, geopolitical conflict and high levels of uncertainty. A new geopolitical event distressed markets at the end of the period as US and Israeli forces launched strikes against Iran, disrupting Mideast oil and natural gas exports. During the period, a pro-growth tax and spending bill was signed into law in the US, while in Europe, renewed focus on defense and infrastructure spending brightened the economic outlook. In Japan, the election of a pro-growth prime minister sent stocks to new highs prior to the conflict in Iran. Optimism over artificial intelligence remained high.
-
Considerable progress was made in trade talks between the US and many major trading partners, with a fragile truce between the US and China extended through late 2026. While the US Supreme Court struck down part of the Trump administration’s tariff strategy, the administration began deploying other authorities to largely replace the ones that were ruled unconstitutional.
-
Early in the period, moderating inflation pressures allowed many global central banks to ease monetary policy. Amid a difficult policymaking environment and slower job growth, the Federal Reserve resumed easing policy in September and delivered quarter-point rate cuts in October and December before pausing.
-
In fixed income markets, previously range-bound global bond yields spiked following the onset of the Middle East conflict, as energy-driven inflation fears appeared to have rattled bond investors. US rate volatility (as measured by the Merrill Lynch Option Volatility Estimate (MOVE) Index) similarly rose from intra-period lows, reflecting uncertainty around the scope and duration of the conflict and its implications for global growth. However, volatility later retracted as the risk of a broader regional military escalation appeared less likely. Global credit spreads widened only modestly before stabilizing near prior levels, supported by strong demand and resilient underlying fundamentals.
-
Top contributors to performance relative to the Blended Index:
-
The fund's international equity segment benefited relative performance, as the MFS Blended Research International Equity Fund outpaced its respective benchmark.
-
The fund's fixed income segment also aided relative performance, led by allocations to emerging markets debt and high yield credit.
-
-
Top detractors from performance relative to the Blended Index:
-
Within the US equity segment, lagging relative performance across the majority of the strategies weighed on relative results as the funds generally underperformed their respective benchmarks. Style selection also held back relative performance as mid-cap growth and mid-cap core strategies underperformed the broader index.
-
FUND PERFORMANCE
The fund’s past performance is not a good predictor of the fund’s future performance. The graph and table below do not reflect the deduction of taxes that a shareholder would pay on fund distributions or the redemption of fund shares. The graph and table below assume reinvestment of dividends and capital gain distributions.
Growth of a Hypothetical $10,000 Investment
This graph shows the performance of a hypothetical $10,000 investment in Class A over a ten year period or since inception, if shorter, in comparison to (i) a broad measure of market performance and (ii) an additional index that MFS believes more closely reflects the market segments in which the fund invests. This graph includes the deduction of the maximum applicable sales charge.
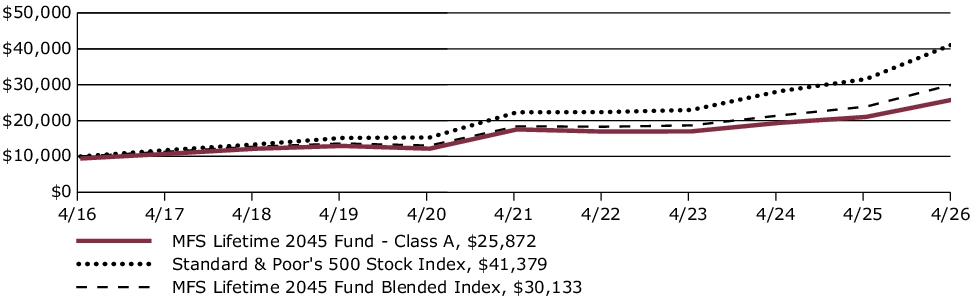
Average Annual Total Returns through 4/30/26
This table shows the average annual total returns of the class of shares noted for the periods shown, both with (if any) and without sales charges. It also shows the average annual total returns of (i) a broad measure of market performance and (ii) an additional index that MFS believes more closely reflects the market segments in which the fund invests, over the same periods.
| Share Class | 1-yr | 5-yr | 10-yr |
| A without sales charge | 23.03% | 8.09% | 10.63% |
| A with initial sales charge (5.75%) | 15.96% | 6.82% | 9.97% |
| Comparative Benchmark(s) | |||
| Standard & Poor's 500 Stock Index ∆ | 31.05% | 13.14% | 15.26% |
| MFS Lifetime 2045 Fund Blended Index ∆ | 26.11% | 10.36% | 11.66% |
|
∆
|
Source: FactSet Research Systems Inc.
|
Visit mfs.com/perf/a for more recent performance information.
FUND STATISTICS AS OF 4/30/26
| Net Assets ($): | 562,120,845 | Total Management Fee ($)#: | 0 | |
| Total Number of Holdings: | 28 | Portfolio Turnover Rate (%): | 8 |
# The fund itself does not pay a management fee but the underlying funds in which the fund invests do pay management fees to MFS.
PORTFOLIO COMPOSITION (BASED ON TOTAL INVESTMENTS AS OF 4/30/26)
Portfolio allocation

Portfolio holdings
| MFS Blended Research International Equity Fund | 9.8% |
| MFS Blended Research Mid Cap Equity Fund | 9.5% |
| MFS Blended Research Value Equity Fund | 5.2% |
| MFS Value Fund | 5.2% |
| MFS Growth Fund | 5.0% |
| MFS Blended Research Growth Equity Fund | 5.0% |
| MFS Mid Cap Growth Fund | 4.8% |
| MFS Blended Research Core Equity Fund | 4.7% |
| MFS Mid Cap Value Fund | 4.7% |
| MFS Research Fund | 4.7% |
| MFS Global Real Estate Fund | 4.5% |
| MFS Commodity Strategy Fund | 4.4% |
| MFS Research International Fund | 3.8% |
| MFS Inflation-Adjusted Bond Fund | 3.7% |
| MFS International Intrinsic Equity Fund | 3.0% |
| MFS International Growth Fund | 3.0% |
| MFS International New Discovery Fund | 2.9% |
| MFS Total Return Bond Fund | 2.7% |
| MFS Blended Research Small Cap Equity Fund | 2.3% |
| MFS High Income Fund | 2.1% |
| MFS Emerging Markets Debt Fund | 1.6% |
| MFS Global Opportunistic Bond Fund | 1.6% |
| MFS New Discovery Fund | 1.1% |
| MFS New Discovery Value Fund | 1.1% |
| MFS Emerging Markets Debt Local Currency Fund | 1.1% |
| MFS Institutional Money Market Portfolio | 1.0% |
| MFS Blended Research Emerging Markets Equity Fund | 0.8% |
| MFS Emerging Markets Equity Fund | 0.7% |
FUND EXPENSES
What were the fund costs for the last year?
| (based on a hypothetical $10,000 investment) | ||
| Class Name | Costs of a $10,000 investment ~ | Costs paid as a percentage of a $10,000 investment ~ |
| B | $111 | 1.00% |
˜ Expenses are direct expenses and do not include underlying fund fees and expenses.
MANAGEMENT'S DISCUSSION OF FUND PERFORMANCE
-
For the twelve months ended April 30, 2026, Class B shares of the MFS Lifetime 2045 Fund (fund) provided a total return of 22.12%, at net asset value. This compares with a return of 31.05% for the fund’s benchmark, the Standard & Poor's 500 Stock Index. The fund's other benchmark, the MFS Lifetime 2045 Fund Blended Index (Blended Index), generated a return of 26.11%. The Blended Index reflects the blended returns of broad asset class indices, with percentage allocations to each index designed to resemble the long term strategic allocations of the fund. The market indices and related percentage allocations used to compile the Blended Index are set forth in the Fund Performance.
-
Global equity markets reached record levels during the period, withstanding considerable volatility amid tariffs, geopolitical conflict and high levels of uncertainty. A new geopolitical event distressed markets at the end of the period as US and Israeli forces launched strikes against Iran, disrupting Mideast oil and natural gas exports. During the period, a pro-growth tax and spending bill was signed into law in the US, while in Europe, renewed focus on defense and infrastructure spending brightened the economic outlook. In Japan, the election of a pro-growth prime minister sent stocks to new highs prior to the conflict in Iran. Optimism over artificial intelligence remained high.
-
Considerable progress was made in trade talks between the US and many major trading partners, with a fragile truce between the US and China extended through late 2026. While the US Supreme Court struck down part of the Trump administration’s tariff strategy, the administration began deploying other authorities to largely replace the ones that were ruled unconstitutional.
-
Early in the period, moderating inflation pressures allowed many global central banks to ease monetary policy. Amid a difficult policymaking environment and slower job growth, the Federal Reserve resumed easing policy in September and delivered quarter-point rate cuts in October and December before pausing.
-
In fixed income markets, previously range-bound global bond yields spiked following the onset of the Middle East conflict, as energy-driven inflation fears appeared to have rattled bond investors. US rate volatility (as measured by the Merrill Lynch Option Volatility Estimate (MOVE) Index) similarly rose from intra-period lows, reflecting uncertainty around the scope and duration of the conflict and its implications for global growth. However, volatility later retracted as the risk of a broader regional military escalation appeared less likely. Global credit spreads widened only modestly before stabilizing near prior levels, supported by strong demand and resilient underlying fundamentals.
-
Top contributors to performance relative to the Blended Index:
-
The fund's international equity segment benefited relative performance, as the MFS Blended Research International Equity Fund outpaced its respective benchmark.
-
The fund's fixed income segment also aided relative performance, led by allocations to emerging markets debt and high yield credit.
-
-
Top detractors from performance relative to the Blended Index:
-
Within the US equity segment, lagging relative performance across the majority of the strategies weighed on relative results as the funds generally underperformed their respective benchmarks. Style selection also held back relative performance as mid-cap growth and mid-cap core strategies underperformed the broader index.
-
FUND PERFORMANCE
The fund’s past performance is not a good predictor of the fund’s future performance. The graph and table below do not reflect the deduction of taxes that a shareholder would pay on fund distributions or the redemption of fund shares. The graph and table below assume reinvestment of dividends and capital gain distributions.
Growth of a Hypothetical $10,000 Investment
This graph shows the performance of a hypothetical $10,000 investment in Class B over a ten year period or since inception, if shorter, in comparison to (i) a broad measure of market performance and (ii) an additional index that MFS believes more closely reflects the market segments in which the fund invests.

Average Annual Total Returns through 4/30/26
This table shows the average annual total returns of the class of shares noted for the periods shown, both with (if any) and without sales charges. It also shows the average annual total returns of (i) a broad measure of market performance and (ii) an additional index that MFS believes more closely reflects the market segments in which the fund invests, over the same periods.
| Share Class | 1-yr | 5-yr | 10-yr |
| B without sales charge | 22.12% | 7.29% | 9.80% |
| B with CDSC (declining over six years from 4% to 0%)× | 18.12% | 6.99% | 9.80% |
| Comparative Benchmark(s) | |||
| Standard & Poor's 500 Stock Index ∆ | 31.05% | 13.14% | 15.26% |
| MFS Lifetime 2045 Fund Blended Index ∆ | 26.11% | 10.36% | 11.66% |
|
∆
|
Source: FactSet Research Systems Inc.
|
|
×
|
Assuming redemption at the end of the applicable period.
|
Visit mfs.com/perf/b for more recent performance information.
FUND STATISTICS AS OF 4/30/26
| Net Assets ($): | 562,120,845 | Total Management Fee ($)#: | 0 | |
| Total Number of Holdings: | 28 | Portfolio Turnover Rate (%): | 8 |
# The fund itself does not pay a management fee but the underlying funds in which the fund invests do pay management fees to MFS.
PORTFOLIO COMPOSITION (BASED ON TOTAL INVESTMENTS AS OF 4/30/26)
Portfolio allocation

Portfolio holdings
| MFS Blended Research International Equity Fund | 9.8% |
| MFS Blended Research Mid Cap Equity Fund | 9.5% |
| MFS Blended Research Value Equity Fund | 5.2% |
| MFS Value Fund | 5.2% |
| MFS Growth Fund | 5.0% |
| MFS Blended Research Growth Equity Fund | 5.0% |
| MFS Mid Cap Growth Fund | 4.8% |
| MFS Blended Research Core Equity Fund | 4.7% |
| MFS Mid Cap Value Fund | 4.7% |
| MFS Research Fund | 4.7% |
| MFS Global Real Estate Fund | 4.5% |
| MFS Commodity Strategy Fund | 4.4% |
| MFS Research International Fund | 3.8% |
| MFS Inflation-Adjusted Bond Fund | 3.7% |
| MFS International Intrinsic Equity Fund | 3.0% |
| MFS International Growth Fund | 3.0% |
| MFS International New Discovery Fund | 2.9% |
| MFS Total Return Bond Fund | 2.7% |
| MFS Blended Research Small Cap Equity Fund | 2.3% |
| MFS High Income Fund | 2.1% |
| MFS Emerging Markets Debt Fund | 1.6% |
| MFS Global Opportunistic Bond Fund | 1.6% |
| MFS New Discovery Fund | 1.1% |
| MFS New Discovery Value Fund | 1.1% |
| MFS Emerging Markets Debt Local Currency Fund | 1.1% |
| MFS Institutional Money Market Portfolio | 1.0% |
| MFS Blended Research Emerging Markets Equity Fund | 0.8% |
| MFS Emerging Markets Equity Fund | 0.7% |
FUND EXPENSES
What were the fund costs for the last year?
| (based on a hypothetical $10,000 investment) | ||
| Class Name | Costs of a $10,000 investment ~ | Costs paid as a percentage of a $10,000 investment ~ |
| C | $111 | 1.00% |
˜ Expenses are direct expenses and do not include underlying fund fees and expenses.
MANAGEMENT'S DISCUSSION OF FUND PERFORMANCE
-
For the twelve months ended April 30, 2026, Class C shares of the MFS Lifetime 2045 Fund (fund) provided a total return of 22.07%, at net asset value. This compares with a return of 31.05% for the fund’s benchmark, the Standard & Poor's 500 Stock Index. The fund's other benchmark, the MFS Lifetime 2045 Fund Blended Index (Blended Index), generated a return of 26.11%. The Blended Index reflects the blended returns of broad asset class indices, with percentage allocations to each index designed to resemble the long term strategic allocations of the fund. The market indices and related percentage allocations used to compile the Blended Index are set forth in the Fund Performance.
-
Global equity markets reached record levels during the period, withstanding considerable volatility amid tariffs, geopolitical conflict and high levels of uncertainty. A new geopolitical event distressed markets at the end of the period as US and Israeli forces launched strikes against Iran, disrupting Mideast oil and natural gas exports. During the period, a pro-growth tax and spending bill was signed into law in the US, while in Europe, renewed focus on defense and infrastructure spending brightened the economic outlook. In Japan, the election of a pro-growth prime minister sent stocks to new highs prior to the conflict in Iran. Optimism over artificial intelligence remained high.
-
Considerable progress was made in trade talks between the US and many major trading partners, with a fragile truce between the US and China extended through late 2026. While the US Supreme Court struck down part of the Trump administration’s tariff strategy, the administration began deploying other authorities to largely replace the ones that were ruled unconstitutional.
-
Early in the period, moderating inflation pressures allowed many global central banks to ease monetary policy. Amid a difficult policymaking environment and slower job growth, the Federal Reserve resumed easing policy in September and delivered quarter-point rate cuts in October and December before pausing.
-
In fixed income markets, previously range-bound global bond yields spiked following the onset of the Middle East conflict, as energy-driven inflation fears appeared to have rattled bond investors. US rate volatility (as measured by the Merrill Lynch Option Volatility Estimate (MOVE) Index) similarly rose from intra-period lows, reflecting uncertainty around the scope and duration of the conflict and its implications for global growth. However, volatility later retracted as the risk of a broader regional military escalation appeared less likely. Global credit spreads widened only modestly before stabilizing near prior levels, supported by strong demand and resilient underlying fundamentals.
-
Top contributors to performance relative to the Blended Index:
-
The fund's international equity segment benefited relative performance, as the MFS Blended Research International Equity Fund outpaced its respective benchmark.
-
The fund's fixed income segment also aided relative performance, led by allocations to emerging markets debt and high yield credit.
-
-
Top detractors from performance relative to the Blended Index:
-
Within the US equity segment, lagging relative performance across the majority of the strategies weighed on relative results as the funds generally underperformed their respective benchmarks. Style selection also held back relative performance as mid-cap growth and mid-cap core strategies underperformed the broader index.
-
FUND PERFORMANCE
The fund’s past performance is not a good predictor of the fund’s future performance. The graph and table below do not reflect the deduction of taxes that a shareholder would pay on fund distributions or the redemption of fund shares. The graph and table below assume reinvestment of dividends and capital gain distributions.
Growth of a Hypothetical $10,000 Investment
This graph shows the performance of a hypothetical $10,000 investment in Class C over a ten year period or since inception, if shorter, in comparison to (i) a broad measure of market performance and (ii) an additional index that MFS believes more closely reflects the market segments in which the fund invests.

Average Annual Total Returns through 4/30/26
This table shows the average annual total returns of the class of shares noted for the periods shown, both with (if any) and without sales charges. It also shows the average annual total returns of (i) a broad measure of market performance and (ii) an additional index that MFS believes more closely reflects the market segments in which the fund invests, over the same periods.
| Share Class | 1-yr | 5-yr | 10-yr |
| C without sales charge | 22.07% | 7.28% | 9.79% |
| C with CDSC (1% for 12 months)× | 21.07% | 7.28% | 9.79% |
| Comparative Benchmark(s) | |||
| Standard & Poor's 500 Stock Index ∆ | 31.05% | 13.14% | 15.26% |
| MFS Lifetime 2045 Fund Blended Index ∆ | 26.11% | 10.36% | 11.66% |
|
∆
|
Source: FactSet Research Systems Inc.
|
|
×
|
Assuming redemption at the end of the applicable period.
|
Visit mfs.com/perf/c for more recent performance information.
FUND STATISTICS AS OF 4/30/26
| Net Assets ($): | 562,120,845 | Total Management Fee ($)#: | 0 | |
| Total Number of Holdings: | 28 | Portfolio Turnover Rate (%): | 8 |
# The fund itself does not pay a management fee but the underlying funds in which the fund invests do pay management fees to MFS.
PORTFOLIO COMPOSITION (BASED ON TOTAL INVESTMENTS AS OF 4/30/26)
Portfolio allocation

Portfolio holdings
| MFS Blended Research International Equity Fund | 9.8% |
| MFS Blended Research Mid Cap Equity Fund | 9.5% |
| MFS Blended Research Value Equity Fund | 5.2% |
| MFS Value Fund | 5.2% |
| MFS Growth Fund | 5.0% |
| MFS Blended Research Growth Equity Fund | 5.0% |
| MFS Mid Cap Growth Fund | 4.8% |
| MFS Blended Research Core Equity Fund | 4.7% |
| MFS Mid Cap Value Fund | 4.7% |
| MFS Research Fund | 4.7% |
| MFS Global Real Estate Fund | 4.5% |
| MFS Commodity Strategy Fund | 4.4% |
| MFS Research International Fund | 3.8% |
| MFS Inflation-Adjusted Bond Fund | 3.7% |
| MFS International Intrinsic Equity Fund | 3.0% |
| MFS International Growth Fund | 3.0% |
| MFS International New Discovery Fund | 2.9% |
| MFS Total Return Bond Fund | 2.7% |
| MFS Blended Research Small Cap Equity Fund | 2.3% |
| MFS High Income Fund | 2.1% |
| MFS Emerging Markets Debt Fund | 1.6% |
| MFS Global Opportunistic Bond Fund | 1.6% |
| MFS New Discovery Fund | 1.1% |
| MFS New Discovery Value Fund | 1.1% |
| MFS Emerging Markets Debt Local Currency Fund | 1.1% |
| MFS Institutional Money Market Portfolio | 1.0% |
| MFS Blended Research Emerging Markets Equity Fund | 0.8% |
| MFS Emerging Markets Equity Fund | 0.7% |
FUND EXPENSES
What were the fund costs for the last year?
| (based on a hypothetical $10,000 investment) | ||
| Class Name | Costs of a $10,000 investment ~ | Costs paid as a percentage of a $10,000 investment ~ |
| A | $27 | 0.25% |
˜ Expenses are direct expenses and do not include underlying fund fees and expenses.
MANAGEMENT'S DISCUSSION OF FUND PERFORMANCE
-
For the twelve months ended April 30, 2026, Class A shares of the MFS Lifetime 2035 Fund (fund) provided a total return of 17.02%, at net asset value. This compares with a return of 31.05% for the fund’s benchmark, the Standard & Poor's 500 Stock Index. The fund's other benchmark, the MFS Lifetime 2035 Fund Blended Index (Blended Index), generated a return of 19.08%. The Blended Index reflects the blended returns of broad asset class indices, with percentage allocations to each index designed to resemble the long term strategic allocations of the fund. The market indices and related percentage allocations used to compile the Blended Index are set forth in the Fund Performance.
-
Global equity markets reached record levels during the period, withstanding considerable volatility amid tariffs, geopolitical conflict and high levels of uncertainty. A new geopolitical event distressed markets at the end of the period as US and Israeli forces launched strikes against Iran, disrupting Mideast oil and natural gas exports. During the period, a pro-growth tax and spending bill was signed into law in the US, while in Europe, renewed focus on defense and infrastructure spending brightened the economic outlook. In Japan, the election of a pro-growth prime minister sent stocks to new highs prior to the conflict in Iran. Optimism over artificial intelligence remained high.
-
Considerable progress was made in trade talks between the US and many major trading partners, with a fragile truce between the US and China extended through late 2026. While the US Supreme Court struck down part of the Trump administration’s tariff strategy, the administration began deploying other authorities to largely replace the ones that were ruled unconstitutional.
-
Early in the period, moderating inflation pressures allowed many global central banks to ease monetary policy. Amid a difficult policymaking environment and slower job growth, the Federal Reserve resumed easing policy in September and delivered quarter-point rate cuts in October and December before pausing.
-
In fixed income markets, previously range-bound global bond yields spiked following the onset of the Middle East conflict, as energy-driven inflation fears appeared to have rattled bond investors. US rate volatility (as measured by the Merrill Lynch Option Volatility Estimate (MOVE) Index) similarly rose from intra-period lows, reflecting uncertainty around the scope and duration of the conflict and its implications for global growth. However, volatility later retracted as the risk of a broader regional military escalation appeared less likely. Global credit spreads widened only modestly before stabilizing near prior levels, supported by strong demand and resilient underlying fundamentals.
-
Top contributors to performance relative to the Blended Index:
-
The fund's fixed income segment was a primary contributor to relative performance, led by allocations to emerging markets debt and high yield credit.
-
The international equity segment also benefited the fund's relative performance, as the MFS Blended Research International Equity Fund outpaced its respective benchmark.
-
-
Top detractors from performance relative to the Blended Index:
-
Within the US equity segment, lagging relative performance across the majority of the strategies weighed on relative results as the funds generally underperformed their respective benchmarks. Style selection also held back relative performance as mid-cap growth and mid-cap core strategies underperformed the broader index.
-
FUND PERFORMANCE
The fund’s past performance is not a good predictor of the fund’s future performance. The graph and table below do not reflect the deduction of taxes that a shareholder would pay on fund distributions or the redemption of fund shares. The graph and table below assume reinvestment of dividends and capital gain distributions.
Growth of a Hypothetical $10,000 Investment
This graph shows the performance of a hypothetical $10,000 investment in Class A over a ten year period or since inception, if shorter, in comparison to (i) a broad measure of market performance and (ii) an additional index that MFS believes more closely reflects the market segments in which the fund invests. This graph includes the deduction of the maximum applicable sales charge.
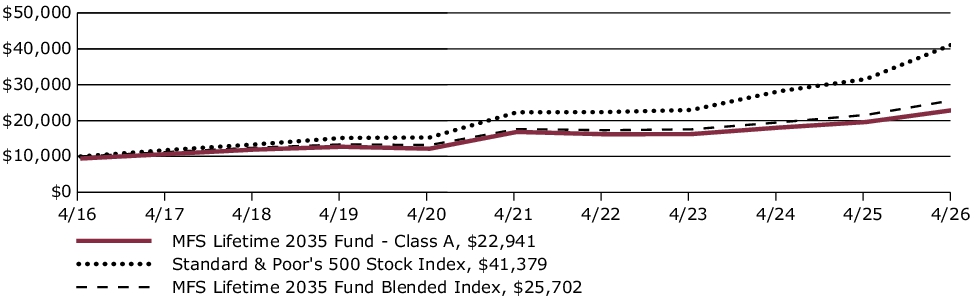
Average Annual Total Returns through 4/30/26
This table shows the average annual total returns of the class of shares noted for the periods shown, both with (if any) and without sales charges. It also shows the average annual total returns of (i) a broad measure of market performance and (ii) an additional index that MFS believes more closely reflects the market segments in which the fund invests, over the same periods.
| Share Class | 1-yr | 5-yr | 10-yr |
| A without sales charge | 17.02% | 6.38% | 9.30% |
| A with initial sales charge (5.75%) | 10.29% | 5.13% | 8.66% |
| Comparative Benchmark(s) | |||
| Standard & Poor's 500 Stock Index ∆ | 31.05% | 13.14% | 15.26% |
| MFS Lifetime 2035 Fund Blended Index ∆ | 19.08% | 7.83% | 9.90% |
|
∆
|
Source: FactSet Research Systems Inc.
|
Visit mfs.com/perf/a for more recent performance information.
FUND STATISTICS AS OF 4/30/26
| Net Assets ($): | 639,913,190 | Total Management Fee ($)#: | 0 | |
| Total Number of Holdings: | 28 | Portfolio Turnover Rate (%): | 11 |
# The fund itself does not pay a management fee but the underlying funds in which the fund invests do pay management fees to MFS.
PORTFOLIO COMPOSITION (BASED ON TOTAL INVESTMENTS AS OF 4/30/26)
Portfolio allocation

Portfolio holdings
| MFS Government Securities Fund | 9.8% |
| MFS Total Return Bond Fund | 9.4% |
| MFS Inflation-Adjusted Bond Fund | 7.2% |
| MFS Blended Research Mid Cap Equity Fund | 6.8% |
| MFS Blended Research International Equity Fund | 6.1% |
| MFS Global Opportunistic Bond Fund | 5.1% |
| MFS Blended Research Value Equity Fund | 4.0% |
| MFS High Income Fund | 3.9% |
| MFS Value Fund | 3.9% |
| MFS Growth Fund | 3.7% |
| MFS Blended Research Growth Equity Fund | 3.6% |
| MFS Blended Research Core Equity Fund | 3.6% |
| MFS Research Fund | 3.6% |
| MFS Mid Cap Growth Fund | 3.4% |
| MFS Mid Cap Value Fund | 3.4% |
| MFS Research International Fund | 3.0% |
| MFS Global Real Estate Fund | 3.0% |
| MFS Commodity Strategy Fund | 2.9% |
| MFS Emerging Markets Debt Fund | 2.8% |
| MFS Emerging Markets Debt Local Currency Fund | 1.9% |
| MFS International Intrinsic Equity Fund | 1.5% |
| MFS Blended Research Small Cap Equity Fund | 1.5% |
| MFS International Growth Fund | 1.5% |
| MFS Institutional Money Market Portfolio | 1.0% |
| MFS Limited Maturity Fund | 1.0% |
| MFS International New Discovery Fund | 0.9% |
| MFS New Discovery Fund | 0.8% |
| MFS New Discovery Value Fund | 0.7% |
FUND EXPENSES
What were the fund costs for the last year?
| (based on a hypothetical $10,000 investment) | ||
| Class Name | Costs of a $10,000 investment ~ | Costs paid as a percentage of a $10,000 investment ~ |
| B | $108 | 1.00% |
˜ Expenses are direct expenses and do not include underlying fund fees and expenses.
MANAGEMENT'S DISCUSSION OF FUND PERFORMANCE
-
For the twelve months ended April 30, 2026, Class B shares of the MFS Lifetime 2035 Fund (fund) provided a total return of 16.19%, at net asset value. This compares with a return of 31.05% for the fund’s benchmark, the Standard & Poor's 500 Stock Index. The fund's other benchmark, the MFS Lifetime 2035 Fund Blended Index (Blended Index), generated a return of 19.08%. The Blended Index reflects the blended returns of broad asset class indices, with percentage allocations to each index designed to resemble the long term strategic allocations of the fund. The market indices and related percentage allocations used to compile the Blended Index are set forth in the Fund Performance.
-
Global equity markets reached record levels during the period, withstanding considerable volatility amid tariffs, geopolitical conflict and high levels of uncertainty. A new geopolitical event distressed markets at the end of the period as US and Israeli forces launched strikes against Iran, disrupting Mideast oil and natural gas exports. During the period, a pro-growth tax and spending bill was signed into law in the US, while in Europe, renewed focus on defense and infrastructure spending brightened the economic outlook. In Japan, the election of a pro-growth prime minister sent stocks to new highs prior to the conflict in Iran. Optimism over artificial intelligence remained high.
-
Considerable progress was made in trade talks between the US and many major trading partners, with a fragile truce between the US and China extended through late 2026. While the US Supreme Court struck down part of the Trump administration’s tariff strategy, the administration began deploying other authorities to largely replace the ones that were ruled unconstitutional.
-
Early in the period, moderating inflation pressures allowed many global central banks to ease monetary policy. Amid a difficult policymaking environment and slower job growth, the Federal Reserve resumed easing policy in September and delivered quarter-point rate cuts in October and December before pausing.
-
In fixed income markets, previously range-bound global bond yields spiked following the onset of the Middle East conflict, as energy-driven inflation fears appeared to have rattled bond investors. US rate volatility (as measured by the Merrill Lynch Option Volatility Estimate (MOVE) Index) similarly rose from intra-period lows, reflecting uncertainty around the scope and duration of the conflict and its implications for global growth. However, volatility later retracted as the risk of a broader regional military escalation appeared less likely. Global credit spreads widened only modestly before stabilizing near prior levels, supported by strong demand and resilient underlying fundamentals.
-
Top contributors to performance relative to the Blended Index:
-
The fund's fixed income segment was a primary contributor to relative performance, led by allocations to emerging markets debt and high yield credit.
-
The international equity segment also benefited the fund's relative performance, as the MFS Blended Research International Equity Fund outpaced its respective benchmark.
-
-
Top detractors from performance relative to the Blended Index:
-
Within the US equity segment, lagging relative performance across the majority of the strategies weighed on relative results as the funds generally underperformed their respective benchmarks. Style selection also held back relative performance as mid-cap growth and mid-cap core strategies underperformed the broader index.
-
FUND PERFORMANCE
The fund’s past performance is not a good predictor of the fund’s future performance. The graph and table below do not reflect the deduction of taxes that a shareholder would pay on fund distributions or the redemption of fund shares. The graph and table below assume reinvestment of dividends and capital gain distributions.
Growth of a Hypothetical $10,000 Investment
This graph shows the performance of a hypothetical $10,000 investment in Class B over a ten year period or since inception, if shorter, in comparison to (i) a broad measure of market performance and (ii) an additional index that MFS believes more closely reflects the market segments in which the fund invests.
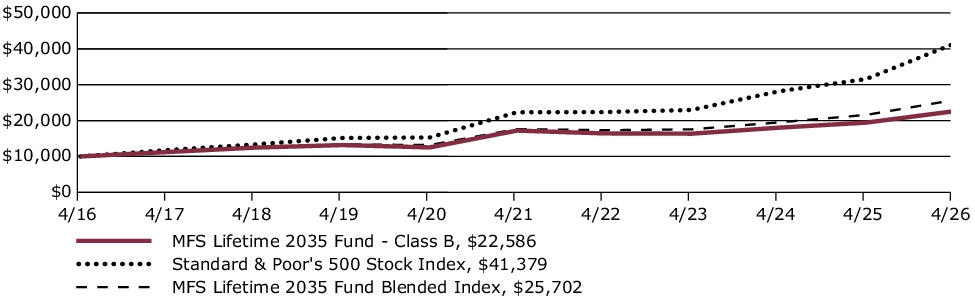
Average Annual Total Returns through 4/30/26
This table shows the average annual total returns of the class of shares noted for the periods shown, both with (if any) and without sales charges. It also shows the average annual total returns of (i) a broad measure of market performance and (ii) an additional index that MFS believes more closely reflects the market segments in which the fund invests, over the same periods.
| Share Class | 1-yr | 5-yr | 10-yr |
| B without sales charge | 16.19% | 5.59% | 8.49% |
| B with CDSC (declining over six years from 4% to 0%)× | 12.19% | 5.26% | 8.49% |
| Comparative Benchmark(s) | |||
| Standard & Poor's 500 Stock Index ∆ | 31.05% | 13.14% | 15.26% |
| MFS Lifetime 2035 Fund Blended Index ∆ | 19.08% | 7.83% | 9.90% |
|
∆
|
Source: FactSet Research Systems Inc.
|
|
×
|
Assuming redemption at the end of the applicable period.
|
Visit mfs.com/perf/b for more recent performance information.
FUND STATISTICS AS OF 4/30/26
| Net Assets ($): | 639,913,190 | Total Management Fee ($)#: | 0 | |
| Total Number of Holdings: | 28 | Portfolio Turnover Rate (%): | 11 |
# The fund itself does not pay a management fee but the underlying funds in which the fund invests do pay management fees to MFS.
PORTFOLIO COMPOSITION (BASED ON TOTAL INVESTMENTS AS OF 4/30/26)
Portfolio allocation

Portfolio holdings
| MFS Government Securities Fund | 9.8% |
| MFS Total Return Bond Fund | 9.4% |
| MFS Inflation-Adjusted Bond Fund | 7.2% |
| MFS Blended Research Mid Cap Equity Fund | 6.8% |
| MFS Blended Research International Equity Fund | 6.1% |
| MFS Global Opportunistic Bond Fund | 5.1% |
| MFS Blended Research Value Equity Fund | 4.0% |
| MFS High Income Fund | 3.9% |
| MFS Value Fund | 3.9% |
| MFS Growth Fund | 3.7% |
| MFS Blended Research Growth Equity Fund | 3.6% |
| MFS Blended Research Core Equity Fund | 3.6% |
| MFS Research Fund | 3.6% |
| MFS Mid Cap Growth Fund | 3.4% |
| MFS Mid Cap Value Fund | 3.4% |
| MFS Research International Fund | 3.0% |
| MFS Global Real Estate Fund | 3.0% |
| MFS Commodity Strategy Fund | 2.9% |
| MFS Emerging Markets Debt Fund | 2.8% |
| MFS Emerging Markets Debt Local Currency Fund | 1.9% |
| MFS International Intrinsic Equity Fund | 1.5% |
| MFS Blended Research Small Cap Equity Fund | 1.5% |
| MFS International Growth Fund | 1.5% |
| MFS Institutional Money Market Portfolio | 1.0% |
| MFS Limited Maturity Fund | 1.0% |
| MFS International New Discovery Fund | 0.9% |
| MFS New Discovery Fund | 0.8% |
| MFS New Discovery Value Fund | 0.7% |
FUND EXPENSES
What were the fund costs for the last year?
| (based on a hypothetical $10,000 investment) | ||
| Class Name | Costs of a $10,000 investment ~ | Costs paid as a percentage of a $10,000 investment ~ |
| C | $108 | 1.00% |
˜ Expenses are direct expenses and do not include underlying fund fees and expenses.
MANAGEMENT'S DISCUSSION OF FUND PERFORMANCE
-
For the twelve months ended April 30, 2026, Class C shares of the MFS Lifetime 2035 Fund (fund) provided a total return of 16.11%, at net asset value. This compares with a return of 31.05% for the fund’s benchmark, the Standard & Poor's 500 Stock Index. The fund's other benchmark, the MFS Lifetime 2035 Fund Blended Index (Blended Index), generated a return of 19.08%. The Blended Index reflects the blended returns of broad asset class indices, with percentage allocations to each index designed to resemble the long term strategic allocations of the fund. The market indices and related percentage allocations used to compile the Blended Index are set forth in the Fund Performance.
-
Global equity markets reached record levels during the period, withstanding considerable volatility amid tariffs, geopolitical conflict and high levels of uncertainty. A new geopolitical event distressed markets at the end of the period as US and Israeli forces launched strikes against Iran, disrupting Mideast oil and natural gas exports. During the period, a pro-growth tax and spending bill was signed into law in the US, while in Europe, renewed focus on defense and infrastructure spending brightened the economic outlook. In Japan, the election of a pro-growth prime minister sent stocks to new highs prior to the conflict in Iran. Optimism over artificial intelligence remained high.
-
Considerable progress was made in trade talks between the US and many major trading partners, with a fragile truce between the US and China extended through late 2026. While the US Supreme Court struck down part of the Trump administration’s tariff strategy, the administration began deploying other authorities to largely replace the ones that were ruled unconstitutional.
-
Early in the period, moderating inflation pressures allowed many global central banks to ease monetary policy. Amid a difficult policymaking environment and slower job growth, the Federal Reserve resumed easing policy in September and delivered quarter-point rate cuts in October and December before pausing.
-
In fixed income markets, previously range-bound global bond yields spiked following the onset of the Middle East conflict, as energy-driven inflation fears appeared to have rattled bond investors. US rate volatility (as measured by the Merrill Lynch Option Volatility Estimate (MOVE) Index) similarly rose from intra-period lows, reflecting uncertainty around the scope and duration of the conflict and its implications for global growth. However, volatility later retracted as the risk of a broader regional military escalation appeared less likely. Global credit spreads widened only modestly before stabilizing near prior levels, supported by strong demand and resilient underlying fundamentals.
-
Top contributors to performance relative to the Blended Index:
-
The fund's fixed income segment was a primary contributor to relative performance, led by allocations to emerging markets debt and high yield credit.
-
The international equity segment also benefited the fund's relative performance, as the MFS Blended Research International Equity Fund outpaced its respective benchmark.
-
-
Top detractors from performance relative to the Blended Index:
-
Within the US equity segment, lagging relative performance across the majority of the strategies weighed on relative results as the funds generally underperformed their respective benchmarks. Style selection also held back relative performance as mid-cap growth and mid-cap core strategies underperformed the broader index.
-
FUND PERFORMANCE
The fund’s past performance is not a good predictor of the fund’s future performance. The graph and table below do not reflect the deduction of taxes that a shareholder would pay on fund distributions or the redemption of fund shares. The graph and table below assume reinvestment of dividends and capital gain distributions.
Growth of a Hypothetical $10,000 Investment
This graph shows the performance of a hypothetical $10,000 investment in Class C over a ten year period or since inception, if shorter, in comparison to (i) a broad measure of market performance and (ii) an additional index that MFS believes more closely reflects the market segments in which the fund invests.
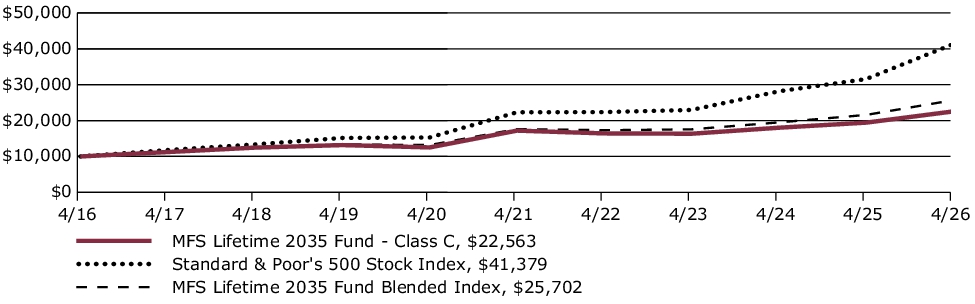
Average Annual Total Returns through 4/30/26
This table shows the average annual total returns of the class of shares noted for the periods shown, both with (if any) and without sales charges. It also shows the average annual total returns of (i) a broad measure of market performance and (ii) an additional index that MFS believes more closely reflects the market segments in which the fund invests, over the same periods.
| Share Class | 1-yr | 5-yr | 10-yr |
| C without sales charge | 16.11% | 5.58% | 8.48% |
| C with CDSC (1% for 12 months)× | 15.11% | 5.58% | 8.48% |
| Comparative Benchmark(s) | |||
| Standard & Poor's 500 Stock Index ∆ | 31.05% | 13.14% | 15.26% |
| MFS Lifetime 2035 Fund Blended Index ∆ | 19.08% | 7.83% | 9.90% |
|
∆
|
Source: FactSet Research Systems Inc.
|
|
×
|
Assuming redemption at the end of the applicable period.
|
Visit mfs.com/perf/c for more recent performance information.
FUND STATISTICS AS OF 4/30/26
| Net Assets ($): | 639,913,190 | Total Management Fee ($)#: | 0 | |
| Total Number of Holdings: | 28 | Portfolio Turnover Rate (%): | 11 |
# The fund itself does not pay a management fee but the underlying funds in which the fund invests do pay management fees to MFS.
PORTFOLIO COMPOSITION (BASED ON TOTAL INVESTMENTS AS OF 4/30/26)
Portfolio allocation

Portfolio holdings
| MFS Government Securities Fund | 9.8% |
| MFS Total Return Bond Fund | 9.4% |
| MFS Inflation-Adjusted Bond Fund | 7.2% |
| MFS Blended Research Mid Cap Equity Fund | 6.8% |
| MFS Blended Research International Equity Fund | 6.1% |
| MFS Global Opportunistic Bond Fund | 5.1% |
| MFS Blended Research Value Equity Fund | 4.0% |
| MFS High Income Fund | 3.9% |
| MFS Value Fund | 3.9% |
| MFS Growth Fund | 3.7% |
| MFS Blended Research Growth Equity Fund | 3.6% |
| MFS Blended Research Core Equity Fund | 3.6% |
| MFS Research Fund | 3.6% |
| MFS Mid Cap Growth Fund | 3.4% |
| MFS Mid Cap Value Fund | 3.4% |
| MFS Research International Fund | 3.0% |
| MFS Global Real Estate Fund | 3.0% |
| MFS Commodity Strategy Fund | 2.9% |
| MFS Emerging Markets Debt Fund | 2.8% |
| MFS Emerging Markets Debt Local Currency Fund | 1.9% |
| MFS International Intrinsic Equity Fund | 1.5% |
| MFS Blended Research Small Cap Equity Fund | 1.5% |
| MFS International Growth Fund | 1.5% |
| MFS Institutional Money Market Portfolio | 1.0% |
| MFS Limited Maturity Fund | 1.0% |
| MFS International New Discovery Fund | 0.9% |
| MFS New Discovery Fund | 0.8% |
| MFS New Discovery Value Fund | 0.7% |
FUND EXPENSES
What were the fund costs for the last year?
| (based on a hypothetical $10,000 investment) | ||
| Class Name | Costs of a $10,000 investment ~ | Costs paid as a percentage of a $10,000 investment ~ |
| I | $0 | 0.00% |
˜ Expenses are direct expenses and do not include underlying fund fees and expenses.
MANAGEMENT'S DISCUSSION OF FUND PERFORMANCE
-
For the twelve months ended April 30, 2026, Class I shares of the MFS Lifetime 2035 Fund (fund) provided a total return of 17.35%, at net asset value. This compares with a return of 31.05% for the fund’s benchmark, the Standard & Poor's 500 Stock Index. The fund's other benchmark, the MFS Lifetime 2035 Fund Blended Index (Blended Index), generated a return of 19.08%. The Blended Index reflects the blended returns of broad asset class indices, with percentage allocations to each index designed to resemble the long term strategic allocations of the fund. The market indices and related percentage allocations used to compile the Blended Index are set forth in the Fund Performance.
-
Global equity markets reached record levels during the period, withstanding considerable volatility amid tariffs, geopolitical conflict and high levels of uncertainty. A new geopolitical event distressed markets at the end of the period as US and Israeli forces launched strikes against Iran, disrupting Mideast oil and natural gas exports. During the period, a pro-growth tax and spending bill was signed into law in the US, while in Europe, renewed focus on defense and infrastructure spending brightened the economic outlook. In Japan, the election of a pro-growth prime minister sent stocks to new highs prior to the conflict in Iran. Optimism over artificial intelligence remained high.
-
Considerable progress was made in trade talks between the US and many major trading partners, with a fragile truce between the US and China extended through late 2026. While the US Supreme Court struck down part of the Trump administration’s tariff strategy, the administration began deploying other authorities to largely replace the ones that were ruled unconstitutional.
-
Early in the period, moderating inflation pressures allowed many global central banks to ease monetary policy. Amid a difficult policymaking environment and slower job growth, the Federal Reserve resumed easing policy in September and delivered quarter-point rate cuts in October and December before pausing.
-
In fixed income markets, previously range-bound global bond yields spiked following the onset of the Middle East conflict, as energy-driven inflation fears appeared to have rattled bond investors. US rate volatility (as measured by the Merrill Lynch Option Volatility Estimate (MOVE) Index) similarly rose from intra-period lows, reflecting uncertainty around the scope and duration of the conflict and its implications for global growth. However, volatility later retracted as the risk of a broader regional military escalation appeared less likely. Global credit spreads widened only modestly before stabilizing near prior levels, supported by strong demand and resilient underlying fundamentals.
-
Top contributors to performance relative to the Blended Index:
-
The fund's fixed income segment was a primary contributor to relative performance, led by allocations to emerging markets debt and high yield credit.
-
The international equity segment also benefited the fund's relative performance, as the MFS Blended Research International Equity Fund outpaced its respective benchmark.
-
-
Top detractors from performance relative to the Blended Index:
-
Within the US equity segment, lagging relative performance across the majority of the strategies weighed on relative results as the funds generally underperformed their respective benchmarks. Style selection also held back relative performance as mid-cap growth and mid-cap core strategies underperformed the broader index.
-
FUND PERFORMANCE
The fund’s past performance is not a good predictor of the fund’s future performance. The graph and table below do not reflect the deduction of taxes that a shareholder would pay on fund distributions or the redemption of fund shares. The graph and table below assume reinvestment of dividends and capital gain distributions.
Growth of a Hypothetical $10,000 Investment
This graph shows the performance of a hypothetical $10,000 investment in Class I over a ten year period or since inception, if shorter, in comparison to (i) a broad measure of market performance and (ii) an additional index that MFS believes more closely reflects the market segments in which the fund invests.
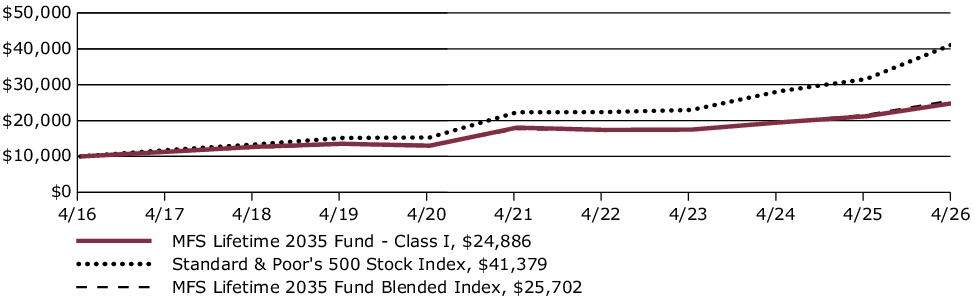
Average Annual Total Returns through 4/30/26
This table shows the average annual total returns of the class of shares noted for the periods shown, both with (if any) and without sales charges. It also shows the average annual total returns of (i) a broad measure of market performance and (ii) an additional index that MFS believes more closely reflects the market segments in which the fund invests, over the same periods.
| Share Class | 1-yr | 5-yr | 10-yr |
| I without sales charge | 17.35% | 6.65% | 9.55% |
| Comparative Benchmark(s) | |||
| Standard & Poor's 500 Stock Index ∆ | 31.05% | 13.14% | 15.26% |
| MFS Lifetime 2035 Fund Blended Index ∆ | 19.08% | 7.83% | 9.90% |
|
∆
|
Source: FactSet Research Systems Inc.
|
Visit mfs.com/perf/i for more recent performance information.
FUND STATISTICS AS OF 4/30/26
| Net Assets ($): | 639,913,190 | Total Management Fee ($)#: | 0 | |
| Total Number of Holdings: | 28 | Portfolio Turnover Rate (%): | 11 |
# The fund itself does not pay a management fee but the underlying funds in which the fund invests do pay management fees to MFS.
PORTFOLIO COMPOSITION (BASED ON TOTAL INVESTMENTS AS OF 4/30/26)
Portfolio allocation

Portfolio holdings
| MFS Government Securities Fund | 9.8% |
| MFS Total Return Bond Fund | 9.4% |
| MFS Inflation-Adjusted Bond Fund | 7.2% |
| MFS Blended Research Mid Cap Equity Fund | 6.8% |
| MFS Blended Research International Equity Fund | 6.1% |
| MFS Global Opportunistic Bond Fund | 5.1% |
| MFS Blended Research Value Equity Fund | 4.0% |
| MFS High Income Fund | 3.9% |
| MFS Value Fund | 3.9% |
| MFS Growth Fund | 3.7% |
| MFS Blended Research Growth Equity Fund | 3.6% |
| MFS Blended Research Core Equity Fund | 3.6% |
| MFS Research Fund | 3.6% |
| MFS Mid Cap Growth Fund | 3.4% |
| MFS Mid Cap Value Fund | 3.4% |
| MFS Research International Fund | 3.0% |
| MFS Global Real Estate Fund | 3.0% |
| MFS Commodity Strategy Fund | 2.9% |
| MFS Emerging Markets Debt Fund | 2.8% |
| MFS Emerging Markets Debt Local Currency Fund | 1.9% |
| MFS International Intrinsic Equity Fund | 1.5% |
| MFS Blended Research Small Cap Equity Fund | 1.5% |
| MFS International Growth Fund | 1.5% |
| MFS Institutional Money Market Portfolio | 1.0% |
| MFS Limited Maturity Fund | 1.0% |
| MFS International New Discovery Fund | 0.9% |
| MFS New Discovery Fund | 0.8% |
| MFS New Discovery Value Fund | 0.7% |
FUND EXPENSES
What were the fund costs for the last year?
| (based on a hypothetical $10,000 investment) | ||
| Class Name | Costs of a $10,000 investment ~ | Costs paid as a percentage of a $10,000 investment ~ |
| R1 | $108 | 1.00% |
˜ Expenses are direct expenses and do not include underlying fund fees and expenses.
MANAGEMENT'S DISCUSSION OF FUND PERFORMANCE
-
For the twelve months ended April 30, 2026, Class R1 shares of the MFS Lifetime 2035 Fund (fund) provided a total return of 16.03%, at net asset value. This compares with a return of 31.05% for the fund’s benchmark, the Standard & Poor's 500 Stock Index. The fund's other benchmark, the MFS Lifetime 2035 Fund Blended Index (Blended Index), generated a return of 19.08%. The Blended Index reflects the blended returns of broad asset class indices, with percentage allocations to each index designed to resemble the long term strategic allocations of the fund. The market indices and related percentage allocations used to compile the Blended Index are set forth in the Fund Performance.
-
Global equity markets reached record levels during the period, withstanding considerable volatility amid tariffs, geopolitical conflict and high levels of uncertainty. A new geopolitical event distressed markets at the end of the period as US and Israeli forces launched strikes against Iran, disrupting Mideast oil and natural gas exports. During the period, a pro-growth tax and spending bill was signed into law in the US, while in Europe, renewed focus on defense and infrastructure spending brightened the economic outlook. In Japan, the election of a pro-growth prime minister sent stocks to new highs prior to the conflict in Iran. Optimism over artificial intelligence remained high.
-
Considerable progress was made in trade talks between the US and many major trading partners, with a fragile truce between the US and China extended through late 2026. While the US Supreme Court struck down part of the Trump administration’s tariff strategy, the administration began deploying other authorities to largely replace the ones that were ruled unconstitutional.
-
Early in the period, moderating inflation pressures allowed many global central banks to ease monetary policy. Amid a difficult policymaking environment and slower job growth, the Federal Reserve resumed easing policy in September and delivered quarter-point rate cuts in October and December before pausing.
-
In fixed income markets, previously range-bound global bond yields spiked following the onset of the Middle East conflict, as energy-driven inflation fears appeared to have rattled bond investors. US rate volatility (as measured by the Merrill Lynch Option Volatility Estimate (MOVE) Index) similarly rose from intra-period lows, reflecting uncertainty around the scope and duration of the conflict and its implications for global growth. However, volatility later retracted as the risk of a broader regional military escalation appeared less likely. Global credit spreads widened only modestly before stabilizing near prior levels, supported by strong demand and resilient underlying fundamentals.
-
Top contributors to performance relative to the Blended Index:
-
The fund's fixed income segment was a primary contributor to relative performance, led by allocations to emerging markets debt and high yield credit.
-
The international equity segment also benefited the fund's relative performance, as the MFS Blended Research International Equity Fund outpaced its respective benchmark.
-
-
Top detractors from performance relative to the Blended Index:
-
Within the US equity segment, lagging relative performance across the majority of the strategies weighed on relative results as the funds generally underperformed their respective benchmarks. Style selection also held back relative performance as mid-cap growth and mid-cap core strategies underperformed the broader index.
-
FUND PERFORMANCE
The fund’s past performance is not a good predictor of the fund’s future performance. The graph and table below do not reflect the deduction of taxes that a shareholder would pay on fund distributions or the redemption of fund shares. The graph and table below assume reinvestment of dividends and capital gain distributions.
Growth of a Hypothetical $10,000 Investment
This graph shows the performance of a hypothetical $10,000 investment in Class R1 over a ten year period or since inception, if shorter, in comparison to (i) a broad measure of market performance and (ii) an additional index that MFS believes more closely reflects the market segments in which the fund invests.

Average Annual Total Returns through 4/30/26
This table shows the average annual total returns of the class of shares noted for the periods shown, both with (if any) and without sales charges. It also shows the average annual total returns of (i) a broad measure of market performance and (ii) an additional index that MFS believes more closely reflects the market segments in which the fund invests, over the same periods.
| Share Class | 1-yr | 5-yr | 10-yr |
| R1 without sales charge | 16.03% | 5.56% | 8.45% |
| Comparative Benchmark(s) | |||
| Standard & Poor's 500 Stock Index ∆ | 31.05% | 13.14% | 15.26% |
| MFS Lifetime 2035 Fund Blended Index ∆ | 19.08% | 7.83% | 9.90% |
|
∆
|
Source: FactSet Research Systems Inc.
|
Visit mfs.com/perf/r1 for more recent performance information.
FUND STATISTICS AS OF 4/30/26
| Net Assets ($): | 639,913,190 | Total Management Fee ($)#: | 0 | |
| Total Number of Holdings: | 28 | Portfolio Turnover Rate (%): | 11 |
# The fund itself does not pay a management fee but the underlying funds in which the fund invests do pay management fees to MFS.
PORTFOLIO COMPOSITION (BASED ON TOTAL INVESTMENTS AS OF 4/30/26)
Portfolio allocation

Portfolio holdings
| MFS Government Securities Fund | 9.8% |
| MFS Total Return Bond Fund | 9.4% |
| MFS Inflation-Adjusted Bond Fund | 7.2% |
| MFS Blended Research Mid Cap Equity Fund | 6.8% |
| MFS Blended Research International Equity Fund | 6.1% |
| MFS Global Opportunistic Bond Fund | 5.1% |
| MFS Blended Research Value Equity Fund | 4.0% |
| MFS High Income Fund | 3.9% |
| MFS Value Fund | 3.9% |
| MFS Growth Fund | 3.7% |
| MFS Blended Research Growth Equity Fund | 3.6% |
| MFS Blended Research Core Equity Fund | 3.6% |
| MFS Research Fund | 3.6% |
| MFS Mid Cap Growth Fund | 3.4% |
| MFS Mid Cap Value Fund | 3.4% |
| MFS Research International Fund | 3.0% |
| MFS Global Real Estate Fund | 3.0% |
| MFS Commodity Strategy Fund | 2.9% |
| MFS Emerging Markets Debt Fund | 2.8% |
| MFS Emerging Markets Debt Local Currency Fund | 1.9% |
| MFS International Intrinsic Equity Fund | 1.5% |
| MFS Blended Research Small Cap Equity Fund | 1.5% |
| MFS International Growth Fund | 1.5% |
| MFS Institutional Money Market Portfolio | 1.0% |
| MFS Limited Maturity Fund | 1.0% |
| MFS International New Discovery Fund | 0.9% |
| MFS New Discovery Fund | 0.8% |
| MFS New Discovery Value Fund | 0.7% |
FUND EXPENSES
What were the fund costs for the last year?
| (based on a hypothetical $10,000 investment) | ||
| Class Name | Costs of a $10,000 investment ~ | Costs paid as a percentage of a $10,000 investment ~ |
| R2 | $54 | 0.50% |
˜ Expenses are direct expenses and do not include underlying fund fees and expenses.
MANAGEMENT'S DISCUSSION OF FUND PERFORMANCE
-
For the twelve months ended April 30, 2026, Class R2 shares of the MFS Lifetime 2035 Fund (fund) provided a total return of 16.72%, at net asset value. This compares with a return of 31.05% for the fund’s benchmark, the Standard & Poor's 500 Stock Index. The fund's other benchmark, the MFS Lifetime 2035 Fund Blended Index (Blended Index), generated a return of 19.08%. The Blended Index reflects the blended returns of broad asset class indices, with percentage allocations to each index designed to resemble the long term strategic allocations of the fund. The market indices and related percentage allocations used to compile the Blended Index are set forth in the Fund Performance.
-
Global equity markets reached record levels during the period, withstanding considerable volatility amid tariffs, geopolitical conflict and high levels of uncertainty. A new geopolitical event distressed markets at the end of the period as US and Israeli forces launched strikes against Iran, disrupting Mideast oil and natural gas exports. During the period, a pro-growth tax and spending bill was signed into law in the US, while in Europe, renewed focus on defense and infrastructure spending brightened the economic outlook. In Japan, the election of a pro-growth prime minister sent stocks to new highs prior to the conflict in Iran. Optimism over artificial intelligence remained high.
-
Considerable progress was made in trade talks between the US and many major trading partners, with a fragile truce between the US and China extended through late 2026. While the US Supreme Court struck down part of the Trump administration’s tariff strategy, the administration began deploying other authorities to largely replace the ones that were ruled unconstitutional.
-
Early in the period, moderating inflation pressures allowed many global central banks to ease monetary policy. Amid a difficult policymaking environment and slower job growth, the Federal Reserve resumed easing policy in September and delivered quarter-point rate cuts in October and December before pausing.
-
In fixed income markets, previously range-bound global bond yields spiked following the onset of the Middle East conflict, as energy-driven inflation fears appeared to have rattled bond investors. US rate volatility (as measured by the Merrill Lynch Option Volatility Estimate (MOVE) Index) similarly rose from intra-period lows, reflecting uncertainty around the scope and duration of the conflict and its implications for global growth. However, volatility later retracted as the risk of a broader regional military escalation appeared less likely. Global credit spreads widened only modestly before stabilizing near prior levels, supported by strong demand and resilient underlying fundamentals.
-
Top contributors to performance relative to the Blended Index:
-
The fund's fixed income segment was a primary contributor to relative performance, led by allocations to emerging markets debt and high yield credit.
-
The international equity segment also benefited the fund's relative performance, as the MFS Blended Research International Equity Fund outpaced its respective benchmark.
-
-
Top detractors from performance relative to the Blended Index:
-
Within the US equity segment, lagging relative performance across the majority of the strategies weighed on relative results as the funds generally underperformed their respective benchmarks. Style selection also held back relative performance as mid-cap growth and mid-cap core strategies underperformed the broader index.
-
FUND PERFORMANCE
The fund’s past performance is not a good predictor of the fund’s future performance. The graph and table below do not reflect the deduction of taxes that a shareholder would pay on fund distributions or the redemption of fund shares. The graph and table below assume reinvestment of dividends and capital gain distributions.
Growth of a Hypothetical $10,000 Investment
This graph shows the performance of a hypothetical $10,000 investment in Class R2 over a ten year period or since inception, if shorter, in comparison to (i) a broad measure of market performance and (ii) an additional index that MFS believes more closely reflects the market segments in which the fund invests.
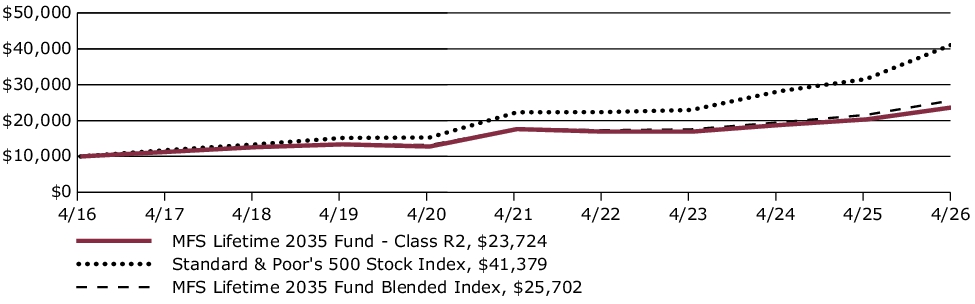
Average Annual Total Returns through 4/30/26
This table shows the average annual total returns of the class of shares noted for the periods shown, both with (if any) and without sales charges. It also shows the average annual total returns of (i) a broad measure of market performance and (ii) an additional index that MFS believes more closely reflects the market segments in which the fund invests, over the same periods.
| Share Class | 1-yr | 5-yr | 10-yr |
| R2 without sales charge | 16.72% | 6.12% | 9.02% |
| Comparative Benchmark(s) | |||
| Standard & Poor's 500 Stock Index ∆ | 31.05% | 13.14% | 15.26% |
| MFS Lifetime 2035 Fund Blended Index ∆ | 19.08% | 7.83% | 9.90% |
|
∆
|
Source: FactSet Research Systems Inc.
|
Visit mfs.com/perf/r2 for more recent performance information.
FUND STATISTICS AS OF 4/30/26
| Net Assets ($): | 639,913,190 | Total Management Fee ($)#: | 0 | |
| Total Number of Holdings: | 28 | Portfolio Turnover Rate (%): | 11 |
# The fund itself does not pay a management fee but the underlying funds in which the fund invests do pay management fees to MFS.
PORTFOLIO COMPOSITION (BASED ON TOTAL INVESTMENTS AS OF 4/30/26)
Portfolio allocation

Portfolio holdings
| MFS Government Securities Fund | 9.8% |
| MFS Total Return Bond Fund | 9.4% |
| MFS Inflation-Adjusted Bond Fund | 7.2% |
| MFS Blended Research Mid Cap Equity Fund | 6.8% |
| MFS Blended Research International Equity Fund | 6.1% |
| MFS Global Opportunistic Bond Fund | 5.1% |
| MFS Blended Research Value Equity Fund | 4.0% |
| MFS High Income Fund | 3.9% |
| MFS Value Fund | 3.9% |
| MFS Growth Fund | 3.7% |
| MFS Blended Research Growth Equity Fund | 3.6% |
| MFS Blended Research Core Equity Fund | 3.6% |
| MFS Research Fund | 3.6% |
| MFS Mid Cap Growth Fund | 3.4% |
| MFS Mid Cap Value Fund | 3.4% |
| MFS Research International Fund | 3.0% |
| MFS Global Real Estate Fund | 3.0% |
| MFS Commodity Strategy Fund | 2.9% |
| MFS Emerging Markets Debt Fund | 2.8% |
| MFS Emerging Markets Debt Local Currency Fund | 1.9% |
| MFS International Intrinsic Equity Fund | 1.5% |
| MFS Blended Research Small Cap Equity Fund | 1.5% |
| MFS International Growth Fund | 1.5% |
| MFS Institutional Money Market Portfolio | 1.0% |
| MFS Limited Maturity Fund | 1.0% |
| MFS International New Discovery Fund | 0.9% |
| MFS New Discovery Fund | 0.8% |
| MFS New Discovery Value Fund | 0.7% |
FUND EXPENSES
What were the fund costs for the last year?
| (based on a hypothetical $10,000 investment) | ||
| Class Name | Costs of a $10,000 investment ~ | Costs paid as a percentage of a $10,000 investment ~ |
| A | $28 | 0.25% |
˜ Expenses are direct expenses and do not include underlying fund fees and expenses.
MANAGEMENT'S DISCUSSION OF FUND PERFORMANCE
-
For the twelve months ended April 30, 2026, Class A shares of the MFS Lifetime 2040 Fund (fund) provided a total return of 21.40%, at net asset value. This compares with a return of 31.05% for the fund’s benchmark, the Standard & Poor's 500 Stock Index. The fund's other benchmark, the MFS Lifetime 2040 Fund Blended Index (Blended Index), generated a return of 24.12%. The Blended Index reflects the blended returns of broad asset class indices, with percentage allocations to each index designed to resemble the long term strategic allocations of the fund. The market indices and related percentage allocations used to compile the Blended Index are set forth in the Fund Performance.
-
Global equity markets reached record levels during the period, withstanding considerable volatility amid tariffs, geopolitical conflict and high levels of uncertainty. A new geopolitical event distressed markets at the end of the period as US and Israeli forces launched strikes against Iran, disrupting Mideast oil and natural gas exports. During the period, a pro-growth tax and spending bill was signed into law in the US, while in Europe, renewed focus on defense and infrastructure spending brightened the economic outlook. In Japan, the election of a pro-growth prime minister sent stocks to new highs prior to the conflict in Iran. Optimism over artificial intelligence remained high.
-
Considerable progress was made in trade talks between the US and many major trading partners, with a fragile truce between the US and China extended through late 2026. While the US Supreme Court struck down part of the Trump administration’s tariff strategy, the administration began deploying other authorities to largely replace the ones that were ruled unconstitutional.
-
Early in the period, moderating inflation pressures allowed many global central banks to ease monetary policy. Amid a difficult policymaking environment and slower job growth, the Federal Reserve resumed easing policy in September and delivered quarter-point rate cuts in October and December before pausing.
-
In fixed income markets, previously range-bound global bond yields spiked following the onset of the Middle East conflict, as energy-driven inflation fears appeared to have rattled bond investors. US rate volatility (as measured by the Merrill Lynch Option Volatility Estimate (MOVE) Index) similarly rose from intra-period lows, reflecting uncertainty around the scope and duration of the conflict and its implications for global growth. However, volatility later retracted as the risk of a broader regional military escalation appeared less likely. Global credit spreads widened only modestly before stabilizing near prior levels, supported by strong demand and resilient underlying fundamentals.
-
Top contributors to performance relative to the Blended Index:
-
The fund's fixed income segment was a primary contributor to relative performance, led by allocations to emerging markets debt and high yield credit.
-
The international equity segment also benefited the fund's relative performance, as the MFS Blended Research International Equity Fund outpaced its respective benchmark.
-
-
Top detractors from performance relative to the Blended Index:
-
Within the US equity segment, lagging relative performance across the majority of the strategies weighed on relative results as the funds generally underperformed their respective benchmarks. Style selection also held back relative performance as mid-cap growth and mid-cap core strategies underperformed the broader index.
-
FUND PERFORMANCE
The fund’s past performance is not a good predictor of the fund’s future performance. The graph and table below do not reflect the deduction of taxes that a shareholder would pay on fund distributions or the redemption of fund shares. The graph and table below assume reinvestment of dividends and capital gain distributions.
Growth of a Hypothetical $10,000 Investment
This graph shows the performance of a hypothetical $10,000 investment in Class A over a ten year period or since inception, if shorter, in comparison to (i) a broad measure of market performance and (ii) an additional index that MFS believes more closely reflects the market segments in which the fund invests. This graph includes the deduction of the maximum applicable sales charge.
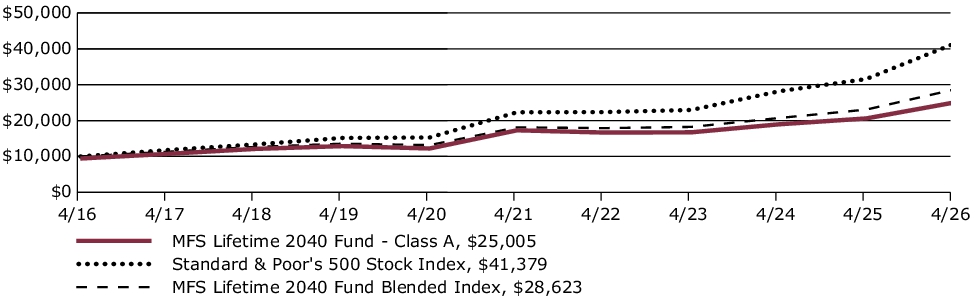
Average Annual Total Returns through 4/30/26
This table shows the average annual total returns of the class of shares noted for the periods shown, both with (if any) and without sales charges. It also shows the average annual total returns of (i) a broad measure of market performance and (ii) an additional index that MFS believes more closely reflects the market segments in which the fund invests, over the same periods.
| Share Class | 1-yr | 5-yr | 10-yr |
| A without sales charge | 21.40% | 7.66% | 10.25% |
| A with initial sales charge (5.75%) | 14.42% | 6.39% | 9.60% |
| Comparative Benchmark(s) | |||
| Standard & Poor's 500 Stock Index ∆ | 31.05% | 13.14% | 15.26% |
| MFS Lifetime 2040 Fund Blended Index ∆ | 24.12% | 9.59% | 11.09% |
|
∆
|
Source: FactSet Research Systems Inc.
|
Visit mfs.com/perf/a for more recent performance information.
FUND STATISTICS AS OF 4/30/26
| Net Assets ($): | 833,670,262 | Total Management Fee ($)#: | 0 | |
| Total Number of Holdings: | 29 | Portfolio Turnover Rate (%): | 8 |
# The fund itself does not pay a management fee but the underlying funds in which the fund invests do pay management fees to MFS.
PORTFOLIO COMPOSITION (BASED ON TOTAL INVESTMENTS AS OF 4/30/26)
Portfolio allocation

Portfolio holdings
| MFS Blended Research Mid Cap Equity Fund | 8.9% |
| MFS Blended Research International Equity Fund | 8.5% |
| MFS Inflation-Adjusted Bond Fund | 5.0% |
| MFS Blended Research Value Equity Fund | 5.0% |
| MFS Value Fund | 4.9% |
| MFS Growth Fund | 4.7% |
| MFS Blended Research Growth Equity Fund | 4.6% |
| MFS Blended Research Core Equity Fund | 4.6% |
| MFS Research Fund | 4.6% |
| MFS Mid Cap Growth Fund | 4.5% |
| MFS Mid Cap Value Fund | 4.4% |
| MFS Global Real Estate Fund | 4.0% |
| MFS Commodity Strategy Fund | 3.9% |
| MFS High Income Fund | 3.9% |
| MFS Research International Fund | 3.5% |
| MFS Total Return Bond Fund | 3.4% |
| MFS Global Opportunistic Bond Fund | 3.1% |
| MFS Emerging Markets Debt Fund | 2.9% |
| MFS International Intrinsic Equity Fund | 2.4% |
| MFS International Growth Fund | 2.4% |
| MFS Blended Research Small Cap Equity Fund | 2.0% |
| MFS International New Discovery Fund | 2.0% |
| MFS Emerging Markets Debt Local Currency Fund | 2.0% |
| MFS New Discovery Fund | 1.0% |
| MFS New Discovery Value Fund | 1.0% |
| MFS Government Securities Fund | 0.9% |
| MFS Institutional Money Market Portfolio | 0.9% |
| MFS Blended Research Emerging Markets Equity Fund | 0.5% |
| MFS Emerging Markets Equity Fund | 0.5% |
FUND EXPENSES
What were the fund costs for the last year?
| (based on a hypothetical $10,000 investment) | ||
| Class Name | Costs of a $10,000 investment ~ | Costs paid as a percentage of a $10,000 investment ~ |
| B | $109 | 0.99% |
˜ Expenses are direct expenses and do not include underlying fund fees and expenses.
MANAGEMENT'S DISCUSSION OF FUND PERFORMANCE
-
For the twelve months ended April 30, 2026, Class B shares of the MFS Lifetime 2040 Fund (fund) provided a total return of 20.56%, at net asset value. This compares with a return of 31.05% for the fund’s benchmark, the Standard & Poor's 500 Stock Index. The fund's other benchmark, the MFS Lifetime 2040 Fund Blended Index (Blended Index), generated a return of 24.12%. The Blended Index reflects the blended returns of broad asset class indices, with percentage allocations to each index designed to resemble the long term strategic allocations of the fund. The market indices and related percentage allocations used to compile the Blended Index are set forth in the Fund Performance.
-
Global equity markets reached record levels during the period, withstanding considerable volatility amid tariffs, geopolitical conflict and high levels of uncertainty. A new geopolitical event distressed markets at the end of the period as US and Israeli forces launched strikes against Iran, disrupting Mideast oil and natural gas exports. During the period, a pro-growth tax and spending bill was signed into law in the US, while in Europe, renewed focus on defense and infrastructure spending brightened the economic outlook. In Japan, the election of a pro-growth prime minister sent stocks to new highs prior to the conflict in Iran. Optimism over artificial intelligence remained high.
-
Considerable progress was made in trade talks between the US and many major trading partners, with a fragile truce between the US and China extended through late 2026. While the US Supreme Court struck down part of the Trump administration’s tariff strategy, the administration began deploying other authorities to largely replace the ones that were ruled unconstitutional.
-
Early in the period, moderating inflation pressures allowed many global central banks to ease monetary policy. Amid a difficult policymaking environment and slower job growth, the Federal Reserve resumed easing policy in September and delivered quarter-point rate cuts in October and December before pausing.
-
In fixed income markets, previously range-bound global bond yields spiked following the onset of the Middle East conflict, as energy-driven inflation fears appeared to have rattled bond investors. US rate volatility (as measured by the Merrill Lynch Option Volatility Estimate (MOVE) Index) similarly rose from intra-period lows, reflecting uncertainty around the scope and duration of the conflict and its implications for global growth. However, volatility later retracted as the risk of a broader regional military escalation appeared less likely. Global credit spreads widened only modestly before stabilizing near prior levels, supported by strong demand and resilient underlying fundamentals.
-
Top contributors to performance relative to the Blended Index:
-
The fund's fixed income segment was a primary contributor to relative performance, led by allocations to emerging markets debt and high yield credit.
-
The international equity segment also benefited the fund's relative performance, as the MFS Blended Research International Equity Fund outpaced its respective benchmark.
-
-
Top detractors from performance relative to the Blended Index:
-
Within the US equity segment, lagging relative performance across the majority of the strategies weighed on relative results as the funds generally underperformed their respective benchmarks. Style selection also held back relative performance as mid-cap growth and mid-cap core strategies underperformed the broader index.
-
FUND PERFORMANCE
The fund’s past performance is not a good predictor of the fund’s future performance. The graph and table below do not reflect the deduction of taxes that a shareholder would pay on fund distributions or the redemption of fund shares. The graph and table below assume reinvestment of dividends and capital gain distributions.
Growth of a Hypothetical $10,000 Investment
This graph shows the performance of a hypothetical $10,000 investment in Class B over a ten year period or since inception, if shorter, in comparison to (i) a broad measure of market performance and (ii) an additional index that MFS believes more closely reflects the market segments in which the fund invests.
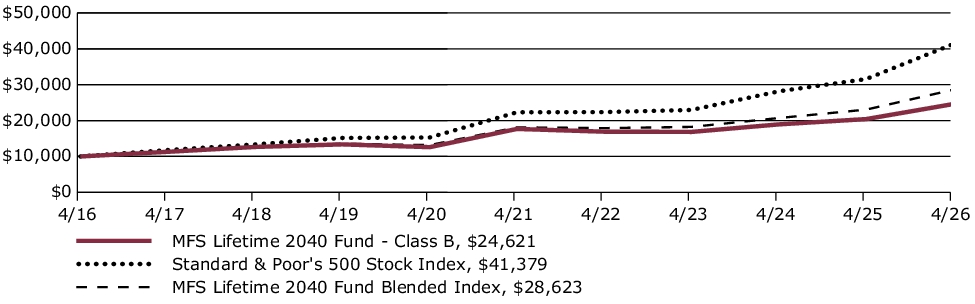
Average Annual Total Returns through 4/30/26
This table shows the average annual total returns of the class of shares noted for the periods shown, both with (if any) and without sales charges. It also shows the average annual total returns of (i) a broad measure of market performance and (ii) an additional index that MFS believes more closely reflects the market segments in which the fund invests, over the same periods.
| Share Class | 1-yr | 5-yr | 10-yr |
| B without sales charge | 20.56% | 6.86% | 9.43% |
| B with CDSC (declining over six years from 4% to 0%)× | 16.56% | 6.55% | 9.43% |
| Comparative Benchmark(s) | |||
| Standard & Poor's 500 Stock Index ∆ | 31.05% | 13.14% | 15.26% |
| MFS Lifetime 2040 Fund Blended Index ∆ | 24.12% | 9.59% | 11.09% |
|
∆
|
Source: FactSet Research Systems Inc.
|
|
×
|
Assuming redemption at the end of the applicable period.
|
Visit mfs.com/perf/b for more recent performance information.
FUND STATISTICS AS OF 4/30/26
| Net Assets ($): | 833,670,262 | Total Management Fee ($)#: | 0 | |
| Total Number of Holdings: | 29 | Portfolio Turnover Rate (%): | 8 |
# The fund itself does not pay a management fee but the underlying funds in which the fund invests do pay management fees to MFS.
PORTFOLIO COMPOSITION (BASED ON TOTAL INVESTMENTS AS OF 4/30/26)
Portfolio allocation

Portfolio holdings
| MFS Blended Research Mid Cap Equity Fund | 8.9% |
| MFS Blended Research International Equity Fund | 8.5% |
| MFS Inflation-Adjusted Bond Fund | 5.0% |
| MFS Blended Research Value Equity Fund | 5.0% |
| MFS Value Fund | 4.9% |
| MFS Growth Fund | 4.7% |
| MFS Blended Research Growth Equity Fund | 4.6% |
| MFS Blended Research Core Equity Fund | 4.6% |
| MFS Research Fund | 4.6% |
| MFS Mid Cap Growth Fund | 4.5% |
| MFS Mid Cap Value Fund | 4.4% |
| MFS Global Real Estate Fund | 4.0% |
| MFS Commodity Strategy Fund | 3.9% |
| MFS High Income Fund | 3.9% |
| MFS Research International Fund | 3.5% |
| MFS Total Return Bond Fund | 3.4% |
| MFS Global Opportunistic Bond Fund | 3.1% |
| MFS Emerging Markets Debt Fund | 2.9% |
| MFS International Intrinsic Equity Fund | 2.4% |
| MFS International Growth Fund | 2.4% |
| MFS Blended Research Small Cap Equity Fund | 2.0% |
| MFS International New Discovery Fund | 2.0% |
| MFS Emerging Markets Debt Local Currency Fund | 2.0% |
| MFS New Discovery Fund | 1.0% |
| MFS New Discovery Value Fund | 1.0% |
| MFS Government Securities Fund | 0.9% |
| MFS Institutional Money Market Portfolio | 0.9% |
| MFS Blended Research Emerging Markets Equity Fund | 0.5% |
| MFS Emerging Markets Equity Fund | 0.5% |
FUND EXPENSES
What were the fund costs for the last year?
| (based on a hypothetical $10,000 investment) | ||
| Class Name | Costs of a $10,000 investment ~ | Costs paid as a percentage of a $10,000 investment ~ |
| C | $109 | 0.99% |
˜ Expenses are direct expenses and do not include underlying fund fees and expenses.
MANAGEMENT'S DISCUSSION OF FUND PERFORMANCE
-
For the twelve months ended April 30, 2026, Class C shares of the MFS Lifetime 2040 Fund (fund) provided a total return of 20.56%, at net asset value. This compares with a return of 31.05% for the fund’s benchmark, the Standard & Poor's 500 Stock Index. The fund's other benchmark, the MFS Lifetime 2040 Fund Blended Index (Blended Index), generated a return of 24.12%. The Blended Index reflects the blended returns of broad asset class indices, with percentage allocations to each index designed to resemble the long term strategic allocations of the fund. The market indices and related percentage allocations used to compile the Blended Index are set forth in the Fund Performance.
-
Global equity markets reached record levels during the period, withstanding considerable volatility amid tariffs, geopolitical conflict and high levels of uncertainty. A new geopolitical event distressed markets at the end of the period as US and Israeli forces launched strikes against Iran, disrupting Mideast oil and natural gas exports. During the period, a pro-growth tax and spending bill was signed into law in the US, while in Europe, renewed focus on defense and infrastructure spending brightened the economic outlook. In Japan, the election of a pro-growth prime minister sent stocks to new highs prior to the conflict in Iran. Optimism over artificial intelligence remained high.
-
Considerable progress was made in trade talks between the US and many major trading partners, with a fragile truce between the US and China extended through late 2026. While the US Supreme Court struck down part of the Trump administration’s tariff strategy, the administration began deploying other authorities to largely replace the ones that were ruled unconstitutional.
-
Early in the period, moderating inflation pressures allowed many global central banks to ease monetary policy. Amid a difficult policymaking environment and slower job growth, the Federal Reserve resumed easing policy in September and delivered quarter-point rate cuts in October and December before pausing.
-
In fixed income markets, previously range-bound global bond yields spiked following the onset of the Middle East conflict, as energy-driven inflation fears appeared to have rattled bond investors. US rate volatility (as measured by the Merrill Lynch Option Volatility Estimate (MOVE) Index) similarly rose from intra-period lows, reflecting uncertainty around the scope and duration of the conflict and its implications for global growth. However, volatility later retracted as the risk of a broader regional military escalation appeared less likely. Global credit spreads widened only modestly before stabilizing near prior levels, supported by strong demand and resilient underlying fundamentals.
-
Top contributors to performance relative to the Blended Index:
-
The fund's fixed income segment was a primary contributor to relative performance, led by allocations to emerging markets debt and high yield credit.
-
The international equity segment also benefited the fund's relative performance, as the MFS Blended Research International Equity Fund outpaced its respective benchmark.
-
-
Top detractors from performance relative to the Blended Index:
-
Within the US equity segment, lagging relative performance across the majority of the strategies weighed on relative results as the funds generally underperformed their respective benchmarks. Style selection also held back relative performance as mid-cap growth and mid-cap core strategies underperformed the broader index.
-
FUND PERFORMANCE
The fund’s past performance is not a good predictor of the fund’s future performance. The graph and table below do not reflect the deduction of taxes that a shareholder would pay on fund distributions or the redemption of fund shares. The graph and table below assume reinvestment of dividends and capital gain distributions.
Growth of a Hypothetical $10,000 Investment
This graph shows the performance of a hypothetical $10,000 investment in Class C over a ten year period or since inception, if shorter, in comparison to (i) a broad measure of market performance and (ii) an additional index that MFS believes more closely reflects the market segments in which the fund invests.

Average Annual Total Returns through 4/30/26
This table shows the average annual total returns of the class of shares noted for the periods shown, both with (if any) and without sales charges. It also shows the average annual total returns of (i) a broad measure of market performance and (ii) an additional index that MFS believes more closely reflects the market segments in which the fund invests, over the same periods.
| Share Class | 1-yr | 5-yr | 10-yr |
| C without sales charge | 20.56% | 6.85% | 9.43% |
| C with CDSC (1% for 12 months)× | 19.56% | 6.85% | 9.43% |
| Comparative Benchmark(s) | |||
| Standard & Poor's 500 Stock Index ∆ | 31.05% | 13.14% | 15.26% |
| MFS Lifetime 2040 Fund Blended Index ∆ | 24.12% | 9.59% | 11.09% |
|
∆
|
Source: FactSet Research Systems Inc.
|
|
×
|
Assuming redemption at the end of the applicable period.
|
Visit mfs.com/perf/c for more recent performance information.
FUND STATISTICS AS OF 4/30/26
| Net Assets ($): | 833,670,262 | Total Management Fee ($)#: | 0 | |
| Total Number of Holdings: | 29 | Portfolio Turnover Rate (%): | 8 |
# The fund itself does not pay a management fee but the underlying funds in which the fund invests do pay management fees to MFS.
PORTFOLIO COMPOSITION (BASED ON TOTAL INVESTMENTS AS OF 4/30/26)
Portfolio allocation

Portfolio holdings
| MFS Blended Research Mid Cap Equity Fund | 8.9% |
| MFS Blended Research International Equity Fund | 8.5% |
| MFS Inflation-Adjusted Bond Fund | 5.0% |
| MFS Blended Research Value Equity Fund | 5.0% |
| MFS Value Fund | 4.9% |
| MFS Growth Fund | 4.7% |
| MFS Blended Research Growth Equity Fund | 4.6% |
| MFS Blended Research Core Equity Fund | 4.6% |
| MFS Research Fund | 4.6% |
| MFS Mid Cap Growth Fund | 4.5% |
| MFS Mid Cap Value Fund | 4.4% |
| MFS Global Real Estate Fund | 4.0% |
| MFS Commodity Strategy Fund | 3.9% |
| MFS High Income Fund | 3.9% |
| MFS Research International Fund | 3.5% |
| MFS Total Return Bond Fund | 3.4% |
| MFS Global Opportunistic Bond Fund | 3.1% |
| MFS Emerging Markets Debt Fund | 2.9% |
| MFS International Intrinsic Equity Fund | 2.4% |
| MFS International Growth Fund | 2.4% |
| MFS Blended Research Small Cap Equity Fund | 2.0% |
| MFS International New Discovery Fund | 2.0% |
| MFS Emerging Markets Debt Local Currency Fund | 2.0% |
| MFS New Discovery Fund | 1.0% |
| MFS New Discovery Value Fund | 1.0% |
| MFS Government Securities Fund | 0.9% |
| MFS Institutional Money Market Portfolio | 0.9% |
| MFS Blended Research Emerging Markets Equity Fund | 0.5% |
| MFS Emerging Markets Equity Fund | 0.5% |
FUND EXPENSES
What were the fund costs for the last year?
| (based on a hypothetical $10,000 investment) | ||
| Class Name | Costs of a $10,000 investment ~ | Costs paid as a percentage of a $10,000 investment ~ |
| I | $0 | 0.00% |
˜ Expenses are direct expenses and do not include underlying fund fees and expenses.
MANAGEMENT'S DISCUSSION OF FUND PERFORMANCE
-
For the twelve months ended April 30, 2026, Class I shares of the MFS Lifetime 2040 Fund (fund) provided a total return of 21.76%, at net asset value. This compares with a return of 31.05% for the fund’s benchmark, the Standard & Poor's 500 Stock Index. The fund's other benchmark, the MFS Lifetime 2040 Fund Blended Index (Blended Index), generated a return of 24.12%. The Blended Index reflects the blended returns of broad asset class indices, with percentage allocations to each index designed to resemble the long term strategic allocations of the fund. The market indices and related percentage allocations used to compile the Blended Index are set forth in the Fund Performance.
-
Global equity markets reached record levels during the period, withstanding considerable volatility amid tariffs, geopolitical conflict and high levels of uncertainty. A new geopolitical event distressed markets at the end of the period as US and Israeli forces launched strikes against Iran, disrupting Mideast oil and natural gas exports. During the period, a pro-growth tax and spending bill was signed into law in the US, while in Europe, renewed focus on defense and infrastructure spending brightened the economic outlook. In Japan, the election of a pro-growth prime minister sent stocks to new highs prior to the conflict in Iran. Optimism over artificial intelligence remained high.
-
Considerable progress was made in trade talks between the US and many major trading partners, with a fragile truce between the US and China extended through late 2026. While the US Supreme Court struck down part of the Trump administration’s tariff strategy, the administration began deploying other authorities to largely replace the ones that were ruled unconstitutional.
-
Early in the period, moderating inflation pressures allowed many global central banks to ease monetary policy. Amid a difficult policymaking environment and slower job growth, the Federal Reserve resumed easing policy in September and delivered quarter-point rate cuts in October and December before pausing.
-
In fixed income markets, previously range-bound global bond yields spiked following the onset of the Middle East conflict, as energy-driven inflation fears appeared to have rattled bond investors. US rate volatility (as measured by the Merrill Lynch Option Volatility Estimate (MOVE) Index) similarly rose from intra-period lows, reflecting uncertainty around the scope and duration of the conflict and its implications for global growth. However, volatility later retracted as the risk of a broader regional military escalation appeared less likely. Global credit spreads widened only modestly before stabilizing near prior levels, supported by strong demand and resilient underlying fundamentals.
-
Top contributors to performance relative to the Blended Index:
-
The fund's fixed income segment was a primary contributor to relative performance, led by allocations to emerging markets debt and high yield credit.
-
The international equity segment also benefited the fund's relative performance, as the MFS Blended Research International Equity Fund outpaced its respective benchmark.
-
-
Top detractors from performance relative to the Blended Index:
-
Within the US equity segment, lagging relative performance across the majority of the strategies weighed on relative results as the funds generally underperformed their respective benchmarks. Style selection also held back relative performance as mid-cap growth and mid-cap core strategies underperformed the broader index.
-
FUND PERFORMANCE
The fund’s past performance is not a good predictor of the fund’s future performance. The graph and table below do not reflect the deduction of taxes that a shareholder would pay on fund distributions or the redemption of fund shares. The graph and table below assume reinvestment of dividends and capital gain distributions.
Growth of a Hypothetical $10,000 Investment
This graph shows the performance of a hypothetical $10,000 investment in Class I over a ten year period or since inception, if shorter, in comparison to (i) a broad measure of market performance and (ii) an additional index that MFS believes more closely reflects the market segments in which the fund invests.
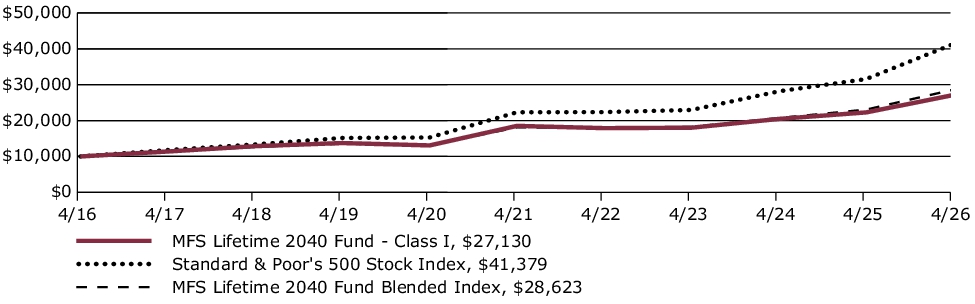
Average Annual Total Returns through 4/30/26
This table shows the average annual total returns of the class of shares noted for the periods shown, both with (if any) and without sales charges. It also shows the average annual total returns of (i) a broad measure of market performance and (ii) an additional index that MFS believes more closely reflects the market segments in which the fund invests, over the same periods.
| Share Class | 1-yr | 5-yr | 10-yr |
| I without sales charge | 21.76% | 7.93% | 10.50% |
| Comparative Benchmark(s) | |||
| Standard & Poor's 500 Stock Index ∆ | 31.05% | 13.14% | 15.26% |
| MFS Lifetime 2040 Fund Blended Index ∆ | 24.12% | 9.59% | 11.09% |
|
∆
|
Source: FactSet Research Systems Inc.
|
Visit mfs.com/perf/i for more recent performance information.
FUND STATISTICS AS OF 4/30/26
| Net Assets ($): | 833,670,262 | Total Management Fee ($)#: | 0 | |
| Total Number of Holdings: | 29 | Portfolio Turnover Rate (%): | 8 |
# The fund itself does not pay a management fee but the underlying funds in which the fund invests do pay management fees to MFS.
PORTFOLIO COMPOSITION (BASED ON TOTAL INVESTMENTS AS OF 4/30/26)
Portfolio allocation

Portfolio holdings
| MFS Blended Research Mid Cap Equity Fund | 8.9% |
| MFS Blended Research International Equity Fund | 8.5% |
| MFS Inflation-Adjusted Bond Fund | 5.0% |
| MFS Blended Research Value Equity Fund | 5.0% |
| MFS Value Fund | 4.9% |
| MFS Growth Fund | 4.7% |
| MFS Blended Research Growth Equity Fund | 4.6% |
| MFS Blended Research Core Equity Fund | 4.6% |
| MFS Research Fund | 4.6% |
| MFS Mid Cap Growth Fund | 4.5% |
| MFS Mid Cap Value Fund | 4.4% |
| MFS Global Real Estate Fund | 4.0% |
| MFS Commodity Strategy Fund | 3.9% |
| MFS High Income Fund | 3.9% |
| MFS Research International Fund | 3.5% |
| MFS Total Return Bond Fund | 3.4% |
| MFS Global Opportunistic Bond Fund | 3.1% |
| MFS Emerging Markets Debt Fund | 2.9% |
| MFS International Intrinsic Equity Fund | 2.4% |
| MFS International Growth Fund | 2.4% |
| MFS Blended Research Small Cap Equity Fund | 2.0% |
| MFS International New Discovery Fund | 2.0% |
| MFS Emerging Markets Debt Local Currency Fund | 2.0% |
| MFS New Discovery Fund | 1.0% |
| MFS New Discovery Value Fund | 1.0% |
| MFS Government Securities Fund | 0.9% |
| MFS Institutional Money Market Portfolio | 0.9% |
| MFS Blended Research Emerging Markets Equity Fund | 0.5% |
| MFS Emerging Markets Equity Fund | 0.5% |
FUND EXPENSES
What were the fund costs for the last year?
| (based on a hypothetical $10,000 investment) | ||
| Class Name | Costs of a $10,000 investment ~ | Costs paid as a percentage of a $10,000 investment ~ |
| R1 | $110 | 1.00% |
˜ Expenses are direct expenses and do not include underlying fund fees and expenses.
MANAGEMENT'S DISCUSSION OF FUND PERFORMANCE
-
For the twelve months ended April 30, 2026, Class R1 shares of the MFS Lifetime 2040 Fund (fund) provided a total return of 20.55%, at net asset value. This compares with a return of 31.05% for the fund’s benchmark, the Standard & Poor's 500 Stock Index. The fund's other benchmark, the MFS Lifetime 2040 Fund Blended Index (Blended Index), generated a return of 24.12%. The Blended Index reflects the blended returns of broad asset class indices, with percentage allocations to each index designed to resemble the long term strategic allocations of the fund. The market indices and related percentage allocations used to compile the Blended Index are set forth in the Fund Performance.
-
Global equity markets reached record levels during the period, withstanding considerable volatility amid tariffs, geopolitical conflict and high levels of uncertainty. A new geopolitical event distressed markets at the end of the period as US and Israeli forces launched strikes against Iran, disrupting Mideast oil and natural gas exports. During the period, a pro-growth tax and spending bill was signed into law in the US, while in Europe, renewed focus on defense and infrastructure spending brightened the economic outlook. In Japan, the election of a pro-growth prime minister sent stocks to new highs prior to the conflict in Iran. Optimism over artificial intelligence remained high.
-
Considerable progress was made in trade talks between the US and many major trading partners, with a fragile truce between the US and China extended through late 2026. While the US Supreme Court struck down part of the Trump administration’s tariff strategy, the administration began deploying other authorities to largely replace the ones that were ruled unconstitutional.
-
Early in the period, moderating inflation pressures allowed many global central banks to ease monetary policy. Amid a difficult policymaking environment and slower job growth, the Federal Reserve resumed easing policy in September and delivered quarter-point rate cuts in October and December before pausing.
-
In fixed income markets, previously range-bound global bond yields spiked following the onset of the Middle East conflict, as energy-driven inflation fears appeared to have rattled bond investors. US rate volatility (as measured by the Merrill Lynch Option Volatility Estimate (MOVE) Index) similarly rose from intra-period lows, reflecting uncertainty around the scope and duration of the conflict and its implications for global growth. However, volatility later retracted as the risk of a broader regional military escalation appeared less likely. Global credit spreads widened only modestly before stabilizing near prior levels, supported by strong demand and resilient underlying fundamentals.
-
Top contributors to performance relative to the Blended Index:
-
The fund's fixed income segment was a primary contributor to relative performance, led by allocations to emerging markets debt and high yield credit.
-
The international equity segment also benefited the fund's relative performance, as the MFS Blended Research International Equity Fund outpaced its respective benchmark.
-
-
Top detractors from performance relative to the Blended Index:
-
Within the US equity segment, lagging relative performance across the majority of the strategies weighed on relative results as the funds generally underperformed their respective benchmarks. Style selection also held back relative performance as mid-cap growth and mid-cap core strategies underperformed the broader index.
-
FUND PERFORMANCE
The fund’s past performance is not a good predictor of the fund’s future performance. The graph and table below do not reflect the deduction of taxes that a shareholder would pay on fund distributions or the redemption of fund shares. The graph and table below assume reinvestment of dividends and capital gain distributions.
Growth of a Hypothetical $10,000 Investment
This graph shows the performance of a hypothetical $10,000 investment in Class R1 over a ten year period or since inception, if shorter, in comparison to (i) a broad measure of market performance and (ii) an additional index that MFS believes more closely reflects the market segments in which the fund invests.
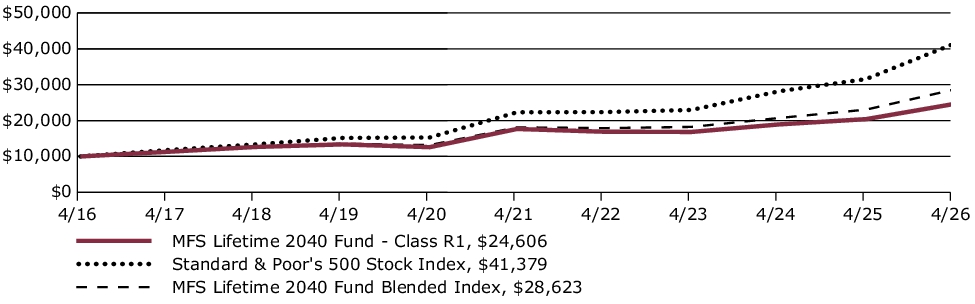
Average Annual Total Returns through 4/30/26
This table shows the average annual total returns of the class of shares noted for the periods shown, both with (if any) and without sales charges. It also shows the average annual total returns of (i) a broad measure of market performance and (ii) an additional index that MFS believes more closely reflects the market segments in which the fund invests, over the same periods.
| Share Class | 1-yr | 5-yr | 10-yr |
| R1 without sales charge | 20.55% | 6.86% | 9.42% |
| Comparative Benchmark(s) | |||
| Standard & Poor's 500 Stock Index ∆ | 31.05% | 13.14% | 15.26% |
| MFS Lifetime 2040 Fund Blended Index ∆ | 24.12% | 9.59% | 11.09% |
|
∆
|
Source: FactSet Research Systems Inc.
|
Visit mfs.com/perf/r1 for more recent performance information.
FUND STATISTICS AS OF 4/30/26
| Net Assets ($): | 833,670,262 | Total Management Fee ($)#: | 0 | |
| Total Number of Holdings: | 29 | Portfolio Turnover Rate (%): | 8 |
# The fund itself does not pay a management fee but the underlying funds in which the fund invests do pay management fees to MFS.
PORTFOLIO COMPOSITION (BASED ON TOTAL INVESTMENTS AS OF 4/30/26)
Portfolio allocation

Portfolio holdings
| MFS Blended Research Mid Cap Equity Fund | 8.9% |
| MFS Blended Research International Equity Fund | 8.5% |
| MFS Inflation-Adjusted Bond Fund | 5.0% |
| MFS Blended Research Value Equity Fund | 5.0% |
| MFS Value Fund | 4.9% |
| MFS Growth Fund | 4.7% |
| MFS Blended Research Growth Equity Fund | 4.6% |
| MFS Blended Research Core Equity Fund | 4.6% |
| MFS Research Fund | 4.6% |
| MFS Mid Cap Growth Fund | 4.5% |
| MFS Mid Cap Value Fund | 4.4% |
| MFS Global Real Estate Fund | 4.0% |
| MFS Commodity Strategy Fund | 3.9% |
| MFS High Income Fund | 3.9% |
| MFS Research International Fund | 3.5% |
| MFS Total Return Bond Fund | 3.4% |
| MFS Global Opportunistic Bond Fund | 3.1% |
| MFS Emerging Markets Debt Fund | 2.9% |
| MFS International Intrinsic Equity Fund | 2.4% |
| MFS International Growth Fund | 2.4% |
| MFS Blended Research Small Cap Equity Fund | 2.0% |
| MFS International New Discovery Fund | 2.0% |
| MFS Emerging Markets Debt Local Currency Fund | 2.0% |
| MFS New Discovery Fund | 1.0% |
| MFS New Discovery Value Fund | 1.0% |
| MFS Government Securities Fund | 0.9% |
| MFS Institutional Money Market Portfolio | 0.9% |
| MFS Blended Research Emerging Markets Equity Fund | 0.5% |
| MFS Emerging Markets Equity Fund | 0.5% |
FUND EXPENSES
What were the fund costs for the last year?
| (based on a hypothetical $10,000 investment) | ||
| Class Name | Costs of a $10,000 investment ~ | Costs paid as a percentage of a $10,000 investment ~ |
| R2 | $55 | 0.50% |
˜ Expenses are direct expenses and do not include underlying fund fees and expenses.
MANAGEMENT'S DISCUSSION OF FUND PERFORMANCE
-
For the twelve months ended April 30, 2026, Class R2 shares of the MFS Lifetime 2040 Fund (fund) provided a total return of 21.16%, at net asset value. This compares with a return of 31.05% for the fund’s benchmark, the Standard & Poor's 500 Stock Index. The fund's other benchmark, the MFS Lifetime 2040 Fund Blended Index (Blended Index), generated a return of 24.12%. The Blended Index reflects the blended returns of broad asset class indices, with percentage allocations to each index designed to resemble the long term strategic allocations of the fund. The market indices and related percentage allocations used to compile the Blended Index are set forth in the Fund Performance.
-
Global equity markets reached record levels during the period, withstanding considerable volatility amid tariffs, geopolitical conflict and high levels of uncertainty. A new geopolitical event distressed markets at the end of the period as US and Israeli forces launched strikes against Iran, disrupting Mideast oil and natural gas exports. During the period, a pro-growth tax and spending bill was signed into law in the US, while in Europe, renewed focus on defense and infrastructure spending brightened the economic outlook. In Japan, the election of a pro-growth prime minister sent stocks to new highs prior to the conflict in Iran. Optimism over artificial intelligence remained high.
-
Considerable progress was made in trade talks between the US and many major trading partners, with a fragile truce between the US and China extended through late 2026. While the US Supreme Court struck down part of the Trump administration’s tariff strategy, the administration began deploying other authorities to largely replace the ones that were ruled unconstitutional.
-
Early in the period, moderating inflation pressures allowed many global central banks to ease monetary policy. Amid a difficult policymaking environment and slower job growth, the Federal Reserve resumed easing policy in September and delivered quarter-point rate cuts in October and December before pausing.
-
In fixed income markets, previously range-bound global bond yields spiked following the onset of the Middle East conflict, as energy-driven inflation fears appeared to have rattled bond investors. US rate volatility (as measured by the Merrill Lynch Option Volatility Estimate (MOVE) Index) similarly rose from intra-period lows, reflecting uncertainty around the scope and duration of the conflict and its implications for global growth. However, volatility later retracted as the risk of a broader regional military escalation appeared less likely. Global credit spreads widened only modestly before stabilizing near prior levels, supported by strong demand and resilient underlying fundamentals.
-
Top contributors to performance relative to the Blended Index:
-
The fund's fixed income segment was a primary contributor to relative performance, led by allocations to emerging markets debt and high yield credit.
-
The international equity segment also benefited the fund's relative performance, as the MFS Blended Research International Equity Fund outpaced its respective benchmark.
-
-
Top detractors from performance relative to the Blended Index:
-
Within the US equity segment, lagging relative performance across the majority of the strategies weighed on relative results as the funds generally underperformed their respective benchmarks. Style selection also held back relative performance as mid-cap growth and mid-cap core strategies underperformed the broader index.
-
FUND PERFORMANCE
The fund’s past performance is not a good predictor of the fund’s future performance. The graph and table below do not reflect the deduction of taxes that a shareholder would pay on fund distributions or the redemption of fund shares. The graph and table below assume reinvestment of dividends and capital gain distributions.
Growth of a Hypothetical $10,000 Investment
This graph shows the performance of a hypothetical $10,000 investment in Class R2 over a ten year period or since inception, if shorter, in comparison to (i) a broad measure of market performance and (ii) an additional index that MFS believes more closely reflects the market segments in which the fund invests.
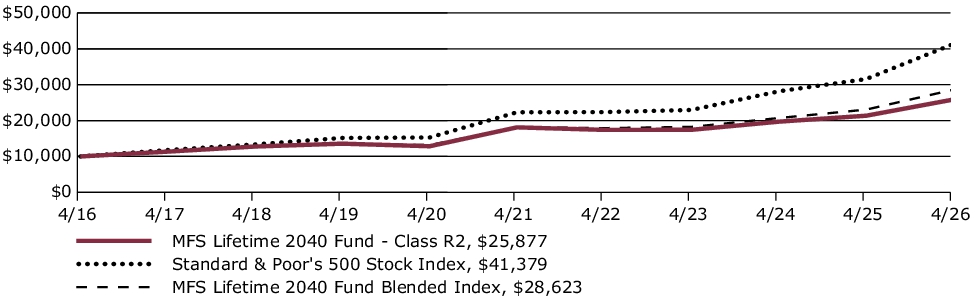
Average Annual Total Returns through 4/30/26
This table shows the average annual total returns of the class of shares noted for the periods shown, both with (if any) and without sales charges. It also shows the average annual total returns of (i) a broad measure of market performance and (ii) an additional index that MFS believes more closely reflects the market segments in which the fund invests, over the same periods.
| Share Class | 1-yr | 5-yr | 10-yr |
| R2 without sales charge | 21.16% | 7.40% | 9.97% |
| Comparative Benchmark(s) | |||
| Standard & Poor's 500 Stock Index ∆ | 31.05% | 13.14% | 15.26% |
| MFS Lifetime 2040 Fund Blended Index ∆ | 24.12% | 9.59% | 11.09% |
|
∆
|
Source: FactSet Research Systems Inc.
|
Visit mfs.com/perf/r2 for more recent performance information.
FUND STATISTICS AS OF 4/30/26
| Net Assets ($): | 833,670,262 | Total Management Fee ($)#: | 0 | |
| Total Number of Holdings: | 29 | Portfolio Turnover Rate (%): | 8 |
# The fund itself does not pay a management fee but the underlying funds in which the fund invests do pay management fees to MFS.
PORTFOLIO COMPOSITION (BASED ON TOTAL INVESTMENTS AS OF 4/30/26)
Portfolio allocation

Portfolio holdings
| MFS Blended Research Mid Cap Equity Fund | 8.9% |
| MFS Blended Research International Equity Fund | 8.5% |
| MFS Inflation-Adjusted Bond Fund | 5.0% |
| MFS Blended Research Value Equity Fund | 5.0% |
| MFS Value Fund | 4.9% |
| MFS Growth Fund | 4.7% |
| MFS Blended Research Growth Equity Fund | 4.6% |
| MFS Blended Research Core Equity Fund | 4.6% |
| MFS Research Fund | 4.6% |
| MFS Mid Cap Growth Fund | 4.5% |
| MFS Mid Cap Value Fund | 4.4% |
| MFS Global Real Estate Fund | 4.0% |
| MFS Commodity Strategy Fund | 3.9% |
| MFS High Income Fund | 3.9% |
| MFS Research International Fund | 3.5% |
| MFS Total Return Bond Fund | 3.4% |
| MFS Global Opportunistic Bond Fund | 3.1% |
| MFS Emerging Markets Debt Fund | 2.9% |
| MFS International Intrinsic Equity Fund | 2.4% |
| MFS International Growth Fund | 2.4% |
| MFS Blended Research Small Cap Equity Fund | 2.0% |
| MFS International New Discovery Fund | 2.0% |
| MFS Emerging Markets Debt Local Currency Fund | 2.0% |
| MFS New Discovery Fund | 1.0% |
| MFS New Discovery Value Fund | 1.0% |
| MFS Government Securities Fund | 0.9% |
| MFS Institutional Money Market Portfolio | 0.9% |
| MFS Blended Research Emerging Markets Equity Fund | 0.5% |
| MFS Emerging Markets Equity Fund | 0.5% |
FUND EXPENSES
What were the fund costs for the last year?
| (based on a hypothetical $10,000 investment) | ||
| Class Name | Costs of a $10,000 investment ~ | Costs paid as a percentage of a $10,000 investment ~ |
| R3 | $28 | 0.25% |
˜ Expenses are direct expenses and do not include underlying fund fees and expenses.
MANAGEMENT'S DISCUSSION OF FUND PERFORMANCE
-
For the twelve months ended April 30, 2026, Class R3 shares of the MFS Lifetime 2040 Fund (fund) provided a total return of 21.50%, at net asset value. This compares with a return of 31.05% for the fund’s benchmark, the Standard & Poor's 500 Stock Index. The fund's other benchmark, the MFS Lifetime 2040 Fund Blended Index (Blended Index), generated a return of 24.12%. The Blended Index reflects the blended returns of broad asset class indices, with percentage allocations to each index designed to resemble the long term strategic allocations of the fund. The market indices and related percentage allocations used to compile the Blended Index are set forth in the Fund Performance.
-
Global equity markets reached record levels during the period, withstanding considerable volatility amid tariffs, geopolitical conflict and high levels of uncertainty. A new geopolitical event distressed markets at the end of the period as US and Israeli forces launched strikes against Iran, disrupting Mideast oil and natural gas exports. During the period, a pro-growth tax and spending bill was signed into law in the US, while in Europe, renewed focus on defense and infrastructure spending brightened the economic outlook. In Japan, the election of a pro-growth prime minister sent stocks to new highs prior to the conflict in Iran. Optimism over artificial intelligence remained high.
-
Considerable progress was made in trade talks between the US and many major trading partners, with a fragile truce between the US and China extended through late 2026. While the US Supreme Court struck down part of the Trump administration’s tariff strategy, the administration began deploying other authorities to largely replace the ones that were ruled unconstitutional.
-
Early in the period, moderating inflation pressures allowed many global central banks to ease monetary policy. Amid a difficult policymaking environment and slower job growth, the Federal Reserve resumed easing policy in September and delivered quarter-point rate cuts in October and December before pausing.
-
In fixed income markets, previously range-bound global bond yields spiked following the onset of the Middle East conflict, as energy-driven inflation fears appeared to have rattled bond investors. US rate volatility (as measured by the Merrill Lynch Option Volatility Estimate (MOVE) Index) similarly rose from intra-period lows, reflecting uncertainty around the scope and duration of the conflict and its implications for global growth. However, volatility later retracted as the risk of a broader regional military escalation appeared less likely. Global credit spreads widened only modestly before stabilizing near prior levels, supported by strong demand and resilient underlying fundamentals.
-
Top contributors to performance relative to the Blended Index:
-
The fund's fixed income segment was a primary contributor to relative performance, led by allocations to emerging markets debt and high yield credit.
-
The international equity segment also benefited the fund's relative performance, as the MFS Blended Research International Equity Fund outpaced its respective benchmark.
-
-
Top detractors from performance relative to the Blended Index:
-
Within the US equity segment, lagging relative performance across the majority of the strategies weighed on relative results as the funds generally underperformed their respective benchmarks. Style selection also held back relative performance as mid-cap growth and mid-cap core strategies underperformed the broader index.
-
FUND PERFORMANCE
The fund’s past performance is not a good predictor of the fund’s future performance. The graph and table below do not reflect the deduction of taxes that a shareholder would pay on fund distributions or the redemption of fund shares. The graph and table below assume reinvestment of dividends and capital gain distributions.
Growth of a Hypothetical $10,000 Investment
This graph shows the performance of a hypothetical $10,000 investment in Class R3 over a ten year period or since inception, if shorter, in comparison to (i) a broad measure of market performance and (ii) an additional index that MFS believes more closely reflects the market segments in which the fund invests.
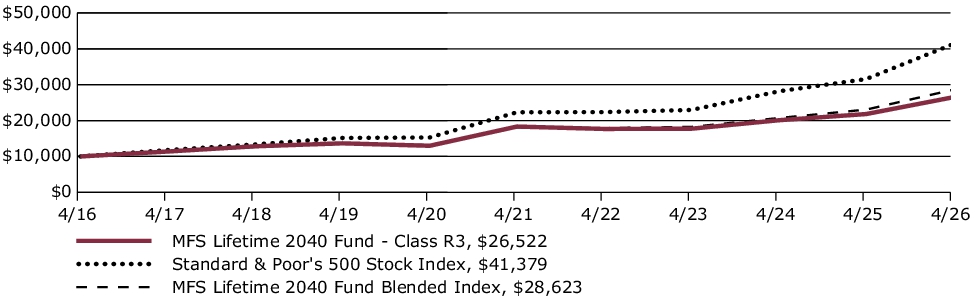
Average Annual Total Returns through 4/30/26
This table shows the average annual total returns of the class of shares noted for the periods shown, both with (if any) and without sales charges. It also shows the average annual total returns of (i) a broad measure of market performance and (ii) an additional index that MFS believes more closely reflects the market segments in which the fund invests, over the same periods.
| Share Class | 1-yr | 5-yr | 10-yr |
| R3 without sales charge | 21.50% | 7.66% | 10.25% |
| Comparative Benchmark(s) | |||
| Standard & Poor's 500 Stock Index ∆ | 31.05% | 13.14% | 15.26% |
| MFS Lifetime 2040 Fund Blended Index ∆ | 24.12% | 9.59% | 11.09% |
|
∆
|
Source: FactSet Research Systems Inc.
|
Visit mfs.com/perf/r3 for more recent performance information.
FUND STATISTICS AS OF 4/30/26
| Net Assets ($): | 833,670,262 | Total Management Fee ($)#: | 0 | |
| Total Number of Holdings: | 29 | Portfolio Turnover Rate (%): | 8 |
# The fund itself does not pay a management fee but the underlying funds in which the fund invests do pay management fees to MFS.
PORTFOLIO COMPOSITION (BASED ON TOTAL INVESTMENTS AS OF 4/30/26)
Portfolio allocation

Portfolio holdings
| MFS Blended Research Mid Cap Equity Fund | 8.9% |
| MFS Blended Research International Equity Fund | 8.5% |
| MFS Inflation-Adjusted Bond Fund | 5.0% |
| MFS Blended Research Value Equity Fund | 5.0% |
| MFS Value Fund | 4.9% |
| MFS Growth Fund | 4.7% |
| MFS Blended Research Growth Equity Fund | 4.6% |
| MFS Blended Research Core Equity Fund | 4.6% |
| MFS Research Fund | 4.6% |
| MFS Mid Cap Growth Fund | 4.5% |
| MFS Mid Cap Value Fund | 4.4% |
| MFS Global Real Estate Fund | 4.0% |
| MFS Commodity Strategy Fund | 3.9% |
| MFS High Income Fund | 3.9% |
| MFS Research International Fund | 3.5% |
| MFS Total Return Bond Fund | 3.4% |
| MFS Global Opportunistic Bond Fund | 3.1% |
| MFS Emerging Markets Debt Fund | 2.9% |
| MFS International Intrinsic Equity Fund | 2.4% |
| MFS International Growth Fund | 2.4% |
| MFS Blended Research Small Cap Equity Fund | 2.0% |
| MFS International New Discovery Fund | 2.0% |
| MFS Emerging Markets Debt Local Currency Fund | 2.0% |
| MFS New Discovery Fund | 1.0% |
| MFS New Discovery Value Fund | 1.0% |
| MFS Government Securities Fund | 0.9% |
| MFS Institutional Money Market Portfolio | 0.9% |
| MFS Blended Research Emerging Markets Equity Fund | 0.5% |
| MFS Emerging Markets Equity Fund | 0.5% |
FUND EXPENSES
What were the fund costs for the last year?
| (based on a hypothetical $10,000 investment) | ||
| Class Name | Costs of a $10,000 investment ~ | Costs paid as a percentage of a $10,000 investment ~ |
| R4 | $0 | 0.00% |
˜ Expenses are direct expenses and do not include underlying fund fees and expenses.
MANAGEMENT'S DISCUSSION OF FUND PERFORMANCE
-
For the twelve months ended April 30, 2026, Class R4 shares of the MFS Lifetime 2040 Fund (fund) provided a total return of 21.74%, at net asset value. This compares with a return of 31.05% for the fund’s benchmark, the Standard & Poor's 500 Stock Index. The fund's other benchmark, the MFS Lifetime 2040 Fund Blended Index (Blended Index), generated a return of 24.12%. The Blended Index reflects the blended returns of broad asset class indices, with percentage allocations to each index designed to resemble the long term strategic allocations of the fund. The market indices and related percentage allocations used to compile the Blended Index are set forth in the Fund Performance.
-
Global equity markets reached record levels during the period, withstanding considerable volatility amid tariffs, geopolitical conflict and high levels of uncertainty. A new geopolitical event distressed markets at the end of the period as US and Israeli forces launched strikes against Iran, disrupting Mideast oil and natural gas exports. During the period, a pro-growth tax and spending bill was signed into law in the US, while in Europe, renewed focus on defense and infrastructure spending brightened the economic outlook. In Japan, the election of a pro-growth prime minister sent stocks to new highs prior to the conflict in Iran. Optimism over artificial intelligence remained high.
-
Considerable progress was made in trade talks between the US and many major trading partners, with a fragile truce between the US and China extended through late 2026. While the US Supreme Court struck down part of the Trump administration’s tariff strategy, the administration began deploying other authorities to largely replace the ones that were ruled unconstitutional.
-
Early in the period, moderating inflation pressures allowed many global central banks to ease monetary policy. Amid a difficult policymaking environment and slower job growth, the Federal Reserve resumed easing policy in September and delivered quarter-point rate cuts in October and December before pausing.
-
In fixed income markets, previously range-bound global bond yields spiked following the onset of the Middle East conflict, as energy-driven inflation fears appeared to have rattled bond investors. US rate volatility (as measured by the Merrill Lynch Option Volatility Estimate (MOVE) Index) similarly rose from intra-period lows, reflecting uncertainty around the scope and duration of the conflict and its implications for global growth. However, volatility later retracted as the risk of a broader regional military escalation appeared less likely. Global credit spreads widened only modestly before stabilizing near prior levels, supported by strong demand and resilient underlying fundamentals.
-
Top contributors to performance relative to the Blended Index:
-
The fund's fixed income segment was a primary contributor to relative performance, led by allocations to emerging markets debt and high yield credit.
-
The international equity segment also benefited the fund's relative performance, as the MFS Blended Research International Equity Fund outpaced its respective benchmark.
-
-
Top detractors from performance relative to the Blended Index:
-
Within the US equity segment, lagging relative performance across the majority of the strategies weighed on relative results as the funds generally underperformed their respective benchmarks. Style selection also held back relative performance as mid-cap growth and mid-cap core strategies underperformed the broader index.
-
FUND PERFORMANCE
The fund’s past performance is not a good predictor of the fund’s future performance. The graph and table below do not reflect the deduction of taxes that a shareholder would pay on fund distributions or the redemption of fund shares. The graph and table below assume reinvestment of dividends and capital gain distributions.
Growth of a Hypothetical $10,000 Investment
This graph shows the performance of a hypothetical $10,000 investment in Class R4 over a ten year period or since inception, if shorter, in comparison to (i) a broad measure of market performance and (ii) an additional index that MFS believes more closely reflects the market segments in which the fund invests.
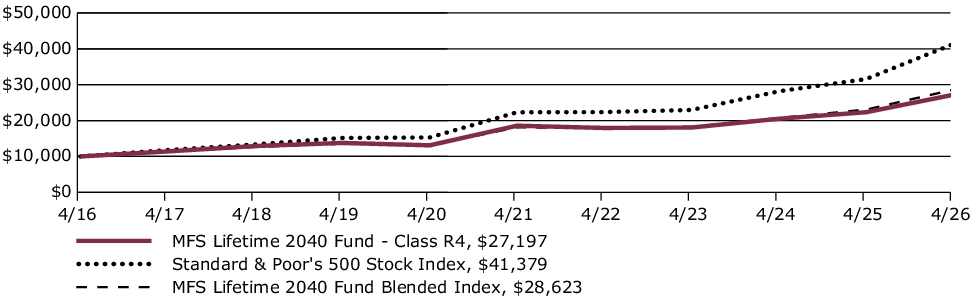
Average Annual Total Returns through 4/30/26
This table shows the average annual total returns of the class of shares noted for the periods shown, both with (if any) and without sales charges. It also shows the average annual total returns of (i) a broad measure of market performance and (ii) an additional index that MFS believes more closely reflects the market segments in which the fund invests, over the same periods.
| Share Class | 1-yr | 5-yr | 10-yr |
| R4 without sales charge | 21.74% | 7.93% | 10.52% |
| Comparative Benchmark(s) | |||
| Standard & Poor's 500 Stock Index ∆ | 31.05% | 13.14% | 15.26% |
| MFS Lifetime 2040 Fund Blended Index ∆ | 24.12% | 9.59% | 11.09% |
|
∆
|
Source: FactSet Research Systems Inc.
|
Visit mfs.com/perf/r4 for more recent performance information.
FUND STATISTICS AS OF 4/30/26
| Net Assets ($): | 833,670,262 | Total Management Fee ($)#: | 0 | |
| Total Number of Holdings: | 29 | Portfolio Turnover Rate (%): | 8 |
# The fund itself does not pay a management fee but the underlying funds in which the fund invests do pay management fees to MFS.
PORTFOLIO COMPOSITION (BASED ON TOTAL INVESTMENTS AS OF 4/30/26)
Portfolio allocation
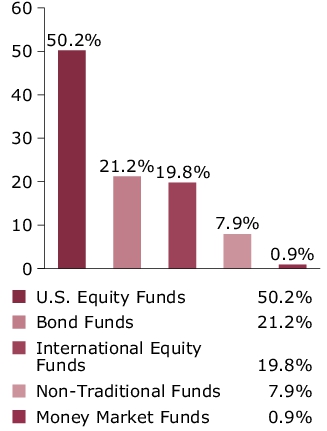
Portfolio holdings
| MFS Blended Research Mid Cap Equity Fund | 8.9% |
| MFS Blended Research International Equity Fund | 8.5% |
| MFS Inflation-Adjusted Bond Fund | 5.0% |
| MFS Blended Research Value Equity Fund | 5.0% |
| MFS Value Fund | 4.9% |
| MFS Growth Fund | 4.7% |
| MFS Blended Research Growth Equity Fund | 4.6% |
| MFS Blended Research Core Equity Fund | 4.6% |
| MFS Research Fund | 4.6% |
| MFS Mid Cap Growth Fund | 4.5% |
| MFS Mid Cap Value Fund | 4.4% |
| MFS Global Real Estate Fund | 4.0% |
| MFS Commodity Strategy Fund | 3.9% |
| MFS High Income Fund | 3.9% |
| MFS Research International Fund | 3.5% |
| MFS Total Return Bond Fund | 3.4% |
| MFS Global Opportunistic Bond Fund | 3.1% |
| MFS Emerging Markets Debt Fund | 2.9% |
| MFS International Intrinsic Equity Fund | 2.4% |
| MFS International Growth Fund | 2.4% |
| MFS Blended Research Small Cap Equity Fund | 2.0% |
| MFS International New Discovery Fund | 2.0% |
| MFS Emerging Markets Debt Local Currency Fund | 2.0% |
| MFS New Discovery Fund | 1.0% |
| MFS New Discovery Value Fund | 1.0% |
| MFS Government Securities Fund | 0.9% |
| MFS Institutional Money Market Portfolio | 0.9% |
| MFS Blended Research Emerging Markets Equity Fund | 0.5% |
| MFS Emerging Markets Equity Fund | 0.5% |
FUND EXPENSES
What were the fund costs for the last year?
| (based on a hypothetical $10,000 investment) | ||
| Class Name | Costs of a $10,000 investment ~ | Costs paid as a percentage of a $10,000 investment ~ |
| A | $26 | 0.24% |
˜ Expenses are direct expenses and do not include underlying fund fees and expenses.
MANAGEMENT'S DISCUSSION OF FUND PERFORMANCE
-
For the twelve months ended April 30, 2026, Class A shares of the MFS Lifetime 2030 Fund (fund) provided a total return of 12.60%, at net asset value. This compares with a return of 31.05% for the fund’s benchmark, the Standard & Poor's 500 Stock Index. The fund's other benchmark, the MFS Lifetime 2030 Fund Blended Index (Blended Index), generated a return of 14.05%. The Blended Index reflects the blended returns of broad asset class indices, with percentage allocations to each index designed to resemble the long term strategic allocations of the fund. The market indices and related percentage allocations used to compile the Blended Index are set forth in the Fund Performance.
-
Global equity markets reached record levels during the period, withstanding considerable volatility amid tariffs, geopolitical conflict and high levels of uncertainty. A new geopolitical event distressed markets at the end of the period as US and Israeli forces launched strikes against Iran, disrupting Mideast oil and natural gas exports. During the period, a pro-growth tax and spending bill was signed into law in the US, while in Europe, renewed focus on defense and infrastructure spending brightened the economic outlook. In Japan, the election of a pro-growth prime minister sent stocks to new highs prior to the conflict in Iran. Optimism over artificial intelligence remained high.
-
Considerable progress was made in trade talks between the US and many major trading partners, with a fragile truce between the US and China extended through late 2026. While the US Supreme Court struck down part of the Trump administration’s tariff strategy, the administration began deploying other authorities to largely replace the ones that were ruled unconstitutional.
-
Early in the period, moderating inflation pressures allowed many global central banks to ease monetary policy. Amid a difficult policymaking environment and slower job growth, the Federal Reserve resumed easing policy in September and delivered quarter-point rate cuts in October and December before pausing.
-
In fixed income markets, previously range-bound global bond yields spiked following the onset of the Middle East conflict, as energy-driven inflation fears appeared to have rattled bond investors. US rate volatility (as measured by the Merrill Lynch Option Volatility Estimate (MOVE) Index) similarly rose from intra-period lows, reflecting uncertainty around the scope and duration of the conflict and its implications for global growth. However, volatility later retracted as the risk of a broader regional military escalation appeared less likely. Global credit spreads widened only modestly before stabilizing near prior levels, supported by strong demand and resilient underlying fundamentals.
-
Top contributors to performance relative to the Blended Index:
-
The fund's fixed income segment was a primary contributor to relative performance, led by allocations to emerging markets debt and high yield credit.
-
The international equity segment also benefited the fund's relative performance, as the MFS Blended Research International Equity Fund outpaced its respective benchmark.
-
-
Top detractors from performance relative to the Blended Index:
-
Within the US equity segment, lagging relative performance across the majority of the strategies weighed on relative results as the funds generally underperformed their respective benchmarks. Style selection also held back relative performance as mid-cap growth and mid-cap core strategies underperformed the broader index.
-
FUND PERFORMANCE
The fund’s past performance is not a good predictor of the fund’s future performance. The graph and table below do not reflect the deduction of taxes that a shareholder would pay on fund distributions or the redemption of fund shares. The graph and table below assume reinvestment of dividends and capital gain distributions.
Growth of a Hypothetical $10,000 Investment
This graph shows the performance of a hypothetical $10,000 investment in Class A over a ten year period or since inception, if shorter, in comparison to (i) a broad measure of market performance and (ii) an additional index that MFS believes more closely reflects the market segments in which the fund invests. This graph includes the deduction of the maximum applicable sales charge.
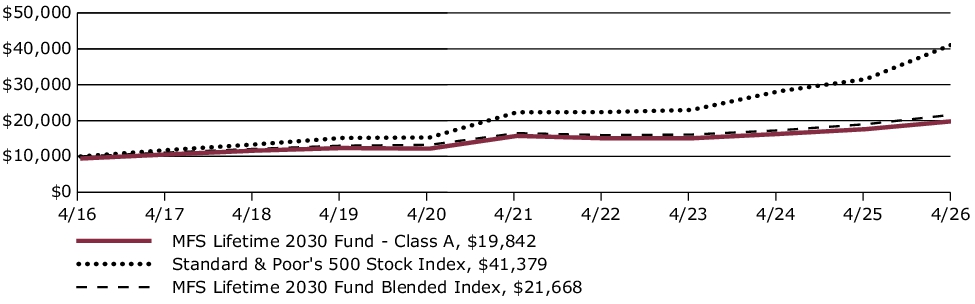
Average Annual Total Returns through 4/30/26
This table shows the average annual total returns of the class of shares noted for the periods shown, both with (if any) and without sales charges. It also shows the average annual total returns of (i) a broad measure of market performance and (ii) an additional index that MFS believes more closely reflects the market segments in which the fund invests, over the same periods.
| Share Class | 1-yr | 5-yr | 10-yr |
| A without sales charge | 12.60% | 4.75% | 7.73% |
| A with initial sales charge (5.75%) | 6.12% | 3.52% | 7.09% |
| Comparative Benchmark(s) | |||
| Standard & Poor's 500 Stock Index ∆ | 31.05% | 13.14% | 15.26% |
| MFS Lifetime 2030 Fund Blended Index ∆ | 14.05% | 5.59% | 8.04% |
|
∆
|
Source: FactSet Research Systems Inc.
|
Visit mfs.com/perf/a for more recent performance information.
FUND STATISTICS AS OF 4/30/26
| Net Assets ($): | 688,049,630 | Total Management Fee ($)#: | 0 | |
| Total Number of Holdings: | 27 | Portfolio Turnover Rate (%): | 5 |
# The fund itself does not pay a management fee but the underlying funds in which the fund invests do pay management fees to MFS.
PORTFOLIO COMPOSITION (BASED ON TOTAL INVESTMENTS AS OF 4/30/26)
Portfolio allocation

Portfolio holdings
| MFS Total Return Bond Fund | 15.3% |
| MFS Limited Maturity Fund | 10.9% |
| MFS Inflation-Adjusted Bond Fund | 9.9% |
| MFS Government Securities Fund | 9.8% |
| MFS Global Opportunistic Bond Fund | 6.9% |
| MFS Blended Research International Equity Fund | 4.2% |
| MFS Blended Research Mid Cap Equity Fund | 4.0% |
| MFS High Income Fund | 3.8% |
| MFS Blended Research Value Equity Fund | 3.0% |
| MFS Value Fund | 2.9% |
| MFS Growth Fund | 2.6% |
| MFS Blended Research Growth Equity Fund | 2.6% |
| MFS Blended Research Core Equity Fund | 2.6% |
| MFS Research Fund | 2.6% |
| MFS Research International Fund | 2.1% |
| MFS Global Real Estate Fund | 2.1% |
| MFS Commodity Strategy Fund | 2.0% |
| MFS Mid Cap Growth Fund | 2.0% |
| MFS Mid Cap Value Fund | 2.0% |
| MFS Emerging Markets Debt Fund | 1.9% |
| MFS Emerging Markets Debt Local Currency Fund | 1.9% |
| MFS Blended Research Small Cap Equity Fund | 1.0% |
| MFS International Intrinsic Equity Fund | 1.0% |
| MFS International Growth Fund | 1.0% |
| MFS Institutional Money Market Portfolio | 0.9% |
| MFS New Discovery Fund | 0.5% |
| MFS New Discovery Value Fund | 0.5% |
FUND EXPENSES
What were the fund costs for the last year?
| (based on a hypothetical $10,000 investment) | ||
| Class Name | Costs of a $10,000 investment ~ | Costs paid as a percentage of a $10,000 investment ~ |
| B | $105 | 0.99% |
˜ Expenses are direct expenses and do not include underlying fund fees and expenses.
MANAGEMENT'S DISCUSSION OF FUND PERFORMANCE
-
For the twelve months ended April 30, 2026, Class B shares of the MFS Lifetime 2030 Fund (fund) provided a total return of 11.75%, at net asset value. This compares with a return of 31.05% for the fund’s benchmark, the Standard & Poor's 500 Stock Index. The fund's other benchmark, the MFS Lifetime 2030 Fund Blended Index (Blended Index), generated a return of 14.05%. The Blended Index reflects the blended returns of broad asset class indices, with percentage allocations to each index designed to resemble the long term strategic allocations of the fund. The market indices and related percentage allocations used to compile the Blended Index are set forth in the Fund Performance.
-
Global equity markets reached record levels during the period, withstanding considerable volatility amid tariffs, geopolitical conflict and high levels of uncertainty. A new geopolitical event distressed markets at the end of the period as US and Israeli forces launched strikes against Iran, disrupting Mideast oil and natural gas exports. During the period, a pro-growth tax and spending bill was signed into law in the US, while in Europe, renewed focus on defense and infrastructure spending brightened the economic outlook. In Japan, the election of a pro-growth prime minister sent stocks to new highs prior to the conflict in Iran. Optimism over artificial intelligence remained high.
-
Considerable progress was made in trade talks between the US and many major trading partners, with a fragile truce between the US and China extended through late 2026. While the US Supreme Court struck down part of the Trump administration’s tariff strategy, the administration began deploying other authorities to largely replace the ones that were ruled unconstitutional.
-
Early in the period, moderating inflation pressures allowed many global central banks to ease monetary policy. Amid a difficult policymaking environment and slower job growth, the Federal Reserve resumed easing policy in September and delivered quarter-point rate cuts in October and December before pausing.
-
In fixed income markets, previously range-bound global bond yields spiked following the onset of the Middle East conflict, as energy-driven inflation fears appeared to have rattled bond investors. US rate volatility (as measured by the Merrill Lynch Option Volatility Estimate (MOVE) Index) similarly rose from intra-period lows, reflecting uncertainty around the scope and duration of the conflict and its implications for global growth. However, volatility later retracted as the risk of a broader regional military escalation appeared less likely. Global credit spreads widened only modestly before stabilizing near prior levels, supported by strong demand and resilient underlying fundamentals.
-
Top contributors to performance relative to the Blended Index:
-
The fund's fixed income segment was a primary contributor to relative performance, led by allocations to emerging markets debt and high yield credit.
-
The international equity segment also benefited the fund's relative performance, as the MFS Blended Research International Equity Fund outpaced its respective benchmark.
-
-
Top detractors from performance relative to the Blended Index:
-
Within the US equity segment, lagging relative performance across the majority of the strategies weighed on relative results as the funds generally underperformed their respective benchmarks. Style selection also held back relative performance as mid-cap growth and mid-cap core strategies underperformed the broader index.
-
FUND PERFORMANCE
The fund’s past performance is not a good predictor of the fund’s future performance. The graph and table below do not reflect the deduction of taxes that a shareholder would pay on fund distributions or the redemption of fund shares. The graph and table below assume reinvestment of dividends and capital gain distributions.
Growth of a Hypothetical $10,000 Investment
This graph shows the performance of a hypothetical $10,000 investment in Class B over a ten year period or since inception, if shorter, in comparison to (i) a broad measure of market performance and (ii) an additional index that MFS believes more closely reflects the market segments in which the fund invests.
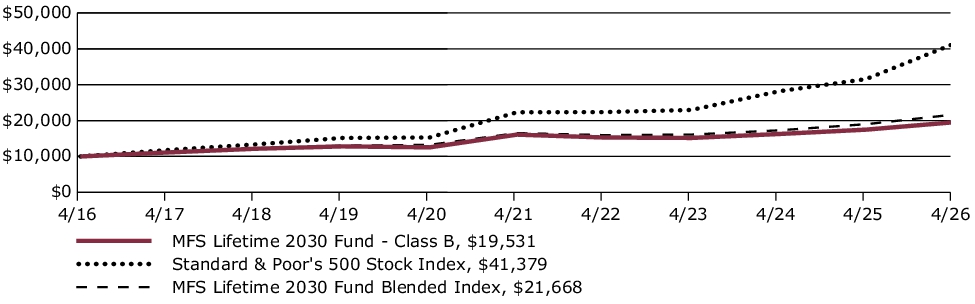
Average Annual Total Returns through 4/30/26
This table shows the average annual total returns of the class of shares noted for the periods shown, both with (if any) and without sales charges. It also shows the average annual total returns of (i) a broad measure of market performance and (ii) an additional index that MFS believes more closely reflects the market segments in which the fund invests, over the same periods.
| Share Class | 1-yr | 5-yr | 10-yr |
| B without sales charge | 11.75% | 3.96% | 6.92% |
| B with CDSC (declining over six years from 4% to 0%)× | 7.75% | 3.65% | 6.92% |
| Comparative Benchmark(s) | |||
| Standard & Poor's 500 Stock Index ∆ | 31.05% | 13.14% | 15.26% |
| MFS Lifetime 2030 Fund Blended Index ∆ | 14.05% | 5.59% | 8.04% |
|
∆
|
Source: FactSet Research Systems Inc.
|
|
×
|
Assuming redemption at the end of the applicable period.
|
Visit mfs.com/perf/b for more recent performance information.
FUND STATISTICS AS OF 4/30/26
| Net Assets ($): | 688,049,630 | Total Management Fee ($)#: | 0 | |
| Total Number of Holdings: | 27 | Portfolio Turnover Rate (%): | 5 |
# The fund itself does not pay a management fee but the underlying funds in which the fund invests do pay management fees to MFS.
PORTFOLIO COMPOSITION (BASED ON TOTAL INVESTMENTS AS OF 4/30/26)
Portfolio allocation

Portfolio holdings
| MFS Total Return Bond Fund | 15.3% |
| MFS Limited Maturity Fund | 10.9% |
| MFS Inflation-Adjusted Bond Fund | 9.9% |
| MFS Government Securities Fund | 9.8% |
| MFS Global Opportunistic Bond Fund | 6.9% |
| MFS Blended Research International Equity Fund | 4.2% |
| MFS Blended Research Mid Cap Equity Fund | 4.0% |
| MFS High Income Fund | 3.8% |
| MFS Blended Research Value Equity Fund | 3.0% |
| MFS Value Fund | 2.9% |
| MFS Growth Fund | 2.6% |
| MFS Blended Research Growth Equity Fund | 2.6% |
| MFS Blended Research Core Equity Fund | 2.6% |
| MFS Research Fund | 2.6% |
| MFS Research International Fund | 2.1% |
| MFS Global Real Estate Fund | 2.1% |
| MFS Commodity Strategy Fund | 2.0% |
| MFS Mid Cap Growth Fund | 2.0% |
| MFS Mid Cap Value Fund | 2.0% |
| MFS Emerging Markets Debt Fund | 1.9% |
| MFS Emerging Markets Debt Local Currency Fund | 1.9% |
| MFS Blended Research Small Cap Equity Fund | 1.0% |
| MFS International Intrinsic Equity Fund | 1.0% |
| MFS International Growth Fund | 1.0% |
| MFS Institutional Money Market Portfolio | 0.9% |
| MFS New Discovery Fund | 0.5% |
| MFS New Discovery Value Fund | 0.5% |
FUND EXPENSES
What were the fund costs for the last year?
| (based on a hypothetical $10,000 investment) | ||
| Class Name | Costs of a $10,000 investment ~ | Costs paid as a percentage of a $10,000 investment ~ |
| C | $105 | 0.99% |
˜ Expenses are direct expenses and do not include underlying fund fees and expenses.
MANAGEMENT'S DISCUSSION OF FUND PERFORMANCE
-
For the twelve months ended April 30, 2026, Class C shares of the MFS Lifetime 2030 Fund (fund) provided a total return of 11.79%, at net asset value. This compares with a return of 31.05% for the fund’s benchmark, the Standard & Poor's 500 Stock Index. The fund's other benchmark, the MFS Lifetime 2030 Fund Blended Index (Blended Index), generated a return of 14.05%. The Blended Index reflects the blended returns of broad asset class indices, with percentage allocations to each index designed to resemble the long term strategic allocations of the fund. The market indices and related percentage allocations used to compile the Blended Index are set forth in the Fund Performance.
-
Global equity markets reached record levels during the period, withstanding considerable volatility amid tariffs, geopolitical conflict and high levels of uncertainty. A new geopolitical event distressed markets at the end of the period as US and Israeli forces launched strikes against Iran, disrupting Mideast oil and natural gas exports. During the period, a pro-growth tax and spending bill was signed into law in the US, while in Europe, renewed focus on defense and infrastructure spending brightened the economic outlook. In Japan, the election of a pro-growth prime minister sent stocks to new highs prior to the conflict in Iran. Optimism over artificial intelligence remained high.
-
Considerable progress was made in trade talks between the US and many major trading partners, with a fragile truce between the US and China extended through late 2026. While the US Supreme Court struck down part of the Trump administration’s tariff strategy, the administration began deploying other authorities to largely replace the ones that were ruled unconstitutional.
-
Early in the period, moderating inflation pressures allowed many global central banks to ease monetary policy. Amid a difficult policymaking environment and slower job growth, the Federal Reserve resumed easing policy in September and delivered quarter-point rate cuts in October and December before pausing.
-
In fixed income markets, previously range-bound global bond yields spiked following the onset of the Middle East conflict, as energy-driven inflation fears appeared to have rattled bond investors. US rate volatility (as measured by the Merrill Lynch Option Volatility Estimate (MOVE) Index) similarly rose from intra-period lows, reflecting uncertainty around the scope and duration of the conflict and its implications for global growth. However, volatility later retracted as the risk of a broader regional military escalation appeared less likely. Global credit spreads widened only modestly before stabilizing near prior levels, supported by strong demand and resilient underlying fundamentals.
-
Top contributors to performance relative to the Blended Index:
-
The fund's fixed income segment was a primary contributor to relative performance, led by allocations to emerging markets debt and high yield credit.
-
The international equity segment also benefited the fund's relative performance, as the MFS Blended Research International Equity Fund outpaced its respective benchmark.
-
-
Top detractors from performance relative to the Blended Index:
-
Within the US equity segment, lagging relative performance across the majority of the strategies weighed on relative results as the funds generally underperformed their respective benchmarks. Style selection also held back relative performance as mid-cap growth and mid-cap core strategies underperformed the broader index.
-
FUND PERFORMANCE
The fund’s past performance is not a good predictor of the fund’s future performance. The graph and table below do not reflect the deduction of taxes that a shareholder would pay on fund distributions or the redemption of fund shares. The graph and table below assume reinvestment of dividends and capital gain distributions.
Growth of a Hypothetical $10,000 Investment
This graph shows the performance of a hypothetical $10,000 investment in Class C over a ten year period or since inception, if shorter, in comparison to (i) a broad measure of market performance and (ii) an additional index that MFS believes more closely reflects the market segments in which the fund invests.
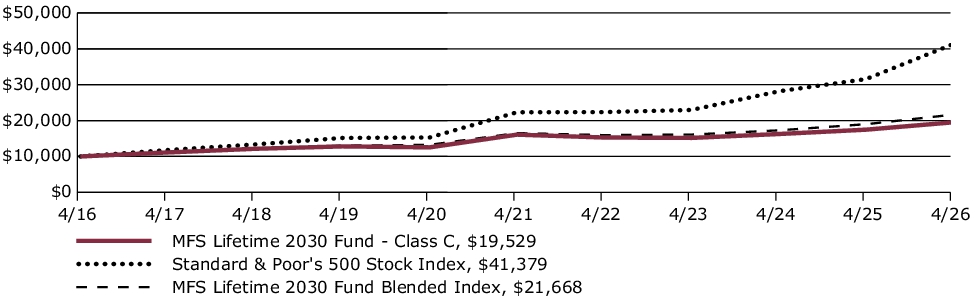
Average Annual Total Returns through 4/30/26
This table shows the average annual total returns of the class of shares noted for the periods shown, both with (if any) and without sales charges. It also shows the average annual total returns of (i) a broad measure of market performance and (ii) an additional index that MFS believes more closely reflects the market segments in which the fund invests, over the same periods.
| Share Class | 1-yr | 5-yr | 10-yr |
| C without sales charge | 11.79% | 3.96% | 6.92% |
| C with CDSC (1% for 12 months)× | 10.79% | 3.96% | 6.92% |
| Comparative Benchmark(s) | |||
| Standard & Poor's 500 Stock Index ∆ | 31.05% | 13.14% | 15.26% |
| MFS Lifetime 2030 Fund Blended Index ∆ | 14.05% | 5.59% | 8.04% |
|
∆
|
Source: FactSet Research Systems Inc.
|
|
×
|
Assuming redemption at the end of the applicable period.
|
Visit mfs.com/perf/c for more recent performance information.
FUND STATISTICS AS OF 4/30/26
| Net Assets ($): | 688,049,630 | Total Management Fee ($)#: | 0 | |
| Total Number of Holdings: | 27 | Portfolio Turnover Rate (%): | 5 |
# The fund itself does not pay a management fee but the underlying funds in which the fund invests do pay management fees to MFS.
PORTFOLIO COMPOSITION (BASED ON TOTAL INVESTMENTS AS OF 4/30/26)
Portfolio allocation

Portfolio holdings
| MFS Total Return Bond Fund | 15.3% |
| MFS Limited Maturity Fund | 10.9% |
| MFS Inflation-Adjusted Bond Fund | 9.9% |
| MFS Government Securities Fund | 9.8% |
| MFS Global Opportunistic Bond Fund | 6.9% |
| MFS Blended Research International Equity Fund | 4.2% |
| MFS Blended Research Mid Cap Equity Fund | 4.0% |
| MFS High Income Fund | 3.8% |
| MFS Blended Research Value Equity Fund | 3.0% |
| MFS Value Fund | 2.9% |
| MFS Growth Fund | 2.6% |
| MFS Blended Research Growth Equity Fund | 2.6% |
| MFS Blended Research Core Equity Fund | 2.6% |
| MFS Research Fund | 2.6% |
| MFS Research International Fund | 2.1% |
| MFS Global Real Estate Fund | 2.1% |
| MFS Commodity Strategy Fund | 2.0% |
| MFS Mid Cap Growth Fund | 2.0% |
| MFS Mid Cap Value Fund | 2.0% |
| MFS Emerging Markets Debt Fund | 1.9% |
| MFS Emerging Markets Debt Local Currency Fund | 1.9% |
| MFS Blended Research Small Cap Equity Fund | 1.0% |
| MFS International Intrinsic Equity Fund | 1.0% |
| MFS International Growth Fund | 1.0% |
| MFS Institutional Money Market Portfolio | 0.9% |
| MFS New Discovery Fund | 0.5% |
| MFS New Discovery Value Fund | 0.5% |
FUND EXPENSES
What were the fund costs for the last year?
| (based on a hypothetical $10,000 investment) | ||
| Class Name | Costs of a $10,000 investment ~ | Costs paid as a percentage of a $10,000 investment ~ |
| I | $0 | 0.00% |
˜ Expenses are direct expenses and do not include underlying fund fees and expenses.
MANAGEMENT'S DISCUSSION OF FUND PERFORMANCE
-
For the twelve months ended April 30, 2026, Class I shares of the MFS Lifetime 2030 Fund (fund) provided a total return of 12.85%, at net asset value. This compares with a return of 31.05% for the fund’s benchmark, the Standard & Poor's 500 Stock Index. The fund's other benchmark, the MFS Lifetime 2030 Fund Blended Index (Blended Index), generated a return of 14.05%. The Blended Index reflects the blended returns of broad asset class indices, with percentage allocations to each index designed to resemble the long term strategic allocations of the fund. The market indices and related percentage allocations used to compile the Blended Index are set forth in the Fund Performance.
-
Global equity markets reached record levels during the period, withstanding considerable volatility amid tariffs, geopolitical conflict and high levels of uncertainty. A new geopolitical event distressed markets at the end of the period as US and Israeli forces launched strikes against Iran, disrupting Mideast oil and natural gas exports. During the period, a pro-growth tax and spending bill was signed into law in the US, while in Europe, renewed focus on defense and infrastructure spending brightened the economic outlook. In Japan, the election of a pro-growth prime minister sent stocks to new highs prior to the conflict in Iran. Optimism over artificial intelligence remained high.
-
Considerable progress was made in trade talks between the US and many major trading partners, with a fragile truce between the US and China extended through late 2026. While the US Supreme Court struck down part of the Trump administration’s tariff strategy, the administration began deploying other authorities to largely replace the ones that were ruled unconstitutional.
-
Early in the period, moderating inflation pressures allowed many global central banks to ease monetary policy. Amid a difficult policymaking environment and slower job growth, the Federal Reserve resumed easing policy in September and delivered quarter-point rate cuts in October and December before pausing.
-
In fixed income markets, previously range-bound global bond yields spiked following the onset of the Middle East conflict, as energy-driven inflation fears appeared to have rattled bond investors. US rate volatility (as measured by the Merrill Lynch Option Volatility Estimate (MOVE) Index) similarly rose from intra-period lows, reflecting uncertainty around the scope and duration of the conflict and its implications for global growth. However, volatility later retracted as the risk of a broader regional military escalation appeared less likely. Global credit spreads widened only modestly before stabilizing near prior levels, supported by strong demand and resilient underlying fundamentals.
-
Top contributors to performance relative to the Blended Index:
-
The fund's fixed income segment was a primary contributor to relative performance, led by allocations to emerging markets debt and high yield credit.
-
The international equity segment also benefited the fund's relative performance, as the MFS Blended Research International Equity Fund outpaced its respective benchmark.
-
-
Top detractors from performance relative to the Blended Index:
-
Within the US equity segment, lagging relative performance across the majority of the strategies weighed on relative results as the funds generally underperformed their respective benchmarks. Style selection also held back relative performance as mid-cap growth and mid-cap core strategies underperformed the broader index.
-
FUND PERFORMANCE
The fund’s past performance is not a good predictor of the fund’s future performance. The graph and table below do not reflect the deduction of taxes that a shareholder would pay on fund distributions or the redemption of fund shares. The graph and table below assume reinvestment of dividends and capital gain distributions.
Growth of a Hypothetical $10,000 Investment
This graph shows the performance of a hypothetical $10,000 investment in Class I over a ten year period or since inception, if shorter, in comparison to (i) a broad measure of market performance and (ii) an additional index that MFS believes more closely reflects the market segments in which the fund invests.
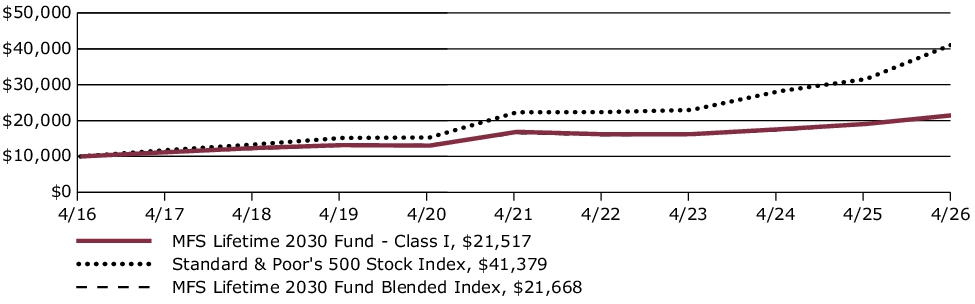
Average Annual Total Returns through 4/30/26
This table shows the average annual total returns of the class of shares noted for the periods shown, both with (if any) and without sales charges. It also shows the average annual total returns of (i) a broad measure of market performance and (ii) an additional index that MFS believes more closely reflects the market segments in which the fund invests, over the same periods.
| Share Class | 1-yr | 5-yr | 10-yr |
| I without sales charge | 12.85% | 5.00% | 7.96% |
| Comparative Benchmark(s) | |||
| Standard & Poor's 500 Stock Index ∆ | 31.05% | 13.14% | 15.26% |
| MFS Lifetime 2030 Fund Blended Index ∆ | 14.05% | 5.59% | 8.04% |
|
∆
|
Source: FactSet Research Systems Inc.
|
Visit mfs.com/perf/i for more recent performance information.
FUND STATISTICS AS OF 4/30/26
| Net Assets ($): | 688,049,630 | Total Management Fee ($)#: | 0 | |
| Total Number of Holdings: | 27 | Portfolio Turnover Rate (%): | 5 |
# The fund itself does not pay a management fee but the underlying funds in which the fund invests do pay management fees to MFS.
PORTFOLIO COMPOSITION (BASED ON TOTAL INVESTMENTS AS OF 4/30/26)
Portfolio allocation

Portfolio holdings
| MFS Total Return Bond Fund | 15.3% |
| MFS Limited Maturity Fund | 10.9% |
| MFS Inflation-Adjusted Bond Fund | 9.9% |
| MFS Government Securities Fund | 9.8% |
| MFS Global Opportunistic Bond Fund | 6.9% |
| MFS Blended Research International Equity Fund | 4.2% |
| MFS Blended Research Mid Cap Equity Fund | 4.0% |
| MFS High Income Fund | 3.8% |
| MFS Blended Research Value Equity Fund | 3.0% |
| MFS Value Fund | 2.9% |
| MFS Growth Fund | 2.6% |
| MFS Blended Research Growth Equity Fund | 2.6% |
| MFS Blended Research Core Equity Fund | 2.6% |
| MFS Research Fund | 2.6% |
| MFS Research International Fund | 2.1% |
| MFS Global Real Estate Fund | 2.1% |
| MFS Commodity Strategy Fund | 2.0% |
| MFS Mid Cap Growth Fund | 2.0% |
| MFS Mid Cap Value Fund | 2.0% |
| MFS Emerging Markets Debt Fund | 1.9% |
| MFS Emerging Markets Debt Local Currency Fund | 1.9% |
| MFS Blended Research Small Cap Equity Fund | 1.0% |
| MFS International Intrinsic Equity Fund | 1.0% |
| MFS International Growth Fund | 1.0% |
| MFS Institutional Money Market Portfolio | 0.9% |
| MFS New Discovery Fund | 0.5% |
| MFS New Discovery Value Fund | 0.5% |
FUND EXPENSES
What were the fund costs for the last year?
| (based on a hypothetical $10,000 investment) | ||
| Class Name | Costs of a $10,000 investment ~ | Costs paid as a percentage of a $10,000 investment ~ |
| R1 | $105 | 0.99% |
˜ Expenses are direct expenses and do not include underlying fund fees and expenses.
MANAGEMENT'S DISCUSSION OF FUND PERFORMANCE
-
For the twelve months ended April 30, 2026, Class R1 shares of the MFS Lifetime 2030 Fund (fund) provided a total return of 11.78%, at net asset value. This compares with a return of 31.05% for the fund’s benchmark, the Standard & Poor's 500 Stock Index. The fund's other benchmark, the MFS Lifetime 2030 Fund Blended Index (Blended Index), generated a return of 14.05%. The Blended Index reflects the blended returns of broad asset class indices, with percentage allocations to each index designed to resemble the long term strategic allocations of the fund. The market indices and related percentage allocations used to compile the Blended Index are set forth in the Fund Performance.
-
Global equity markets reached record levels during the period, withstanding considerable volatility amid tariffs, geopolitical conflict and high levels of uncertainty. A new geopolitical event distressed markets at the end of the period as US and Israeli forces launched strikes against Iran, disrupting Mideast oil and natural gas exports. During the period, a pro-growth tax and spending bill was signed into law in the US, while in Europe, renewed focus on defense and infrastructure spending brightened the economic outlook. In Japan, the election of a pro-growth prime minister sent stocks to new highs prior to the conflict in Iran. Optimism over artificial intelligence remained high.
-
Considerable progress was made in trade talks between the US and many major trading partners, with a fragile truce between the US and China extended through late 2026. While the US Supreme Court struck down part of the Trump administration’s tariff strategy, the administration began deploying other authorities to largely replace the ones that were ruled unconstitutional.
-
Early in the period, moderating inflation pressures allowed many global central banks to ease monetary policy. Amid a difficult policymaking environment and slower job growth, the Federal Reserve resumed easing policy in September and delivered quarter-point rate cuts in October and December before pausing.
-
In fixed income markets, previously range-bound global bond yields spiked following the onset of the Middle East conflict, as energy-driven inflation fears appeared to have rattled bond investors. US rate volatility (as measured by the Merrill Lynch Option Volatility Estimate (MOVE) Index) similarly rose from intra-period lows, reflecting uncertainty around the scope and duration of the conflict and its implications for global growth. However, volatility later retracted as the risk of a broader regional military escalation appeared less likely. Global credit spreads widened only modestly before stabilizing near prior levels, supported by strong demand and resilient underlying fundamentals.
-
Top contributors to performance relative to the Blended Index:
-
The fund's fixed income segment was a primary contributor to relative performance, led by allocations to emerging markets debt and high yield credit.
-
The international equity segment also benefited the fund's relative performance, as the MFS Blended Research International Equity Fund outpaced its respective benchmark.
-
-
Top detractors from performance relative to the Blended Index:
-
Within the US equity segment, lagging relative performance across the majority of the strategies weighed on relative results as the funds generally underperformed their respective benchmarks. Style selection also held back relative performance as mid-cap growth and mid-cap core strategies underperformed the broader index.
-
FUND PERFORMANCE
The fund’s past performance is not a good predictor of the fund’s future performance. The graph and table below do not reflect the deduction of taxes that a shareholder would pay on fund distributions or the redemption of fund shares. The graph and table below assume reinvestment of dividends and capital gain distributions.
Growth of a Hypothetical $10,000 Investment
This graph shows the performance of a hypothetical $10,000 investment in Class R1 over a ten year period or since inception, if shorter, in comparison to (i) a broad measure of market performance and (ii) an additional index that MFS believes more closely reflects the market segments in which the fund invests.

Average Annual Total Returns through 4/30/26
This table shows the average annual total returns of the class of shares noted for the periods shown, both with (if any) and without sales charges. It also shows the average annual total returns of (i) a broad measure of market performance and (ii) an additional index that MFS believes more closely reflects the market segments in which the fund invests, over the same periods.
| Share Class | 1-yr | 5-yr | 10-yr |
| R1 without sales charge | 11.78% | 3.96% | 6.92% |
| Comparative Benchmark(s) | |||
| Standard & Poor's 500 Stock Index ∆ | 31.05% | 13.14% | 15.26% |
| MFS Lifetime 2030 Fund Blended Index ∆ | 14.05% | 5.59% | 8.04% |
|
∆
|
Source: FactSet Research Systems Inc.
|
Visit mfs.com/perf/r1 for more recent performance information.
FUND STATISTICS AS OF 4/30/26
| Net Assets ($): | 688,049,630 | Total Management Fee ($)#: | 0 | |
| Total Number of Holdings: | 27 | Portfolio Turnover Rate (%): | 5 |
# The fund itself does not pay a management fee but the underlying funds in which the fund invests do pay management fees to MFS.
PORTFOLIO COMPOSITION (BASED ON TOTAL INVESTMENTS AS OF 4/30/26)
Portfolio allocation
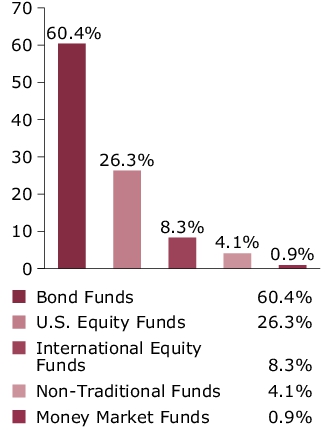
Portfolio holdings
| MFS Total Return Bond Fund | 15.3% |
| MFS Limited Maturity Fund | 10.9% |
| MFS Inflation-Adjusted Bond Fund | 9.9% |
| MFS Government Securities Fund | 9.8% |
| MFS Global Opportunistic Bond Fund | 6.9% |
| MFS Blended Research International Equity Fund | 4.2% |
| MFS Blended Research Mid Cap Equity Fund | 4.0% |
| MFS High Income Fund | 3.8% |
| MFS Blended Research Value Equity Fund | 3.0% |
| MFS Value Fund | 2.9% |
| MFS Growth Fund | 2.6% |
| MFS Blended Research Growth Equity Fund | 2.6% |
| MFS Blended Research Core Equity Fund | 2.6% |
| MFS Research Fund | 2.6% |
| MFS Research International Fund | 2.1% |
| MFS Global Real Estate Fund | 2.1% |
| MFS Commodity Strategy Fund | 2.0% |
| MFS Mid Cap Growth Fund | 2.0% |
| MFS Mid Cap Value Fund | 2.0% |
| MFS Emerging Markets Debt Fund | 1.9% |
| MFS Emerging Markets Debt Local Currency Fund | 1.9% |
| MFS Blended Research Small Cap Equity Fund | 1.0% |
| MFS International Intrinsic Equity Fund | 1.0% |
| MFS International Growth Fund | 1.0% |
| MFS Institutional Money Market Portfolio | 0.9% |
| MFS New Discovery Fund | 0.5% |
| MFS New Discovery Value Fund | 0.5% |
FUND EXPENSES
What were the fund costs for the last year?
| (based on a hypothetical $10,000 investment) | ||
| Class Name | Costs of a $10,000 investment ~ | Costs paid as a percentage of a $10,000 investment ~ |
| R2 | $52 | 0.49% |
˜ Expenses are direct expenses and do not include underlying fund fees and expenses.
MANAGEMENT'S DISCUSSION OF FUND PERFORMANCE
-
For the twelve months ended April 30, 2026, Class R2 shares of the MFS Lifetime 2030 Fund (fund) provided a total return of 12.27%, at net asset value. This compares with a return of 31.05% for the fund’s benchmark, the Standard & Poor's 500 Stock Index. The fund's other benchmark, the MFS Lifetime 2030 Fund Blended Index (Blended Index), generated a return of 14.05%. The Blended Index reflects the blended returns of broad asset class indices, with percentage allocations to each index designed to resemble the long term strategic allocations of the fund. The market indices and related percentage allocations used to compile the Blended Index are set forth in the Fund Performance.
-
Global equity markets reached record levels during the period, withstanding considerable volatility amid tariffs, geopolitical conflict and high levels of uncertainty. A new geopolitical event distressed markets at the end of the period as US and Israeli forces launched strikes against Iran, disrupting Mideast oil and natural gas exports. During the period, a pro-growth tax and spending bill was signed into law in the US, while in Europe, renewed focus on defense and infrastructure spending brightened the economic outlook. In Japan, the election of a pro-growth prime minister sent stocks to new highs prior to the conflict in Iran. Optimism over artificial intelligence remained high.
-
Considerable progress was made in trade talks between the US and many major trading partners, with a fragile truce between the US and China extended through late 2026. While the US Supreme Court struck down part of the Trump administration’s tariff strategy, the administration began deploying other authorities to largely replace the ones that were ruled unconstitutional.
-
Early in the period, moderating inflation pressures allowed many global central banks to ease monetary policy. Amid a difficult policymaking environment and slower job growth, the Federal Reserve resumed easing policy in September and delivered quarter-point rate cuts in October and December before pausing.
-
In fixed income markets, previously range-bound global bond yields spiked following the onset of the Middle East conflict, as energy-driven inflation fears appeared to have rattled bond investors. US rate volatility (as measured by the Merrill Lynch Option Volatility Estimate (MOVE) Index) similarly rose from intra-period lows, reflecting uncertainty around the scope and duration of the conflict and its implications for global growth. However, volatility later retracted as the risk of a broader regional military escalation appeared less likely. Global credit spreads widened only modestly before stabilizing near prior levels, supported by strong demand and resilient underlying fundamentals.
-
Top contributors to performance relative to the Blended Index:
-
The fund's fixed income segment was a primary contributor to relative performance, led by allocations to emerging markets debt and high yield credit.
-
The international equity segment also benefited the fund's relative performance, as the MFS Blended Research International Equity Fund outpaced its respective benchmark.
-
-
Top detractors from performance relative to the Blended Index:
-
Within the US equity segment, lagging relative performance across the majority of the strategies weighed on relative results as the funds generally underperformed their respective benchmarks. Style selection also held back relative performance as mid-cap growth and mid-cap core strategies underperformed the broader index.
-
FUND PERFORMANCE
The fund’s past performance is not a good predictor of the fund’s future performance. The graph and table below do not reflect the deduction of taxes that a shareholder would pay on fund distributions or the redemption of fund shares. The graph and table below assume reinvestment of dividends and capital gain distributions.
Growth of a Hypothetical $10,000 Investment
This graph shows the performance of a hypothetical $10,000 investment in Class R2 over a ten year period or since inception, if shorter, in comparison to (i) a broad measure of market performance and (ii) an additional index that MFS believes more closely reflects the market segments in which the fund invests.
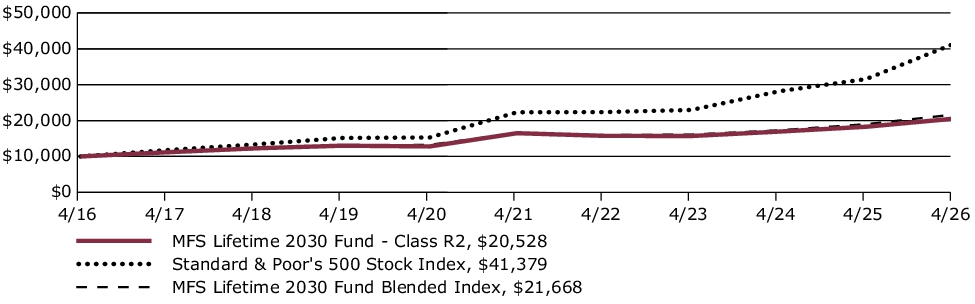
Average Annual Total Returns through 4/30/26
This table shows the average annual total returns of the class of shares noted for the periods shown, both with (if any) and without sales charges. It also shows the average annual total returns of (i) a broad measure of market performance and (ii) an additional index that MFS believes more closely reflects the market segments in which the fund invests, over the same periods.
| Share Class | 1-yr | 5-yr | 10-yr |
| R2 without sales charge | 12.27% | 4.48% | 7.46% |
| Comparative Benchmark(s) | |||
| Standard & Poor's 500 Stock Index ∆ | 31.05% | 13.14% | 15.26% |
| MFS Lifetime 2030 Fund Blended Index ∆ | 14.05% | 5.59% | 8.04% |
|
∆
|
Source: FactSet Research Systems Inc.
|
Visit mfs.com/perf/r2 for more recent performance information.
FUND STATISTICS AS OF 4/30/26
| Net Assets ($): | 688,049,630 | Total Management Fee ($)#: | 0 | |
| Total Number of Holdings: | 27 | Portfolio Turnover Rate (%): | 5 |
# The fund itself does not pay a management fee but the underlying funds in which the fund invests do pay management fees to MFS.
PORTFOLIO COMPOSITION (BASED ON TOTAL INVESTMENTS AS OF 4/30/26)
Portfolio allocation

Portfolio holdings
| MFS Total Return Bond Fund | 15.3% |
| MFS Limited Maturity Fund | 10.9% |
| MFS Inflation-Adjusted Bond Fund | 9.9% |
| MFS Government Securities Fund | 9.8% |
| MFS Global Opportunistic Bond Fund | 6.9% |
| MFS Blended Research International Equity Fund | 4.2% |
| MFS Blended Research Mid Cap Equity Fund | 4.0% |
| MFS High Income Fund | 3.8% |
| MFS Blended Research Value Equity Fund | 3.0% |
| MFS Value Fund | 2.9% |
| MFS Growth Fund | 2.6% |
| MFS Blended Research Growth Equity Fund | 2.6% |
| MFS Blended Research Core Equity Fund | 2.6% |
| MFS Research Fund | 2.6% |
| MFS Research International Fund | 2.1% |
| MFS Global Real Estate Fund | 2.1% |
| MFS Commodity Strategy Fund | 2.0% |
| MFS Mid Cap Growth Fund | 2.0% |
| MFS Mid Cap Value Fund | 2.0% |
| MFS Emerging Markets Debt Fund | 1.9% |
| MFS Emerging Markets Debt Local Currency Fund | 1.9% |
| MFS Blended Research Small Cap Equity Fund | 1.0% |
| MFS International Intrinsic Equity Fund | 1.0% |
| MFS International Growth Fund | 1.0% |
| MFS Institutional Money Market Portfolio | 0.9% |
| MFS New Discovery Fund | 0.5% |
| MFS New Discovery Value Fund | 0.5% |
FUND EXPENSES
What were the fund costs for the last year?
| (based on a hypothetical $10,000 investment) | ||
| Class Name | Costs of a $10,000 investment ~ | Costs paid as a percentage of a $10,000 investment ~ |
| R3 | $26 | 0.24% |
˜ Expenses are direct expenses and do not include underlying fund fees and expenses.
MANAGEMENT'S DISCUSSION OF FUND PERFORMANCE
-
For the twelve months ended April 30, 2026, Class R3 shares of the MFS Lifetime 2030 Fund (fund) provided a total return of 12.61%, at net asset value. This compares with a return of 31.05% for the fund’s benchmark, the Standard & Poor's 500 Stock Index. The fund's other benchmark, the MFS Lifetime 2030 Fund Blended Index (Blended Index), generated a return of 14.05%. The Blended Index reflects the blended returns of broad asset class indices, with percentage allocations to each index designed to resemble the long term strategic allocations of the fund. The market indices and related percentage allocations used to compile the Blended Index are set forth in the Fund Performance.
-
Global equity markets reached record levels during the period, withstanding considerable volatility amid tariffs, geopolitical conflict and high levels of uncertainty. A new geopolitical event distressed markets at the end of the period as US and Israeli forces launched strikes against Iran, disrupting Mideast oil and natural gas exports. During the period, a pro-growth tax and spending bill was signed into law in the US, while in Europe, renewed focus on defense and infrastructure spending brightened the economic outlook. In Japan, the election of a pro-growth prime minister sent stocks to new highs prior to the conflict in Iran. Optimism over artificial intelligence remained high.
-
Considerable progress was made in trade talks between the US and many major trading partners, with a fragile truce between the US and China extended through late 2026. While the US Supreme Court struck down part of the Trump administration’s tariff strategy, the administration began deploying other authorities to largely replace the ones that were ruled unconstitutional.
-
Early in the period, moderating inflation pressures allowed many global central banks to ease monetary policy. Amid a difficult policymaking environment and slower job growth, the Federal Reserve resumed easing policy in September and delivered quarter-point rate cuts in October and December before pausing.
-
In fixed income markets, previously range-bound global bond yields spiked following the onset of the Middle East conflict, as energy-driven inflation fears appeared to have rattled bond investors. US rate volatility (as measured by the Merrill Lynch Option Volatility Estimate (MOVE) Index) similarly rose from intra-period lows, reflecting uncertainty around the scope and duration of the conflict and its implications for global growth. However, volatility later retracted as the risk of a broader regional military escalation appeared less likely. Global credit spreads widened only modestly before stabilizing near prior levels, supported by strong demand and resilient underlying fundamentals.
-
Top contributors to performance relative to the Blended Index:
-
The fund's fixed income segment was a primary contributor to relative performance, led by allocations to emerging markets debt and high yield credit.
-
The international equity segment also benefited the fund's relative performance, as the MFS Blended Research International Equity Fund outpaced its respective benchmark.
-
-
Top detractors from performance relative to the Blended Index:
-
Within the US equity segment, lagging relative performance across the majority of the strategies weighed on relative results as the funds generally underperformed their respective benchmarks. Style selection also held back relative performance as mid-cap growth and mid-cap core strategies underperformed the broader index.
-
FUND PERFORMANCE
The fund’s past performance is not a good predictor of the fund’s future performance. The graph and table below do not reflect the deduction of taxes that a shareholder would pay on fund distributions or the redemption of fund shares. The graph and table below assume reinvestment of dividends and capital gain distributions.
Growth of a Hypothetical $10,000 Investment
This graph shows the performance of a hypothetical $10,000 investment in Class R3 over a ten year period or since inception, if shorter, in comparison to (i) a broad measure of market performance and (ii) an additional index that MFS believes more closely reflects the market segments in which the fund invests.
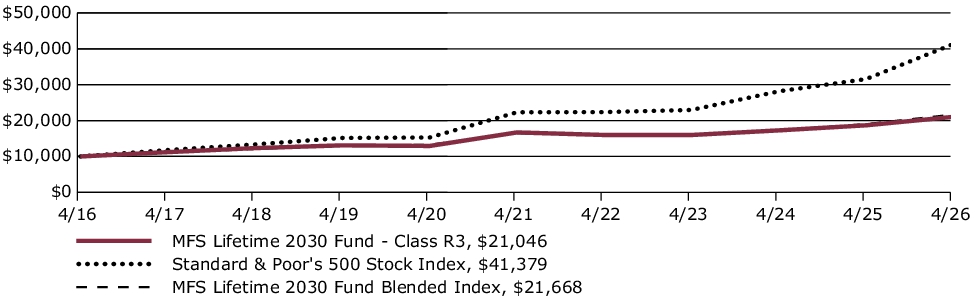
Average Annual Total Returns through 4/30/26
This table shows the average annual total returns of the class of shares noted for the periods shown, both with (if any) and without sales charges. It also shows the average annual total returns of (i) a broad measure of market performance and (ii) an additional index that MFS believes more closely reflects the market segments in which the fund invests, over the same periods.
| Share Class | 1-yr | 5-yr | 10-yr |
| R3 without sales charge | 12.61% | 4.74% | 7.72% |
| Comparative Benchmark(s) | |||
| Standard & Poor's 500 Stock Index ∆ | 31.05% | 13.14% | 15.26% |
| MFS Lifetime 2030 Fund Blended Index ∆ | 14.05% | 5.59% | 8.04% |
|
∆
|
Source: FactSet Research Systems Inc.
|
Visit mfs.com/perf/r3 for more recent performance information.
FUND STATISTICS AS OF 4/30/26
| Net Assets ($): | 688,049,630 | Total Management Fee ($)#: | 0 | |
| Total Number of Holdings: | 27 | Portfolio Turnover Rate (%): | 5 |
# The fund itself does not pay a management fee but the underlying funds in which the fund invests do pay management fees to MFS.
PORTFOLIO COMPOSITION (BASED ON TOTAL INVESTMENTS AS OF 4/30/26)
Portfolio allocation

Portfolio holdings
| MFS Total Return Bond Fund | 15.3% |
| MFS Limited Maturity Fund | 10.9% |
| MFS Inflation-Adjusted Bond Fund | 9.9% |
| MFS Government Securities Fund | 9.8% |
| MFS Global Opportunistic Bond Fund | 6.9% |
| MFS Blended Research International Equity Fund | 4.2% |
| MFS Blended Research Mid Cap Equity Fund | 4.0% |
| MFS High Income Fund | 3.8% |
| MFS Blended Research Value Equity Fund | 3.0% |
| MFS Value Fund | 2.9% |
| MFS Growth Fund | 2.6% |
| MFS Blended Research Growth Equity Fund | 2.6% |
| MFS Blended Research Core Equity Fund | 2.6% |
| MFS Research Fund | 2.6% |
| MFS Research International Fund | 2.1% |
| MFS Global Real Estate Fund | 2.1% |
| MFS Commodity Strategy Fund | 2.0% |
| MFS Mid Cap Growth Fund | 2.0% |
| MFS Mid Cap Value Fund | 2.0% |
| MFS Emerging Markets Debt Fund | 1.9% |
| MFS Emerging Markets Debt Local Currency Fund | 1.9% |
| MFS Blended Research Small Cap Equity Fund | 1.0% |
| MFS International Intrinsic Equity Fund | 1.0% |
| MFS International Growth Fund | 1.0% |
| MFS Institutional Money Market Portfolio | 0.9% |
| MFS New Discovery Fund | 0.5% |
| MFS New Discovery Value Fund | 0.5% |
FUND EXPENSES
What were the fund costs for the last year?
| (based on a hypothetical $10,000 investment) | ||
| Class Name | Costs of a $10,000 investment ~ | Costs paid as a percentage of a $10,000 investment ~ |
| R4 | $0 | 0.00% |
˜ Expenses are direct expenses and do not include underlying fund fees and expenses.
MANAGEMENT'S DISCUSSION OF FUND PERFORMANCE
-
For the twelve months ended April 30, 2026, Class R4 shares of the MFS Lifetime 2030 Fund (fund) provided a total return of 12.87%, at net asset value. This compares with a return of 31.05% for the fund’s benchmark, the Standard & Poor's 500 Stock Index. The fund's other benchmark, the MFS Lifetime 2030 Fund Blended Index (Blended Index), generated a return of 14.05%. The Blended Index reflects the blended returns of broad asset class indices, with percentage allocations to each index designed to resemble the long term strategic allocations of the fund. The market indices and related percentage allocations used to compile the Blended Index are set forth in the Fund Performance.
-
Global equity markets reached record levels during the period, withstanding considerable volatility amid tariffs, geopolitical conflict and high levels of uncertainty. A new geopolitical event distressed markets at the end of the period as US and Israeli forces launched strikes against Iran, disrupting Mideast oil and natural gas exports. During the period, a pro-growth tax and spending bill was signed into law in the US, while in Europe, renewed focus on defense and infrastructure spending brightened the economic outlook. In Japan, the election of a pro-growth prime minister sent stocks to new highs prior to the conflict in Iran. Optimism over artificial intelligence remained high.
-
Considerable progress was made in trade talks between the US and many major trading partners, with a fragile truce between the US and China extended through late 2026. While the US Supreme Court struck down part of the Trump administration’s tariff strategy, the administration began deploying other authorities to largely replace the ones that were ruled unconstitutional.
-
Early in the period, moderating inflation pressures allowed many global central banks to ease monetary policy. Amid a difficult policymaking environment and slower job growth, the Federal Reserve resumed easing policy in September and delivered quarter-point rate cuts in October and December before pausing.
-
In fixed income markets, previously range-bound global bond yields spiked following the onset of the Middle East conflict, as energy-driven inflation fears appeared to have rattled bond investors. US rate volatility (as measured by the Merrill Lynch Option Volatility Estimate (MOVE) Index) similarly rose from intra-period lows, reflecting uncertainty around the scope and duration of the conflict and its implications for global growth. However, volatility later retracted as the risk of a broader regional military escalation appeared less likely. Global credit spreads widened only modestly before stabilizing near prior levels, supported by strong demand and resilient underlying fundamentals.
-
Top contributors to performance relative to the Blended Index:
-
The fund's fixed income segment was a primary contributor to relative performance, led by allocations to emerging markets debt and high yield credit.
-
The international equity segment also benefited the fund's relative performance, as the MFS Blended Research International Equity Fund outpaced its respective benchmark.
-
-
Top detractors from performance relative to the Blended Index:
-
Within the US equity segment, lagging relative performance across the majority of the strategies weighed on relative results as the funds generally underperformed their respective benchmarks. Style selection also held back relative performance as mid-cap growth and mid-cap core strategies underperformed the broader index.
-
FUND PERFORMANCE
The fund’s past performance is not a good predictor of the fund’s future performance. The graph and table below do not reflect the deduction of taxes that a shareholder would pay on fund distributions or the redemption of fund shares. The graph and table below assume reinvestment of dividends and capital gain distributions.
Growth of a Hypothetical $10,000 Investment
This graph shows the performance of a hypothetical $10,000 investment in Class R4 over a ten year period or since inception, if shorter, in comparison to (i) a broad measure of market performance and (ii) an additional index that MFS believes more closely reflects the market segments in which the fund invests.
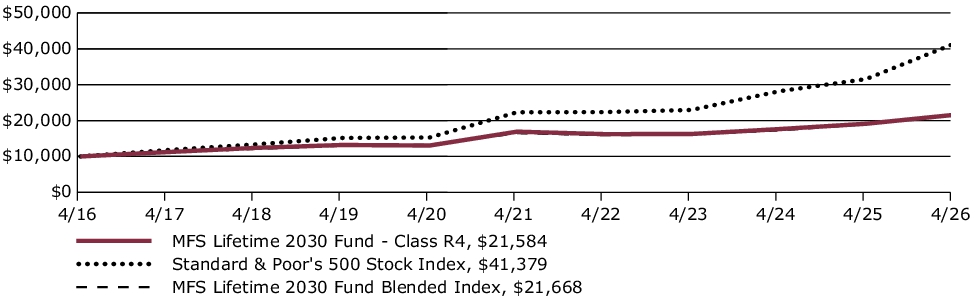
Average Annual Total Returns through 4/30/26
This table shows the average annual total returns of the class of shares noted for the periods shown, both with (if any) and without sales charges. It also shows the average annual total returns of (i) a broad measure of market performance and (ii) an additional index that MFS believes more closely reflects the market segments in which the fund invests, over the same periods.
| Share Class | 1-yr | 5-yr | 10-yr |
| R4 without sales charge | 12.87% | 5.01% | 8.00% |
| Comparative Benchmark(s) | |||
| Standard & Poor's 500 Stock Index ∆ | 31.05% | 13.14% | 15.26% |
| MFS Lifetime 2030 Fund Blended Index ∆ | 14.05% | 5.59% | 8.04% |
|
∆
|
Source: FactSet Research Systems Inc.
|
Visit mfs.com/perf/r4 for more recent performance information.
FUND STATISTICS AS OF 4/30/26
| Net Assets ($): | 688,049,630 | Total Management Fee ($)#: | 0 | |
| Total Number of Holdings: | 27 | Portfolio Turnover Rate (%): | 5 |
# The fund itself does not pay a management fee but the underlying funds in which the fund invests do pay management fees to MFS.
PORTFOLIO COMPOSITION (BASED ON TOTAL INVESTMENTS AS OF 4/30/26)
Portfolio allocation

Portfolio holdings
| MFS Total Return Bond Fund | 15.3% |
| MFS Limited Maturity Fund | 10.9% |
| MFS Inflation-Adjusted Bond Fund | 9.9% |
| MFS Government Securities Fund | 9.8% |
| MFS Global Opportunistic Bond Fund | 6.9% |
| MFS Blended Research International Equity Fund | 4.2% |
| MFS Blended Research Mid Cap Equity Fund | 4.0% |
| MFS High Income Fund | 3.8% |
| MFS Blended Research Value Equity Fund | 3.0% |
| MFS Value Fund | 2.9% |
| MFS Growth Fund | 2.6% |
| MFS Blended Research Growth Equity Fund | 2.6% |
| MFS Blended Research Core Equity Fund | 2.6% |
| MFS Research Fund | 2.6% |
| MFS Research International Fund | 2.1% |
| MFS Global Real Estate Fund | 2.1% |
| MFS Commodity Strategy Fund | 2.0% |
| MFS Mid Cap Growth Fund | 2.0% |
| MFS Mid Cap Value Fund | 2.0% |
| MFS Emerging Markets Debt Fund | 1.9% |
| MFS Emerging Markets Debt Local Currency Fund | 1.9% |
| MFS Blended Research Small Cap Equity Fund | 1.0% |
| MFS International Intrinsic Equity Fund | 1.0% |
| MFS International Growth Fund | 1.0% |
| MFS Institutional Money Market Portfolio | 0.9% |
| MFS New Discovery Fund | 0.5% |
| MFS New Discovery Value Fund | 0.5% |
FUND EXPENSES
What were the fund costs for the last year?
| (based on a hypothetical $10,000 investment) | ||
| Class Name | Costs of a $10,000 investment ~ | Costs paid as a percentage of a $10,000 investment ~ |
| R6 | $0 | 0.00% |
˜ Expenses are direct expenses and do not include underlying fund fees and expenses.
MANAGEMENT'S DISCUSSION OF FUND PERFORMANCE
-
For the twelve months ended April 30, 2026, Class R6 shares of the MFS Lifetime 2030 Fund (fund) provided a total return of 12.97%, at net asset value. This compares with a return of 31.05% for the fund’s benchmark, the Standard & Poor's 500 Stock Index. The fund's other benchmark, the MFS Lifetime 2030 Fund Blended Index (Blended Index), generated a return of 14.05%. The Blended Index reflects the blended returns of broad asset class indices, with percentage allocations to each index designed to resemble the long term strategic allocations of the fund. The market indices and related percentage allocations used to compile the Blended Index are set forth in the Fund Performance.
-
Global equity markets reached record levels during the period, withstanding considerable volatility amid tariffs, geopolitical conflict and high levels of uncertainty. A new geopolitical event distressed markets at the end of the period as US and Israeli forces launched strikes against Iran, disrupting Mideast oil and natural gas exports. During the period, a pro-growth tax and spending bill was signed into law in the US, while in Europe, renewed focus on defense and infrastructure spending brightened the economic outlook. In Japan, the election of a pro-growth prime minister sent stocks to new highs prior to the conflict in Iran. Optimism over artificial intelligence remained high.
-
Considerable progress was made in trade talks between the US and many major trading partners, with a fragile truce between the US and China extended through late 2026. While the US Supreme Court struck down part of the Trump administration’s tariff strategy, the administration began deploying other authorities to largely replace the ones that were ruled unconstitutional.
-
Early in the period, moderating inflation pressures allowed many global central banks to ease monetary policy. Amid a difficult policymaking environment and slower job growth, the Federal Reserve resumed easing policy in September and delivered quarter-point rate cuts in October and December before pausing.
-
In fixed income markets, previously range-bound global bond yields spiked following the onset of the Middle East conflict, as energy-driven inflation fears appeared to have rattled bond investors. US rate volatility (as measured by the Merrill Lynch Option Volatility Estimate (MOVE) Index) similarly rose from intra-period lows, reflecting uncertainty around the scope and duration of the conflict and its implications for global growth. However, volatility later retracted as the risk of a broader regional military escalation appeared less likely. Global credit spreads widened only modestly before stabilizing near prior levels, supported by strong demand and resilient underlying fundamentals.
-
Top contributors to performance relative to the Blended Index:
-
The fund's fixed income segment was a primary contributor to relative performance, led by allocations to emerging markets debt and high yield credit.
-
The international equity segment also benefited the fund's relative performance, as the MFS Blended Research International Equity Fund outpaced its respective benchmark.
-
-
Top detractors from performance relative to the Blended Index:
-
Within the US equity segment, lagging relative performance across the majority of the strategies weighed on relative results as the funds generally underperformed their respective benchmarks. Style selection also held back relative performance as mid-cap growth and mid-cap core strategies underperformed the broader index.
-
FUND PERFORMANCE
The fund’s past performance is not a good predictor of the fund’s future performance. The graph and table below do not reflect the deduction of taxes that a shareholder would pay on fund distributions or the redemption of fund shares. The graph and table below assume reinvestment of dividends and capital gain distributions.
Growth of a Hypothetical $10,000 Investment*
This graph shows the performance of a hypothetical $10,000 investment in Class R6 over a ten year period or since inception, if shorter, in comparison to (i) a broad measure of market performance and (ii) an additional index that MFS believes more closely reflects the market segments in which the fund invests.
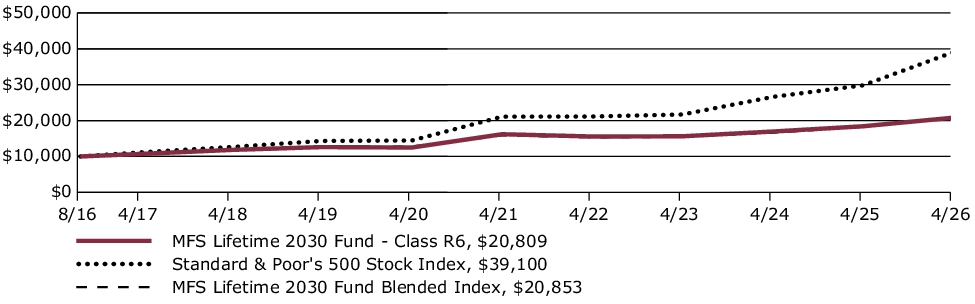
Average Annual Total Returns through 4/30/26
This table shows the average annual total returns of the class of shares noted for the periods shown, both with (if any) and without sales charges. It also shows the average annual total returns of (i) a broad measure of market performance and (ii) an additional index that MFS believes more closely reflects the market segments in which the fund invests, over the same periods.
| Share Class | 1-yr | 5-yr | Life* |
| R6 without sales charge | 12.97% | 5.14% | 7.86% |
| Comparative Benchmark(s) | |||
| Standard & Poor's 500 Stock Index ∆ | 31.05% | 13.14% | 15.13% |
| MFS Lifetime 2030 Fund Blended Index ∆ | 14.05% | 5.59% | 7.89% |
|
*
|
For the period from the commencement of the class's investment operations, August 29, 2016 through April 30, 2026.
|
|
∆
|
Source: FactSet Research Systems Inc.
|
Visit mfs.com/perf/r6 for more recent performance information.
FUND STATISTICS AS OF 4/30/26
| Net Assets ($): | 688,049,630 | Total Management Fee ($)#: | 0 | |
| Total Number of Holdings: | 27 | Portfolio Turnover Rate (%): | 5 |
# The fund itself does not pay a management fee but the underlying funds in which the fund invests do pay management fees to MFS.
PORTFOLIO COMPOSITION (BASED ON TOTAL INVESTMENTS AS OF 4/30/26)
Portfolio allocation

Portfolio holdings
| MFS Total Return Bond Fund | 15.3% |
| MFS Limited Maturity Fund | 10.9% |
| MFS Inflation-Adjusted Bond Fund | 9.9% |
| MFS Government Securities Fund | 9.8% |
| MFS Global Opportunistic Bond Fund | 6.9% |
| MFS Blended Research International Equity Fund | 4.2% |
| MFS Blended Research Mid Cap Equity Fund | 4.0% |
| MFS High Income Fund | 3.8% |
| MFS Blended Research Value Equity Fund | 3.0% |
| MFS Value Fund | 2.9% |
| MFS Growth Fund | 2.6% |
| MFS Blended Research Growth Equity Fund | 2.6% |
| MFS Blended Research Core Equity Fund | 2.6% |
| MFS Research Fund | 2.6% |
| MFS Research International Fund | 2.1% |
| MFS Global Real Estate Fund | 2.1% |
| MFS Commodity Strategy Fund | 2.0% |
| MFS Mid Cap Growth Fund | 2.0% |
| MFS Mid Cap Value Fund | 2.0% |
| MFS Emerging Markets Debt Fund | 1.9% |
| MFS Emerging Markets Debt Local Currency Fund | 1.9% |
| MFS Blended Research Small Cap Equity Fund | 1.0% |
| MFS International Intrinsic Equity Fund | 1.0% |
| MFS International Growth Fund | 1.0% |
| MFS Institutional Money Market Portfolio | 0.9% |
| MFS New Discovery Fund | 0.5% |
| MFS New Discovery Value Fund | 0.5% |
FUND EXPENSES
What were the fund costs for the last year?
| (based on a hypothetical $10,000 investment) | ||
| Class Name | Costs of a $10,000 investment ~ | Costs paid as a percentage of a $10,000 investment ~ |
| R6 | $0 | 0.00% |
˜ Expenses are direct expenses and do not include underlying fund fees and expenses.
MANAGEMENT'S DISCUSSION OF FUND PERFORMANCE
-
For the twelve months ended April 30, 2026, Class R6 shares of the MFS Lifetime 2040 Fund (fund) provided a total return of 21.91%, at net asset value. This compares with a return of 31.05% for the fund’s benchmark, the Standard & Poor's 500 Stock Index. The fund's other benchmark, the MFS Lifetime 2040 Fund Blended Index (Blended Index), generated a return of 24.12%. The Blended Index reflects the blended returns of broad asset class indices, with percentage allocations to each index designed to resemble the long term strategic allocations of the fund. The market indices and related percentage allocations used to compile the Blended Index are set forth in the Fund Performance.
-
Global equity markets reached record levels during the period, withstanding considerable volatility amid tariffs, geopolitical conflict and high levels of uncertainty. A new geopolitical event distressed markets at the end of the period as US and Israeli forces launched strikes against Iran, disrupting Mideast oil and natural gas exports. During the period, a pro-growth tax and spending bill was signed into law in the US, while in Europe, renewed focus on defense and infrastructure spending brightened the economic outlook. In Japan, the election of a pro-growth prime minister sent stocks to new highs prior to the conflict in Iran. Optimism over artificial intelligence remained high.
-
Considerable progress was made in trade talks between the US and many major trading partners, with a fragile truce between the US and China extended through late 2026. While the US Supreme Court struck down part of the Trump administration’s tariff strategy, the administration began deploying other authorities to largely replace the ones that were ruled unconstitutional.
-
Early in the period, moderating inflation pressures allowed many global central banks to ease monetary policy. Amid a difficult policymaking environment and slower job growth, the Federal Reserve resumed easing policy in September and delivered quarter-point rate cuts in October and December before pausing.
-
In fixed income markets, previously range-bound global bond yields spiked following the onset of the Middle East conflict, as energy-driven inflation fears appeared to have rattled bond investors. US rate volatility (as measured by the Merrill Lynch Option Volatility Estimate (MOVE) Index) similarly rose from intra-period lows, reflecting uncertainty around the scope and duration of the conflict and its implications for global growth. However, volatility later retracted as the risk of a broader regional military escalation appeared less likely. Global credit spreads widened only modestly before stabilizing near prior levels, supported by strong demand and resilient underlying fundamentals.
-
Top contributors to performance relative to the Blended Index:
-
The fund's fixed income segment was a primary contributor to relative performance, led by allocations to emerging markets debt and high yield credit.
-
The international equity segment also benefited the fund's relative performance, as the MFS Blended Research International Equity Fund outpaced its respective benchmark.
-
-
Top detractors from performance relative to the Blended Index:
-
Within the US equity segment, lagging relative performance across the majority of the strategies weighed on relative results as the funds generally underperformed their respective benchmarks. Style selection also held back relative performance as mid-cap growth and mid-cap core strategies underperformed the broader index.
-
FUND PERFORMANCE
The fund’s past performance is not a good predictor of the fund’s future performance. The graph and table below do not reflect the deduction of taxes that a shareholder would pay on fund distributions or the redemption of fund shares. The graph and table below assume reinvestment of dividends and capital gain distributions.
Growth of a Hypothetical $10,000 Investment*
This graph shows the performance of a hypothetical $10,000 investment in Class R6 over a ten year period or since inception, if shorter, in comparison to (i) a broad measure of market performance and (ii) an additional index that MFS believes more closely reflects the market segments in which the fund invests.
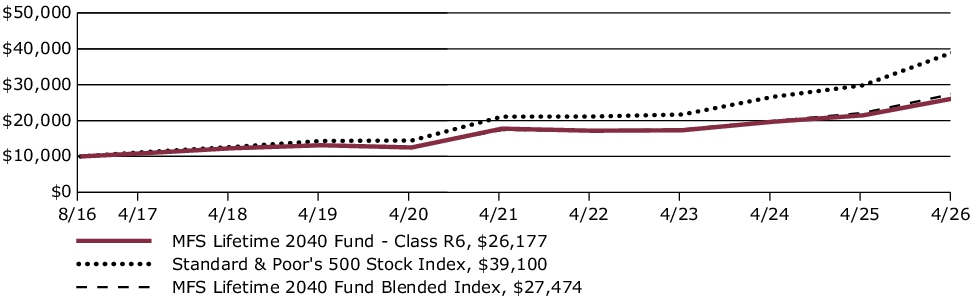
Average Annual Total Returns through 4/30/26
This table shows the average annual total returns of the class of shares noted for the periods shown, both with (if any) and without sales charges. It also shows the average annual total returns of (i) a broad measure of market performance and (ii) an additional index that MFS believes more closely reflects the market segments in which the fund invests, over the same periods.
| Share Class | 1-yr | 5-yr | Life* |
| R6 without sales charge | 21.91% | 8.08% | 10.45% |
| Comparative Benchmark(s) | |||
| Standard & Poor's 500 Stock Index ∆ | 31.05% | 13.14% | 15.13% |
| MFS Lifetime 2040 Fund Blended Index ∆ | 24.12% | 9.59% | 11.01% |
|
*
|
For the period from the commencement of the class's investment operations, August 29, 2016 through April 30, 2026.
|
|
∆
|
Source: FactSet Research Systems Inc.
|
Visit mfs.com/perf/r6 for more recent performance information.
FUND STATISTICS AS OF 4/30/26
| Net Assets ($): | 833,670,262 | Total Management Fee ($)#: | 0 | |
| Total Number of Holdings: | 29 | Portfolio Turnover Rate (%): | 8 |
# The fund itself does not pay a management fee but the underlying funds in which the fund invests do pay management fees to MFS.
PORTFOLIO COMPOSITION (BASED ON TOTAL INVESTMENTS AS OF 4/30/26)
Portfolio allocation

Portfolio holdings
| MFS Blended Research Mid Cap Equity Fund | 8.9% |
| MFS Blended Research International Equity Fund | 8.5% |
| MFS Inflation-Adjusted Bond Fund | 5.0% |
| MFS Blended Research Value Equity Fund | 5.0% |
| MFS Value Fund | 4.9% |
| MFS Growth Fund | 4.7% |
| MFS Blended Research Growth Equity Fund | 4.6% |
| MFS Blended Research Core Equity Fund | 4.6% |
| MFS Research Fund | 4.6% |
| MFS Mid Cap Growth Fund | 4.5% |
| MFS Mid Cap Value Fund | 4.4% |
| MFS Global Real Estate Fund | 4.0% |
| MFS Commodity Strategy Fund | 3.9% |
| MFS High Income Fund | 3.9% |
| MFS Research International Fund | 3.5% |
| MFS Total Return Bond Fund | 3.4% |
| MFS Global Opportunistic Bond Fund | 3.1% |
| MFS Emerging Markets Debt Fund | 2.9% |
| MFS International Intrinsic Equity Fund | 2.4% |
| MFS International Growth Fund | 2.4% |
| MFS Blended Research Small Cap Equity Fund | 2.0% |
| MFS International New Discovery Fund | 2.0% |
| MFS Emerging Markets Debt Local Currency Fund | 2.0% |
| MFS New Discovery Fund | 1.0% |
| MFS New Discovery Value Fund | 1.0% |
| MFS Government Securities Fund | 0.9% |
| MFS Institutional Money Market Portfolio | 0.9% |
| MFS Blended Research Emerging Markets Equity Fund | 0.5% |
| MFS Emerging Markets Equity Fund | 0.5% |
FUND EXPENSES
What were the fund costs for the last year?
| (based on a hypothetical $10,000 investment) | ||
| Class Name | Costs of a $10,000 investment ~ | Costs paid as a percentage of a $10,000 investment ~ |
| A | $25 | 0.24% |
˜ Expenses are direct expenses and do not include underlying fund fees and expenses.
MANAGEMENT'S DISCUSSION OF FUND PERFORMANCE
-
For the twelve months ended April 30, 2026, Class A shares of the MFS Lifetime Income Fund (fund) provided a total return of 9.93%, at net asset value. This compares with a return of 4.06% for the fund’s benchmark, the Bloomberg U.S. Aggregate Bond Index. The fund's other benchmark, the MFS Lifetime Income Fund Blended Index (Blended Index), generated a return of 11.20%. The Blended Index reflects the blended returns of broad asset class indices, with percentage allocations to each index designed to resemble the long term strategic allocations of the fund. The market indices and related percentage allocations used to compile the Blended Index are set forth in the Fund Performance.
-
Global equity markets reached record levels during the period, withstanding considerable volatility amid tariffs, geopolitical conflict and high levels of uncertainty. A new geopolitical event distressed markets at the end of the period as US and Israeli forces launched strikes against Iran, disrupting Mideast oil and natural gas exports. During the period, a pro-growth tax and spending bill was signed into law in the US, while in Europe, renewed focus on defense and infrastructure spending brightened the economic outlook. In Japan, the election of a pro-growth prime minister sent stocks to new highs prior to the conflict in Iran. Optimism over artificial intelligence remained high.
-
Considerable progress was made in trade talks between the US and many major trading partners, with a fragile truce between the US and China extended through late 2026. While the US Supreme Court struck down part of the Trump administration’s tariff strategy, the administration began deploying other authorities to largely replace the ones that were ruled unconstitutional.
-
Early in the period, moderating inflation pressures allowed many global central banks to ease monetary policy. Amid a difficult policymaking environment and slower job growth, the Federal Reserve resumed easing policy in September and delivered quarter-point rate cuts in October and December before pausing.
-
In fixed income markets, previously range-bound global bond yields spiked following the onset of the Middle East conflict, as energy-driven inflation fears appeared to have rattled bond investors. US rate volatility (as measured by the Merrill Lynch Option Volatility Estimate (MOVE) Index) similarly rose from intra-period lows, reflecting uncertainty around the scope and duration of the conflict and its implications for global growth. However, volatility later retracted as the risk of a broader regional military escalation appeared less likely. Global credit spreads widened only modestly before stabilizing near prior levels, supported by strong demand and resilient underlying fundamentals.
-
Top contributors to performance relative to the Blended Index:
-
The fund's fixed income segment was a primary contributor to relative performance, as the MFS Total Return Bond Fund outpaced its respective benchmark. From a style perspective, both emerging markets debt and high yield credit outperformed the broader index.
-
The international equity segment also benefited the fund's relative performance, as the MFS Blended Research International Equity Fund outperformed its respective benchmark.
-
-
Top detractors from performance relative to the Blended Index:
-
Within the US equity segment, lagging relative performance across the majority of the strategies weighed on relative results as the funds generally underperformed their respective benchmarks. Style selection also held back relative performance as mid-cap strategies underperformed the broader index.
-
FUND PERFORMANCE
The fund’s past performance is not a good predictor of the fund’s future performance. The graph and table below do not reflect the deduction of taxes that a shareholder would pay on fund distributions or the redemption of fund shares. The graph and table below assume reinvestment of dividends and capital gain distributions.
Growth of a Hypothetical $10,000 Investment
This graph shows the performance of a hypothetical $10,000 investment in Class A over a ten year period or since inception, if shorter, in comparison to (i) a broad measure of market performance and (ii) an additional index that MFS believes more closely reflects the market segments in which the fund invests. This graph includes the deduction of the maximum applicable sales charge.
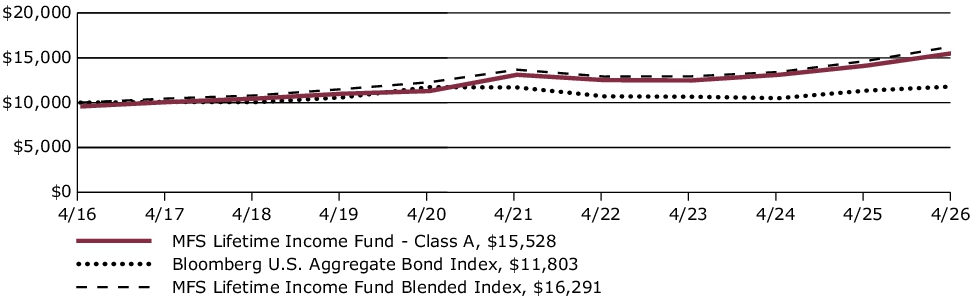
Average Annual Total Returns through 4/30/26
This table shows the average annual total returns of the class of shares noted for the periods shown, both with (if any) and without sales charges. It also shows the average annual total returns of (i) a broad measure of market performance and (ii) an additional index that MFS believes more closely reflects the market segments in which the fund invests, over the same periods.
| Share Class | 1-yr | 5-yr | 10-yr |
| A without sales charge | 9.93% | 3.45% | 4.95% |
| A with initial sales charge (4.25%) | 5.26% | 2.56% | 4.50% |
| Comparative Benchmark(s) | |||
| Bloomberg U.S. Aggregate Bond Index ∆ | 4.06% | 0.18% | 1.67% |
| MFS Lifetime Income Fund Blended Index ∆ | 11.20% | 3.57% | 5.00% |
|
∆
|
Source: FactSet Research Systems Inc.
|
Visit mfs.com/perf/a for more recent performance information.
FUND STATISTICS AS OF 4/30/26
| Net Assets ($): | 503,389,615 | Total Management Fee ($)#: | 0 | |
| Total Number of Holdings: | 27 | Portfolio Turnover Rate (%): | 3 |
# The fund itself does not pay a management fee but the underlying funds in which the fund invests do pay management fees to MFS.
PORTFOLIO COMPOSITION (BASED ON TOTAL INVESTMENTS AS OF 4/30/26)
Portfolio allocation

Portfolio holdings
| MFS Limited Maturity Fund | 19.8% |
| MFS Total Return Bond Fund | 19.8% |
| MFS Inflation-Adjusted Bond Fund | 10.0% |
| MFS Government Securities Fund | 9.9% |
| MFS Global Opportunistic Bond Fund | 7.0% |
| MFS Blended Research Mid Cap Equity Fund | 3.1% |
| MFS Blended Research International Equity Fund | 2.8% |
| MFS Blended Research Value Equity Fund | 2.0% |
| MFS Global Real Estate Fund | 2.1% |
| MFS Commodity Strategy Fund | 2.0% |
| MFS Value Fund | 2.0% |
| MFS High Income Fund | 2.0% |
| MFS Growth Fund | 1.7% |
| MFS Research International Fund | 1.7% |
| MFS Blended Research Core Equity Fund | 1.7% |
| MFS Blended Research Growth Equity Fund | 1.7% |
| MFS Research Fund | 1.7% |
| MFS Mid Cap Growth Fund | 1.5% |
| MFS Mid Cap Value Fund | 1.5% |
| MFS Blended Research Small Cap Equity Fund | 1.0% |
| MFS Emerging Markets Debt Fund | 1.0% |
| MFS Institutional Money Market Portfolio | 1.0% |
| MFS Emerging Markets Debt Local Currency Fund | 1.0% |
| MFS International Intrinsic Equity Fund | 0.5% |
| MFS International Growth Fund | 0.5% |
| MFS New Discovery Fund | 0.5% |
| MFS New Discovery Value Fund | 0.5% |
FUND EXPENSES
What were the fund costs for the last year?
| (based on a hypothetical $10,000 investment) | ||
| Class Name | Costs of a $10,000 investment ~ | Costs paid as a percentage of a $10,000 investment ~ |
| B | $104 | 0.99% |
˜ Expenses are direct expenses and do not include underlying fund fees and expenses.
MANAGEMENT'S DISCUSSION OF FUND PERFORMANCE
-
For the twelve months ended April 30, 2026, Class B shares of the MFS Lifetime Income Fund (fund) provided a total return of 9.12%, at net asset value. This compares with a return of 4.06% for the fund’s benchmark, the Bloomberg U.S. Aggregate Bond Index. The fund's other benchmark, the MFS Lifetime Income Fund Blended Index (Blended Index), generated a return of 11.20%. The Blended Index reflects the blended returns of broad asset class indices, with percentage allocations to each index designed to resemble the long term strategic allocations of the fund. The market indices and related percentage allocations used to compile the Blended Index are set forth in the Fund Performance.
-
Global equity markets reached record levels during the period, withstanding considerable volatility amid tariffs, geopolitical conflict and high levels of uncertainty. A new geopolitical event distressed markets at the end of the period as US and Israeli forces launched strikes against Iran, disrupting Mideast oil and natural gas exports. During the period, a pro-growth tax and spending bill was signed into law in the US, while in Europe, renewed focus on defense and infrastructure spending brightened the economic outlook. In Japan, the election of a pro-growth prime minister sent stocks to new highs prior to the conflict in Iran. Optimism over artificial intelligence remained high.
-
Considerable progress was made in trade talks between the US and many major trading partners, with a fragile truce between the US and China extended through late 2026. While the US Supreme Court struck down part of the Trump administration’s tariff strategy, the administration began deploying other authorities to largely replace the ones that were ruled unconstitutional.
-
Early in the period, moderating inflation pressures allowed many global central banks to ease monetary policy. Amid a difficult policymaking environment and slower job growth, the Federal Reserve resumed easing policy in September and delivered quarter-point rate cuts in October and December before pausing.
-
In fixed income markets, previously range-bound global bond yields spiked following the onset of the Middle East conflict, as energy-driven inflation fears appeared to have rattled bond investors. US rate volatility (as measured by the Merrill Lynch Option Volatility Estimate (MOVE) Index) similarly rose from intra-period lows, reflecting uncertainty around the scope and duration of the conflict and its implications for global growth. However, volatility later retracted as the risk of a broader regional military escalation appeared less likely. Global credit spreads widened only modestly before stabilizing near prior levels, supported by strong demand and resilient underlying fundamentals.
-
Top contributors to performance relative to the Blended Index:
-
The fund's fixed income segment was a primary contributor to relative performance, as the MFS Total Return Bond Fund outpaced its respective benchmark. From a style perspective, both emerging markets debt and high yield credit outperformed the broader index.
-
The international equity segment also benefited the fund's relative performance, as the MFS Blended Research International Equity Fund outperformed its respective benchmark.
-
-
Top detractors from performance relative to the Blended Index:
-
Within the US equity segment, lagging relative performance across the majority of the strategies weighed on relative results as the funds generally underperformed their respective benchmarks. Style selection also held back relative performance as mid-cap strategies underperformed the broader index.
-
FUND PERFORMANCE
The fund’s past performance is not a good predictor of the fund’s future performance. The graph and table below do not reflect the deduction of taxes that a shareholder would pay on fund distributions or the redemption of fund shares. The graph and table below assume reinvestment of dividends and capital gain distributions.
Growth of a Hypothetical $10,000 Investment
This graph shows the performance of a hypothetical $10,000 investment in Class B over a ten year period or since inception, if shorter, in comparison to (i) a broad measure of market performance and (ii) an additional index that MFS believes more closely reflects the market segments in which the fund invests.

Average Annual Total Returns through 4/30/26
This table shows the average annual total returns of the class of shares noted for the periods shown, both with (if any) and without sales charges. It also shows the average annual total returns of (i) a broad measure of market performance and (ii) an additional index that MFS believes more closely reflects the market segments in which the fund invests, over the same periods.
| Share Class | 1-yr | 5-yr | 10-yr |
| B without sales charge | 9.12% | 2.68% | 4.17% |
| B with CDSC (declining over six years from 4% to 0%)× | 5.12% | 2.35% | 4.17% |
| Comparative Benchmark(s) | |||
| Bloomberg U.S. Aggregate Bond Index ∆ | 4.06% | 0.18% | 1.67% |
| MFS Lifetime Income Fund Blended Index ∆ | 11.20% | 3.57% | 5.00% |
|
∆
|
Source: FactSet Research Systems Inc.
|
|
×
|
Assuming redemption at the end of the applicable period.
|
Visit mfs.com/perf/b for more recent performance information.
FUND STATISTICS AS OF 4/30/26
| Net Assets ($): | 503,389,615 | Total Management Fee ($)#: | 0 | |
| Total Number of Holdings: | 27 | Portfolio Turnover Rate (%): | 3 |
# The fund itself does not pay a management fee but the underlying funds in which the fund invests do pay management fees to MFS.
PORTFOLIO COMPOSITION (BASED ON TOTAL INVESTMENTS AS OF 4/30/26)
Portfolio allocation

Portfolio holdings
| MFS Limited Maturity Fund | 19.8% |
| MFS Total Return Bond Fund | 19.8% |
| MFS Inflation-Adjusted Bond Fund | 10.0% |
| MFS Government Securities Fund | 9.9% |
| MFS Global Opportunistic Bond Fund | 7.0% |
| MFS Blended Research Mid Cap Equity Fund | 3.1% |
| MFS Blended Research International Equity Fund | 2.8% |
| MFS Blended Research Value Equity Fund | 2.0% |
| MFS Global Real Estate Fund | 2.1% |
| MFS Commodity Strategy Fund | 2.0% |
| MFS Value Fund | 2.0% |
| MFS High Income Fund | 2.0% |
| MFS Growth Fund | 1.7% |
| MFS Research International Fund | 1.7% |
| MFS Blended Research Core Equity Fund | 1.7% |
| MFS Blended Research Growth Equity Fund | 1.7% |
| MFS Research Fund | 1.7% |
| MFS Mid Cap Growth Fund | 1.5% |
| MFS Mid Cap Value Fund | 1.5% |
| MFS Blended Research Small Cap Equity Fund | 1.0% |
| MFS Emerging Markets Debt Fund | 1.0% |
| MFS Institutional Money Market Portfolio | 1.0% |
| MFS Emerging Markets Debt Local Currency Fund | 1.0% |
| MFS International Intrinsic Equity Fund | 0.5% |
| MFS International Growth Fund | 0.5% |
| MFS New Discovery Fund | 0.5% |
| MFS New Discovery Value Fund | 0.5% |
FUND EXPENSES
What were the fund costs for the last year?
| (based on a hypothetical $10,000 investment) | ||
| Class Name | Costs of a $10,000 investment ~ | Costs paid as a percentage of a $10,000 investment ~ |
| R6 | $0 | 0.00% |
˜ Expenses are direct expenses and do not include underlying fund fees and expenses.
MANAGEMENT'S DISCUSSION OF FUND PERFORMANCE
-
For the twelve months ended April 30, 2026, Class R6 shares of the MFS Lifetime Income Fund (fund) provided a total return of 10.30%, at net asset value. This compares with a return of 4.06% for the fund’s benchmark, the Bloomberg U.S. Aggregate Bond Index. The fund's other benchmark, the MFS Lifetime Income Fund Blended Index (Blended Index), generated a return of 11.20%. The Blended Index reflects the blended returns of broad asset class indices, with percentage allocations to each index designed to resemble the long term strategic allocations of the fund. The market indices and related percentage allocations used to compile the Blended Index are set forth in the Fund Performance.
-
Global equity markets reached record levels during the period, withstanding considerable volatility amid tariffs, geopolitical conflict and high levels of uncertainty. A new geopolitical event distressed markets at the end of the period as US and Israeli forces launched strikes against Iran, disrupting Mideast oil and natural gas exports. During the period, a pro-growth tax and spending bill was signed into law in the US, while in Europe, renewed focus on defense and infrastructure spending brightened the economic outlook. In Japan, the election of a pro-growth prime minister sent stocks to new highs prior to the conflict in Iran. Optimism over artificial intelligence remained high.
-
Considerable progress was made in trade talks between the US and many major trading partners, with a fragile truce between the US and China extended through late 2026. While the US Supreme Court struck down part of the Trump administration’s tariff strategy, the administration began deploying other authorities to largely replace the ones that were ruled unconstitutional.
-
Early in the period, moderating inflation pressures allowed many global central banks to ease monetary policy. Amid a difficult policymaking environment and slower job growth, the Federal Reserve resumed easing policy in September and delivered quarter-point rate cuts in October and December before pausing.
-
In fixed income markets, previously range-bound global bond yields spiked following the onset of the Middle East conflict, as energy-driven inflation fears appeared to have rattled bond investors. US rate volatility (as measured by the Merrill Lynch Option Volatility Estimate (MOVE) Index) similarly rose from intra-period lows, reflecting uncertainty around the scope and duration of the conflict and its implications for global growth. However, volatility later retracted as the risk of a broader regional military escalation appeared less likely. Global credit spreads widened only modestly before stabilizing near prior levels, supported by strong demand and resilient underlying fundamentals.
-
Top contributors to performance relative to the Blended Index:
-
The fund's fixed income segment was a primary contributor to relative performance, as the MFS Total Return Bond Fund outpaced its respective benchmark. From a style perspective, both emerging markets debt and high yield credit outperformed the broader index.
-
The international equity segment also benefited the fund's relative performance, as the MFS Blended Research International Equity Fund outperformed its respective benchmark.
-
-
Top detractors from performance relative to the Blended Index:
-
Within the US equity segment, lagging relative performance across the majority of the strategies weighed on relative results as the funds generally underperformed their respective benchmarks. Style selection also held back relative performance as mid-cap strategies underperformed the broader index.
-
FUND PERFORMANCE
The fund’s past performance is not a good predictor of the fund’s future performance. The graph and table below do not reflect the deduction of taxes that a shareholder would pay on fund distributions or the redemption of fund shares. The graph and table below assume reinvestment of dividends and capital gain distributions.
Growth of a Hypothetical $10,000 Investment*
This graph shows the performance of a hypothetical $10,000 investment in Class R6 over a ten year period or since inception, if shorter, in comparison to (i) a broad measure of market performance and (ii) an additional index that MFS believes more closely reflects the market segments in which the fund invests.
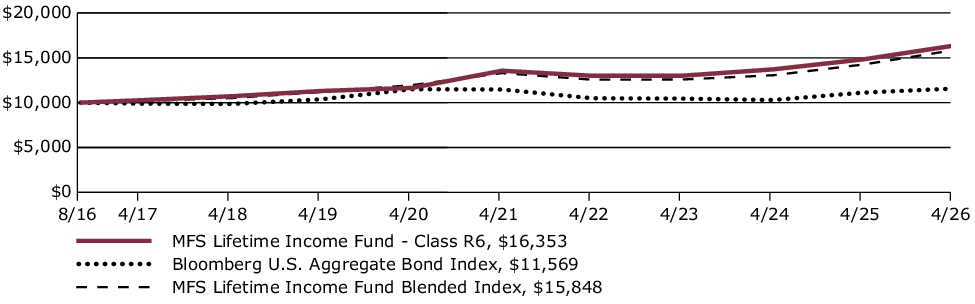
Average Annual Total Returns through 4/30/26
This table shows the average annual total returns of the class of shares noted for the periods shown, both with (if any) and without sales charges. It also shows the average annual total returns of (i) a broad measure of market performance and (ii) an additional index that MFS believes more closely reflects the market segments in which the fund invests, over the same periods.
| Share Class | 1-yr | 5-yr | Life* |
| R6 without sales charge | 10.30% | 3.82% | 5.21% |
| Comparative Benchmark(s) | |||
| Bloomberg U.S. Aggregate Bond Index ∆ | 4.06% | 0.18% | 1.52% |
| MFS Lifetime Income Fund Blended Index ∆ | 11.20% | 3.57% | 4.87% |
|
*
|
For the period from the commencement of the class's investment operations, August 29, 2016 through April 30, 2026.
|
|
∆
|
Source: FactSet Research Systems Inc.
|
Visit mfs.com/perf/r6 for more recent performance information.
FUND STATISTICS AS OF 4/30/26
| Net Assets ($): | 503,389,615 | Total Management Fee ($)#: | 0 | |
| Total Number of Holdings: | 27 | Portfolio Turnover Rate (%): | 3 |
# The fund itself does not pay a management fee but the underlying funds in which the fund invests do pay management fees to MFS.
PORTFOLIO COMPOSITION (BASED ON TOTAL INVESTMENTS AS OF 4/30/26)
Portfolio allocation

Portfolio holdings
| MFS Limited Maturity Fund | 19.8% |
| MFS Total Return Bond Fund | 19.8% |
| MFS Inflation-Adjusted Bond Fund | 10.0% |
| MFS Government Securities Fund | 9.9% |
| MFS Global Opportunistic Bond Fund | 7.0% |
| MFS Blended Research Mid Cap Equity Fund | 3.1% |
| MFS Blended Research International Equity Fund | 2.8% |
| MFS Blended Research Value Equity Fund | 2.0% |
| MFS Global Real Estate Fund | 2.1% |
| MFS Commodity Strategy Fund | 2.0% |
| MFS Value Fund | 2.0% |
| MFS High Income Fund | 2.0% |
| MFS Growth Fund | 1.7% |
| MFS Research International Fund | 1.7% |
| MFS Blended Research Core Equity Fund | 1.7% |
| MFS Blended Research Growth Equity Fund | 1.7% |
| MFS Research Fund | 1.7% |
| MFS Mid Cap Growth Fund | 1.5% |
| MFS Mid Cap Value Fund | 1.5% |
| MFS Blended Research Small Cap Equity Fund | 1.0% |
| MFS Emerging Markets Debt Fund | 1.0% |
| MFS Institutional Money Market Portfolio | 1.0% |
| MFS Emerging Markets Debt Local Currency Fund | 1.0% |
| MFS International Intrinsic Equity Fund | 0.5% |
| MFS International Growth Fund | 0.5% |
| MFS New Discovery Fund | 0.5% |
| MFS New Discovery Value Fund | 0.5% |
FUND EXPENSES
What were the fund costs for the last year?
| (based on a hypothetical $10,000 investment) | ||
| Class Name | Costs of a $10,000 investment ~ | Costs paid as a percentage of a $10,000 investment ~ |
| R4 | $0 | 0.00% |
˜ Expenses are direct expenses and do not include underlying fund fees and expenses.
MANAGEMENT'S DISCUSSION OF FUND PERFORMANCE
-
For the twelve months ended April 30, 2026, Class R4 shares of the MFS Lifetime Income Fund (fund) provided a total return of 10.21%, at net asset value. This compares with a return of 4.06% for the fund’s benchmark, the Bloomberg U.S. Aggregate Bond Index. The fund's other benchmark, the MFS Lifetime Income Fund Blended Index (Blended Index), generated a return of 11.20%. The Blended Index reflects the blended returns of broad asset class indices, with percentage allocations to each index designed to resemble the long term strategic allocations of the fund. The market indices and related percentage allocations used to compile the Blended Index are set forth in the Fund Performance.
-
Global equity markets reached record levels during the period, withstanding considerable volatility amid tariffs, geopolitical conflict and high levels of uncertainty. A new geopolitical event distressed markets at the end of the period as US and Israeli forces launched strikes against Iran, disrupting Mideast oil and natural gas exports. During the period, a pro-growth tax and spending bill was signed into law in the US, while in Europe, renewed focus on defense and infrastructure spending brightened the economic outlook. In Japan, the election of a pro-growth prime minister sent stocks to new highs prior to the conflict in Iran. Optimism over artificial intelligence remained high.
-
Considerable progress was made in trade talks between the US and many major trading partners, with a fragile truce between the US and China extended through late 2026. While the US Supreme Court struck down part of the Trump administration’s tariff strategy, the administration began deploying other authorities to largely replace the ones that were ruled unconstitutional.
-
Early in the period, moderating inflation pressures allowed many global central banks to ease monetary policy. Amid a difficult policymaking environment and slower job growth, the Federal Reserve resumed easing policy in September and delivered quarter-point rate cuts in October and December before pausing.
-
In fixed income markets, previously range-bound global bond yields spiked following the onset of the Middle East conflict, as energy-driven inflation fears appeared to have rattled bond investors. US rate volatility (as measured by the Merrill Lynch Option Volatility Estimate (MOVE) Index) similarly rose from intra-period lows, reflecting uncertainty around the scope and duration of the conflict and its implications for global growth. However, volatility later retracted as the risk of a broader regional military escalation appeared less likely. Global credit spreads widened only modestly before stabilizing near prior levels, supported by strong demand and resilient underlying fundamentals.
-
Top contributors to performance relative to the Blended Index:
-
The fund's fixed income segment was a primary contributor to relative performance, as the MFS Total Return Bond Fund outpaced its respective benchmark. From a style perspective, both emerging markets debt and high yield credit outperformed the broader index.
-
The international equity segment also benefited the fund's relative performance, as the MFS Blended Research International Equity Fund outperformed its respective benchmark.
-
-
Top detractors from performance relative to the Blended Index:
-
Within the US equity segment, lagging relative performance across the majority of the strategies weighed on relative results as the funds generally underperformed their respective benchmarks. Style selection also held back relative performance as mid-cap strategies underperformed the broader index.
-
FUND PERFORMANCE
The fund’s past performance is not a good predictor of the fund’s future performance. The graph and table below do not reflect the deduction of taxes that a shareholder would pay on fund distributions or the redemption of fund shares. The graph and table below assume reinvestment of dividends and capital gain distributions.
Growth of a Hypothetical $10,000 Investment
This graph shows the performance of a hypothetical $10,000 investment in Class R4 over a ten year period or since inception, if shorter, in comparison to (i) a broad measure of market performance and (ii) an additional index that MFS believes more closely reflects the market segments in which the fund invests.
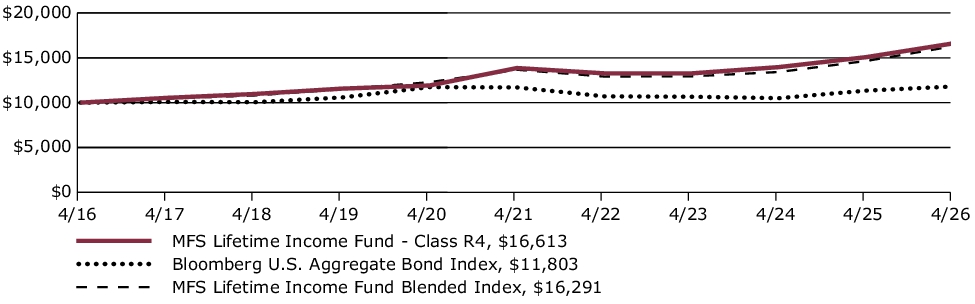
Average Annual Total Returns through 4/30/26
This table shows the average annual total returns of the class of shares noted for the periods shown, both with (if any) and without sales charges. It also shows the average annual total returns of (i) a broad measure of market performance and (ii) an additional index that MFS believes more closely reflects the market segments in which the fund invests, over the same periods.
| Share Class | 1-yr | 5-yr | 10-yr |
| R4 without sales charge | 10.21% | 3.69% | 5.21% |
| Comparative Benchmark(s) | |||
| Bloomberg U.S. Aggregate Bond Index ∆ | 4.06% | 0.18% | 1.67% |
| MFS Lifetime Income Fund Blended Index ∆ | 11.20% | 3.57% | 5.00% |
|
∆
|
Source: FactSet Research Systems Inc.
|
Visit mfs.com/perf/r4 for more recent performance information.
FUND STATISTICS AS OF 4/30/26
| Net Assets ($): | 503,389,615 | Total Management Fee ($)#: | 0 | |
| Total Number of Holdings: | 27 | Portfolio Turnover Rate (%): | 3 |
# The fund itself does not pay a management fee but the underlying funds in which the fund invests do pay management fees to MFS.
PORTFOLIO COMPOSITION (BASED ON TOTAL INVESTMENTS AS OF 4/30/26)
Portfolio allocation

Portfolio holdings
| MFS Limited Maturity Fund | 19.8% |
| MFS Total Return Bond Fund | 19.8% |
| MFS Inflation-Adjusted Bond Fund | 10.0% |
| MFS Government Securities Fund | 9.9% |
| MFS Global Opportunistic Bond Fund | 7.0% |
| MFS Blended Research Mid Cap Equity Fund | 3.1% |
| MFS Blended Research International Equity Fund | 2.8% |
| MFS Blended Research Value Equity Fund | 2.0% |
| MFS Global Real Estate Fund | 2.1% |
| MFS Commodity Strategy Fund | 2.0% |
| MFS Value Fund | 2.0% |
| MFS High Income Fund | 2.0% |
| MFS Growth Fund | 1.7% |
| MFS Research International Fund | 1.7% |
| MFS Blended Research Core Equity Fund | 1.7% |
| MFS Blended Research Growth Equity Fund | 1.7% |
| MFS Research Fund | 1.7% |
| MFS Mid Cap Growth Fund | 1.5% |
| MFS Mid Cap Value Fund | 1.5% |
| MFS Blended Research Small Cap Equity Fund | 1.0% |
| MFS Emerging Markets Debt Fund | 1.0% |
| MFS Institutional Money Market Portfolio | 1.0% |
| MFS Emerging Markets Debt Local Currency Fund | 1.0% |
| MFS International Intrinsic Equity Fund | 0.5% |
| MFS International Growth Fund | 0.5% |
| MFS New Discovery Fund | 0.5% |
| MFS New Discovery Value Fund | 0.5% |
FUND EXPENSES
What were the fund costs for the last year?
| (based on a hypothetical $10,000 investment) | ||
| Class Name | Costs of a $10,000 investment ~ | Costs paid as a percentage of a $10,000 investment ~ |
| R2 | $51 | 0.49% |
˜ Expenses are direct expenses and do not include underlying fund fees and expenses.
MANAGEMENT'S DISCUSSION OF FUND PERFORMANCE
-
For the twelve months ended April 30, 2026, Class R2 shares of the MFS Lifetime Income Fund (fund) provided a total return of 9.66%, at net asset value. This compares with a return of 4.06% for the fund’s benchmark, the Bloomberg U.S. Aggregate Bond Index. The fund's other benchmark, the MFS Lifetime Income Fund Blended Index (Blended Index), generated a return of 11.20%. The Blended Index reflects the blended returns of broad asset class indices, with percentage allocations to each index designed to resemble the long term strategic allocations of the fund. The market indices and related percentage allocations used to compile the Blended Index are set forth in the Fund Performance.
-
Global equity markets reached record levels during the period, withstanding considerable volatility amid tariffs, geopolitical conflict and high levels of uncertainty. A new geopolitical event distressed markets at the end of the period as US and Israeli forces launched strikes against Iran, disrupting Mideast oil and natural gas exports. During the period, a pro-growth tax and spending bill was signed into law in the US, while in Europe, renewed focus on defense and infrastructure spending brightened the economic outlook. In Japan, the election of a pro-growth prime minister sent stocks to new highs prior to the conflict in Iran. Optimism over artificial intelligence remained high.
-
Considerable progress was made in trade talks between the US and many major trading partners, with a fragile truce between the US and China extended through late 2026. While the US Supreme Court struck down part of the Trump administration’s tariff strategy, the administration began deploying other authorities to largely replace the ones that were ruled unconstitutional.
-
Early in the period, moderating inflation pressures allowed many global central banks to ease monetary policy. Amid a difficult policymaking environment and slower job growth, the Federal Reserve resumed easing policy in September and delivered quarter-point rate cuts in October and December before pausing.
-
In fixed income markets, previously range-bound global bond yields spiked following the onset of the Middle East conflict, as energy-driven inflation fears appeared to have rattled bond investors. US rate volatility (as measured by the Merrill Lynch Option Volatility Estimate (MOVE) Index) similarly rose from intra-period lows, reflecting uncertainty around the scope and duration of the conflict and its implications for global growth. However, volatility later retracted as the risk of a broader regional military escalation appeared less likely. Global credit spreads widened only modestly before stabilizing near prior levels, supported by strong demand and resilient underlying fundamentals.
-
Top contributors to performance relative to the Blended Index:
-
The fund's fixed income segment was a primary contributor to relative performance, as the MFS Total Return Bond Fund outpaced its respective benchmark. From a style perspective, both emerging markets debt and high yield credit outperformed the broader index.
-
The international equity segment also benefited the fund's relative performance, as the MFS Blended Research International Equity Fund outperformed its respective benchmark.
-
-
Top detractors from performance relative to the Blended Index:
-
Within the US equity segment, lagging relative performance across the majority of the strategies weighed on relative results as the funds generally underperformed their respective benchmarks. Style selection also held back relative performance as mid-cap strategies underperformed the broader index.
-
FUND PERFORMANCE
The fund’s past performance is not a good predictor of the fund’s future performance. The graph and table below do not reflect the deduction of taxes that a shareholder would pay on fund distributions or the redemption of fund shares. The graph and table below assume reinvestment of dividends and capital gain distributions.
Growth of a Hypothetical $10,000 Investment
This graph shows the performance of a hypothetical $10,000 investment in Class R2 over a ten year period or since inception, if shorter, in comparison to (i) a broad measure of market performance and (ii) an additional index that MFS believes more closely reflects the market segments in which the fund invests.
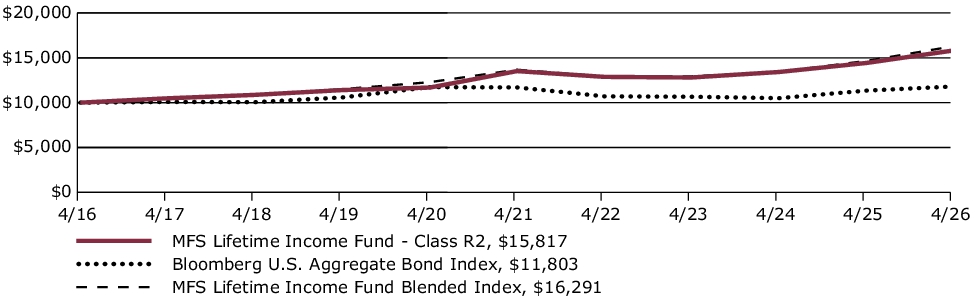
Average Annual Total Returns through 4/30/26
This table shows the average annual total returns of the class of shares noted for the periods shown, both with (if any) and without sales charges. It also shows the average annual total returns of (i) a broad measure of market performance and (ii) an additional index that MFS believes more closely reflects the market segments in which the fund invests, over the same periods.
| Share Class | 1-yr | 5-yr | 10-yr |
| R2 without sales charge | 9.66% | 3.19% | 4.69% |
| Comparative Benchmark(s) | |||
| Bloomberg U.S. Aggregate Bond Index ∆ | 4.06% | 0.18% | 1.67% |
| MFS Lifetime Income Fund Blended Index ∆ | 11.20% | 3.57% | 5.00% |
|
∆
|
Source: FactSet Research Systems Inc.
|
Visit mfs.com/perf/r2 for more recent performance information.
FUND STATISTICS AS OF 4/30/26
| Net Assets ($): | 503,389,615 | Total Management Fee ($)#: | 0 | |
| Total Number of Holdings: | 27 | Portfolio Turnover Rate (%): | 3 |
# The fund itself does not pay a management fee but the underlying funds in which the fund invests do pay management fees to MFS.
PORTFOLIO COMPOSITION (BASED ON TOTAL INVESTMENTS AS OF 4/30/26)
Portfolio allocation

Portfolio holdings
| MFS Limited Maturity Fund | 19.8% |
| MFS Total Return Bond Fund | 19.8% |
| MFS Inflation-Adjusted Bond Fund | 10.0% |
| MFS Government Securities Fund | 9.9% |
| MFS Global Opportunistic Bond Fund | 7.0% |
| MFS Blended Research Mid Cap Equity Fund | 3.1% |
| MFS Blended Research International Equity Fund | 2.8% |
| MFS Blended Research Value Equity Fund | 2.0% |
| MFS Global Real Estate Fund | 2.1% |
| MFS Commodity Strategy Fund | 2.0% |
| MFS Value Fund | 2.0% |
| MFS High Income Fund | 2.0% |
| MFS Growth Fund | 1.7% |
| MFS Research International Fund | 1.7% |
| MFS Blended Research Core Equity Fund | 1.7% |
| MFS Blended Research Growth Equity Fund | 1.7% |
| MFS Research Fund | 1.7% |
| MFS Mid Cap Growth Fund | 1.5% |
| MFS Mid Cap Value Fund | 1.5% |
| MFS Blended Research Small Cap Equity Fund | 1.0% |
| MFS Emerging Markets Debt Fund | 1.0% |
| MFS Institutional Money Market Portfolio | 1.0% |
| MFS Emerging Markets Debt Local Currency Fund | 1.0% |
| MFS International Intrinsic Equity Fund | 0.5% |
| MFS International Growth Fund | 0.5% |
| MFS New Discovery Fund | 0.5% |
| MFS New Discovery Value Fund | 0.5% |
FUND EXPENSES
What were the fund costs for the last year?
| (based on a hypothetical $10,000 investment) | ||
| Class Name | Costs of a $10,000 investment ~ | Costs paid as a percentage of a $10,000 investment ~ |
| R3 | $25 | 0.24% |
˜ Expenses are direct expenses and do not include underlying fund fees and expenses.
MANAGEMENT'S DISCUSSION OF FUND PERFORMANCE
-
For the twelve months ended April 30, 2026, Class R3 shares of the MFS Lifetime Income Fund (fund) provided a total return of 9.93%, at net asset value. This compares with a return of 4.06% for the fund’s benchmark, the Bloomberg U.S. Aggregate Bond Index. The fund's other benchmark, the MFS Lifetime Income Fund Blended Index (Blended Index), generated a return of 11.20%. The Blended Index reflects the blended returns of broad asset class indices, with percentage allocations to each index designed to resemble the long term strategic allocations of the fund. The market indices and related percentage allocations used to compile the Blended Index are set forth in the Fund Performance.
-
Global equity markets reached record levels during the period, withstanding considerable volatility amid tariffs, geopolitical conflict and high levels of uncertainty. A new geopolitical event distressed markets at the end of the period as US and Israeli forces launched strikes against Iran, disrupting Mideast oil and natural gas exports. During the period, a pro-growth tax and spending bill was signed into law in the US, while in Europe, renewed focus on defense and infrastructure spending brightened the economic outlook. In Japan, the election of a pro-growth prime minister sent stocks to new highs prior to the conflict in Iran. Optimism over artificial intelligence remained high.
-
Considerable progress was made in trade talks between the US and many major trading partners, with a fragile truce between the US and China extended through late 2026. While the US Supreme Court struck down part of the Trump administration’s tariff strategy, the administration began deploying other authorities to largely replace the ones that were ruled unconstitutional.
-
Early in the period, moderating inflation pressures allowed many global central banks to ease monetary policy. Amid a difficult policymaking environment and slower job growth, the Federal Reserve resumed easing policy in September and delivered quarter-point rate cuts in October and December before pausing.
-
In fixed income markets, previously range-bound global bond yields spiked following the onset of the Middle East conflict, as energy-driven inflation fears appeared to have rattled bond investors. US rate volatility (as measured by the Merrill Lynch Option Volatility Estimate (MOVE) Index) similarly rose from intra-period lows, reflecting uncertainty around the scope and duration of the conflict and its implications for global growth. However, volatility later retracted as the risk of a broader regional military escalation appeared less likely. Global credit spreads widened only modestly before stabilizing near prior levels, supported by strong demand and resilient underlying fundamentals.
-
Top contributors to performance relative to the Blended Index:
-
The fund's fixed income segment was a primary contributor to relative performance, as the MFS Total Return Bond Fund outpaced its respective benchmark. From a style perspective, both emerging markets debt and high yield credit outperformed the broader index.
-
The international equity segment also benefited the fund's relative performance, as the MFS Blended Research International Equity Fund outperformed its respective benchmark.
-
-
Top detractors from performance relative to the Blended Index:
-
Within the US equity segment, lagging relative performance across the majority of the strategies weighed on relative results as the funds generally underperformed their respective benchmarks. Style selection also held back relative performance as mid-cap strategies underperformed the broader index.
-
FUND PERFORMANCE
The fund’s past performance is not a good predictor of the fund’s future performance. The graph and table below do not reflect the deduction of taxes that a shareholder would pay on fund distributions or the redemption of fund shares. The graph and table below assume reinvestment of dividends and capital gain distributions.
Growth of a Hypothetical $10,000 Investment
This graph shows the performance of a hypothetical $10,000 investment in Class R3 over a ten year period or since inception, if shorter, in comparison to (i) a broad measure of market performance and (ii) an additional index that MFS believes more closely reflects the market segments in which the fund invests.
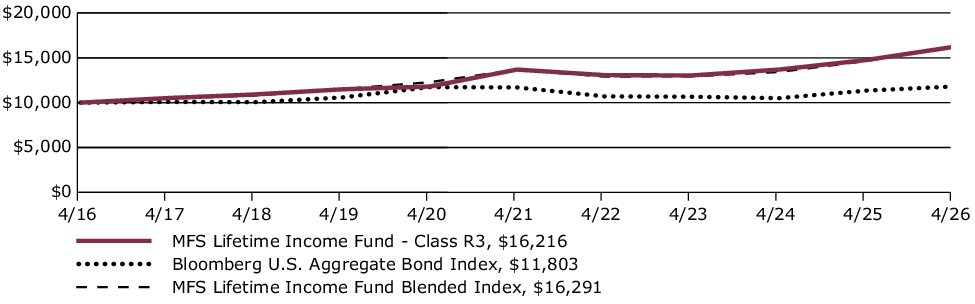
Average Annual Total Returns through 4/30/26
This table shows the average annual total returns of the class of shares noted for the periods shown, both with (if any) and without sales charges. It also shows the average annual total returns of (i) a broad measure of market performance and (ii) an additional index that MFS believes more closely reflects the market segments in which the fund invests, over the same periods.
| Share Class | 1-yr | 5-yr | 10-yr |
| R3 without sales charge | 9.93% | 3.45% | 4.95% |
| Comparative Benchmark(s) | |||
| Bloomberg U.S. Aggregate Bond Index ∆ | 4.06% | 0.18% | 1.67% |
| MFS Lifetime Income Fund Blended Index ∆ | 11.20% | 3.57% | 5.00% |
|
∆
|
Source: FactSet Research Systems Inc.
|
Visit mfs.com/perf/r3 for more recent performance information.
FUND STATISTICS AS OF 4/30/26
| Net Assets ($): | 503,389,615 | Total Management Fee ($)#: | 0 | |
| Total Number of Holdings: | 27 | Portfolio Turnover Rate (%): | 3 |
# The fund itself does not pay a management fee but the underlying funds in which the fund invests do pay management fees to MFS.
PORTFOLIO COMPOSITION (BASED ON TOTAL INVESTMENTS AS OF 4/30/26)
Portfolio allocation

Portfolio holdings
| MFS Limited Maturity Fund | 19.8% |
| MFS Total Return Bond Fund | 19.8% |
| MFS Inflation-Adjusted Bond Fund | 10.0% |
| MFS Government Securities Fund | 9.9% |
| MFS Global Opportunistic Bond Fund | 7.0% |
| MFS Blended Research Mid Cap Equity Fund | 3.1% |
| MFS Blended Research International Equity Fund | 2.8% |
| MFS Blended Research Value Equity Fund | 2.0% |
| MFS Global Real Estate Fund | 2.1% |
| MFS Commodity Strategy Fund | 2.0% |
| MFS Value Fund | 2.0% |
| MFS High Income Fund | 2.0% |
| MFS Growth Fund | 1.7% |
| MFS Research International Fund | 1.7% |
| MFS Blended Research Core Equity Fund | 1.7% |
| MFS Blended Research Growth Equity Fund | 1.7% |
| MFS Research Fund | 1.7% |
| MFS Mid Cap Growth Fund | 1.5% |
| MFS Mid Cap Value Fund | 1.5% |
| MFS Blended Research Small Cap Equity Fund | 1.0% |
| MFS Emerging Markets Debt Fund | 1.0% |
| MFS Institutional Money Market Portfolio | 1.0% |
| MFS Emerging Markets Debt Local Currency Fund | 1.0% |
| MFS International Intrinsic Equity Fund | 0.5% |
| MFS International Growth Fund | 0.5% |
| MFS New Discovery Fund | 0.5% |
| MFS New Discovery Value Fund | 0.5% |
FUND EXPENSES
What were the fund costs for the last year?
| (based on a hypothetical $10,000 investment) | ||
| Class Name | Costs of a $10,000 investment ~ | Costs paid as a percentage of a $10,000 investment ~ |
| C | $104 | 0.99% |
˜ Expenses are direct expenses and do not include underlying fund fees and expenses.
MANAGEMENT'S DISCUSSION OF FUND PERFORMANCE
-
For the twelve months ended April 30, 2026, Class C shares of the MFS Lifetime Income Fund (fund) provided a total return of 9.12%, at net asset value. This compares with a return of 4.06% for the fund’s benchmark, the Bloomberg U.S. Aggregate Bond Index. The fund's other benchmark, the MFS Lifetime Income Fund Blended Index (Blended Index), generated a return of 11.20%. The Blended Index reflects the blended returns of broad asset class indices, with percentage allocations to each index designed to resemble the long term strategic allocations of the fund. The market indices and related percentage allocations used to compile the Blended Index are set forth in the Fund Performance.
-
Global equity markets reached record levels during the period, withstanding considerable volatility amid tariffs, geopolitical conflict and high levels of uncertainty. A new geopolitical event distressed markets at the end of the period as US and Israeli forces launched strikes against Iran, disrupting Mideast oil and natural gas exports. During the period, a pro-growth tax and spending bill was signed into law in the US, while in Europe, renewed focus on defense and infrastructure spending brightened the economic outlook. In Japan, the election of a pro-growth prime minister sent stocks to new highs prior to the conflict in Iran. Optimism over artificial intelligence remained high.
-
Considerable progress was made in trade talks between the US and many major trading partners, with a fragile truce between the US and China extended through late 2026. While the US Supreme Court struck down part of the Trump administration’s tariff strategy, the administration began deploying other authorities to largely replace the ones that were ruled unconstitutional.
-
Early in the period, moderating inflation pressures allowed many global central banks to ease monetary policy. Amid a difficult policymaking environment and slower job growth, the Federal Reserve resumed easing policy in September and delivered quarter-point rate cuts in October and December before pausing.
-
In fixed income markets, previously range-bound global bond yields spiked following the onset of the Middle East conflict, as energy-driven inflation fears appeared to have rattled bond investors. US rate volatility (as measured by the Merrill Lynch Option Volatility Estimate (MOVE) Index) similarly rose from intra-period lows, reflecting uncertainty around the scope and duration of the conflict and its implications for global growth. However, volatility later retracted as the risk of a broader regional military escalation appeared less likely. Global credit spreads widened only modestly before stabilizing near prior levels, supported by strong demand and resilient underlying fundamentals.
-
Top contributors to performance relative to the Blended Index:
-
The fund's fixed income segment was a primary contributor to relative performance, as the MFS Total Return Bond Fund outpaced its respective benchmark. From a style perspective, both emerging markets debt and high yield credit outperformed the broader index.
-
The international equity segment also benefited the fund's relative performance, as the MFS Blended Research International Equity Fund outperformed its respective benchmark.
-
-
Top detractors from performance relative to the Blended Index:
-
Within the US equity segment, lagging relative performance across the majority of the strategies weighed on relative results as the funds generally underperformed their respective benchmarks. Style selection also held back relative performance as mid-cap strategies underperformed the broader index.
-
FUND PERFORMANCE
The fund’s past performance is not a good predictor of the fund’s future performance. The graph and table below do not reflect the deduction of taxes that a shareholder would pay on fund distributions or the redemption of fund shares. The graph and table below assume reinvestment of dividends and capital gain distributions.
Growth of a Hypothetical $10,000 Investment
This graph shows the performance of a hypothetical $10,000 investment in Class C over a ten year period or since inception, if shorter, in comparison to (i) a broad measure of market performance and (ii) an additional index that MFS believes more closely reflects the market segments in which the fund invests.

Average Annual Total Returns through 4/30/26
This table shows the average annual total returns of the class of shares noted for the periods shown, both with (if any) and without sales charges. It also shows the average annual total returns of (i) a broad measure of market performance and (ii) an additional index that MFS believes more closely reflects the market segments in which the fund invests, over the same periods.
| Share Class | 1-yr | 5-yr | 10-yr |
| C without sales charge | 9.12% | 2.68% | 4.16% |
| C with CDSC (1% for 12 months)× | 8.12% | 2.68% | 4.16% |
| Comparative Benchmark(s) | |||
| Bloomberg U.S. Aggregate Bond Index ∆ | 4.06% | 0.18% | 1.67% |
| MFS Lifetime Income Fund Blended Index ∆ | 11.20% | 3.57% | 5.00% |
|
∆
|
Source: FactSet Research Systems Inc.
|
|
×
|
Assuming redemption at the end of the applicable period.
|
Visit mfs.com/perf/c for more recent performance information.
FUND STATISTICS AS OF 4/30/26
| Net Assets ($): | 503,389,615 | Total Management Fee ($)#: | 0 | |
| Total Number of Holdings: | 27 | Portfolio Turnover Rate (%): | 3 |
# The fund itself does not pay a management fee but the underlying funds in which the fund invests do pay management fees to MFS.
PORTFOLIO COMPOSITION (BASED ON TOTAL INVESTMENTS AS OF 4/30/26)
Portfolio allocation

Portfolio holdings
| MFS Limited Maturity Fund | 19.8% |
| MFS Total Return Bond Fund | 19.8% |
| MFS Inflation-Adjusted Bond Fund | 10.0% |
| MFS Government Securities Fund | 9.9% |
| MFS Global Opportunistic Bond Fund | 7.0% |
| MFS Blended Research Mid Cap Equity Fund | 3.1% |
| MFS Blended Research International Equity Fund | 2.8% |
| MFS Blended Research Value Equity Fund | 2.0% |
| MFS Global Real Estate Fund | 2.1% |
| MFS Commodity Strategy Fund | 2.0% |
| MFS Value Fund | 2.0% |
| MFS High Income Fund | 2.0% |
| MFS Growth Fund | 1.7% |
| MFS Research International Fund | 1.7% |
| MFS Blended Research Core Equity Fund | 1.7% |
| MFS Blended Research Growth Equity Fund | 1.7% |
| MFS Research Fund | 1.7% |
| MFS Mid Cap Growth Fund | 1.5% |
| MFS Mid Cap Value Fund | 1.5% |
| MFS Blended Research Small Cap Equity Fund | 1.0% |
| MFS Emerging Markets Debt Fund | 1.0% |
| MFS Institutional Money Market Portfolio | 1.0% |
| MFS Emerging Markets Debt Local Currency Fund | 1.0% |
| MFS International Intrinsic Equity Fund | 0.5% |
| MFS International Growth Fund | 0.5% |
| MFS New Discovery Fund | 0.5% |
| MFS New Discovery Value Fund | 0.5% |
FUND EXPENSES
What were the fund costs for the last year?
| (based on a hypothetical $10,000 investment) | ||
| Class Name | Costs of a $10,000 investment ~ | Costs paid as a percentage of a $10,000 investment ~ |
| I | $0 | 0.00% |
˜ Expenses are direct expenses and do not include underlying fund fees and expenses.
MANAGEMENT'S DISCUSSION OF FUND PERFORMANCE
-
For the twelve months ended April 30, 2026, Class I shares of the MFS Lifetime Income Fund (fund) provided a total return of 10.20%, at net asset value. This compares with a return of 4.06% for the fund’s benchmark, the Bloomberg U.S. Aggregate Bond Index. The fund's other benchmark, the MFS Lifetime Income Fund Blended Index (Blended Index), generated a return of 11.20%. The Blended Index reflects the blended returns of broad asset class indices, with percentage allocations to each index designed to resemble the long term strategic allocations of the fund. The market indices and related percentage allocations used to compile the Blended Index are set forth in the Fund Performance.
-
Global equity markets reached record levels during the period, withstanding considerable volatility amid tariffs, geopolitical conflict and high levels of uncertainty. A new geopolitical event distressed markets at the end of the period as US and Israeli forces launched strikes against Iran, disrupting Mideast oil and natural gas exports. During the period, a pro-growth tax and spending bill was signed into law in the US, while in Europe, renewed focus on defense and infrastructure spending brightened the economic outlook. In Japan, the election of a pro-growth prime minister sent stocks to new highs prior to the conflict in Iran. Optimism over artificial intelligence remained high.
-
Considerable progress was made in trade talks between the US and many major trading partners, with a fragile truce between the US and China extended through late 2026. While the US Supreme Court struck down part of the Trump administration’s tariff strategy, the administration began deploying other authorities to largely replace the ones that were ruled unconstitutional.
-
Early in the period, moderating inflation pressures allowed many global central banks to ease monetary policy. Amid a difficult policymaking environment and slower job growth, the Federal Reserve resumed easing policy in September and delivered quarter-point rate cuts in October and December before pausing.
-
In fixed income markets, previously range-bound global bond yields spiked following the onset of the Middle East conflict, as energy-driven inflation fears appeared to have rattled bond investors. US rate volatility (as measured by the Merrill Lynch Option Volatility Estimate (MOVE) Index) similarly rose from intra-period lows, reflecting uncertainty around the scope and duration of the conflict and its implications for global growth. However, volatility later retracted as the risk of a broader regional military escalation appeared less likely. Global credit spreads widened only modestly before stabilizing near prior levels, supported by strong demand and resilient underlying fundamentals.
-
Top contributors to performance relative to the Blended Index:
-
The fund's fixed income segment was a primary contributor to relative performance, as the MFS Total Return Bond Fund outpaced its respective benchmark. From a style perspective, both emerging markets debt and high yield credit outperformed the broader index.
-
The international equity segment also benefited the fund's relative performance, as the MFS Blended Research International Equity Fund outperformed its respective benchmark.
-
-
Top detractors from performance relative to the Blended Index:
-
Within the US equity segment, lagging relative performance across the majority of the strategies weighed on relative results as the funds generally underperformed their respective benchmarks. Style selection also held back relative performance as mid-cap strategies underperformed the broader index.
-
FUND PERFORMANCE
The fund’s past performance is not a good predictor of the fund’s future performance. The graph and table below do not reflect the deduction of taxes that a shareholder would pay on fund distributions or the redemption of fund shares. The graph and table below assume reinvestment of dividends and capital gain distributions.
Growth of a Hypothetical $10,000 Investment
This graph shows the performance of a hypothetical $10,000 investment in Class I over a ten year period or since inception, if shorter, in comparison to (i) a broad measure of market performance and (ii) an additional index that MFS believes more closely reflects the market segments in which the fund invests.
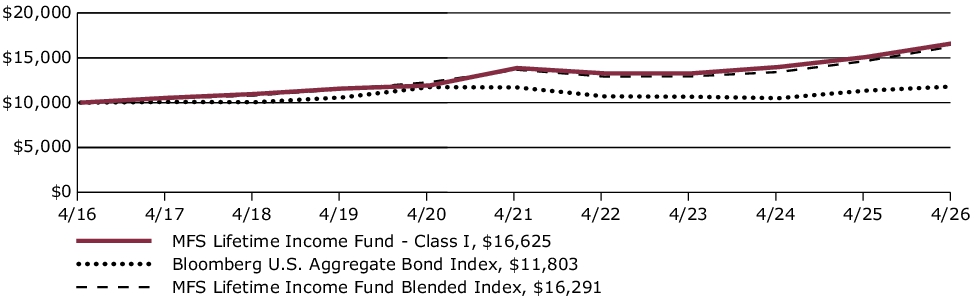
Average Annual Total Returns through 4/30/26
This table shows the average annual total returns of the class of shares noted for the periods shown, both with (if any) and without sales charges. It also shows the average annual total returns of (i) a broad measure of market performance and (ii) an additional index that MFS believes more closely reflects the market segments in which the fund invests, over the same periods.
| Share Class | 1-yr | 5-yr | 10-yr |
| I without sales charge | 10.20% | 3.71% | 5.21% |
| Comparative Benchmark(s) | |||
| Bloomberg U.S. Aggregate Bond Index ∆ | 4.06% | 0.18% | 1.67% |
| MFS Lifetime Income Fund Blended Index ∆ | 11.20% | 3.57% | 5.00% |
|
∆
|
Source: FactSet Research Systems Inc.
|
Visit mfs.com/perf/i for more recent performance information.
FUND STATISTICS AS OF 4/30/26
| Net Assets ($): | 503,389,615 | Total Management Fee ($)#: | 0 | |
| Total Number of Holdings: | 27 | Portfolio Turnover Rate (%): | 3 |
# The fund itself does not pay a management fee but the underlying funds in which the fund invests do pay management fees to MFS.
PORTFOLIO COMPOSITION (BASED ON TOTAL INVESTMENTS AS OF 4/30/26)
Portfolio allocation

Portfolio holdings
| MFS Limited Maturity Fund | 19.8% |
| MFS Total Return Bond Fund | 19.8% |
| MFS Inflation-Adjusted Bond Fund | 10.0% |
| MFS Government Securities Fund | 9.9% |
| MFS Global Opportunistic Bond Fund | 7.0% |
| MFS Blended Research Mid Cap Equity Fund | 3.1% |
| MFS Blended Research International Equity Fund | 2.8% |
| MFS Blended Research Value Equity Fund | 2.0% |
| MFS Global Real Estate Fund | 2.1% |
| MFS Commodity Strategy Fund | 2.0% |
| MFS Value Fund | 2.0% |
| MFS High Income Fund | 2.0% |
| MFS Growth Fund | 1.7% |
| MFS Research International Fund | 1.7% |
| MFS Blended Research Core Equity Fund | 1.7% |
| MFS Blended Research Growth Equity Fund | 1.7% |
| MFS Research Fund | 1.7% |
| MFS Mid Cap Growth Fund | 1.5% |
| MFS Mid Cap Value Fund | 1.5% |
| MFS Blended Research Small Cap Equity Fund | 1.0% |
| MFS Emerging Markets Debt Fund | 1.0% |
| MFS Institutional Money Market Portfolio | 1.0% |
| MFS Emerging Markets Debt Local Currency Fund | 1.0% |
| MFS International Intrinsic Equity Fund | 0.5% |
| MFS International Growth Fund | 0.5% |
| MFS New Discovery Fund | 0.5% |
| MFS New Discovery Value Fund | 0.5% |
FUND EXPENSES
What were the fund costs for the last year?
| (based on a hypothetical $10,000 investment) | ||
| Class Name | Costs of a $10,000 investment ~ | Costs paid as a percentage of a $10,000 investment ~ |
| R1 | $104 | 0.99% |
˜ Expenses are direct expenses and do not include underlying fund fees and expenses.
MANAGEMENT'S DISCUSSION OF FUND PERFORMANCE
-
For the twelve months ended April 30, 2026, Class R1 shares of the MFS Lifetime Income Fund (fund) provided a total return of 9.11%, at net asset value. This compares with a return of 4.06% for the fund’s benchmark, the Bloomberg U.S. Aggregate Bond Index. The fund's other benchmark, the MFS Lifetime Income Fund Blended Index (Blended Index), generated a return of 11.20%. The Blended Index reflects the blended returns of broad asset class indices, with percentage allocations to each index designed to resemble the long term strategic allocations of the fund. The market indices and related percentage allocations used to compile the Blended Index are set forth in the Fund Performance.
-
Global equity markets reached record levels during the period, withstanding considerable volatility amid tariffs, geopolitical conflict and high levels of uncertainty. A new geopolitical event distressed markets at the end of the period as US and Israeli forces launched strikes against Iran, disrupting Mideast oil and natural gas exports. During the period, a pro-growth tax and spending bill was signed into law in the US, while in Europe, renewed focus on defense and infrastructure spending brightened the economic outlook. In Japan, the election of a pro-growth prime minister sent stocks to new highs prior to the conflict in Iran. Optimism over artificial intelligence remained high.
-
Considerable progress was made in trade talks between the US and many major trading partners, with a fragile truce between the US and China extended through late 2026. While the US Supreme Court struck down part of the Trump administration’s tariff strategy, the administration began deploying other authorities to largely replace the ones that were ruled unconstitutional.
-
Early in the period, moderating inflation pressures allowed many global central banks to ease monetary policy. Amid a difficult policymaking environment and slower job growth, the Federal Reserve resumed easing policy in September and delivered quarter-point rate cuts in October and December before pausing.
-
In fixed income markets, previously range-bound global bond yields spiked following the onset of the Middle East conflict, as energy-driven inflation fears appeared to have rattled bond investors. US rate volatility (as measured by the Merrill Lynch Option Volatility Estimate (MOVE) Index) similarly rose from intra-period lows, reflecting uncertainty around the scope and duration of the conflict and its implications for global growth. However, volatility later retracted as the risk of a broader regional military escalation appeared less likely. Global credit spreads widened only modestly before stabilizing near prior levels, supported by strong demand and resilient underlying fundamentals.
-
Top contributors to performance relative to the Blended Index:
-
The fund's fixed income segment was a primary contributor to relative performance, as the MFS Total Return Bond Fund outpaced its respective benchmark. From a style perspective, both emerging markets debt and high yield credit outperformed the broader index.
-
The international equity segment also benefited the fund's relative performance, as the MFS Blended Research International Equity Fund outperformed its respective benchmark.
-
-
Top detractors from performance relative to the Blended Index:
-
Within the US equity segment, lagging relative performance across the majority of the strategies weighed on relative results as the funds generally underperformed their respective benchmarks. Style selection also held back relative performance as mid-cap strategies underperformed the broader index.
-
FUND PERFORMANCE
The fund’s past performance is not a good predictor of the fund’s future performance. The graph and table below do not reflect the deduction of taxes that a shareholder would pay on fund distributions or the redemption of fund shares. The graph and table below assume reinvestment of dividends and capital gain distributions.
Growth of a Hypothetical $10,000 Investment
This graph shows the performance of a hypothetical $10,000 investment in Class R1 over a ten year period or since inception, if shorter, in comparison to (i) a broad measure of market performance and (ii) an additional index that MFS believes more closely reflects the market segments in which the fund invests.
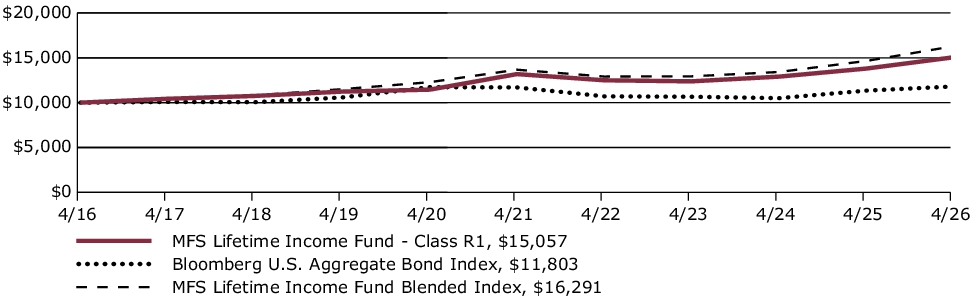
Average Annual Total Returns through 4/30/26
This table shows the average annual total returns of the class of shares noted for the periods shown, both with (if any) and without sales charges. It also shows the average annual total returns of (i) a broad measure of market performance and (ii) an additional index that MFS believes more closely reflects the market segments in which the fund invests, over the same periods.
| Share Class | 1-yr | 5-yr | 10-yr |
| R1 without sales charge | 9.11% | 2.69% | 4.18% |
| Comparative Benchmark(s) | |||
| Bloomberg U.S. Aggregate Bond Index ∆ | 4.06% | 0.18% | 1.67% |
| MFS Lifetime Income Fund Blended Index ∆ | 11.20% | 3.57% | 5.00% |
|
∆
|
Source: FactSet Research Systems Inc.
|
Visit mfs.com/perf/r1 for more recent performance information.
FUND STATISTICS AS OF 4/30/26
| Net Assets ($): | 503,389,615 | Total Management Fee ($)#: | 0 | |
| Total Number of Holdings: | 27 | Portfolio Turnover Rate (%): | 3 |
# The fund itself does not pay a management fee but the underlying funds in which the fund invests do pay management fees to MFS.
PORTFOLIO COMPOSITION (BASED ON TOTAL INVESTMENTS AS OF 4/30/26)
Portfolio allocation

Portfolio holdings
| MFS Limited Maturity Fund | 19.8% |
| MFS Total Return Bond Fund | 19.8% |
| MFS Inflation-Adjusted Bond Fund | 10.0% |
| MFS Government Securities Fund | 9.9% |
| MFS Global Opportunistic Bond Fund | 7.0% |
| MFS Blended Research Mid Cap Equity Fund | 3.1% |
| MFS Blended Research International Equity Fund | 2.8% |
| MFS Blended Research Value Equity Fund | 2.0% |
| MFS Global Real Estate Fund | 2.1% |
| MFS Commodity Strategy Fund | 2.0% |
| MFS Value Fund | 2.0% |
| MFS High Income Fund | 2.0% |
| MFS Growth Fund | 1.7% |
| MFS Research International Fund | 1.7% |
| MFS Blended Research Core Equity Fund | 1.7% |
| MFS Blended Research Growth Equity Fund | 1.7% |
| MFS Research Fund | 1.7% |
| MFS Mid Cap Growth Fund | 1.5% |
| MFS Mid Cap Value Fund | 1.5% |
| MFS Blended Research Small Cap Equity Fund | 1.0% |
| MFS Emerging Markets Debt Fund | 1.0% |
| MFS Institutional Money Market Portfolio | 1.0% |
| MFS Emerging Markets Debt Local Currency Fund | 1.0% |
| MFS International Intrinsic Equity Fund | 0.5% |
| MFS International Growth Fund | 0.5% |
| MFS New Discovery Fund | 0.5% |
| MFS New Discovery Value Fund | 0.5% |
| [1] | Expenses are direct expenses and do not include underlying fund fees and expenses. |
| [2] | The fund itself does not pay a management fee but the underlying funds in which the fund invests do pay management fees to MFS. |
| [3] | Expenses are direct expenses and do not include underlying fund fees and expenses. |
| [4] | The fund itself does not pay a management fee but the underlying funds in which the fund invests do pay management fees to MFS. |
| [5] | Expenses are direct expenses and do not include underlying fund fees and expenses. |
| [6] | The fund itself does not pay a management fee but the underlying funds in which the fund invests do pay management fees to MFS. |
| [7] | Expenses are direct expenses and do not include underlying fund fees and expenses. |
| [8] | The fund itself does not pay a management fee but the underlying funds in which the fund invests do pay management fees to MFS. |
| [9] | Expenses are direct expenses and do not include underlying fund fees and expenses. |
| [10] | The fund itself does not pay a management fee but the underlying funds in which the fund invests do pay management fees to MFS. |
| [11] | Expenses are direct expenses and do not include underlying fund fees and expenses. |
| [12] | The fund itself does not pay a management fee but the underlying funds in which the fund invests do pay management fees to MFS. |
| [13] | Expenses are direct expenses and do not include underlying fund fees and expenses. |
| [14] | The fund itself does not pay a management fee but the underlying funds in which the fund invests do pay management fees to MFS. |
| [15] | Expenses are direct expenses and do not include underlying fund fees and expenses. |
| [16] | The fund itself does not pay a management fee but the underlying funds in which the fund invests do pay management fees to MFS. |
| [17] | Includes the effect of any management fee waivers, if applicable. |
| [18] | Includes the effect of any management fee waivers, if applicable. |
| [19] | Includes the effect of any management fee waivers, if applicable. |
| [20] | Includes the effect of any management fee waivers, if applicable. |
| [21] | Includes the effect of any management fee waivers, if applicable. |
| [22] | Includes the effect of any management fee waivers, if applicable. |
| [23] | Includes the effect of any management fee waivers, if applicable. |
| [24] | Includes the effect of any management fee waivers, if applicable. |
| [25] | Expenses are direct expenses and do not include underlying fund fees and expenses. |
| [26] | The fund itself does not pay a management fee but the underlying funds in which the fund invests do pay management fees to MFS. |
| [27] | Expenses are direct expenses and do not include underlying fund fees and expenses. |
| [28] | The fund itself does not pay a management fee but the underlying funds in which the fund invests do pay management fees to MFS. |
| [29] | Expenses are direct expenses and do not include underlying fund fees and expenses. |
| [30] | The fund itself does not pay a management fee but the underlying funds in which the fund invests do pay management fees to MFS. |
| [31] | Expenses are direct expenses and do not include underlying fund fees and expenses. |
| [32] | The fund itself does not pay a management fee but the underlying funds in which the fund invests do pay management fees to MFS. |
| [33] | Expenses are direct expenses and do not include underlying fund fees and expenses. |
| [34] | The fund itself does not pay a management fee but the underlying funds in which the fund invests do pay management fees to MFS. |
| [35] | Expenses are direct expenses and do not include underlying fund fees and expenses. |
| [36] | The fund itself does not pay a management fee but the underlying funds in which the fund invests do pay management fees to MFS. |
| [37] | Expenses are direct expenses and do not include underlying fund fees and expenses. |
| [38] | The fund itself does not pay a management fee but the underlying funds in which the fund invests do pay management fees to MFS. |
| [39] | Expenses are direct expenses and do not include underlying fund fees and expenses. |
| [40] | The fund itself does not pay a management fee but the underlying funds in which the fund invests do pay management fees to MFS. |
| [41] | Expenses are direct expenses and do not include underlying fund fees and expenses |
| [42] | The fund itself does not pay a management fee but the underlying funds in which the fund invests do pay management fees to MFS. |
| [43] | Expenses are direct expenses and do not include underlying fund fees and expenses. |
| [44] | The fund itself does not pay a management fee but the underlying funds in which the fund invests do pay management fees to MFS. |
| [45] | Expenses are direct expenses and do not include underlying fund fees and expenses. |
| [46] | The fund itself does not pay a management fee but the underlying funds in which the fund invests do pay management fees to MFS. |
| [47] | Expenses are direct expenses and do not include underlying fund fees and expenses. |
| [48] | The fund itself does not pay a management fee but the underlying funds in which the fund invests do pay management fees to MFS. |
| [49] | Expenses are direct expenses and do not include underlying fund fees and expenses. |
| [50] | The fund itself does not pay a management fee but the underlying funds in which the fund invests do pay management fees to MFS. |
| [51] | Expenses are direct expenses and do not include underlying fund fees and expenses. |
| [52] | The fund itself does not pay a management fee but the underlying funds in which the fund invests do pay management fees to MFS. |
| [53] | Expenses are direct expenses and do not include underlying fund fees and expenses. |
| [54] | The fund itself does not pay a management fee but the underlying funds in which the fund invests do pay management fees to MFS. |
| [55] | Expenses are direct expenses and do not include underlying fund fees and expenses. |
| [56] | The fund itself does not pay a management fee but the underlying funds in which the fund invests do pay management fees to MFS. |
| [57] | Expenses are direct expenses and do not include underlying fund fees and expenses. |
| [58] | The fund itself does not pay a management fee but the underlying funds in which the fund invests do pay management fees to MFS. |
| [59] | Expenses are direct expenses and do not include underlying fund fees and expenses. |
| [60] | The fund itself does not pay a management fee but the underlying funds in which the fund invests do pay management fees to MFS. |
| [61] | Expenses are direct expenses and do not include underlying fund fees and expenses. |
| [62] | The fund itself does not pay a management fee but the underlying funds in which the fund invests do pay management fees to MFS. |
| [63] | Expenses are direct expenses and do not include underlying fund fees and expenses. |
| [64] | The fund itself does not pay a management fee but the underlying funds in which the fund invests do pay management fees to MFS. |
| [65] | Expenses are direct expenses and do not include underlying fund fees and expenses. |
| [66] | The fund itself does not pay a management fee but the underlying funds in which the fund invests do pay management fees to MFS. |
| [67] | Expenses are direct expenses and do not include underlying fund fees and expenses. |
| [68] | The fund itself does not pay a management fee but the underlying funds in which the fund invests do pay management fees to MFS. |
| [69] | Expenses are direct expenses and do not include underlying fund fees and expenses. |
| [70] | The fund itself does not pay a management fee but the underlying funds in which the fund invests do pay management fees to MFS. |
| [71] | Expenses are direct expenses and do not include underlying fund fees and expenses. |
| [72] | The fund itself does not pay a management fee but the underlying funds in which the fund invests do pay management fees to MFS. |
| [73] | Expenses are direct expenses and do not include underlying fund fees and expenses. |
| [74] | The fund itself does not pay a management fee but the underlying funds in which the fund invests do pay management fees to MFS. |
| [75] | Expenses are direct expenses and do not include underlying fund fees and expenses. |
| [76] | The fund itself does not pay a management fee but the underlying funds in which the fund invests do pay management fees to MFS. |
| [77] | Expenses are direct expenses and do not include underlying fund fees and expenses. |
| [78] | The fund itself does not pay a management fee but the underlying funds in which the fund invests do pay management fees to MFS. |
| [79] | Expenses are direct expenses and do not include underlying fund fees and expenses. |
| [80] | The fund itself does not pay a management fee but the underlying funds in which the fund invests do pay management fees to MFS. |
| [81] | Expenses are direct expenses and do not include underlying fund fees and expenses. |
| [82] | The fund itself does not pay a management fee but the underlying funds in which the fund invests do pay management fees to MFS. |
| [83] | Expenses are direct expenses and do not include underlying fund fees and expenses. |
| [84] | The fund itself does not pay a management fee but the underlying funds in which the fund invests do pay management fees to MFS. |
| [85] | Expenses are direct expenses and do not include underlying fund fees and expenses. |
| [86] | The fund itself does not pay a management fee but the underlying funds in which the fund invests do pay management fees to MFS. |
| [87] | Expenses are direct expenses and do not include underlying fund fees and expenses. |
| [88] | The fund itself does not pay a management fee but the underlying funds in which the fund invests do pay management fees to MFS. |
| [89] | Expenses are direct expenses and do not include underlying fund fees and expenses. |
| [90] | The fund itself does not pay a management fee but the underlying funds in which the fund invests do pay management fees to MFS. |
| [91] | Expenses are direct expenses and do not include underlying fund fees and expenses. |
| [92] | The fund itself does not pay a management fee but the underlying funds in which the fund invests do pay management fees to MFS. |
| [93] | Expenses are direct expenses and do not include underlying fund fees and expenses. |
| [94] | The fund itself does not pay a management fee but the underlying funds in which the fund invests do pay management fees to MFS. |
| [95] | Expenses are direct expenses and do not include underlying fund fees and expenses. |
| [96] | The fund itself does not pay a management fee but the underlying funds in which the fund invests do pay management fees to MFS. |
| [97] | Expenses are direct expenses and do not include underlying fund fees and expenses. |
| [98] | The fund itself does not pay a management fee but the underlying funds in which the fund invests do pay management fees to MFS. |
| [99] | Expenses are direct expenses and do not include underlying fund fees and expenses. |
| [100] | The fund itself does not pay a management fee but the underlying funds in which the fund invests do pay management fees to MFS. |
| [101] | Expenses are direct expenses and do not include underlying fund fees and expenses. |
| [102] | The fund itself does not pay a management fee but the underlying funds in which the fund invests do pay management fees to MFS. |
| [103] | Expenses are direct expenses and do not include underlying fund fees and expenses. |
| [104] | The fund itself does not pay a management fee but the underlying funds in which the fund invests do pay management fees to MFS. |
| [105] | Expenses are direct expenses and do not include underlying fund fees and expenses. |
| [106] | The fund itself does not pay a management fee but the underlying funds in which the fund invests do pay management fees to MFS. |
| [107] | Expenses are direct expenses and do not include underlying fund fees and expenses. |
| [108] | The fund itself does not pay a management fee but the underlying funds in which the fund invests do pay management fees to MFS. |
| [109] | Expenses are direct expenses and do not include underlying fund fees and expenses. |
| [110] | The fund itself does not pay a management fee but the underlying funds in which the fund invests do pay management fees to MFS. |
| [111] | Expenses are direct expenses and do not include underlying fund fees and expenses. |
| [112] | The fund itself does not pay a management fee but the underlying funds in which the fund invests do pay management fees to MFS. |
| [113] | Expenses are direct expenses and do not include underlying fund fees and expenses. |
| [114] | The fund itself does not pay a management fee but the underlying funds in which the fund invests do pay management fees to MFS. |
| [115] | Expenses are direct expenses and do not include underlying fund fees and expenses. |
| [116] | The fund itself does not pay a management fee but the underlying funds in which the fund invests do pay management fees to MFS. |
| [117] | Expenses are direct expenses and do not include underlying fund fees and expenses. |
| [118] | The fund itself does not pay a management fee but the underlying funds in which the fund invests do pay management fees to MFS. |
| [119] | Expenses are direct expenses and do not include underlying fund fees and expenses. |
| [120] | The fund itself does not pay a management fee but the underlying funds in which the fund invests do pay management fees to MFS. |
| [121] | Expenses are direct expenses and do not include underlying fund fees and expenses. |
| [122] | The fund itself does not pay a management fee but the underlying funds in which the fund invests do pay management fees to MFS. |
| [123] | Expenses are direct expenses and do not include underlying fund fees and expenses. |
| [124] | The fund itself does not pay a management fee but the underlying funds in which the fund invests do pay management fees to MFS. |
| [125] | Expenses are direct expenses and do not include underlying fund fees and expenses. |
| [126] | The fund itself does not pay a management fee but the underlying funds in which the fund invests do pay management fees to MFS. |
| [127] | Expenses are direct expenses and do not include underlying fund fees and expenses. |
| [128] | The fund itself does not pay a management fee but the underlying funds in which the fund invests do pay management fees to MFS. |
| [129] | Expenses are direct expenses and do not include underlying fund fees and expenses. |
| [130] | The fund itself does not pay a management fee but the underlying funds in which the fund invests do pay management fees to MFS. |
| [131] | Expenses are direct expenses and do not include underlying fund fees and expenses. |
| [132] | The fund itself does not pay a management fee but the underlying funds in which the fund invests do pay management fees to MFS. |
| [133] | Expenses are direct expenses and do not include underlying fund fees and expenses. |
| [134] | The fund itself does not pay a management fee but the underlying funds in which the fund invests do pay management fees to MFS. |
| [135] | Expenses are direct expenses and do not include underlying fund fees and expenses. |
| [136] | The fund itself does not pay a management fee but the underlying funds in which the fund invests do pay management fees to MFS. |
| [137] | Expenses are direct expenses and do not include underlying fund fees and expenses. |
| [138] | The fund itself does not pay a management fee but the underlying funds in which the fund invests do pay management fees to MFS. |
| [139] | Expenses are direct expenses and do not include underlying fund fees and expenses. |
| [140] | The fund itself does not pay a management fee but the underlying funds in which the fund invests do pay management fees to MFS. |
| [141] | Expenses are direct expenses and do not include underlying fund fees and expenses. |
| [142] | The fund itself does not pay a management fee but the underlying funds in which the fund invests do pay management fees to MFS. |
| [143] | Expenses are direct expenses and do not include underlying fund fees and expenses. |
| [144] | The fund itself does not pay a management fee but the underlying funds in which the fund invests do pay management fees to MFS. |
| [145] | Expenses are direct expenses and do not include underlying fund fees and expenses. |
| [146] | The fund itself does not pay a management fee but the underlying funds in which the fund invests do pay management fees to MFS. |
| [147] | Expenses are direct expenses and do not include underlying fund fees and expenses. |
| [148] | The fund itself does not pay a management fee but the underlying funds in which the fund invests do pay management fees to MFS. |
| [149] | Expenses are direct expenses and do not include underlying fund fees and expenses. |
| [150] | The fund itself does not pay a management fee but the underlying funds in which the fund invests do pay management fees to MFS. |
| [151] | Expenses are direct expenses and do not include underlying fund fees and expenses. |
| [152] | The fund itself does not pay a management fee but the underlying funds in which the fund invests do pay management fees to MFS. |
| [153] | Expenses are direct expenses and do not include underlying fund fees and expenses. |
| [154] | The fund itself does not pay a management fee but the underlying funds in which the fund invests do pay management fees to MFS. |
| [155] | Expenses are direct expenses and do not include underlying fund fees and expenses. |
| [156] | The fund itself does not pay a management fee but the underlying funds in which the fund invests do pay management fees to MFS. |
| [157] | Expenses are direct expenses and do not include underlying fund fees and expenses. |
| [158] | The fund itself does not pay a management fee but the underlying funds in which the fund invests do pay management fees to MFS. |
| [159] | Expenses are direct expenses and do not include underlying fund fees and expenses. |
| [160] | The fund itself does not pay a management fee but the underlying funds in which the fund invests do pay management fees to MFS. |
| [161] | Expenses are direct expenses and do not include underlying fund fees and expenses. |
| [162] | The fund itself does not pay a management fee but the underlying funds in which the fund invests do pay management fees to MFS. |
| [163] | Expenses are direct expenses and do not include underlying fund fees and expenses. |
| [164] | The fund itself does not pay a management fee but the underlying funds in which the fund invests do pay management fees to MFS. |
| [165] | Expenses are direct expenses and do not include underlying fund fees and expenses. |
| [166] | The fund itself does not pay a management fee but the underlying funds in which the fund invests do pay management fees to MFS. |
| [167] | Expenses are direct expenses and do not include underlying fund fees and expenses. |
| [168] | The fund itself does not pay a management fee but the underlying funds in which the fund invests do pay management fees to MFS. |
| [169] | Expenses are direct expenses and do not include underlying fund fees and expenses. |
| [170] | The fund itself does not pay a management fee but the underlying funds in which the fund invests do pay management fees to MFS. |
| [171] | Expenses are direct expenses and do not include underlying fund fees and expenses. |
| [172] | The fund itself does not pay a management fee but the underlying funds in which the fund invests do pay management fees to MFS. |
| [173] | Expenses are direct expenses and do not include underlying fund fees and expenses. |
| [174] | The fund itself does not pay a management fee but the underlying funds in which the fund invests do pay management fees to MFS. |
| [175] | Expenses are direct expenses and do not include underlying fund fees and expenses. |
| [176] | The fund itself does not pay a management fee but the underlying funds in which the fund invests do pay management fees to MFS. |
| [177] | Expenses are direct expenses and do not include underlying fund fees and expenses. |
| [178] | The fund itself does not pay a management fee but the underlying funds in which the fund invests do pay management fees to MFS. |
| [179] | Expenses are direct expenses and do not include underlying fund fees and expenses. |
| [180] | The fund itself does not pay a management fee but the underlying funds in which the fund invests do pay management fees to MFS. |
| [181] | Expenses are direct expenses and do not include underlying fund fees and expenses. |
| [182] | The fund itself does not pay a management fee but the underlying funds in which the fund invests do pay management fees to MFS. |
| [183] | Expenses are direct expenses and do not include underlying fund fees and expenses. |
| [184] | The fund itself does not pay a management fee but the underlying funds in which the fund invests do pay management fees to MFS. |
| [185] | Expenses are direct expenses and do not include underlying fund fees and expenses. |
| [186] | The fund itself does not pay a management fee but the underlying funds in which the fund invests do pay management fees to MFS. |