Pay vs Performance Disclosure - USD ($)
|
1 Months Ended |
4 Months Ended |
8 Months Ended |
11 Months Ended |
12 Months Ended |
May 10, 2024 |
Aug. 15, 2025 |
Mar. 31, 2026 |
Mar. 31, 2025 |
Mar. 31, 2026 |
Mar. 31, 2025 |
Mar. 31, 2024 |
| Pay vs Performance Disclosure |
|
|
|
|
|
|
|
| Pay vs Performance Disclosure, Table |
|
|
|
|
| | | | | | | | | | | | | | | | | | | | | | | | | | | | | | | | | | | | | Year1 | | Summary
Compensation
Table Total for
CEO (Hulett) | Summary
Compensation
Table Total for
CEO (Campos) | | Summary
Compensation
Table Total for
CEO (Campbell) | Compensation Actually Paid to CEO (Hulett) 2 | Compensation Actually Paid to CEO (Campos) 2 | Compensation Actually Paid to CEO (Campbell) 2 | Average
Summary
Compensation
Table
Total for
Other NEOs | Average Compensation Actually Paid to Other NEOs 2 | Value of Initial Fixed $100 Investment Based On Company Cumulative TSR3 | | Net Income
($Mn) | | | | 2026 | | $— | $683,759 | | $830,219 | $— | $-1,532,892 | $812,994 | $469,113 | $31,443 | $9.47 | | -$57.29 | | | 2025 | | $242,980 | $3,894,599 | | $— | $224,230 | $3,667,160 | $— | $666,245 | $630,754 | $17.41 | | -$6.27 | | | 2024 | | $534,019 | $— | | $— | -$70,181 | $— | $— | $635,255 | $358,968 | $19.90 | | -$7.46 | |
|
|
|
| Named Executive Officers, Footnote |
|
|
|
|
The CEO and other NEOs for the indicated years were as follows: (i) for FY 2026, our CEOs were Ms. Campbell, who has served as our Interim Chief Executive Officer since August 2025, and Ms. Campos, who served as our Chief Executive Officer from April 29, 2024 until her resignation on August 15, 2025, and our other NEOs were Ms. Robyn D’Elia and Mr. Douglas Krulik; (ii) for FY 2025, our CEOs were Mr. Mathew N. Hulett, who served as our CEO from August 30, 2021 to May 10, 2024 and Ms. Campos, and our other NEOs were Ms. Robyn D’Elia, Mr. Douglas Krulik and Ms. Christine Chambers; (iii) for FY 2024, our CEO was Mr. Mathew N. Hulett, who served as our CEO from August 30, 2021 to May 10, 2024 and our other NEO was Ms. Christine Chambers, who had served as our CFO since August 3, 2022.
|
|
|
| Adjustment To PEO Compensation, Footnote |
|
|
|
|
Amounts reported in this column are based on total compensation reported for our CEOs and other NEOs in the Summary Compensation Table (SCT) for the indicated fiscal years and adjusted as shown in the table below. Fair value of equity awards was computed in accordance with the Company’s methodology used for financial reporting purposes. | | | | | | | | | | Campbell | Campos | | 2026 | 2026 | Total Compensation for CEO as reported SCT for the covered year | $ | 830,219 | | $ | 683,759 | | Deduct pension values reported in SCT for the covered year | – | | – | | Deduct grant date fair value of equity awards reported in SCT for the covered year | – | | – | | Add pension value attributable to current year’s service and any change in pension value attributable to plan amendments made in the covered year | – | | – | | Add fair values as of the end of the covered year of all equity awards granted during the covered year that are outstanding and unvested as of the end of such covered year | – | | – | | Add fair value as of the vesting date of any awards granted in the covered year that vested during the covered year | – | | – | | Add dividends paid on unvested shares/share units and stock options | – | | – | | Add the change in fair value (whether positive or negative) as of the end of the covered year of any equity awards granted in any prior year that are outstanding and unvested as of the end of such covered year. | (4,775) | | – | | Add the change in fair value (whether positive or negative) as of the vesting date of any equity awards granted in any prior year for which all applicable vesting conditions were satisfied during the covered year | (12,450) | | (226,873) | | Subtract the fair value of any equity awards granted in a prior year that were forfeited in the covered year determined as of the end of the prior year | – | | 1,989,778 | | Compensation Actually Paid to CEO | $ | 812,994 | | $ | (1,532,892) | |
|
|
|
| Non-PEO NEO Average Total Compensation Amount |
|
|
|
|
$ 469,113
|
$ 666,245
|
$ 635,255
|
| Non-PEO NEO Average Compensation Actually Paid Amount |
|
|
|
|
$ 31,443
|
630,754
|
358,968
|
| Adjustment to Non-PEO NEO Compensation Footnote |
|
|
|
|
Amounts reported in this column are based on total compensation reported for our CEOs and other NEOs in the Summary Compensation Table (SCT) for the indicated fiscal years and adjusted as shown in the table below. Fair value of equity awards was computed in accordance with the Company’s methodology used for financial reporting purposes. | | | | | | | 2026 | | | | Total Compensation for Other NEOs as reported SCT for the covered year | $ | 469,113 | | Deduct pension values reported in SCT for the covered year | – | | Deduct grant date fair value of equity awards reported in SCT for the covered year | 39,400 | | Add pension value attributable to current year’s service and any change in pension value attributable to plan amendments made in the covered year | – | | Add fair values as of the end of the covered year of all equity awards granted during the covered year that are outstanding and unvested as of the end of such covered year | 22,800 | | Add fair value as of the vesting date of any awards granted in the covered year that vested during the covered year | 12,950 | | Add dividends paid on unvested shares/share units and stock options | – | | Add the change in fair value (whether positive or negative) as of the end of the covered year of any equity awards granted in any prior year that are outstanding and unvested as of the end of such covered year. | (25,467) | | Add the change in fair value (whether positive or negative) as of the vesting date of any equity awards granted in any prior year for which all applicable vesting conditions were satisfied during the covered year | (56,038) | | Subtract the fair value of any equity awards granted in a prior year that were forfeited in the covered year determined as of the end of the prior year | 352,515 | | | Compensation Actually Paid to Other NEOs | 31,443 | |
|
|
|
| Compensation Actually Paid vs. Total Shareholder Return |
|
|
|
|
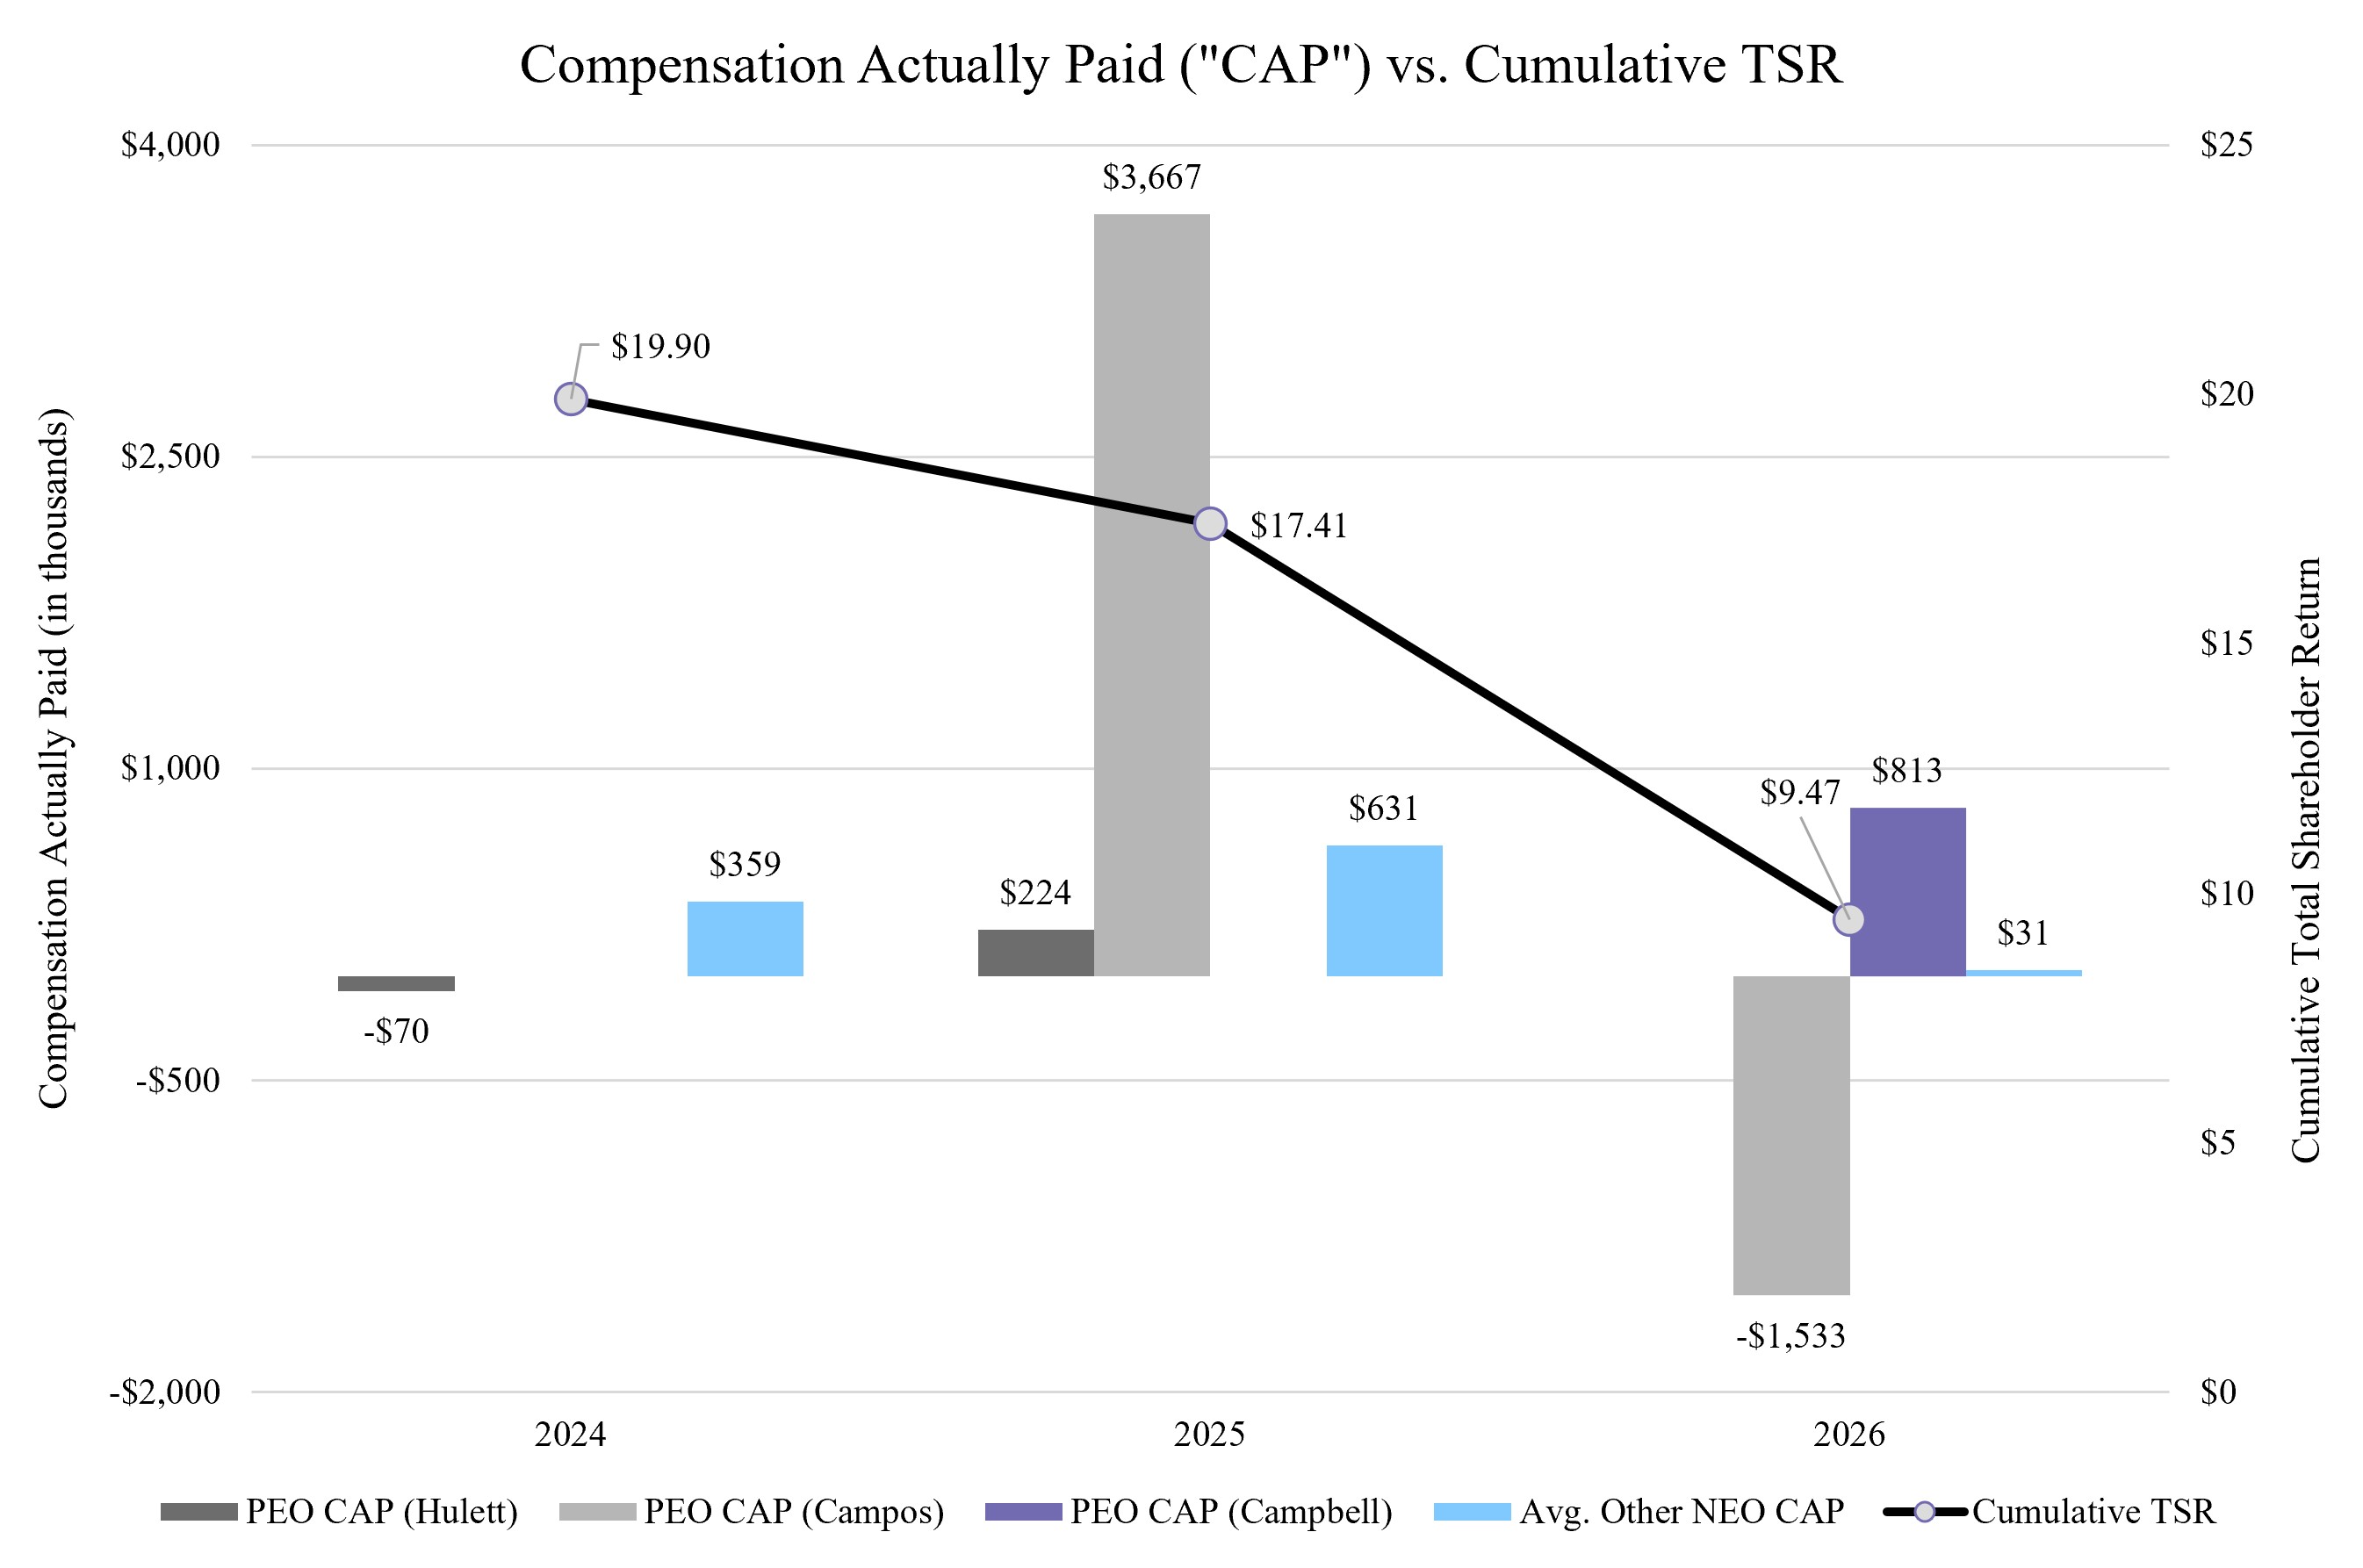
The charts below describe the relationship between compensation actually paid to our chief executive officer and to our other Named Executive Officers (as calculated above) and our cumulative TSR and net income for the indicated years.
|
|
|
| Compensation Actually Paid vs. Net Income |
|
|
|
|
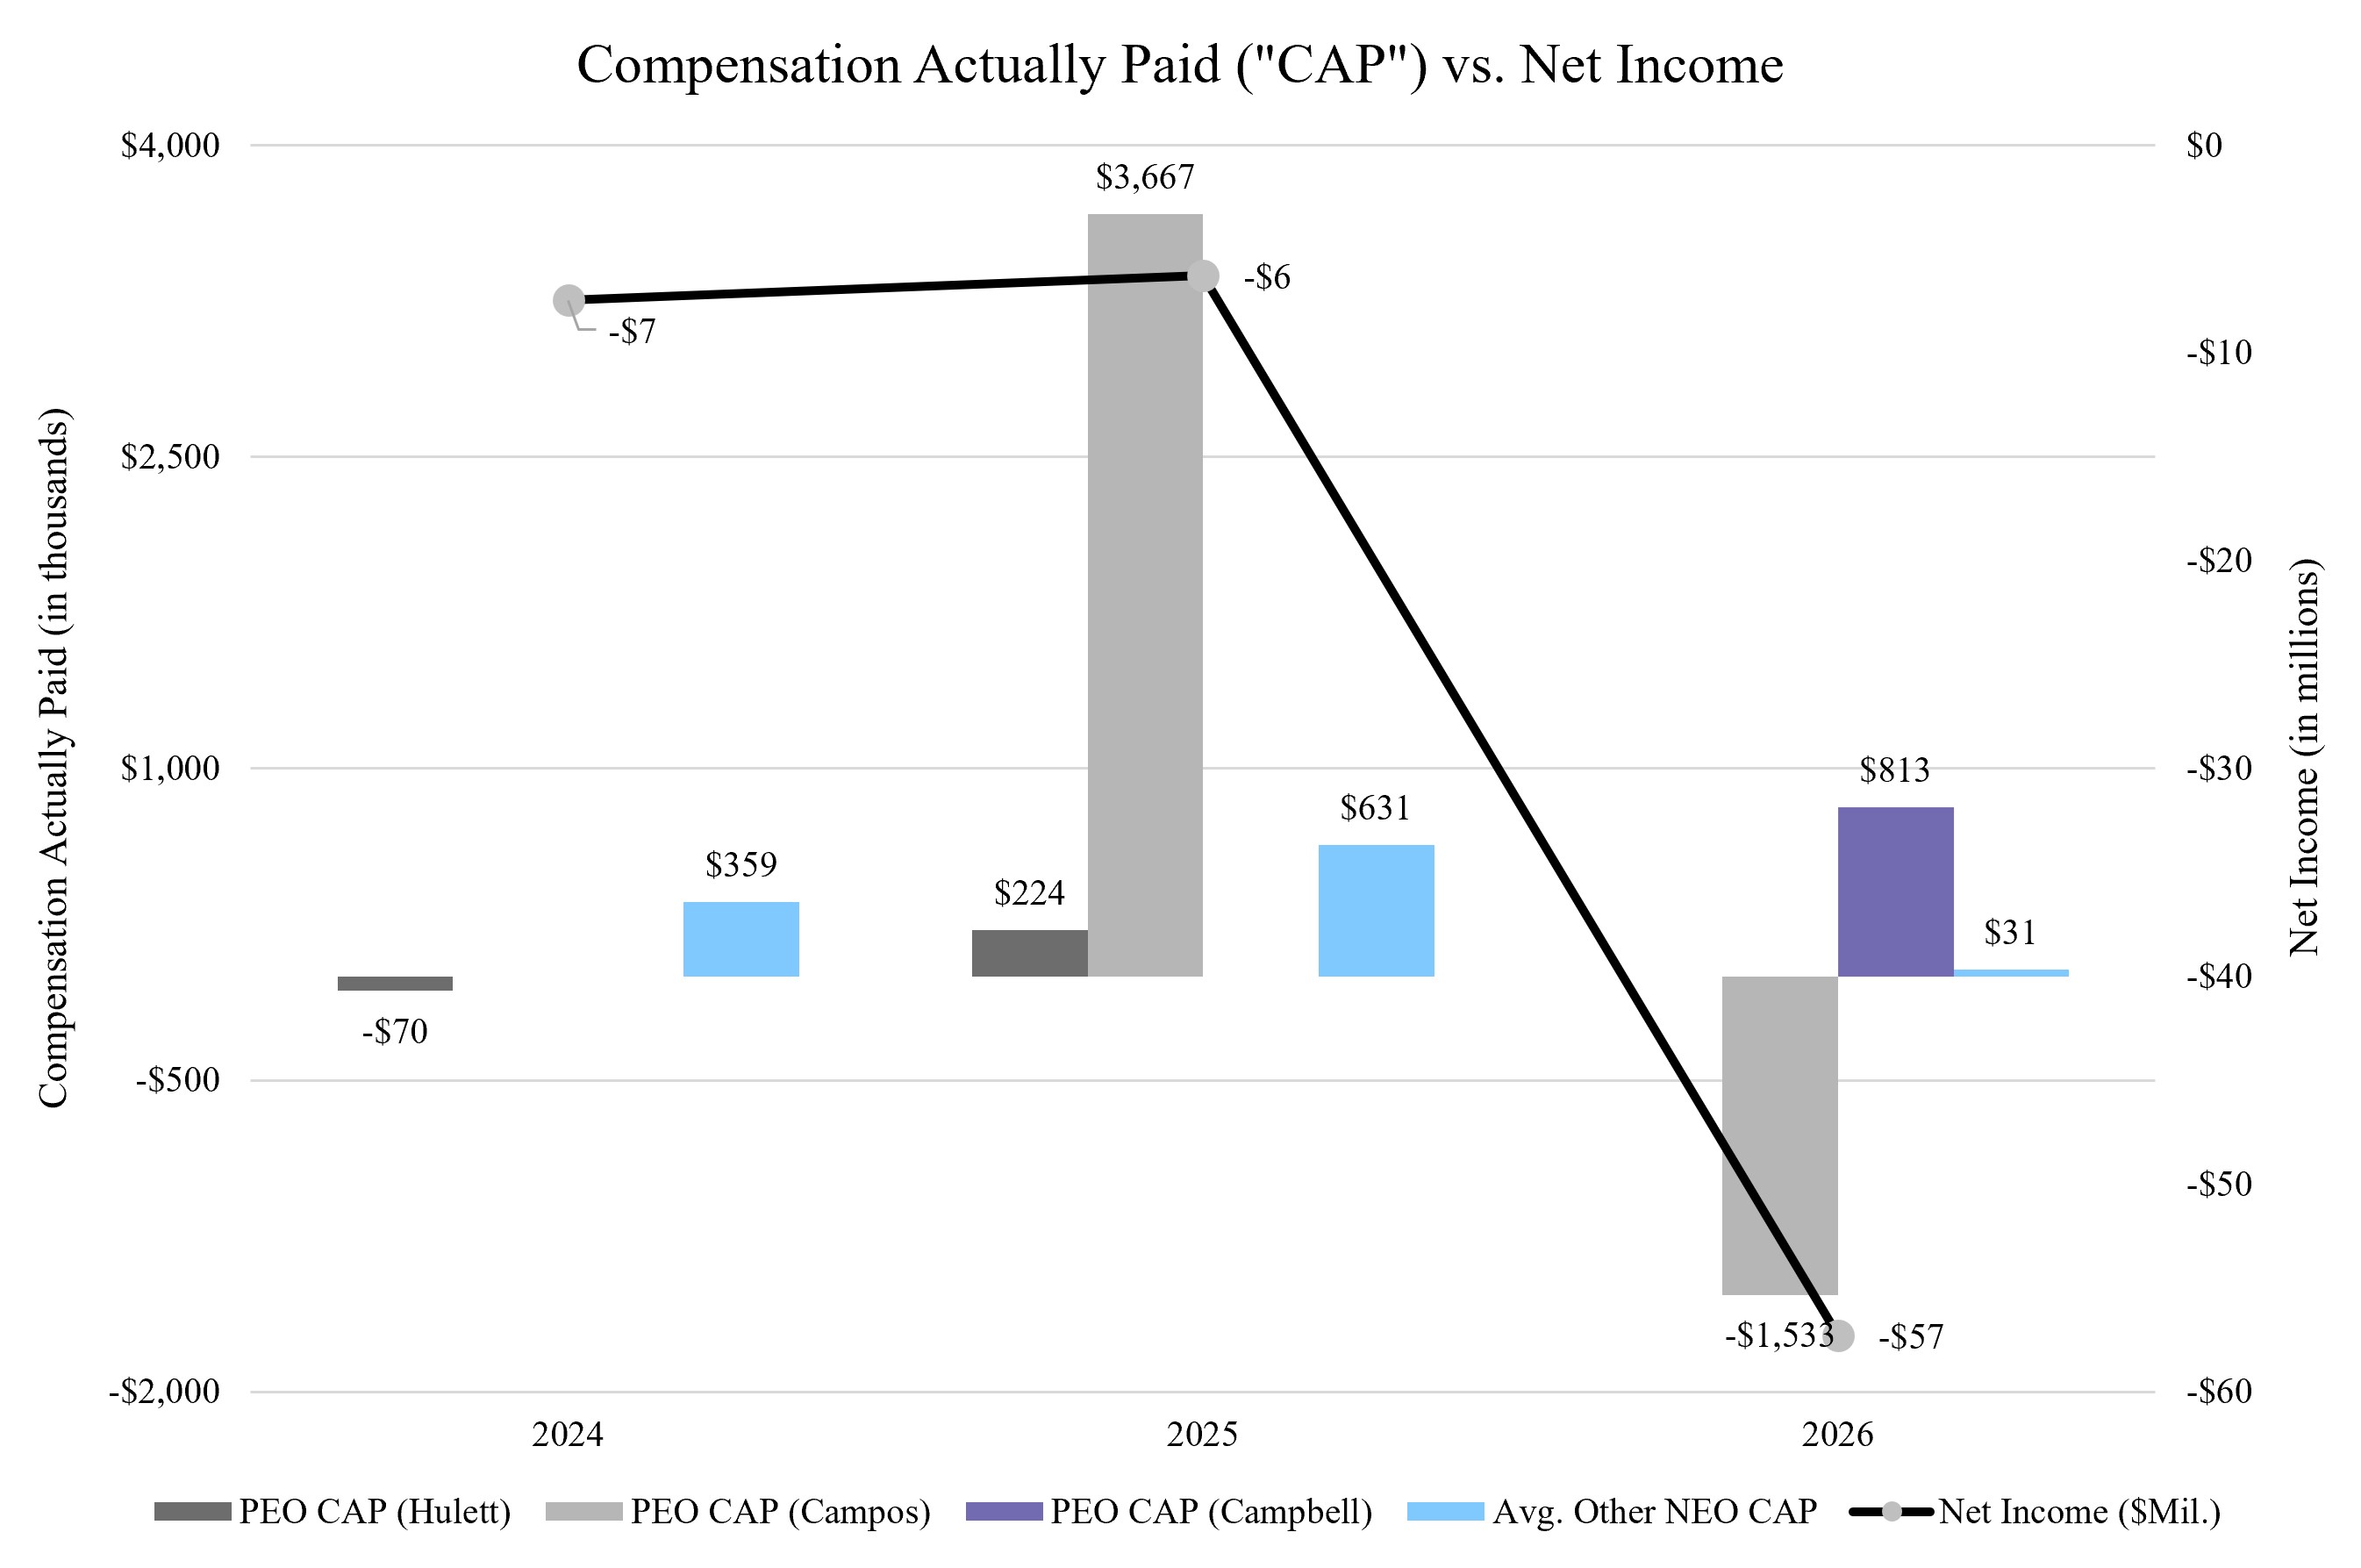
The charts below describe the relationship between compensation actually paid to our chief executive officer and to our other Named Executive Officers (as calculated above) and our cumulative TSR and net income for the indicated years.
|
|
|
| Total Shareholder Return Amount |
|
|
|
|
$ 9.47
|
17.41
|
19.90
|
| Net Income (Loss) |
|
|
|
|
$ (57,290,000)
|
(6,270,000)
|
$ (7,460,000)
|
| PEO Name |
Mr. Mathew N. Hulett
|
Ms. Campos
|
Ms. Campbell
|
Ms. Campos
|
|
|
Mr. Mathew N. Hulett
|
| Additional 402(v) Disclosure |
|
|
|
|
Total Stockholder Return is determined based on the value of an initial fixed investment of $100 in our common stock as of March 31, 2023.
|
|
|
| Campos [Member] |
|
|
|
|
|
|
|
| Pay vs Performance Disclosure |
|
|
|
|
|
|
|
| PEO Total Compensation Amount |
|
|
|
|
$ 683,759
|
3,894,599
|
|
| PEO Actually Paid Compensation Amount |
|
|
|
|
(1,532,892)
|
3,667,160
|
|
| Campbell [Member] |
|
|
|
|
|
|
|
| Pay vs Performance Disclosure |
|
|
|
|
|
|
|
| PEO Total Compensation Amount |
|
|
|
|
830,219
|
|
|
| PEO Actually Paid Compensation Amount |
|
|
|
|
812,994
|
|
|
| Hulett [Member] |
|
|
|
|
|
|
|
| Pay vs Performance Disclosure |
|
|
|
|
|
|
|
| PEO Total Compensation Amount |
|
|
|
|
|
242,980
|
$ 534,019
|
| PEO Actually Paid Compensation Amount |
|
|
|
|
|
$ 224,230
|
$ (70,181)
|
| PEO | Campos [Member] | Aggregate Change in Present Value of Accumulated Benefit for All Pension Plans Reported in Summary Compensation Table |
|
|
|
|
|
|
|
| Pay vs Performance Disclosure |
|
|
|
|
|
|
|
| Adjustment to Compensation, Amount |
|
|
|
|
0
|
|
|
| PEO | Campos [Member] | Pension Adjustments Service Cost |
|
|
|
|
|
|
|
| Pay vs Performance Disclosure |
|
|
|
|
|
|
|
| Adjustment to Compensation, Amount |
|
|
|
|
0
|
|
|
| PEO | Campos [Member] | Aggregate Grant Date Fair Value of Equity Award Amounts Reported in Summary Compensation Table |
|
|
|
|
|
|
|
| Pay vs Performance Disclosure |
|
|
|
|
|
|
|
| Adjustment to Compensation, Amount |
|
|
|
|
0
|
|
|
| PEO | Campos [Member] | Year-end Fair Value of Equity Awards Granted in Covered Year that are Outstanding and Unvested |
|
|
|
|
|
|
|
| Pay vs Performance Disclosure |
|
|
|
|
|
|
|
| Adjustment to Compensation, Amount |
|
|
|
|
0
|
|
|
| PEO | Campos [Member] | Year-over-Year Change in Fair Value of Equity Awards Granted in Prior Years That are Outstanding and Unvested |
|
|
|
|
|
|
|
| Pay vs Performance Disclosure |
|
|
|
|
|
|
|
| Adjustment to Compensation, Amount |
|
|
|
|
0
|
|
|
| PEO | Campos [Member] | Vesting Date Fair Value of Equity Awards Granted and Vested in Covered Year |
|
|
|
|
|
|
|
| Pay vs Performance Disclosure |
|
|
|
|
|
|
|
| Adjustment to Compensation, Amount |
|
|
|
|
0
|
|
|
| PEO | Campos [Member] | Change in Fair Value as of Vesting Date of Prior Year Equity Awards Vested in Covered Year |
|
|
|
|
|
|
|
| Pay vs Performance Disclosure |
|
|
|
|
|
|
|
| Adjustment to Compensation, Amount |
|
|
|
|
(226,873)
|
|
|
| PEO | Campos [Member] | Prior Year End Fair Value of Equity Awards Granted in Any Prior Year that Fail to Meet Applicable Vesting Conditions During Covered Year |
|
|
|
|
|
|
|
| Pay vs Performance Disclosure |
|
|
|
|
|
|
|
| Adjustment to Compensation, Amount |
|
|
|
|
(1,989,778)
|
|
|
| PEO | Campos [Member] | Dividends or Other Earnings Paid on Equity Awards not Otherwise Reflected in Total Compensation for Covered Year |
|
|
|
|
|
|
|
| Pay vs Performance Disclosure |
|
|
|
|
|
|
|
| Adjustment to Compensation, Amount |
|
|
|
|
0
|
|
|
| PEO | Campbell [Member] | Aggregate Change in Present Value of Accumulated Benefit for All Pension Plans Reported in Summary Compensation Table |
|
|
|
|
|
|
|
| Pay vs Performance Disclosure |
|
|
|
|
|
|
|
| Adjustment to Compensation, Amount |
|
|
|
|
0
|
|
|
| PEO | Campbell [Member] | Pension Adjustments Service Cost |
|
|
|
|
|
|
|
| Pay vs Performance Disclosure |
|
|
|
|
|
|
|
| Adjustment to Compensation, Amount |
|
|
|
|
0
|
|
|
| PEO | Campbell [Member] | Aggregate Grant Date Fair Value of Equity Award Amounts Reported in Summary Compensation Table |
|
|
|
|
|
|
|
| Pay vs Performance Disclosure |
|
|
|
|
|
|
|
| Adjustment to Compensation, Amount |
|
|
|
|
0
|
|
|
| PEO | Campbell [Member] | Year-end Fair Value of Equity Awards Granted in Covered Year that are Outstanding and Unvested |
|
|
|
|
|
|
|
| Pay vs Performance Disclosure |
|
|
|
|
|
|
|
| Adjustment to Compensation, Amount |
|
|
|
|
0
|
|
|
| PEO | Campbell [Member] | Year-over-Year Change in Fair Value of Equity Awards Granted in Prior Years That are Outstanding and Unvested |
|
|
|
|
|
|
|
| Pay vs Performance Disclosure |
|
|
|
|
|
|
|
| Adjustment to Compensation, Amount |
|
|
|
|
(4,775)
|
|
|
| PEO | Campbell [Member] | Vesting Date Fair Value of Equity Awards Granted and Vested in Covered Year |
|
|
|
|
|
|
|
| Pay vs Performance Disclosure |
|
|
|
|
|
|
|
| Adjustment to Compensation, Amount |
|
|
|
|
0
|
|
|
| PEO | Campbell [Member] | Change in Fair Value as of Vesting Date of Prior Year Equity Awards Vested in Covered Year |
|
|
|
|
|
|
|
| Pay vs Performance Disclosure |
|
|
|
|
|
|
|
| Adjustment to Compensation, Amount |
|
|
|
|
(12,450)
|
|
|
| PEO | Campbell [Member] | Prior Year End Fair Value of Equity Awards Granted in Any Prior Year that Fail to Meet Applicable Vesting Conditions During Covered Year |
|
|
|
|
|
|
|
| Pay vs Performance Disclosure |
|
|
|
|
|
|
|
| Adjustment to Compensation, Amount |
|
|
|
|
0
|
|
|
| PEO | Campbell [Member] | Dividends or Other Earnings Paid on Equity Awards not Otherwise Reflected in Total Compensation for Covered Year |
|
|
|
|
|
|
|
| Pay vs Performance Disclosure |
|
|
|
|
|
|
|
| Adjustment to Compensation, Amount |
|
|
|
|
0
|
|
|
| Non-PEO NEO | Aggregate Change in Present Value of Accumulated Benefit for All Pension Plans Reported in Summary Compensation Table |
|
|
|
|
|
|
|
| Pay vs Performance Disclosure |
|
|
|
|
|
|
|
| Adjustment to Compensation, Amount |
|
|
|
|
0
|
|
|
| Non-PEO NEO | Pension Adjustments Service Cost |
|
|
|
|
|
|
|
| Pay vs Performance Disclosure |
|
|
|
|
|
|
|
| Adjustment to Compensation, Amount |
|
|
|
|
0
|
|
|
| Non-PEO NEO | Aggregate Grant Date Fair Value of Equity Award Amounts Reported in Summary Compensation Table |
|
|
|
|
|
|
|
| Pay vs Performance Disclosure |
|
|
|
|
|
|
|
| Adjustment to Compensation, Amount |
|
|
|
|
(39,400)
|
|
|
| Non-PEO NEO | Year-end Fair Value of Equity Awards Granted in Covered Year that are Outstanding and Unvested |
|
|
|
|
|
|
|
| Pay vs Performance Disclosure |
|
|
|
|
|
|
|
| Adjustment to Compensation, Amount |
|
|
|
|
22,800
|
|
|
| Non-PEO NEO | Year-over-Year Change in Fair Value of Equity Awards Granted in Prior Years That are Outstanding and Unvested |
|
|
|
|
|
|
|
| Pay vs Performance Disclosure |
|
|
|
|
|
|
|
| Adjustment to Compensation, Amount |
|
|
|
|
(25,467)
|
|
|
| Non-PEO NEO | Vesting Date Fair Value of Equity Awards Granted and Vested in Covered Year |
|
|
|
|
|
|
|
| Pay vs Performance Disclosure |
|
|
|
|
|
|
|
| Adjustment to Compensation, Amount |
|
|
|
|
12,950
|
|
|
| Non-PEO NEO | Change in Fair Value as of Vesting Date of Prior Year Equity Awards Vested in Covered Year |
|
|
|
|
|
|
|
| Pay vs Performance Disclosure |
|
|
|
|
|
|
|
| Adjustment to Compensation, Amount |
|
|
|
|
(56,038)
|
|
|
| Non-PEO NEO | Prior Year End Fair Value of Equity Awards Granted in Any Prior Year that Fail to Meet Applicable Vesting Conditions During Covered Year |
|
|
|
|
|
|
|
| Pay vs Performance Disclosure |
|
|
|
|
|
|
|
| Adjustment to Compensation, Amount |
|
|
|
|
(352,515)
|
|
|
| Non-PEO NEO | Dividends or Other Earnings Paid on Equity Awards not Otherwise Reflected in Total Compensation for Covered Year |
|
|
|
|
|
|
|
| Pay vs Performance Disclosure |
|
|
|
|
|
|
|
| Adjustment to Compensation, Amount |
|
|
|
|
$ 0
|
|
|