Performance Management
|
Jun. 25, 2026 |
| FM Compounders Equity ETF |
|
| Prospectus [Line Items] |
|
| Bar Chart and Performance Table [Heading] |
Performance:
|
| Performance Narrative [Text Block] |
The bar chart and performance table below show the variability of the Fund’s returns, which is some indication of the risks
of investing in the Fund. The bar chart shows performance of the Fund’s shares for each calendar year since the Fund’s inception.
The performance table compares the performance of the Fund over time to the performance of a broad-based securities market index. You
should be aware that the Fund’s past performance (before and after taxes) is not necessarily an indication of how the Fund will
perform in the future. Updated performance information is available at no cost by visiting www.FMCE.com or by calling 888-530-2448.
|
| Performance Past Does Not Indicate Future [Text] |
You
should be aware that the Fund’s past performance (before and after taxes) is not necessarily an indication of how the Fund will
perform in the future.
|
| Performance Information Illustrates Variability of Returns [Text] |
The bar chart and performance table below show the variability of the Fund’s returns, which is some indication of the risks
of investing in the Fund. The bar chart shows performance of the Fund’s shares for each calendar year since the Fund’s inception
|
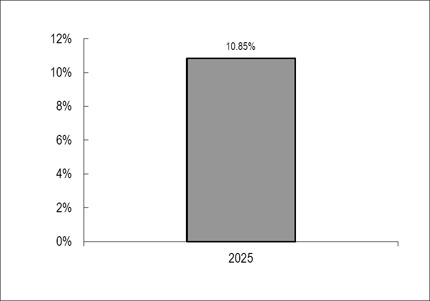
| Bar Chart [Heading] |
Performance
Bar Chart For Calendar Years Ended December 31
|
| Bar Chart [Table] |
|
| Bar Chart Closing [Text Block] |
| Best
Quarter: |
2nd
Quarter 2025 |
6.40% |
| Worst
Quarter: |
4th
Quarter 2025 |
(0.32)% |
The
Fund’s year-to-date return as of the most recent calendar quarter, which ended March 31, 2026 was (5.19)%
|
| Year to Date Return, Label [Optional Text] |
The
Fund’s year-to-date return as of the most recent calendar quarter
|
| Bar Chart, Year to Date Return |
(5.19%)
|
| Bar Chart, Year to Date Return, Date |
Mar. 31, 2026
|
| Highest Quarterly Return, Label [Optional Text] |
Best
Quarter:
|
| Highest Quarterly Return |
6.40%
|
| Highest Quarterly Return, Date |
Jun. 30, 2025
|
| Lowest Quarterly Return, Label [Optional Text] |
Worst
Quarter:
|
| Lowest Quarterly Return |
(0.32%)
|
| Lowest Quarterly Return, Date |
Dec. 31, 2025
|
| Performance Table Heading |
Performance
Table
Average
Annual Total Returns
(For
periods ended December 31, 2025)
|
| Performance Table Uses Highest Federal Rate |
After-tax
returns are calculated using the historical highest individual federal marginal income tax rates and do not reflect the impact of state
and local taxes.
|
| Performance Table Not Relevant to Tax Deferred |
Actual after-tax returns depend on an investor’s tax situation and may differ from those shown, and after-tax
returns shown are not relevant to investors who hold their Shares through tax-deferred arrangements, such as 401(k) plans or individual
retirement accounts.
|
| Performance [Table] |
| |
One
Year |
Since
Inception
(11/08/2024) |
| Return
before taxes |
10.85% |
7.36% |
| Return
after taxes on distributions |
10.03% |
6.62% |
| Return
after taxes on distributions and sale of Fund shares |
7.01% |
5.61% |
| S&P
500® Equal Weight Index* |
11.43% |
5.64% |
| * | The
S&P 500® Equal Weight Index (the “Index”) is an unmanaged index
which measures the performance of 500 large-cap common stocks actively traded in the United
States and assigns equal weight to each company. Index returns assume reinvestment of dividends.
Investors may not invest in the Index directly; unlike the Fund’s returns, the Index
does not reflect any fees or expenses. |
|
| Index No Deduction for Fees, Expenses, or Taxes [Text] |
the Index
does not reflect any fees or expenses
|
| Performance Table Closing [Text Block] |
After-tax
returns are calculated using the historical highest individual federal marginal income tax rates and do not reflect the impact of state
and local taxes. Actual after-tax returns depend on an investor’s tax situation and may differ from those shown, and after-tax
returns shown are not relevant to investors who hold their Shares through tax-deferred arrangements, such as 401(k) plans or individual
retirement accounts.
|
| Performance Availability Website Address [Text] |
www.FMCE.com
|
| Performance Availability Phone [Text] |
888-530-2448
|
| FM Focus Equity ETF |
|
| Prospectus [Line Items] |
|
| Bar Chart and Performance Table [Heading] |
Performance:
|
| Performance Narrative [Text Block] |
The
bar chart and performance table below show the variability of the Fund’s returns, which is some indication of the risks of investing
in the Fund. The bar chart shows performance of the Fund’s shares for each calendar year since the Fund’s inception. The performance
table compares the performance of the Fund over time to the performance of a broad-based securities market index. You should be aware
that the Fund’s past performance (before and after taxes) is not necessarily an indication of how the Fund will perform in the future. Updated performance information is available at no cost by visiting www.FMCX.com or by calling 888-530-2448.
|
| Performance Past Does Not Indicate Future [Text] |
You should be aware
that the Fund’s past performance (before and after taxes) is not necessarily an indication of how the Fund will perform in the future.
|
| Performance Information Illustrates Variability of Returns [Text] |
The
bar chart and performance table below show the variability of the Fund’s returns, which is some indication of the risks of investing
in the Fund. The bar chart shows performance of the Fund’s shares for each calendar year since the Fund’s inception.
|
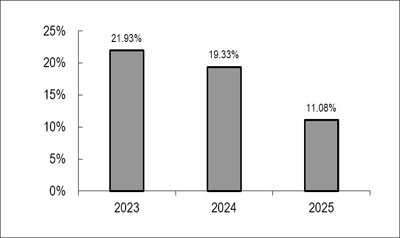
| Bar Chart [Heading] |
Performance
Bar Chart For Calendar Years Ended December 31
|
| Bar Chart [Table] |
| |
2023 |
2024 |
2025 |
| |
21.93% |
19.33% |
11.08% |
|
| Bar Chart Closing [Text Block] |
| Best
Quarter: |
4th
Quarter 2023 |
12.34% |
| Worst
Quarter: |
3rd
Quarter 2023 |
(4.81)% |
The
Fund’s year-to-date return as of the most recent calendar quarter, which ended March
31, 2026 was (6.76)%
|
| Year to Date Return, Label [Optional Text] |
The
Fund’s year-to-date return as of the most recent calendar quarter
|
| Bar Chart, Year to Date Return |
(6.76%)
|
| Bar Chart, Year to Date Return, Date |
Mar. 31, 2026
|
| Highest Quarterly Return, Label [Optional Text] |
Best
Quarter:
|
| Highest Quarterly Return |
12.34%
|
| Highest Quarterly Return, Date |
Dec. 31, 2023
|
| Lowest Quarterly Return, Label [Optional Text] |
Worst
Quarter:
|
| Lowest Quarterly Return |
(4.81%)
|
| Lowest Quarterly Return, Date |
Sep. 30, 2023
|
| Performance Table Heading |
Performance
Table
Average
Annual Total Returns
(For
periods ended December 31, 2025)
|
| Performance Table Uses Highest Federal Rate |
After-tax
returns are calculated using the historical highest individual federal marginal income tax rates and do not reflect the impact of state
and local taxes.
|
| Performance Table Not Relevant to Tax Deferred |
Actual after-tax returns depend on an investor’s tax situation and may differ from those shown, and after-tax
returns shown are not relevant to investors who hold their Shares through tax-deferred arrangements, such as 401(k) plans or individual
retirement accounts.
|
| Performance [Table] |
| |
One
Year |
Since
Inception
(4/22/2022) |
| Return
before taxes |
11.08% |
10.47% |
| Return
after taxes on distributions |
10.98% |
10.12% |
| Return
after taxes on distributions and sale of Fund shares |
6.62% |
8.16% |
| S&P
500® Index* |
17.88% |
15.32% |
| * | The
S&P 500® Index (the “Index”) is an unmanaged free-float capitalization-weighted
index which measures the performance of 500 large-cap common stocks actively traded in the
United States. Index returns assume reinvestment of dividends. Investors may not invest in
the Index directly; unlike the Fund’s returns, the Index does not reflect any fees or
expenses. |
|
| Index No Deduction for Fees, Expenses, or Taxes [Text] |
the Index does not reflect any fees or
expenses
|
| Performance Table Closing [Text Block] |
After-tax
returns are calculated using the historical highest individual federal marginal income tax rates and do not reflect the impact of state
and local taxes. Actual after-tax returns depend on an investor’s tax situation and may differ from those shown, and after-tax
returns shown are not relevant to investors who hold their Shares through tax-deferred arrangements, such as 401(k) plans or individual
retirement accounts.
|
| Performance Availability Website Address [Text] |
www.FMCX.com
|
| Performance Availability Phone [Text] |
888-530-2448
|