Shareholder Report
Apr. 30, 2026
USD ($)
$ / shares
WHAT WERE THE FUND COSTS FOR THE LAST YEAR? (based on a hypothetical $10,000 investment)
|
Class Name
|
Costs of a $10,000 investment
|
Costs paid as a percentage of a $10,000 investment*
|
|
Class A
|
$134
|
1.01%
|
HOW DID THE FUND PERFORM LAST YEAR AND WHAT AFFECTED ITS PERFORMANCE?
For the twelve months ended April 30, 2026, Class A shares of Franklin Biotechnology Discovery Fund returned 65.03%. The Fund compares its performance to the NASDAQ Biotechnology Index and the S&P 500 Index, which returned 37.61% and 31.05%, respectively, for the same period.
PERFORMANCE HIGHLIGHTS
|
Top contributors to performance:
|
|
|
↑
|
Overweighted portfolio exposure to mid-, small-, and micro-cap biotechnology stocks, which generally performed well. Performance also benefited from a focus on companies with proven drug delivery platforms, favorable clinical trial catalysts, and strong balance sheets. In addition, an emphasis on identifying clinically or commercially “de-risked” assets appears to have supported relative returns.
|
|
↑
|
Successful stock selection in the biotech industry, where numerous overweighted or off-benchmark holdings more than doubled in value, including key contributors Abivax, Ascendis Pharma, Praxis Precision Medicines, Merus, Spyre Therapeutics, Oruka Therapeutics, Centessa Pharmaceuticals, Dianthus Therapeutics and uniQure.
|
|
↑
|
Stock selection and overweighting in the pharmaceuticals industry, where much larger-than-index positions in Terns Pharmaceuticals and Jazz Pharmaceuticals topped a fairly long list of contributors. To a lesser extent, additional relative-return gains were achieved in three other industries: health care services (due to overweighting), managed health care (not an index component), and health care equipment (lack of exposure).
|
|
Top detractors from performance:
|
|
|
↓
|
Detrimental stock selection created a wide total-return gap in the life sciences tools and services industry; the combined value of the Fund’s related holdings declined, while those tracked by the benchmark index increased sharply.
|
|
↓
|
Several overweighted or off-benchmark biotech and pharma holdings either sold off amid company-specific setbacks or posted muted one-year gains. The key detractors in this regard were LENZ Therapeutics (purchased during the period), Benitec Biopharma, Soleno Therapeutics, ARS Pharmaceuticals, Ionis Pharmaceuticals (purchased during the period), Eli Lilly, MoonLake Immunotherapeutics (bought and sold during the period), Zealand Pharma, Ultragenyx Pharmaceuticals and Day One Biopharmaceuticals. Several of these positions were liquidated by year-end.
|
|
↓
|
The Fund lacked exposure to several index component companies—such as Roivant Sciences, Arrowhead Pharmaceuticals, United Therapeutics, Viatris, and Axsome Therapeutics—that significantly outperformed the benchmark. In addition, the portfolio’s cash allocation (averaging about 2.1% of total net assets) diluted relative performance during a time of robust and broad-based gains across the biotech and pharma industries.
|

AVERAGE ANNUAL TOTAL RETURNS (%) Period Ended April 30, 2026
|
|
1 Year
|
5 Year
|
10 Year
|
|
Class A
|
65.03
|
8.13
|
10.09
|
|
Class A (with sales charge)
|
55.94
|
6.91
|
9.47
|
|
Russell 3000 Index
|
31.01
|
11.91
|
14.76
|
|
NASDAQ Biotechnology Index
|
37.61
|
3.80
|
7.65
|
|
S&P 500 Index
|
31.05
|
13.14
|
15.26
|
For current month-end performance, please call Franklin Templeton at (800) DIAL BEN/342-5236 or visit
https://www.franklintempleton.com/investments/options/mutual-funds.
https://www.franklintempleton.com/investments/options/mutual-funds.
Important data provider notices and terms available at www.franklintempletondatasources.com.
KEY FUND STATISTICS (as of April 30, 2026)
|
Total Net Assets
|
$1,037,360,270
|
|
Total Number of Portfolio Holdings
|
110
|
|
Total Management Fee Paid
|
$5,300,115
|
|
Portfolio Turnover Rate
|
37.62%
|
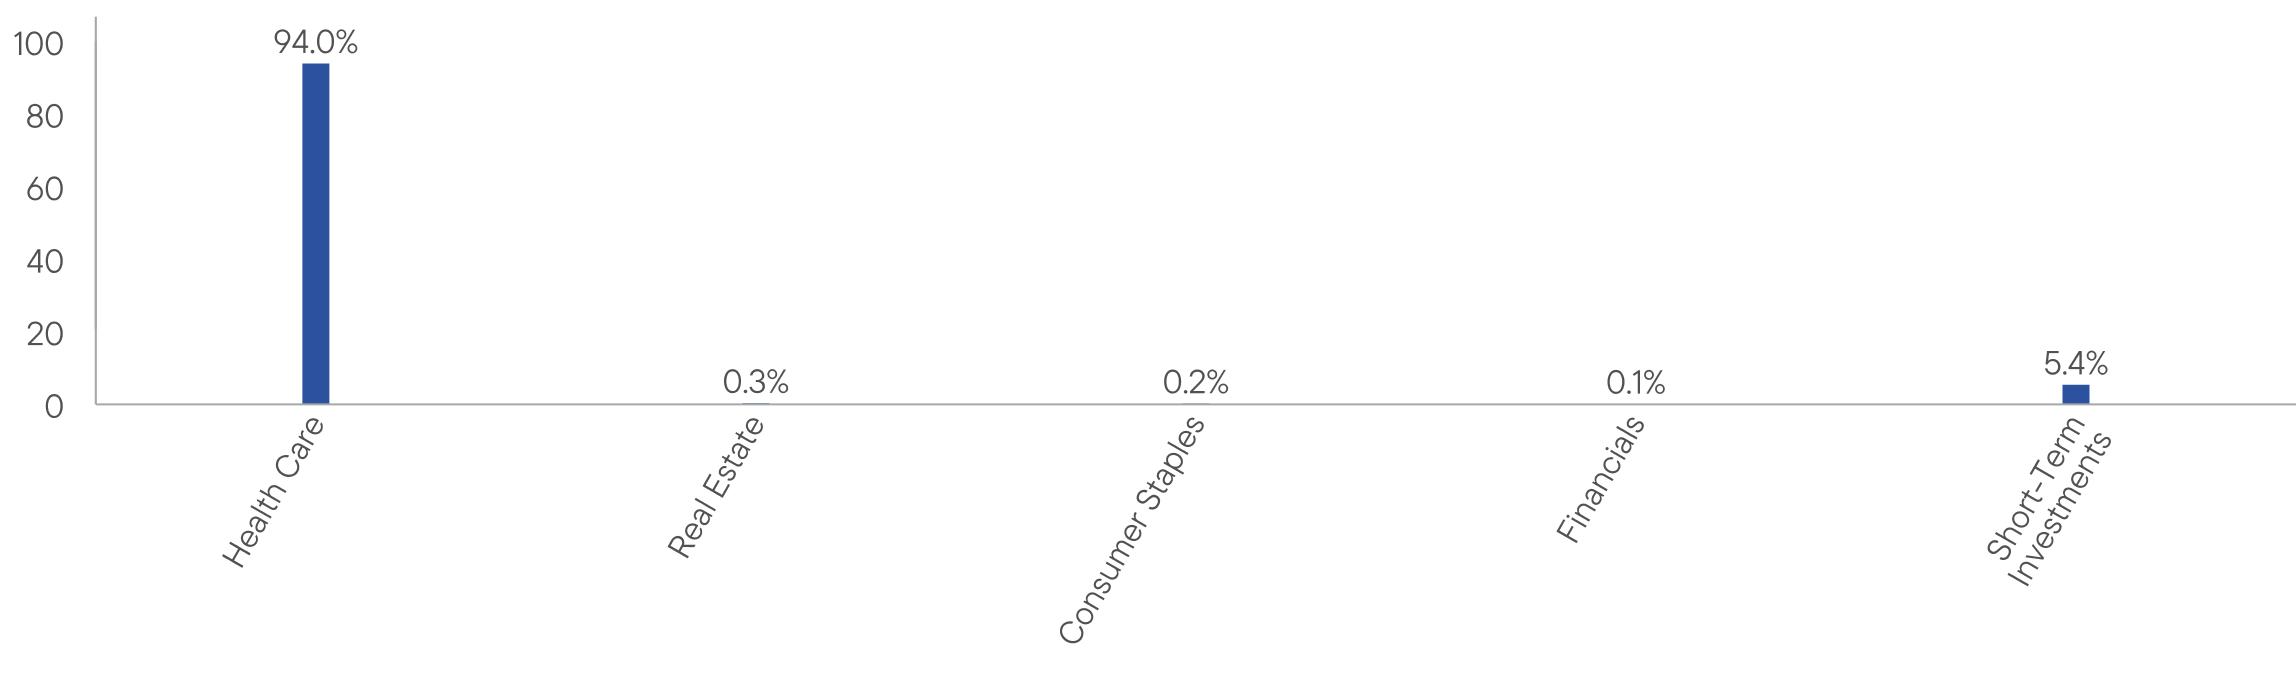
WHAT DID THE FUND INVEST IN? (as of April 30, 2026)
Portfolio Composition* (% of Total Investments)

WHAT WERE THE FUND COSTS FOR THE LAST YEAR? (based on a hypothetical $10,000 investment)
|
Class Name
|
Costs of a $10,000 investment
|
Costs paid as a percentage of a $10,000 investment*
|
|
Class C
|
$232
|
1.76%
|
HOW DID THE FUND PERFORM LAST YEAR AND WHAT AFFECTED ITS PERFORMANCE?
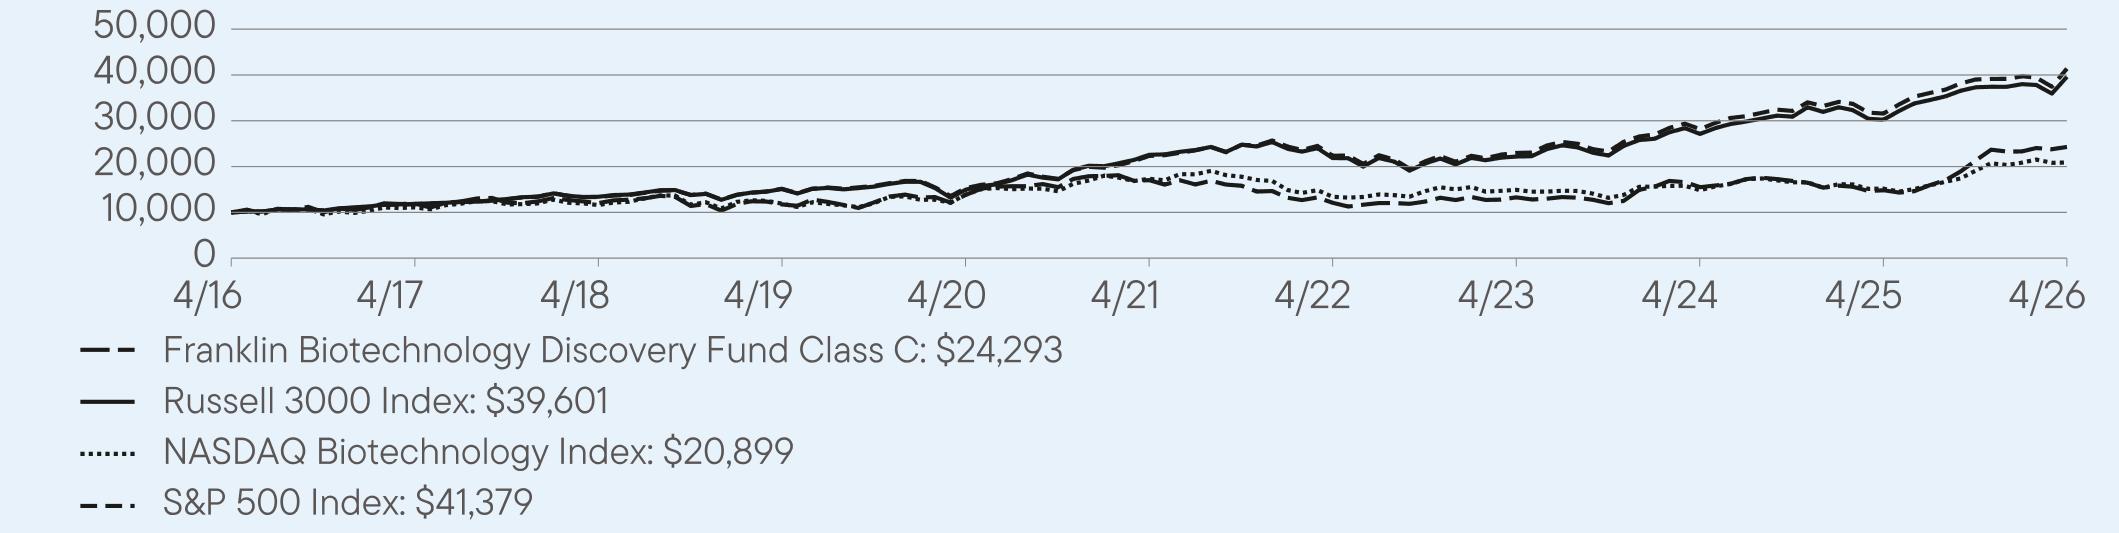
For the twelve months ended April 30, 2026, Class C shares of Franklin Biotechnology Discovery Fund returned 63.82%. The Fund compares its performance to the NASDAQ Biotechnology Index and the S&P 500 Index, which returned 37.61% and 31.05%, respectively, for the same period.
PERFORMANCE HIGHLIGHTS
|
Top contributors to performance:
|
|
|
↑
|
Overweighted portfolio exposure to mid-, small-, and micro-cap biotechnology stocks, which generally performed well. Performance also benefited from a focus on companies with proven drug delivery platforms, favorable clinical trial catalysts, and strong balance sheets. In addition, an emphasis on identifying clinically or commercially “de-risked” assets appears to have supported relative returns.
|
|
↑
|
Successful stock selection in the biotech industry, where numerous overweighted or off-benchmark holdings more than doubled in value, including key contributors Abivax, Ascendis Pharma, Praxis Precision Medicines, Merus, Spyre Therapeutics, Oruka Therapeutics, Centessa Pharmaceuticals, Dianthus Therapeutics and uniQure.
|
|
↑
|
Stock selection and overweighting in the pharmaceuticals industry, where much larger-than-index positions in Terns Pharmaceuticals and Jazz Pharmaceuticals topped a fairly long list of contributors. To a lesser extent, additional relative-return gains were achieved in three other industries: health care services (due to overweighting), managed health care (not an index component), and health care equipment (lack of exposure).
|
|
Top detractors from performance:
|
|
|
↓
|
Detrimental stock selection created a wide total-return gap in the life sciences tools and services industry; the combined value of the Fund’s related holdings declined, while those tracked by the benchmark index increased sharply.
|
|
↓
|
Several overweighted or off-benchmark biotech and pharma holdings either sold off amid company-specific setbacks or posted muted one-year gains. The key detractors in this regard were LENZ Therapeutics (purchased during the period), Benitec Biopharma, Soleno Therapeutics, ARS Pharmaceuticals, Ionis Pharmaceuticals (purchased during the period), Eli Lilly, MoonLake Immunotherapeutics (bought and sold during the period), Zealand Pharma, Ultragenyx Pharmaceuticals and Day One Biopharmaceuticals. Several of these positions were liquidated by year-end.
|
|
↓
|
The Fund lacked exposure to several index component companies—such as Roivant Sciences, Arrowhead Pharmaceuticals, United Therapeutics, Viatris, and Axsome Therapeutics—that significantly outperformed the benchmark. In addition, the portfolio’s cash allocation (averaging about 2.1% of total net assets) diluted relative performance during a time of robust and broad-based gains across the biotech and pharma industries.
|
AVERAGE ANNUAL TOTAL RETURNS (%) Period Ended April 30, 2026
|
|
1 Year
|
5 Year
|
10 Year
|
|
Class C
|
63.82
|
7.35
|
9.28
|
|
Russell 3000 Index
|
31.01
|
11.91
|
14.76
|
|
NASDAQ Biotechnology Index
|
37.61
|
3.80
|
7.65
|
|
S&P 500 Index
|
31.05
|
13.14
|
15.26
|
For current month-end performance, please call Franklin Templeton at (800) DIAL BEN/342-5236 or visit
https://www.franklintempleton.com/investments/options/mutual-funds.
https://www.franklintempleton.com/investments/options/mutual-funds.
Important data provider notices and terms available at www.franklintempletondatasources.com.
KEY FUND STATISTICS (as of April 30, 2026)
|
Total Net Assets
|
$1,037,360,270
|
|
Total Number of Portfolio Holdings
|
110
|
|
Total Management Fee Paid
|
$5,300,115
|
|
Portfolio Turnover Rate
|
37.62%
|
WHAT DID THE FUND INVEST IN? (as of April 30, 2026)
Portfolio Composition* (% of Total Investments)

WHAT WERE THE FUND COSTS FOR THE LAST YEAR? (based on a hypothetical $10,000 investment)
|
Class Name
|
Costs of a $10,000 investment
|
Costs paid as a percentage of a $10,000 investment*
|
|
Class R6
|
$89
|
0.67%
|
HOW DID THE FUND PERFORM LAST YEAR AND WHAT AFFECTED ITS PERFORMANCE?
For the twelve months ended April 30, 2026, Class R6 shares of Franklin Biotechnology Discovery Fund returned 65.61%. The Fund compares its performance to the NASDAQ Biotechnology Index and the S&P 500 Index, which returned 37.61% and 31.05%, respectively, for the same period.
PERFORMANCE HIGHLIGHTS
|
Top contributors to performance:
|
|
|
↑
|
Overweighted portfolio exposure to mid-, small-, and micro-cap biotechnology stocks, which generally performed well. Performance also benefited from a focus on companies with proven drug delivery platforms, favorable clinical trial catalysts, and strong balance sheets. In addition, an emphasis on identifying clinically or commercially “de-risked” assets appears to have supported relative returns.
|
|
↑
|
Successful stock selection in the biotech industry, where numerous overweighted or off-benchmark holdings more than doubled in value, including key contributors Abivax, Ascendis Pharma, Praxis Precision Medicines, Merus, Spyre Therapeutics, Oruka Therapeutics, Centessa Pharmaceuticals, Dianthus Therapeutics and uniQure.
|
|
↑
|
Stock selection and overweighting in the pharmaceuticals industry, where much larger-than-index positions in Terns Pharmaceuticals and Jazz Pharmaceuticals topped a fairly long list of contributors. To a lesser extent, additional relative-return gains were achieved in three other industries: health care services (due to overweighting), managed health care (not an index component), and health care equipment (lack of exposure).
|
|
Top detractors from performance:
|
|
|
↓
|
Detrimental stock selection created a wide total-return gap in the life sciences tools and services industry; the combined value of the Fund’s related holdings declined, while those tracked by the benchmark index increased sharply.
|
|
↓
|
Several overweighted or off-benchmark biotech and pharma holdings either sold off amid company-specific setbacks or posted muted one-year gains. The key detractors in this regard were LENZ Therapeutics (purchased during the period), Benitec Biopharma, Soleno Therapeutics, ARS Pharmaceuticals, Ionis Pharmaceuticals (purchased during the period), Eli Lilly, MoonLake Immunotherapeutics (bought and sold during the period), Zealand Pharma, Ultragenyx Pharmaceuticals and Day One Biopharmaceuticals. Several of these positions were liquidated by year-end.
|
|
↓
|
The Fund lacked exposure to several index component companies—such as Roivant Sciences, Arrowhead Pharmaceuticals, United Therapeutics, Viatris, and Axsome Therapeutics—that significantly outperformed the benchmark. In addition, the portfolio’s cash allocation (averaging about 2.1% of total net assets) diluted relative performance during a time of robust and broad-based gains across the biotech and pharma industries.
|

AVERAGE ANNUAL TOTAL RETURNS (%) Period Ended April 30, 2026
|
|
1 Year
|
5 Year
|
10 Year
|
|
Class R6
|
65.61
|
8.53
|
10.50
|
|
Russell 3000 Index
|
31.01
|
11.91
|
14.76
|
|
NASDAQ Biotechnology Index
|
37.61
|
3.80
|
7.65
|
|
S&P 500 Index
|
31.05
|
13.14
|
15.26
|
For current month-end performance, please call Franklin Templeton at (800) DIAL BEN/342-5236 or visit
https://www.franklintempleton.com/investments/options/mutual-funds.
https://www.franklintempleton.com/investments/options/mutual-funds.
Important data provider notices and terms available at www.franklintempletondatasources.com.
KEY FUND STATISTICS (as of April 30, 2026)
|
Total Net Assets
|
$1,037,360,270
|
|
Total Number of Portfolio Holdings
|
110
|
|
Total Management Fee Paid
|
$5,300,115
|
|
Portfolio Turnover Rate
|
37.62%
|
WHAT DID THE FUND INVEST IN? (as of April 30, 2026)
Portfolio Composition* (% of Total Investments)
WHAT WERE THE FUND COSTS FOR THE LAST YEAR? (based on a hypothetical $10,000 investment)
|
Class Name
|
Costs of a $10,000 investment
|
Costs paid as a percentage of a $10,000 investment*
|
|
Advisor Class
|
$101
|
0.76%
|
HOW DID THE FUND PERFORM LAST YEAR AND WHAT AFFECTED ITS PERFORMANCE?
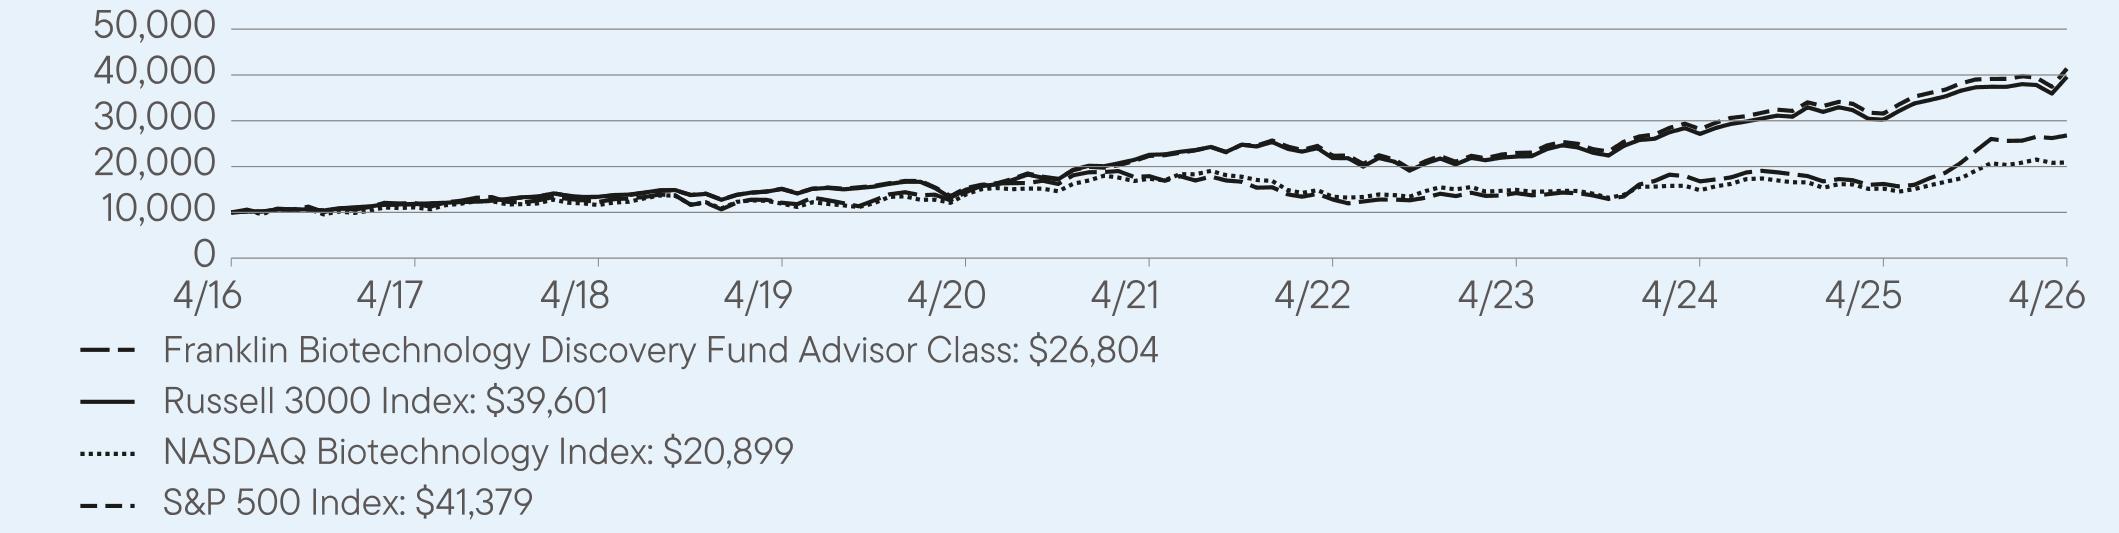
For the twelve months ended April 30, 2026, Advisor Class shares of Franklin Biotechnology Discovery Fund returned 65.45%. The Fund compares its performance to the NASDAQ Biotechnology Index and the S&P 500 Index, which returned 37.61% and 31.05%, respectively, for the same period.
PERFORMANCE HIGHLIGHTS
|
Top contributors to performance:
|
|
|
↑
|
Overweighted portfolio exposure to mid-, small-, and micro-cap biotechnology stocks, which generally performed well. Performance also benefited from a focus on companies with proven drug delivery platforms, favorable clinical trial catalysts, and strong balance sheets. In addition, an emphasis on identifying clinically or commercially “de-risked” assets appears to have supported relative returns.
|
|
↑
|
Successful stock selection in the biotech industry, where numerous overweighted or off-benchmark holdings more than doubled in value, including key contributors Abivax, Ascendis Pharma, Praxis Precision Medicines, Merus, Spyre Therapeutics, Oruka Therapeutics, Centessa Pharmaceuticals, Dianthus Therapeutics and uniQure.
|
|
↑
|
Stock selection and overweighting in the pharmaceuticals industry, where much larger-than-index positions in Terns Pharmaceuticals and Jazz Pharmaceuticals topped a fairly long list of contributors. To a lesser extent, additional relative-return gains were achieved in three other industries: health care services (due to overweighting), managed health care (not an index component), and health care equipment (lack of exposure).
|
|
Top detractors from performance:
|
|
|
↓
|
Detrimental stock selection created a wide total-return gap in the life sciences tools and services industry; the combined value of the Fund’s related holdings declined, while those tracked by the benchmark index increased sharply.
|
|
↓
|
Several overweighted or off-benchmark biotech and pharma holdings either sold off amid company-specific setbacks or posted muted one-year gains. The key detractors in this regard were LENZ Therapeutics (purchased during the period), Benitec Biopharma, Soleno Therapeutics, ARS Pharmaceuticals, Ionis Pharmaceuticals (purchased during the period), Eli Lilly, MoonLake Immunotherapeutics (bought and sold during the period), Zealand Pharma, Ultragenyx Pharmaceuticals and Day One Biopharmaceuticals. Several of these positions were liquidated by year-end.
|
|
↓
|
The Fund lacked exposure to several index component companies—such as Roivant Sciences, Arrowhead Pharmaceuticals, United Therapeutics, Viatris, and Axsome Therapeutics—that significantly outperformed the benchmark. In addition, the portfolio’s cash allocation (averaging about 2.1% of total net assets) diluted relative performance during a time of robust and broad-based gains across the biotech and pharma industries.
|
AVERAGE ANNUAL TOTAL RETURNS (%) Period Ended April 30, 2026
|
|
1 Year
|
5 Year
|
10 Year
|
|
Advisor Class
|
65.45
|
8.40
|
10.36
|
|
Russell 3000 Index
|
31.01
|
11.91
|
14.76
|
|
NASDAQ Biotechnology Index
|
37.61
|
3.80
|
7.65
|
|
S&P 500 Index
|
31.05
|
13.14
|
15.26
|
For current month-end performance, please call Franklin Templeton at (800) DIAL BEN/342-5236 or visit
https://www.franklintempleton.com/investments/options/mutual-funds.
https://www.franklintempleton.com/investments/options/mutual-funds.
Important data provider notices and terms available at www.franklintempletondatasources.com.
KEY FUND STATISTICS (as of April 30, 2026)
|
Total Net Assets
|
$1,037,360,270
|
|
Total Number of Portfolio Holdings
|
110
|
|
Total Management Fee Paid
|
$5,300,115
|
|
Portfolio Turnover Rate
|
37.62%
|
WHAT DID THE FUND INVEST IN? (as of April 30, 2026)
Portfolio Composition* (% of Total Investments)

This report describes changes to the Fund that occurred during the reporting period.
WHAT WERE THE FUND COSTS FOR THE LAST YEAR? (based on a hypothetical $10,000 investment)
|
Class Name
|
Costs of a $10,000 investment
|
Costs paid as a percentage of a $10,000 investment*
|
|
Class A
|
$73
|
0.71%
|
HOW DID THE FUND PERFORM LAST YEAR AND WHAT AFFECTED ITS PERFORMANCE?
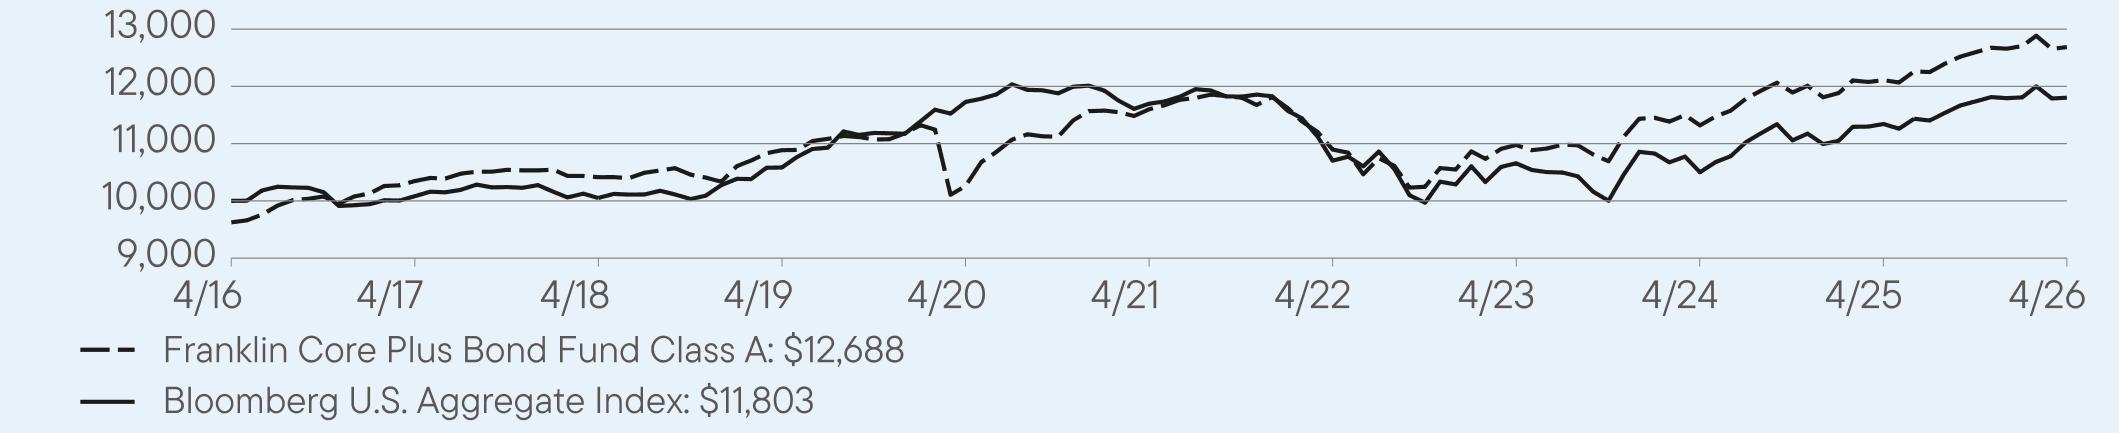
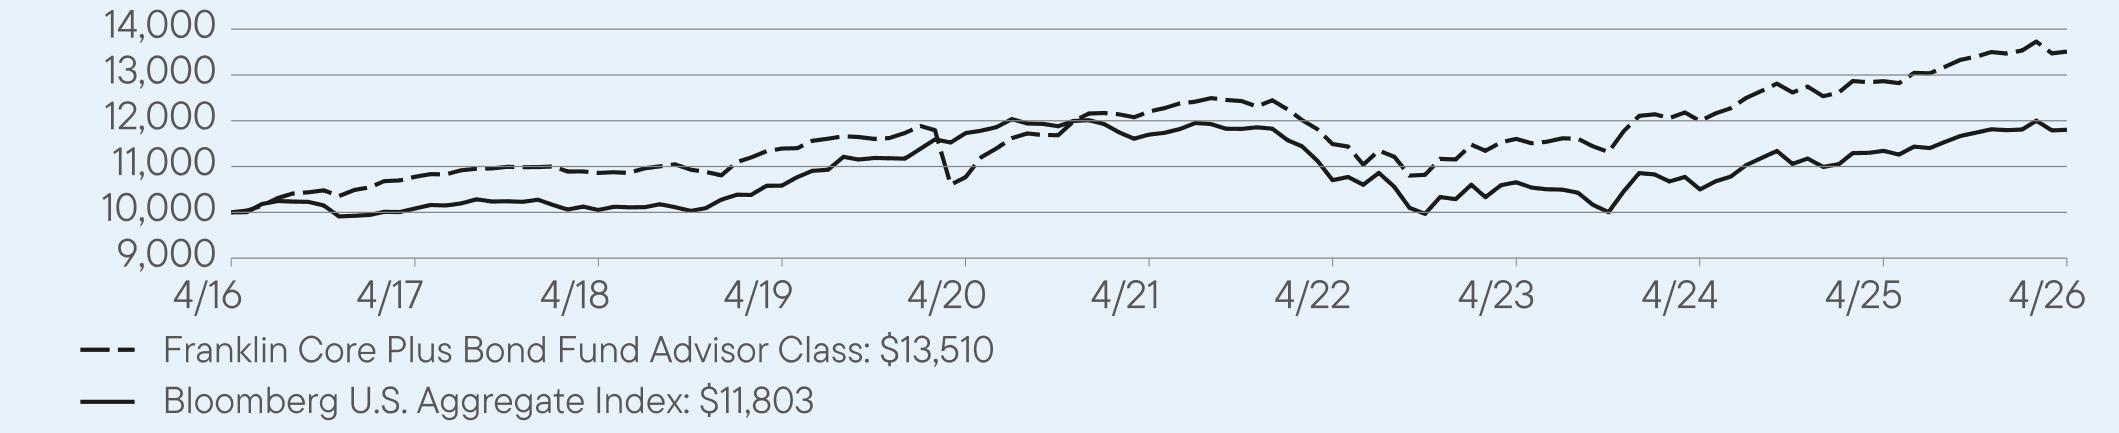
For the twelve months ended April 30, 2026, Class A shares of Franklin Core Plus Bond Fund returned 4.78%. The Fund compares its performance to the Bloomberg U.S. Aggregate Index, which returned 4.06% for the same period.
PERFORMANCE HIGHLIGHTS
|
Top contributors to performance:
|
|
|
↑
|
Overweight allocation to high-yield (HY) and investment-grade (IG) corporate bonds, agency mortgage-backed securities (MBS), commercial MBS and sovereign emerging market debt.
|
|
↑
|
Out-of-index exposure to residential MBS and collateralized loan obligations (CLOs).
|
|
↑
|
Exposure to the five-, 20- and 30-year portions of the yield curve.
|
|
Top detractors from performance:
|
|
|
↓
|
Security selection in HY corporate bonds, senior secured floating-rate bank loans and IG corporate bonds.
|
|
↓
|
Exposure to the 10-year segment of the yield curve.
|
Use of derivatives and the impact on performance:
The Fund utilized bond futures to manage duration exposure and high-yield credit default swap (CDS) to manage the Fund’s credit exposure. In aggregate, these instruments detracted slightly from performance.
AVERAGE ANNUAL TOTAL RETURNS (%) Period Ended April 30, 2026
|
|
1 Year
|
5 Year
|
10 Year
|
|
Class A
|
4.78
|
1.81
|
2.80
|
|
Class A (with sales charge)
|
0.87
|
1.03
|
2.41
|
|
Bloomberg U.S. Aggregate Index
|
4.06
|
0.18
|
1.67
|
For current month-end performance, please call Franklin Templeton at (800) DIAL BEN/342-5236 or visit
https://www.franklintempleton.com/investments/options/mutual-funds.
https://www.franklintempleton.com/investments/options/mutual-funds.
Important data provider notices and terms available at www.franklintempletondatasources.com.
KEY FUND STATISTICS (as of April 30, 2026)
|
Total Net Assets
|
$2,747,319,270
|
|
Total Number of Portfolio Holdings (excludes derivatives, except purchased options, if any)
|
866
|
|
Total Management Fee Paid
|
$6,862,755
|
|
Portfolio Turnover Rate
|
349.54%
|
WHAT DID THE FUND INVEST IN? (as of April 30, 2026)
Portfolio Composition*,† (% of Total Investments)

HOW HAS THE FUND CHANGED?
Effective September 1, 2025, the Fund’s principal investment strategies were changed to reflect the Fund’s increased investments in collateralized mortgage obligations.
Related risk disclosure was added to the prospectus.
Effective September 30, 2025, Benjamin Cryer and Thomas Runkel no longer serve as portfolio managers of the Fund and Albert Chan was added as a portfolio manager of the Fund.
Effective May 8, 2025, the investment manager contractually agreed to waive fees and/or reimburse operating expenses (excluding the Rule 12b-1 fees and certain non-routine expenses or costs, such as those relating to litigation, indemnification, reorganizations and liquidations) for the Fund so that the ratio of total annual fund operating expenses will not exceed 0.47% for each share class except Class R6 and 0.37% for Class R6 until August 31, 2026.
Additionally, effective May 8, 2025, the Fund’s contractual management fee schedule was reduced to a fee equal to an annual rate based on the value of the Fund’s average daily net assets, as follows: 0.350% up to and including $5 billion; 0.330% over $5 billion up to and including $10 billion; 0.310% over $10 billion up to and including $20 billion; and 0.290% over $20 billion.
This is a summary of certain changes and planned changes to the Fund since May 1, 2025. For more complete information, you may review the Fund’s current prospectus and any applicable supplements and the Fund’s next prospectus, which we expect to be available by September 1, 2026, at https://www.franklintempleton.com/regulatory-fund-documents or upon request at (800) DIAL BEN/342-5236 or prospectus.us.franklintempleton@fisglobal.com.
This report describes changes to the Fund that occurred during the reporting period.
WHAT WERE THE FUND COSTS FOR THE LAST YEAR? (based on a hypothetical $10,000 investment)
|
Class Name
|
Costs of a $10,000 investment
|
Costs paid as a percentage of a $10,000 investment*
|
|
Class C
|
$113
|
1.11%
|
HOW DID THE FUND PERFORM LAST YEAR AND WHAT AFFECTED ITS PERFORMANCE?
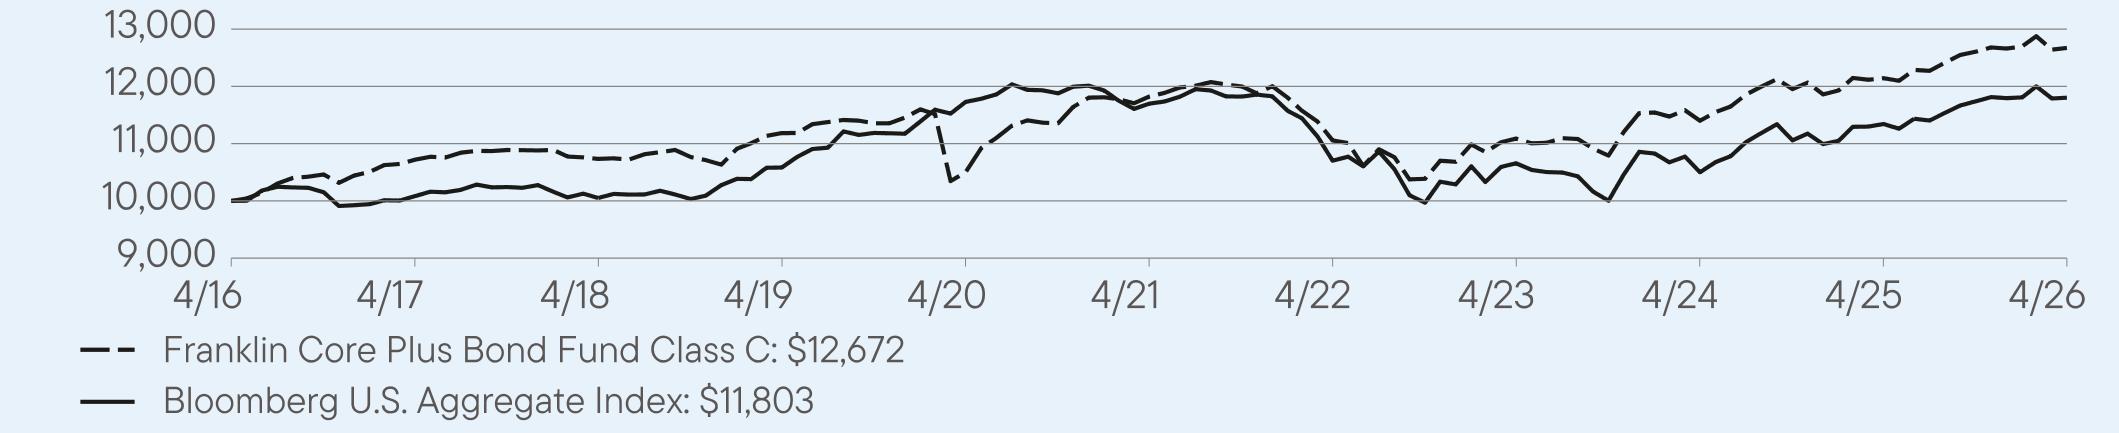
For the twelve months ended April 30, 2026, Class C shares of Franklin Core Plus Bond Fund returned 4.35%. The Fund compares its performance to the Bloomberg U.S. Aggregate Index, which returned 4.06% for the same period.
PERFORMANCE HIGHLIGHTS
|
Top contributors to performance:
|
|
|
↑
|
Overweight allocation to high-yield (HY) and investment-grade (IG) corporate bonds, agency mortgage-backed securities (MBS), commercial MBS and sovereign emerging market debt.
|
|
↑
|
Out-of-index exposure to residential MBS and collateralized loan obligations (CLOs).
|
|
↑
|
Exposure to the five-, 20- and 30-year portions of the yield curve.
|
|
Top detractors from performance:
|
|
|
↓
|
Security selection in HY corporate bonds, senior secured floating-rate bank loans and IG corporate bonds.
|
|
↓
|
Exposure to the 10-year segment of the yield curve.
|
Use of derivatives and the impact on performance:
The Fund utilized bond futures to manage duration exposure and high-yield credit default swap (CDS) to manage the Fund’s credit exposure. In aggregate, these instruments detracted slightly from performance.
AVERAGE ANNUAL TOTAL RETURNS (%) Period Ended April 30, 2026
|
|
1 Year
|
5 Year
|
10 Year
|
|
Class C
|
4.35
|
1.40
|
2.40
|
|
Class C (with sales charge)
|
3.35
|
1.40
|
2.40
|
|
Bloomberg U.S. Aggregate Index
|
4.06
|
0.18
|
1.67
|
For current month-end performance, please call Franklin Templeton at (800) DIAL BEN/342-5236 or visit
https://www.franklintempleton.com/investments/options/mutual-funds.
https://www.franklintempleton.com/investments/options/mutual-funds.
Important data provider notices and terms available at www.franklintempletondatasources.com.
KEY FUND STATISTICS (as of April 30, 2026)
|
Total Net Assets
|
$2,747,319,270
|
|
Total Number of Portfolio Holdings (excludes derivatives, except purchased options, if any)
|
866
|
|
Total Management Fee Paid
|
$6,862,755
|
|
Portfolio Turnover Rate
|
349.54%
|
WHAT DID THE FUND INVEST IN? (as of April 30, 2026)
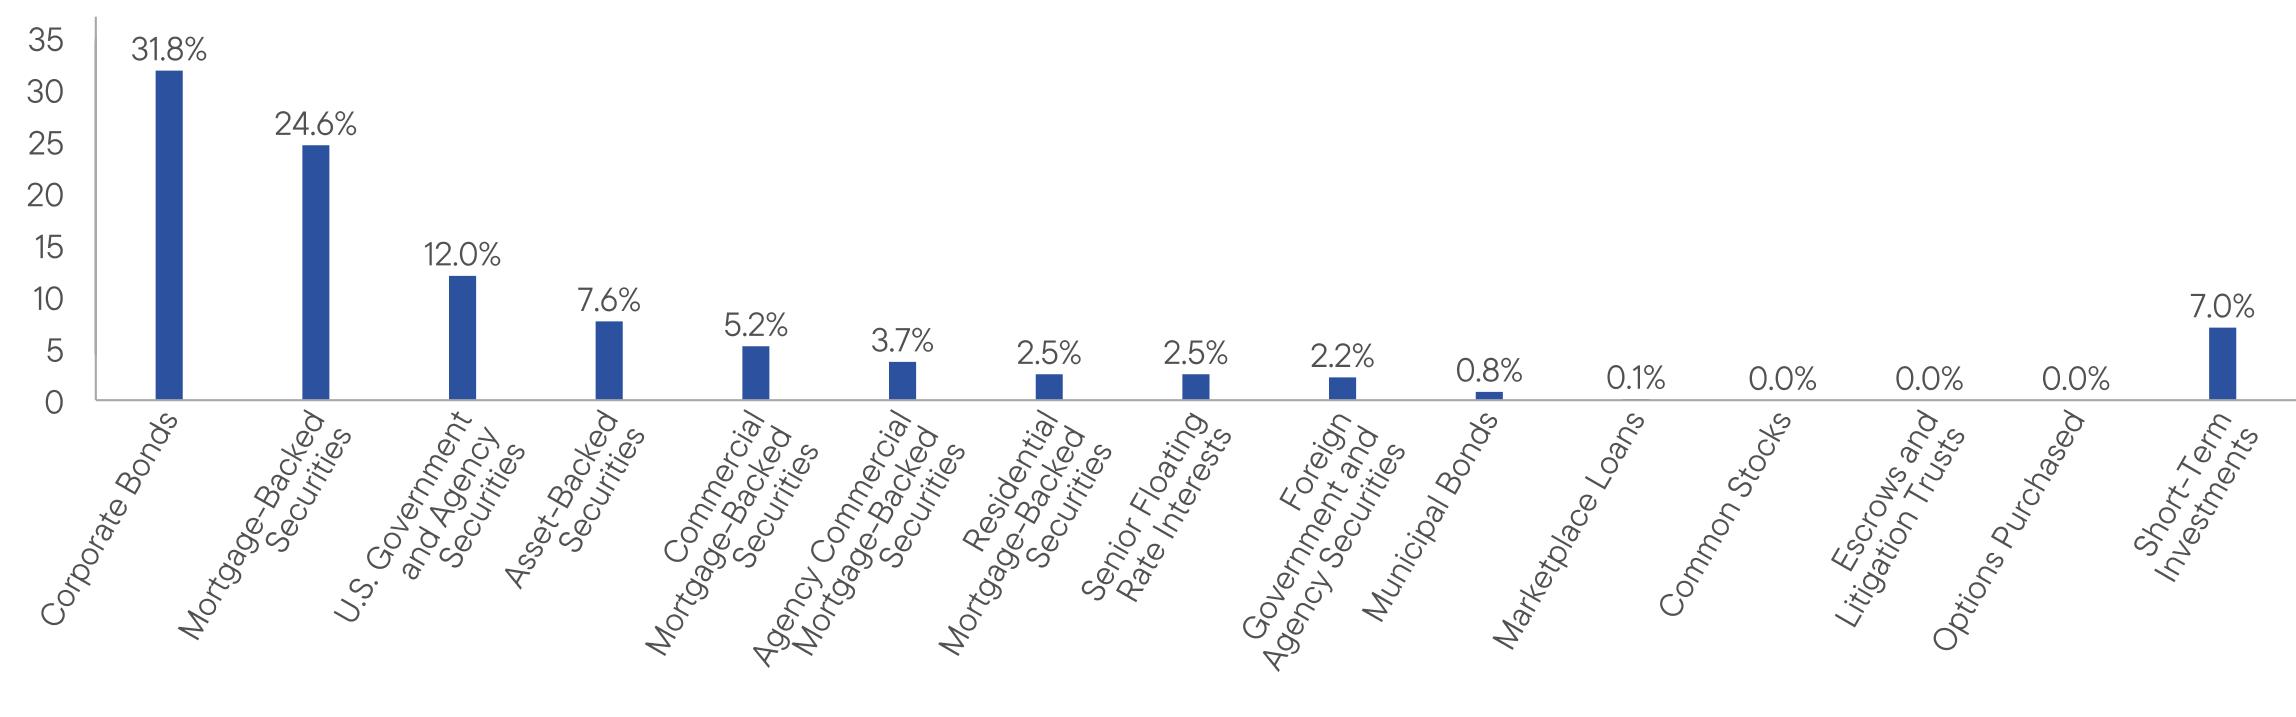
Portfolio Composition*,† (% of Total Investments)
HOW HAS THE FUND CHANGED?
Effective September 1, 2025, the Fund’s principal investment strategies were changed to reflect the Fund’s increased investments in collateralized mortgage obligations.
Related risk disclosure was added to the prospectus.
Effective September 30, 2025, Benjamin Cryer and Thomas Runkel no longer serve as portfolio managers of the Fund and Albert Chan was added as a portfolio manager of the Fund.
Effective May 8, 2025, the investment manager contractually agreed to waive fees and/or reimburse operating expenses (excluding the Rule 12b-1 fees and certain non-routine expenses or costs, such as those relating to litigation, indemnification, reorganizations and liquidations) for the Fund so that the ratio of total annual fund operating expenses will not exceed 0.47% for each share class except Class R6 and 0.37% for Class R6 until August 31, 2026.
Additionally, effective May 8, 2025, the Fund’s contractual management fee schedule was reduced to a fee equal to an annual rate based on the value of the Fund’s average daily net assets, as follows: 0.350% up to and including $5 billion; 0.330% over $5 billion up to and including $10 billion; 0.310% over $10 billion up to and including $20 billion; and 0.290% over $20 billion.
This is a summary of certain changes and planned changes to the Fund since May 1, 2025. For more complete information, you may review the Fund’s current prospectus and any applicable supplements and the Fund’s next prospectus, which we expect to be available by September 1, 2026, at https://www.franklintempleton.com/regulatory-fund-documents or upon request at (800) DIAL BEN/342-5236 or prospectus.us.franklintempleton@fisglobal.com.
This report describes changes to the Fund that occurred during the reporting period.
WHAT WERE THE FUND COSTS FOR THE LAST YEAR? (based on a hypothetical $10,000 investment)
|
Class Name
|
Costs of a $10,000 investment
|
Costs paid as a percentage of a $10,000 investment*
|
|
Class R
|
$98
|
0.96%
|
HOW DID THE FUND PERFORM LAST YEAR AND WHAT AFFECTED ITS PERFORMANCE?
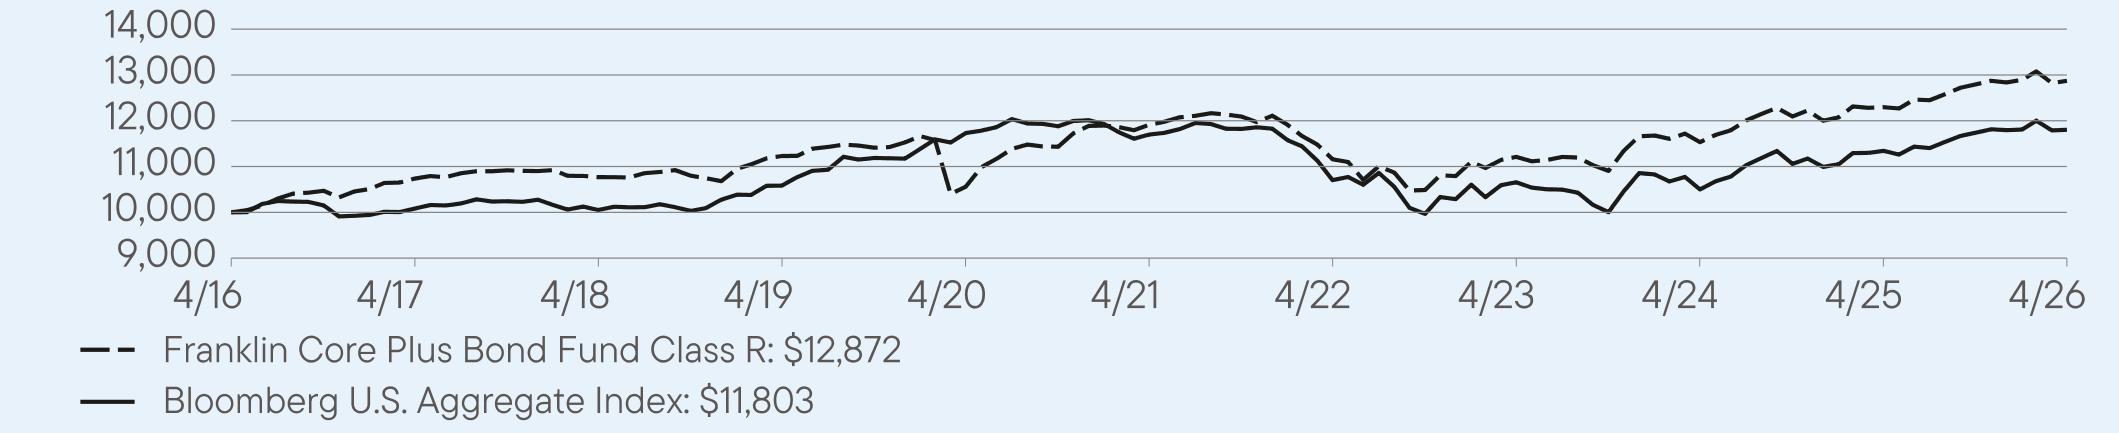
For the twelve months ended April 30, 2026, Class R shares of Franklin Core Plus Bond Fund returned 4.67%. The Fund compares its performance to the Bloomberg U.S. Aggregate Index, which returned 4.06% for the same period.
PERFORMANCE HIGHLIGHTS
|
Top contributors to performance:
|
|
|
↑
|
Overweight allocation to high-yield (HY) and investment-grade (IG) corporate bonds, agency mortgage-backed securities (MBS), commercial MBS and sovereign emerging market debt.
|
|
↑
|
Out-of-index exposure to residential MBS and collateralized loan obligations (CLOs).
|
|
↑
|
Exposure to the five-, 20- and 30-year portions of the yield curve.
|
|
Top detractors from performance:
|
|
|
↓
|
Security selection in HY corporate bonds, senior secured floating-rate bank loans and IG corporate bonds.
|
|
↓
|
Exposure to the 10-year segment of the yield curve.
|
Use of derivatives and the impact on performance:
The Fund utilized bond futures to manage duration exposure and high-yield credit default swap (CDS) to manage the Fund’s credit exposure. In aggregate, these instruments detracted slightly from performance.
AVERAGE ANNUAL TOTAL RETURNS (%) Period Ended April 30, 2026
|
|
1 Year
|
5 Year
|
10 Year
|
|
Class R
|
4.67
|
1.56
|
2.56
|
|
Bloomberg U.S. Aggregate Index
|
4.06
|
0.18
|
1.67
|
For current month-end performance, please call Franklin Templeton at (800) DIAL BEN/342-5236 or visit
https://www.franklintempleton.com/investments/options/mutual-funds.
https://www.franklintempleton.com/investments/options/mutual-funds.
Important data provider notices and terms available at www.franklintempletondatasources.com.
KEY FUND STATISTICS (as of April 30, 2026)
|
Total Net Assets
|
$2,747,319,270
|
|
Total Number of Portfolio Holdings (excludes derivatives, except purchased options, if any)
|
866
|
|
Total Management Fee Paid
|
$6,862,755
|
|
Portfolio Turnover Rate
|
349.54%
|
WHAT DID THE FUND INVEST IN? (as of April 30, 2026)
Portfolio Composition*,† (% of Total Investments)

HOW HAS THE FUND CHANGED?
Effective September 1, 2025, the Fund’s principal investment strategies were changed to reflect the Fund’s increased investments in collateralized mortgage obligations.
Related risk disclosure was added to the prospectus.
Effective September 30, 2025, Benjamin Cryer and Thomas Runkel no longer serve as portfolio managers of the Fund and Albert Chan was added as a portfolio manager of the Fund.
Effective May 8, 2025, the investment manager contractually agreed to waive fees and/or reimburse operating expenses (excluding the Rule 12b-1 fees and certain non-routine expenses or costs, such as those relating to litigation, indemnification, reorganizations and liquidations) for the Fund so that the ratio of total annual fund operating expenses will not exceed 0.47% for each share class except Class R6 and 0.37% for Class R6 until August 31, 2026.
Additionally, effective May 8, 2025, the Fund’s contractual management fee schedule was reduced to a fee equal to an annual rate based on the value of the Fund’s average daily net assets, as follows: 0.350% up to and including $5 billion; 0.330% over $5 billion up to and including $10 billion; 0.310% over $10 billion up to and including $20 billion; and 0.290% over $20 billion.
This is a summary of certain changes and planned changes to the Fund since May 1, 2025. For more complete information, you may review the Fund’s current prospectus and any applicable supplements and the Fund’s next prospectus, which we expect to be available by September 1, 2026, at https://www.franklintempleton.com/regulatory-fund-documents or upon request at (800) DIAL BEN/342-5236 or prospectus.us.franklintempleton@fisglobal.com.
This report describes changes to the Fund that occurred during the reporting period.
WHAT WERE THE FUND COSTS FOR THE LAST YEAR? (based on a hypothetical $10,000 investment)
|
Class Name
|
Costs of a $10,000 investment
|
Costs paid as a percentage of a $10,000 investment*
|
|
Class R6
|
$37
|
0.36%
|
HOW DID THE FUND PERFORM LAST YEAR AND WHAT AFFECTED ITS PERFORMANCE?
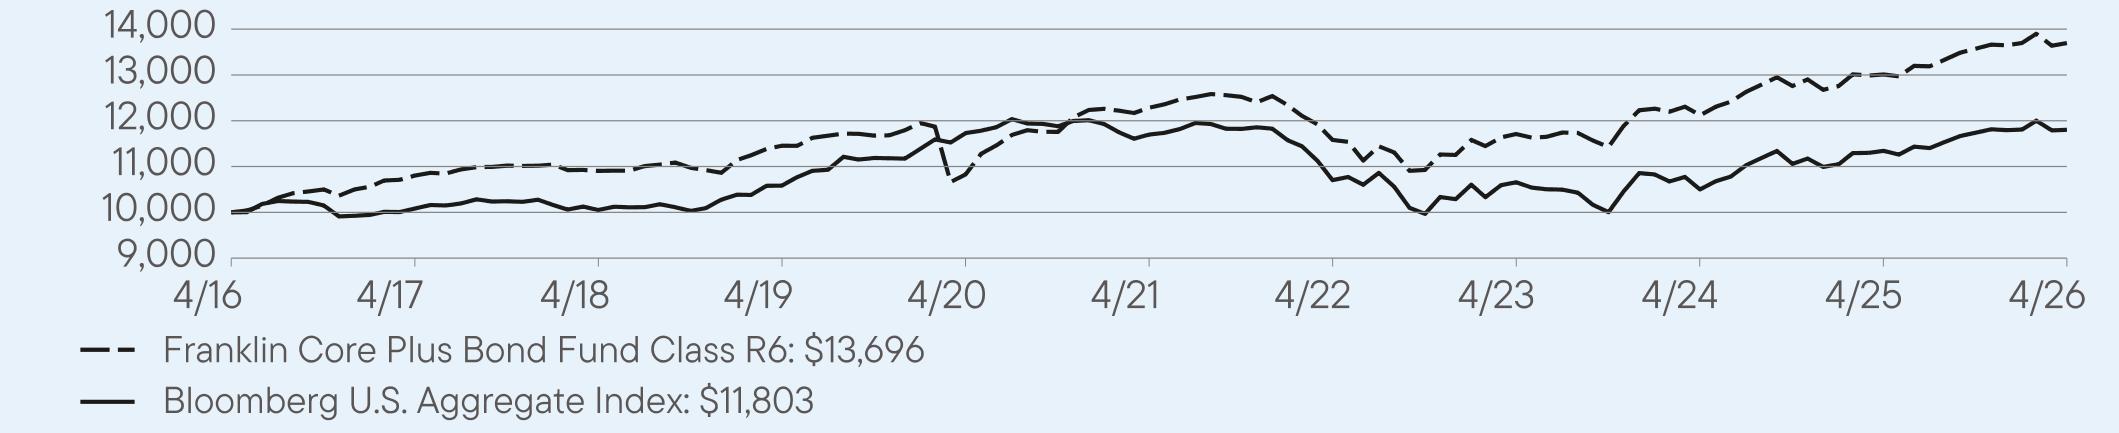
For the twelve months ended April 30, 2026, Class R6 shares of Franklin Core Plus Bond Fund returned 5.27%. The Fund compares its performance to the Bloomberg U.S. Aggregate Index, which returned 4.06% for the same period.
PERFORMANCE HIGHLIGHTS
|
Top contributors to performance:
|
|
|
↑
|
Overweight allocation to high-yield (HY) and investment-grade (IG) corporate bonds, agency mortgage-backed securities (MBS), commercial MBS and sovereign emerging market debt.
|
|
↑
|
Out-of-index exposure to residential MBS and collateralized loan obligations (CLOs).
|
|
↑
|
Exposure to the five-, 20- and 30-year portions of the yield curve.
|
|
Top detractors from performance:
|
|
|
↓
|
Security selection in HY corporate bonds, senior secured floating-rate bank loans and IG corporate bonds.
|
|
↓
|
Exposure to the 10-year segment of the yield curve.
|
Use of derivatives and the impact on performance:
The Fund utilized bond futures to manage duration exposure and high-yield credit default swap (CDS) to manage the Fund’s credit exposure. In aggregate, these instruments detracted slightly from performance.
AVERAGE ANNUAL TOTAL RETURNS (%) Period Ended April 30, 2026
|
|
1 Year
|
5 Year
|
10 Year
|
|
Class R6
|
5.27
|
2.20
|
3.19
|
|
Bloomberg U.S. Aggregate Index
|
4.06
|
0.18
|
1.67
|
For current month-end performance, please call Franklin Templeton at (800) DIAL BEN/342-5236 or visit
https://www.franklintempleton.com/investments/options/mutual-funds.
https://www.franklintempleton.com/investments/options/mutual-funds.
Important data provider notices and terms available at www.franklintempletondatasources.com.
KEY FUND STATISTICS (as of April 30, 2026)
|
Total Net Assets
|
$2,747,319,270
|
|
Total Number of Portfolio Holdings (excludes derivatives, except purchased options, if any)
|
866
|
|
Total Management Fee Paid
|
$6,862,755
|
|
Portfolio Turnover Rate
|
349.54%
|
WHAT DID THE FUND INVEST IN? (as of April 30, 2026)
Portfolio Composition*,† (% of Total Investments)

HOW HAS THE FUND CHANGED?
Effective September 1, 2025, the Fund’s principal investment strategies were changed to reflect the Fund’s increased investments in collateralized mortgage obligations.
Related risk disclosure was added to the prospectus.
Effective September 30, 2025, Benjamin Cryer and Thomas Runkel no longer serve as portfolio managers of the Fund and Albert Chan was added as a portfolio manager of the Fund.
Effective May 8, 2025, the investment manager contractually agreed to waive fees and/or reimburse operating expenses (excluding the Rule 12b-1 fees and certain non-routine expenses or costs, such as those relating to litigation, indemnification, reorganizations and liquidations) for the Fund so that the ratio of total annual fund operating expenses will not exceed 0.47% for each share class except Class R6 and 0.37% for Class R6 until August 31, 2026.
Additionally, effective May 8, 2025, the Fund’s contractual management fee schedule was reduced to a fee equal to an annual rate based on the value of the Fund’s average daily net assets, as follows: 0.350% up to and including $5 billion; 0.330% over $5 billion up to and including $10 billion; 0.310% over $10 billion up to and including $20 billion; and 0.290% over $20 billion.
This is a summary of certain changes and planned changes to the Fund since May 1, 2025. For more complete information, you may review the Fund’s current prospectus and any applicable supplements and the Fund’s next prospectus, which we expect to be available by September 1, 2026, at https://www.franklintempleton.com/regulatory-fund-documents or upon request at (800) DIAL BEN/342-5236 or prospectus.us.franklintempleton@fisglobal.com.
This report describes changes to the Fund that occurred during the reporting period.
WHAT WERE THE FUND COSTS FOR THE LAST YEAR? (based on a hypothetical $10,000 investment)
|
Class Name
|
Costs of a $10,000 investment
|
Costs paid as a percentage of a $10,000 investment*
|
|
Advisor Class
|
$47
|
0.46%
|
HOW DID THE FUND PERFORM LAST YEAR AND WHAT AFFECTED ITS PERFORMANCE?
For the twelve months ended April 30, 2026, Advisor Class shares of Franklin Core Plus Bond Fund returned 5.04%. The Fund compares its performance to the Bloomberg U.S. Aggregate Index, which returned 4.06% for the same period.
PERFORMANCE HIGHLIGHTS
|
Top contributors to performance:
|
|
|
↑
|
Overweight allocation to high-yield (HY) and investment-grade (IG) corporate bonds, agency mortgage-backed securities (MBS), commercial MBS and sovereign emerging market debt.
|
|
↑
|
Out-of-index exposure to residential MBS and collateralized loan obligations (CLOs).
|
|
↑
|
Exposure to the five-, 20- and 30-year portions of the yield curve.
|
|
Top detractors from performance:
|
|
|
↓
|
Security selection in HY corporate bonds, senior secured floating-rate bank loans and IG corporate bonds.
|
|
↓
|
Exposure to the 10-year segment of the yield curve.
|
Use of derivatives and the impact on performance:
The Fund utilized bond futures to manage duration exposure and high-yield credit default swap (CDS) to manage the Fund’s credit exposure. In aggregate, these instruments detracted slightly from performance.
AVERAGE ANNUAL TOTAL RETURNS (%) Period Ended April 30, 2026
|
|
1 Year
|
5 Year
|
10 Year
|
|
Advisor Class
|
5.04
|
2.06
|
3.05
|
|
Bloomberg U.S. Aggregate Index
|
4.06
|
0.18
|
1.67
|
For current month-end performance, please call Franklin Templeton at (800) DIAL BEN/342-5236 or visit
https://www.franklintempleton.com/investments/options/mutual-funds.
https://www.franklintempleton.com/investments/options/mutual-funds.
Important data provider notices and terms available at www.franklintempletondatasources.com.
KEY FUND STATISTICS (as of April 30, 2026)
|
Total Net Assets
|
$2,747,319,270
|
|
Total Number of Portfolio Holdings (excludes derivatives, except purchased options, if any)
|
866
|
|
Total Management Fee Paid
|
$6,862,755
|
|
Portfolio Turnover Rate
|
349.54%
|
WHAT DID THE FUND INVEST IN? (as of April 30, 2026)
Portfolio Composition*,† (% of Total Investments)

HOW HAS THE FUND CHANGED?
Effective September 1, 2025, the Fund’s principal investment strategies were changed to reflect the Fund’s increased investments in collateralized mortgage obligations.
Related risk disclosure was added to the prospectus.
Effective September 30, 2025, Benjamin Cryer and Thomas Runkel no longer serve as portfolio managers of the Fund and Albert Chan was added as a portfolio manager of the Fund.
Effective May 8, 2025, the investment manager contractually agreed to waive fees and/or reimburse operating expenses (excluding the Rule 12b-1 fees and certain non-routine expenses or costs, such as those relating to litigation, indemnification, reorganizations and liquidations) for the Fund so that the ratio of total annual fund operating expenses will not exceed 0.47% for each share class except Class R6 and 0.37% for Class R6 until August 31, 2026.
Additionally, effective May 8, 2025, the Fund’s contractual management fee schedule was reduced to a fee equal to an annual rate based on the value of the Fund’s average daily net assets, as follows: 0.350% up to and including $5 billion; 0.330% over $5 billion up to and including $10 billion; 0.310% over $10 billion up to and including $20 billion; and 0.290% over $20 billion.
This is a summary of certain changes and planned changes to the Fund since May 1, 2025. For more complete information, you may review the Fund’s current prospectus and any applicable supplements and the Fund’s next prospectus, which we expect to be available by September 1, 2026, at https://www.franklintempleton.com/regulatory-fund-documents or upon request at (800) DIAL BEN/342-5236 or prospectus.us.franklintempleton@fisglobal.com.
WHAT WERE THE FUND COSTS FOR THE LAST YEAR? (based on a hypothetical $10,000 investment)
|
Class Name
|
Costs of a $10,000 investment
|
Costs paid as a percentage of a $10,000 investment*
|
|
Class A
|
$97
|
0.88%
|
HOW DID THE FUND PERFORM LAST YEAR AND WHAT AFFECTED ITS PERFORMANCE?
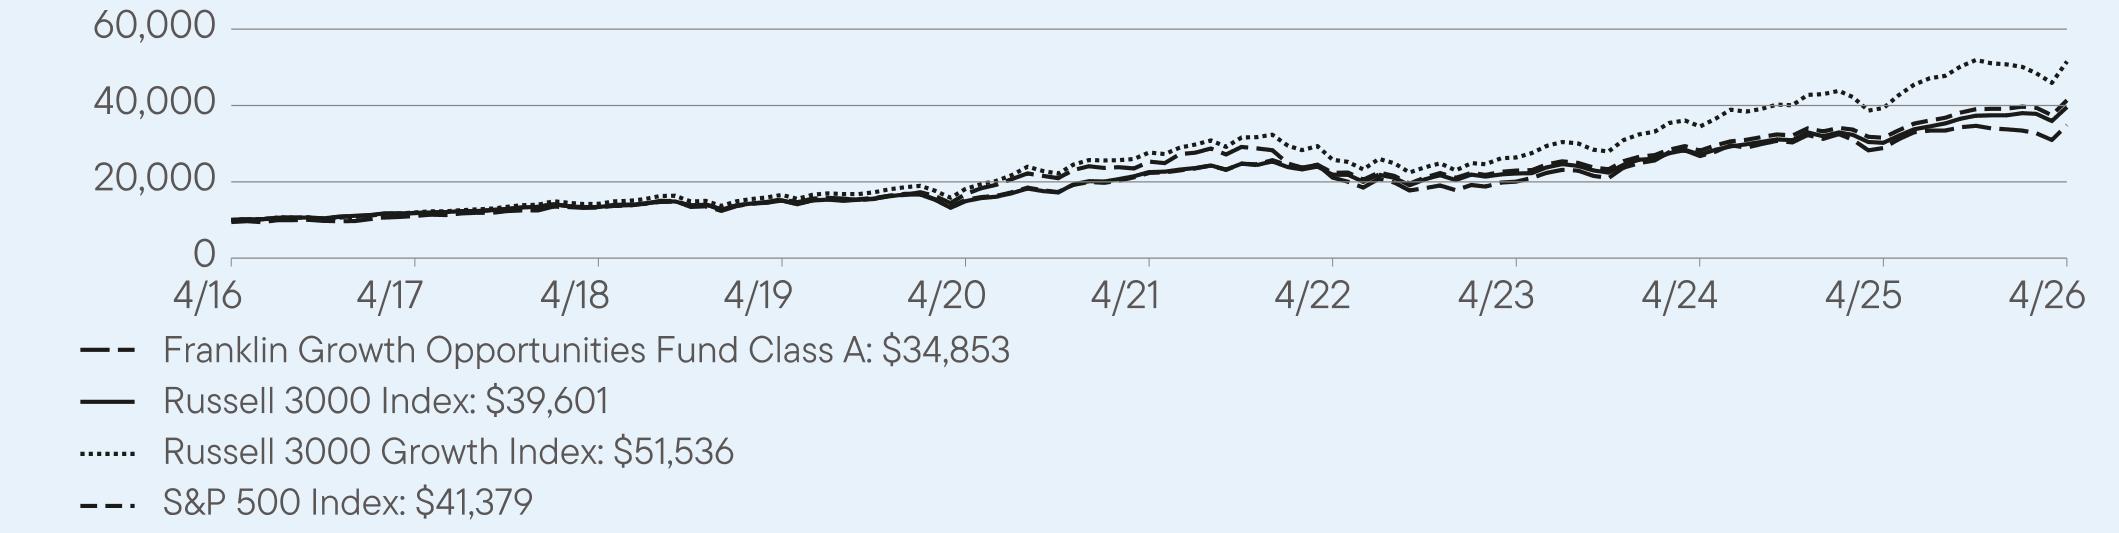
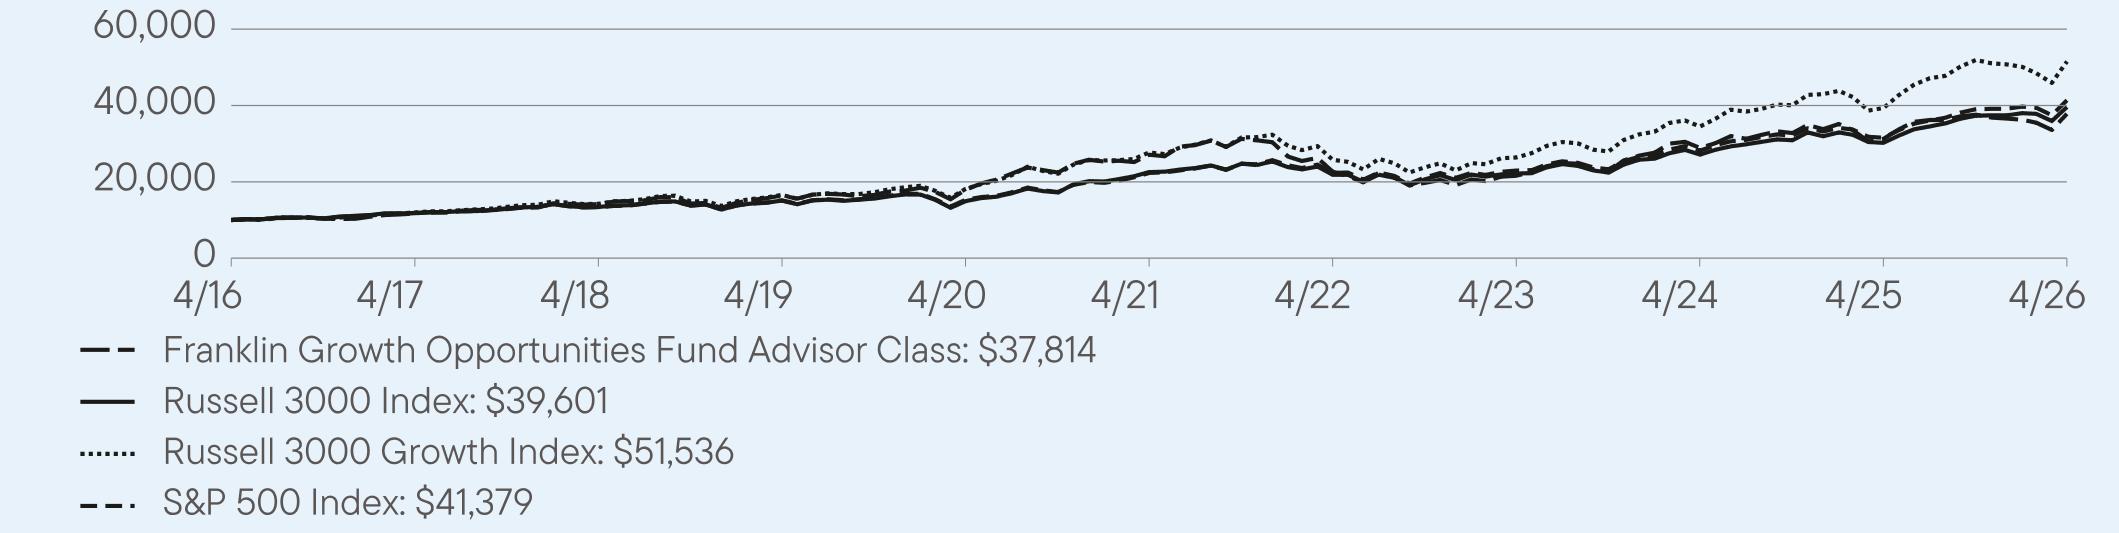
For the twelve months ended April 30, 2026, Class A shares of Franklin Growth Opportunities Fund returned 20.74%. The Fund compares its performance to the Russell 3000 Growth Index and the S&P 500 Index, which returned 30.98% and 31.05%, respectively, for the same period.
PERFORMANCE HIGHLIGHTS
|
Top contributors to performance:
|
|
|
↑
|
In the communications services sector, Google parent company Alphabet was a leading relative contributor. The company saw a favorable resolution to its antitrust trial and benefited from the positive impacts of artificial intelligence (AI) on its business.
|
|
↑
|
The Fund benefited most from stock selection in the information technology (IT) sector. Within IT, Monolithic Power Systems was the leading contributor to relative returns. Shares of the analog semiconductor manufacturer advanced sharply amid growing confidence around AI infrastructure-related demand, capped by sharp earnings beat and guidance raise.
|
|
↑
|
In the industrials sector, an off index holding in private company Space Exploration Technologies (SpaceX) was a leading contributor to relative returns. The merger with xAI boosted the private market share price of the company, and expectations increased around a 2026 initial public offering for the aerospace and technology company.
|
|
Top detractors from performance:
|
|
|
↓
|
By sector, stock selection in communication services sector was the largest detractor from relative returns. Among individual detractors, in the IT sector, underweight in AI chip designer NVIDIA held back relative returns. The company continued to benefit from increased AI infrastructure spending, and demand for its advanced chips remained strong across cloud computing, data centers and enterprise AI applications. NVIDIA was the largest position in the Fund on an absolute basis, but the Fund was underweighted on a relative basis due to position size constraints.
|
|
↓
|
In the consumer staples sector, an off-benchmark holding in BellRing Brands was a leading detractor. The nutrition products company reported shrinking profit margins and saw increased competition in the protein shake category. Retailer inventory adjustments and reduced full year 2025 guidance were also headwinds for the company.
|
|
↓
|
In the industrials sector, Axon shares fell as investors expressed concerns about near-term margin pressure from higher investment spending, even though the company continued to report strong revenue growth and solid demand from public safety agencies.
|
AVERAGE ANNUAL TOTAL RETURNS (%) Period Ended April 30, 2026
|
|
1 Year
|
5 Year
|
10 Year
|
|
Class A
|
20.74
|
6.62
|
13.94
|
|
Class A (with sales charge)
|
14.10
|
5.43
|
13.30
|
|
Russell 3000 Index
|
31.01
|
11.91
|
14.76
|
|
Russell 3000 Growth Index
|
30.98
|
13.23
|
17.82
|
|
S&P 500 Index
|
31.05
|
13.14
|
15.26
|
For current month-end performance, please call Franklin Templeton at (800) DIAL BEN/342-5236 or visit
https://www.franklintempleton.com/investments/options/mutual-funds.
https://www.franklintempleton.com/investments/options/mutual-funds.
Important data provider notices and terms available at www.franklintempletondatasources.com.
KEY FUND STATISTICS (as of April 30, 2026)
|
Total Net Assets
|
$4,394,400,813
|
|
Total Number of Portfolio Holdings
|
92
|
|
Total Management Fee Paid
|
$24,181,309
|
|
Portfolio Turnover Rate
|
39.14%
|
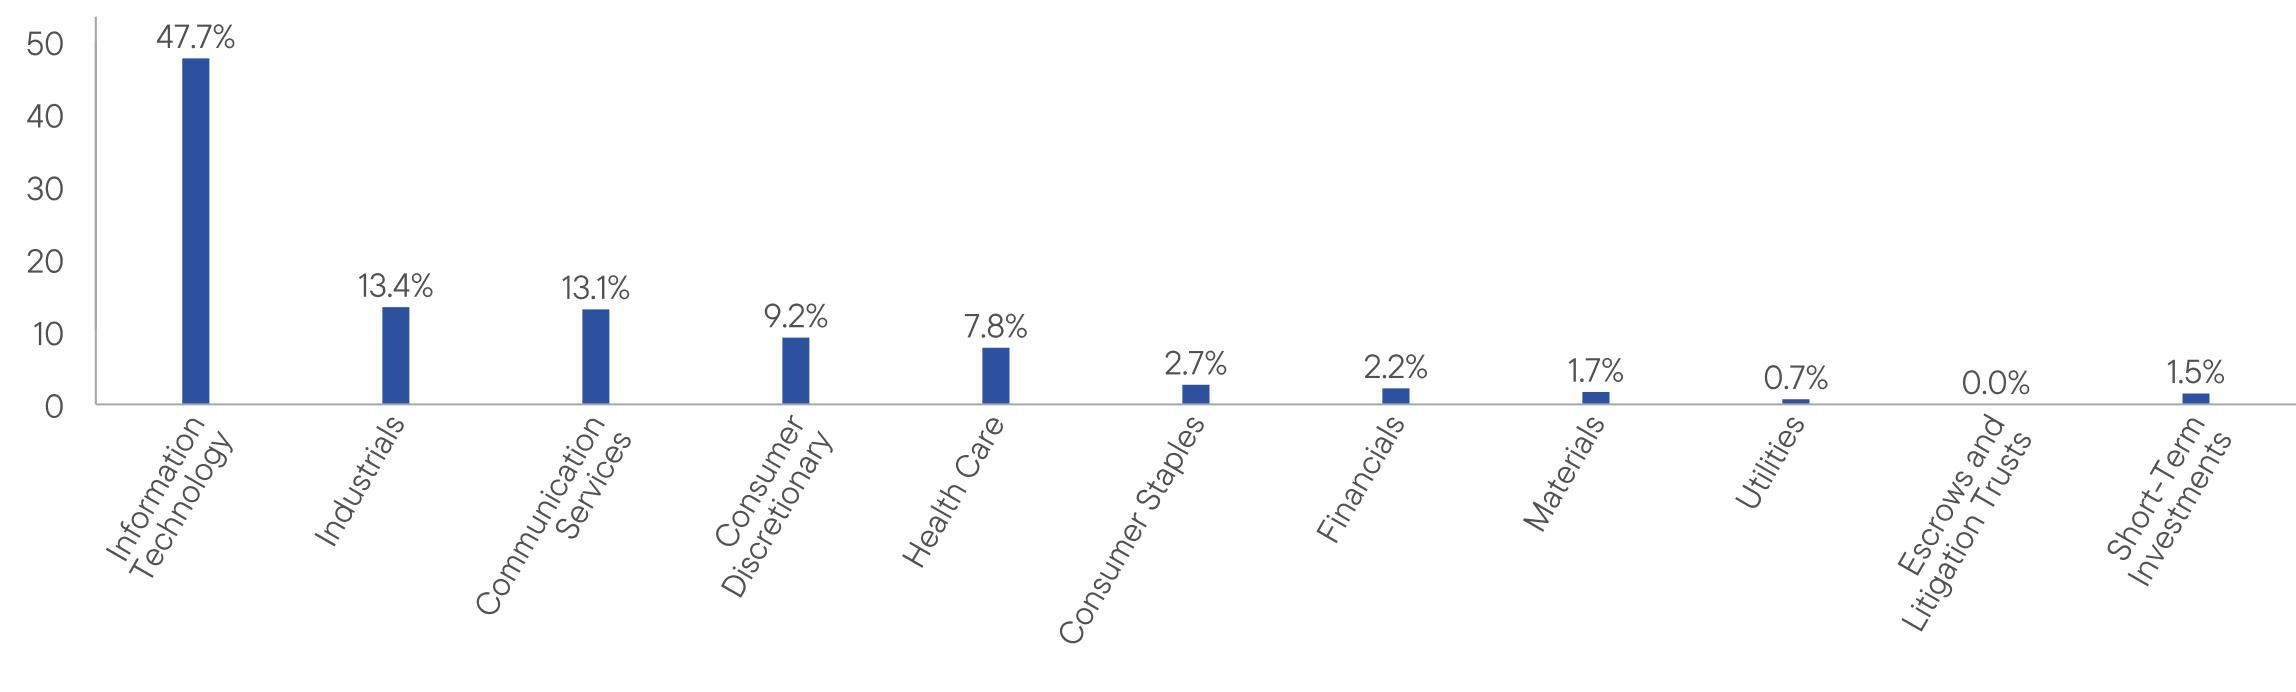
WHAT DID THE FUND INVEST IN? (as of April 30, 2026)
Portfolio Composition*,† (% of Total Investments)

WHAT WERE THE FUND COSTS FOR THE LAST YEAR? (based on a hypothetical $10,000 investment)
|
Class Name
|
Costs of a $10,000 investment
|
Costs paid as a percentage of a $10,000 investment*
|
|
Class C
|
$180
|
1.64%
|
HOW DID THE FUND PERFORM LAST YEAR AND WHAT AFFECTED ITS PERFORMANCE?
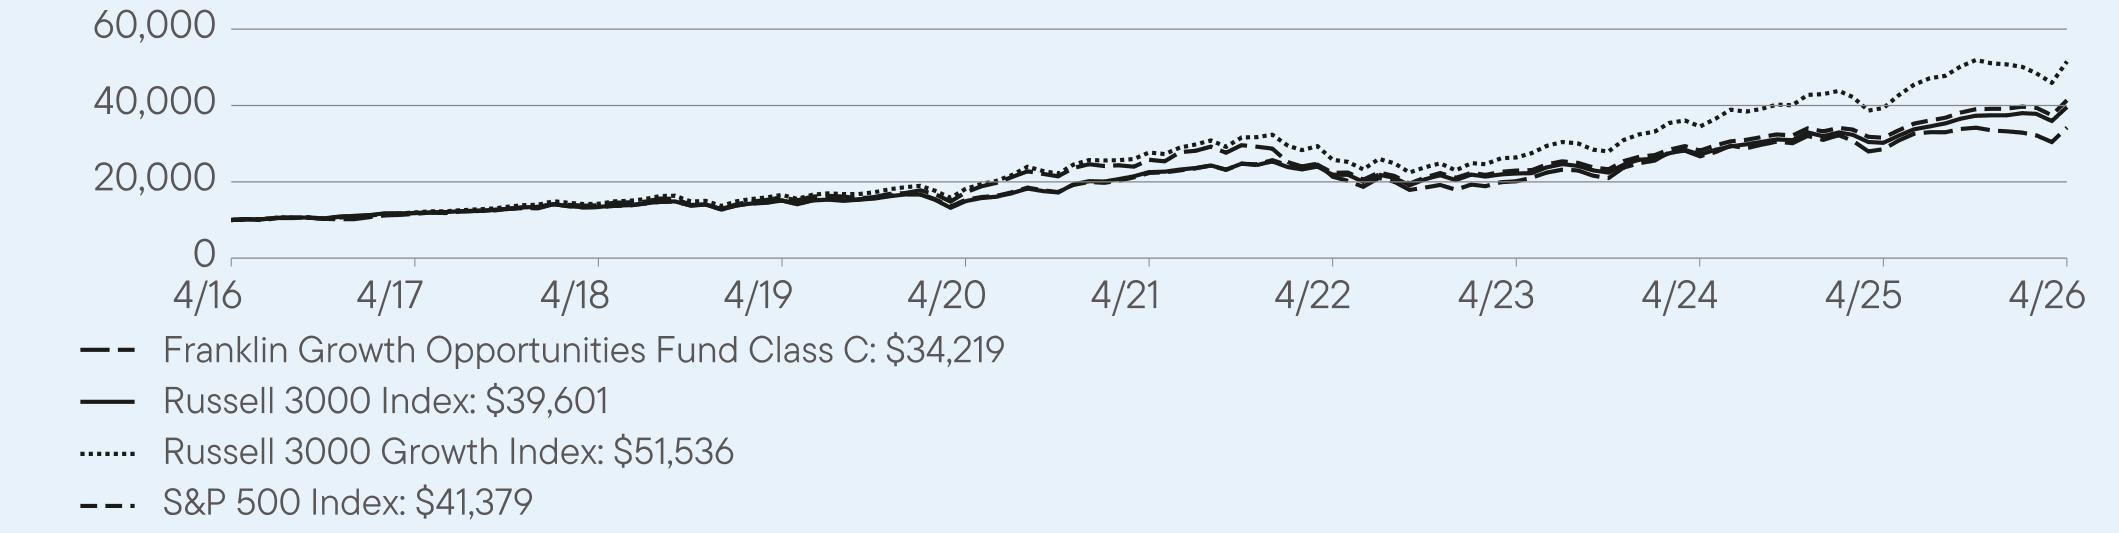
For the twelve months ended April 30, 2026, Class C shares of Franklin Growth Opportunities Fund returned 19.82%. The Fund compares its performance to the Russell 3000 Growth Index and the S&P 500 Index, which returned 30.98% and 31.05%, respectively, for the same period.
PERFORMANCE HIGHLIGHTS
|
Top contributors to performance:
|
|
|
↑
|
In the communications services sector, Google parent company Alphabet was a leading relative contributor. The company saw a favorable resolution to its antitrust trial and benefited from the positive impacts of artificial intelligence (AI) on its business.
|
|
↑
|
The Fund benefited most from stock selection in the information technology (IT) sector. Within IT, Monolithic Power Systems was the leading contributor to relative returns. Shares of the analog semiconductor manufacturer advanced sharply amid growing confidence around AI infrastructure-related demand, capped by sharp earnings beat and guidance raise.
|
|
↑
|
In the industrials sector, an off index holding in private company Space Exploration Technologies (SpaceX) was a leading contributor to relative returns. The merger with xAI boosted the private market share price of the company, and expectations increased around a 2026 initial public offering for the aerospace and technology company.
|
|
Top detractors from performance:
|
|
|
↓
|
By sector, stock selection in communication services sector was the largest detractor from relative returns. Among individual detractors, in the IT sector, underweight in AI chip designer NVIDIA held back relative returns. The company continued to benefit from increased AI infrastructure spending, and demand for its advanced chips remained strong across cloud computing, data centers and enterprise AI applications. NVIDIA was the largest position in the Fund on an absolute basis, but the Fund was underweighted on a relative basis due to position size constraints.
|
|
↓
|
In the consumer staples sector, an off-benchmark holding in BellRing Brands was a leading detractor. The nutrition products company reported shrinking profit margins and saw increased competition in the protein shake category. Retailer inventory adjustments and reduced full year 2025 guidance were also headwinds for the company.
|
|
↓
|
In the industrials sector, Axon shares fell as investors expressed concerns about near-term margin pressure from higher investment spending, even though the company continued to report strong revenue growth and solid demand from public safety agencies.
|
AVERAGE ANNUAL TOTAL RETURNS (%) Period Ended April 30, 2026
|
|
1 Year
|
5 Year
|
10 Year
|
|
Class C
|
19.82
|
5.83
|
13.09
|
|
Class C (with sales charge)
|
18.92
|
5.83
|
13.09
|
|
Russell 3000 Index
|
31.01
|
11.91
|
14.76
|
|
Russell 3000 Growth Index
|
30.98
|
13.23
|
17.82
|
|
S&P 500 Index
|
31.05
|
13.14
|
15.26
|
For current month-end performance, please call Franklin Templeton at (800) DIAL BEN/342-5236 or visit
https://www.franklintempleton.com/investments/options/mutual-funds.
https://www.franklintempleton.com/investments/options/mutual-funds.
Important data provider notices and terms available at www.franklintempletondatasources.com.
KEY FUND STATISTICS (as of April 30, 2026)
|
Total Net Assets
|
$4,394,400,813
|
|
Total Number of Portfolio Holdings
|
92
|
|
Total Management Fee Paid
|
$24,181,309
|
|
Portfolio Turnover Rate
|
39.14%
|
WHAT DID THE FUND INVEST IN? (as of April 30, 2026)
Portfolio Composition*,† (% of Total Investments)
WHAT WERE THE FUND COSTS FOR THE LAST YEAR? (based on a hypothetical $10,000 investment)
|
Class Name
|
Costs of a $10,000 investment
|
Costs paid as a percentage of a $10,000 investment*
|
|
Class R
|
$126
|
1.14%
|
HOW DID THE FUND PERFORM LAST YEAR AND WHAT AFFECTED ITS PERFORMANCE?
For the twelve months ended April 30, 2026, Class R shares of Franklin Growth Opportunities Fund returned 20.42%. The Fund compares its performance to the Russell 3000 Growth Index and the S&P 500 Index, which returned 30.98% and 31.05%, respectively, for the same period.
PERFORMANCE HIGHLIGHTS
|
Top contributors to performance:
|
|
|
↑
|
In the communications services sector, Google parent company Alphabet was a leading relative contributor. The company saw a favorable resolution to its antitrust trial and benefited from the positive impacts of artificial intelligence (AI) on its business.
|
|
↑
|
The Fund benefited most from stock selection in the information technology (IT) sector. Within IT, Monolithic Power Systems was the leading contributor to relative returns. Shares of the analog semiconductor manufacturer advanced sharply amid growing confidence around AI infrastructure-related demand, capped by sharp earnings beat and guidance raise.
|
|
↑
|
In the industrials sector, an off index holding in private company Space Exploration Technologies (SpaceX) was a leading contributor to relative returns. The merger with xAI boosted the private market share price of the company, and expectations increased around a 2026 initial public offering for the aerospace and technology company.
|
|
Top detractors from performance:
|
|
|
↓
|
By sector, stock selection in communication services sector was the largest detractor from relative returns. Among individual detractors, in the IT sector, underweight in AI chip designer NVIDIA held back relative returns. The company continued to benefit from increased AI infrastructure spending, and demand for its advanced chips remained strong across cloud computing, data centers and enterprise AI applications. NVIDIA was the largest position in the Fund on an absolute basis, but the Fund was underweighted on a relative basis due to position size constraints.
|
|
↓
|
In the consumer staples sector, an off-benchmark holding in BellRing Brands was a leading detractor. The nutrition products company reported shrinking profit margins and saw increased competition in the protein shake category. Retailer inventory adjustments and reduced full year 2025 guidance were also headwinds for the company.
|
|
↓
|
In the industrials sector, Axon shares fell as investors expressed concerns about near-term margin pressure from higher investment spending, even though the company continued to report strong revenue growth and solid demand from public safety agencies.
|

AVERAGE ANNUAL TOTAL RETURNS (%) Period Ended April 30, 2026
|
|
1 Year
|
5 Year
|
10 Year
|
|
Class R
|
20.42
|
6.35
|
13.66
|
|
Russell 3000 Index
|
31.01
|
11.91
|
14.76
|
|
Russell 3000 Growth Index
|
30.98
|
13.23
|
17.82
|
|
S&P 500 Index
|
31.05
|
13.14
|
15.26
|
For current month-end performance, please call Franklin Templeton at (800) DIAL BEN/342-5236 or visit
https://www.franklintempleton.com/investments/options/mutual-funds.
https://www.franklintempleton.com/investments/options/mutual-funds.
Important data provider notices and terms available at www.franklintempletondatasources.com.
KEY FUND STATISTICS (as of April 30, 2026)
|
Total Net Assets
|
$4,394,400,813
|
|
Total Number of Portfolio Holdings
|
92
|
|
Total Management Fee Paid
|
$24,181,309
|
|
Portfolio Turnover Rate
|
39.14%
|
WHAT DID THE FUND INVEST IN? (as of April 30, 2026)
Portfolio Composition*,† (% of Total Investments)

WHAT WERE THE FUND COSTS FOR THE LAST YEAR? (based on a hypothetical $10,000 investment)
|
Class Name
|
Costs of a $10,000 investment
|
Costs paid as a percentage of a $10,000 investment*
|
|
Class R6
|
$63
|
0.57%
|
HOW DID THE FUND PERFORM LAST YEAR AND WHAT AFFECTED ITS PERFORMANCE?
For the twelve months ended April 30, 2026, Class R6 shares of Franklin Growth Opportunities Fund returned 21.11%. The Fund compares its performance to the Russell 3000 Growth Index and the S&P 500 Index, which returned 30.98% and 31.05%, respectively, for the same period.
PERFORMANCE HIGHLIGHTS
|
Top contributors to performance:
|
|
|
↑
|
In the communications services sector, Google parent company Alphabet was a leading relative contributor. The company saw a favorable resolution to its antitrust trial and benefited from the positive impacts of artificial intelligence (AI) on its business.
|
|
↑
|
The Fund benefited most from stock selection in the information technology (IT) sector. Within IT, Monolithic Power Systems was the leading contributor to relative returns. Shares of the analog semiconductor manufacturer advanced sharply amid growing confidence around AI infrastructure-related demand, capped by sharp earnings beat and guidance raise.
|
|
↑
|
In the industrials sector, an off index holding in private company Space Exploration Technologies (SpaceX) was a leading contributor to relative returns. The merger with xAI boosted the private market share price of the company, and expectations increased around a 2026 initial public offering for the aerospace and technology company.
|
|
Top detractors from performance:
|
|
|
↓
|
By sector, stock selection in communication services sector was the largest detractor from relative returns. Among individual detractors, in the IT sector, underweight in AI chip designer NVIDIA held back relative returns. The company continued to benefit from increased AI infrastructure spending, and demand for its advanced chips remained strong across cloud computing, data centers and enterprise AI applications. NVIDIA was the largest position in the Fund on an absolute basis, but the Fund was underweighted on a relative basis due to position size constraints.
|
|
↓
|
In the consumer staples sector, an off-benchmark holding in BellRing Brands was a leading detractor. The nutrition products company reported shrinking profit margins and saw increased competition in the protein shake category. Retailer inventory adjustments and reduced full year 2025 guidance were also headwinds for the company.
|
|
↓
|
In the industrials sector, Axon shares fell as investors expressed concerns about near-term margin pressure from higher investment spending, even though the company continued to report strong revenue growth and solid demand from public safety agencies.
|

AVERAGE ANNUAL TOTAL RETURNS (%) Period Ended April 30, 2026
|
|
1 Year
|
5 Year
|
10 Year
|
|
Class R6
|
21.11
|
6.97
|
14.35
|
|
Russell 3000 Index
|
31.01
|
11.91
|
14.76
|
|
Russell 3000 Growth Index
|
30.98
|
13.23
|
17.82
|
|
S&P 500 Index
|
31.05
|
13.14
|
15.26
|
For current month-end performance, please call Franklin Templeton at (800) DIAL BEN/342-5236 or visit
https://www.franklintempleton.com/investments/options/mutual-funds.
https://www.franklintempleton.com/investments/options/mutual-funds.
Important data provider notices and terms available at www.franklintempletondatasources.com.
KEY FUND STATISTICS (as of April 30, 2026)
|
Total Net Assets
|
$4,394,400,813
|
|
Total Number of Portfolio Holdings
|
92
|
|
Total Management Fee Paid
|
$24,181,309
|
|
Portfolio Turnover Rate
|
39.14%
|
WHAT DID THE FUND INVEST IN? (as of April 30, 2026)
Portfolio Composition*,† (% of Total Investments)

WHAT WERE THE FUND COSTS FOR THE LAST YEAR? (based on a hypothetical $10,000 investment)
|
Class Name
|
Costs of a $10,000 investment
|
Costs paid as a percentage of a $10,000 investment*
|
|
Advisor Class
|
$70
|
0.63%
|
HOW DID THE FUND PERFORM LAST YEAR AND WHAT AFFECTED ITS PERFORMANCE?
For the twelve months ended April 30, 2026, Advisor Class shares of Franklin Growth Opportunities Fund returned 21.04%. The Fund compares its performance to the Russell 3000 Growth Index and the S&P 500 Index, which returned 30.98% and 31.05%, respectively, for the same period.
PERFORMANCE HIGHLIGHTS
|
Top contributors to performance:
|
|
|
↑
|
In the communications services sector, Google parent company Alphabet was a leading relative contributor. The company saw a favorable resolution to its antitrust trial and benefited from the positive impacts of artificial intelligence (AI) on its business.
|
|
↑
|
The Fund benefited most from stock selection in the information technology (IT) sector. Within IT, Monolithic Power Systems was the leading contributor to relative returns. Shares of the analog semiconductor manufacturer advanced sharply amid growing confidence around AI infrastructure-related demand, capped by sharp earnings beat and guidance raise.
|
|
↑
|
In the industrials sector, an off index holding in private company Space Exploration Technologies (SpaceX) was a leading contributor to relative returns. The merger with xAI boosted the private market share price of the company, and expectations increased around a 2026 initial public offering for the aerospace and technology company.
|
|
Top detractors from performance:
|
|
|
↓
|
By sector, stock selection in communication services sector was the largest detractor from relative returns. Among individual detractors, in the IT sector, underweight in AI chip designer NVIDIA held back relative returns. The company continued to benefit from increased AI infrastructure spending, and demand for its advanced chips remained strong across cloud computing, data centers and enterprise AI applications. NVIDIA was the largest position in the Fund on an absolute basis, but the Fund was underweighted on a relative basis due to position size constraints.
|
|
↓
|
In the consumer staples sector, an off-benchmark holding in BellRing Brands was a leading detractor. The nutrition products company reported shrinking profit margins and saw increased competition in the protein shake category. Retailer inventory adjustments and reduced full year 2025 guidance were also headwinds for the company.
|
|
↓
|
In the industrials sector, Axon shares fell as investors expressed concerns about near-term margin pressure from higher investment spending, even though the company continued to report strong revenue growth and solid demand from public safety agencies.
|
AVERAGE ANNUAL TOTAL RETURNS (%) Period Ended April 30, 2026
|
|
1 Year
|
5 Year
|
10 Year
|
|
Advisor Class
|
21.04
|
6.89
|
14.23
|
|
Russell 3000 Index
|
31.01
|
11.91
|
14.76
|
|
Russell 3000 Growth Index
|
30.98
|
13.23
|
17.82
|
|
S&P 500 Index
|
31.05
|
13.14
|
15.26
|
For current month-end performance, please call Franklin Templeton at (800) DIAL BEN/342-5236 or visit
https://www.franklintempleton.com/investments/options/mutual-funds.
https://www.franklintempleton.com/investments/options/mutual-funds.
Important data provider notices and terms available at www.franklintempletondatasources.com.
KEY FUND STATISTICS (as of April 30, 2026)
|
Total Net Assets
|
$4,394,400,813
|
|
Total Number of Portfolio Holdings
|
92
|
|
Total Management Fee Paid
|
$24,181,309
|
|
Portfolio Turnover Rate
|
39.14%
|
WHAT DID THE FUND INVEST IN? (as of April 30, 2026)
Portfolio Composition*,† (% of Total Investments)

WHAT WERE THE FUND COSTS FOR THE LAST YEAR? (based on a hypothetical $10,000 investment)
|
Class Name
|
Costs of a $10,000 investment
|
Costs paid as a percentage of a $10,000 investment*
|
|
Class A
|
$127
|
0.96%
|
HOW DID THE FUND PERFORM LAST YEAR AND WHAT AFFECTED ITS PERFORMANCE?
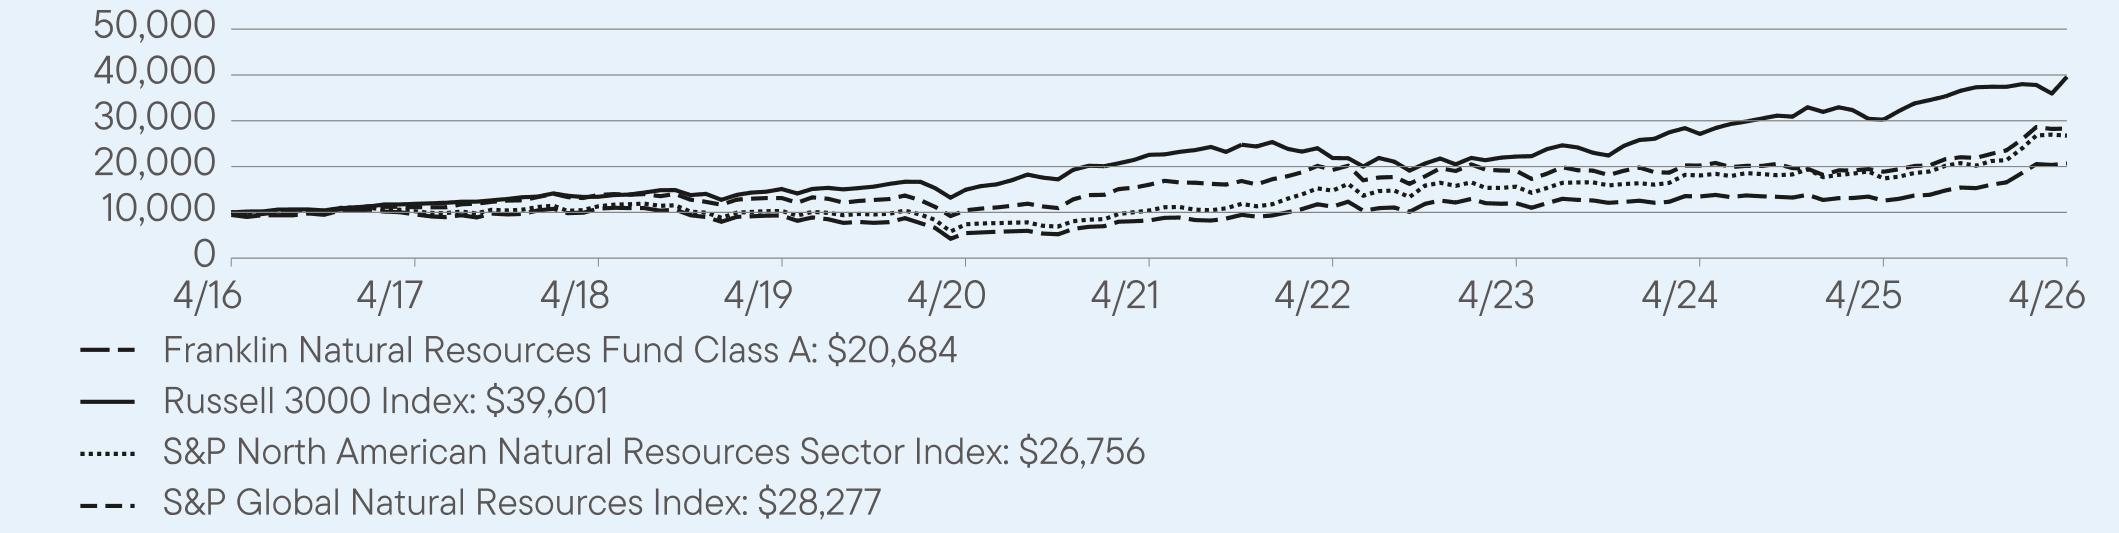
For the twelve months ended April 30, 2026, Class A shares of Franklin Natural Resources Fund returned 64.73%. The Fund compares its performance to the S&P North American Natural Resources Sector Index and the S&P Global Natural Resources Index, which returned 53.73% and 49.88%, respectively, for the same period.
PERFORMANCE HIGHLIGHTS
|
Top contributors to performance:
|
|
|
↑
|
Among metals producers, exceptionally strong gains for overweighted or off-benchmark positions in the diversified metals and mining industry, including rare earth development and production companies like Aclara Resources, MP Materials and Lindian Resources (purchased during the period); Copper-focused producers like Lundin Mining, ERO Copper and Antofagasta; and gold miners such as Barrick Mining and Newmont. Many of these stocks more than doubled in value as prices for copper, gold, silver, and other metals rose to all-time or multiyear highs.
|
|
↑
|
In the energy sector, beneficial underweighting and stock selection in the oil and gas storage and transportation industry (led by a much lighter-than-index exposure to Enbridge); overweighting and stock selection in oilfield services, where the Fund’s holdings collectively increased more than 100%; and effective stock selection in integrated oil and gas, as well as oil and gas exploration and production.
|
|
↑
|
Triple-digit percentage gains for select off-benchmark industry allocations, including specialty chemicals (led by key contributor Albemarle); electrical components and equipment (led by T1 Energy); and heavy electrical equipment (led by GE Vernova).
|
|
Top detractors from performance:
|
|
|
↓
|
Benchmark-lagging gains for off-index positions in Linde, as well as Air Products and Chemicals, in the industrial gases industry and, to a lesser extent, Corteva and Nutrien in fertilizers and agricultural chemicals.
|
|
↓
|
Underweighted exposures to select oil and gas refining and marketing companies that rallied well beyond the benchmark averages, including key detractor Valero Energy. Relative returns were further pressured by underweighting’s in other energy-related outliers to the upside, including uranium fuel producer Cameco and drilling contractor Baker Hughes.
|
|
↓
|
Negative returns in some of the Fund’s single-asset, off-benchmark industry allocations, with the detractors focused on water infrastructure plays such as Badger Meter (electronic equipment and instruments industry) and Xylem (industrial machinery, supplies and components).
|
AVERAGE ANNUAL TOTAL RETURNS (%) Period Ended April 30, 2026
|
|
1 Year
|
5 Year
|
10 Year
|
|
Class A
|
64.73
|
20.21
|
8.15
|
|
Class A (with sales charge)
|
55.67
|
18.86
|
7.54
|
|
Russell 3000 Index
|
31.01
|
11.91
|
14.76
|
|
S&P North American Natural Resources Sector Index
|
53.73
|
20.81
|
10.34
|
|
S&P Global Natural Resources Index
|
49.88
|
12.01
|
10.96
|
For current month-end performance, please call Franklin Templeton at (800) DIAL BEN/342-5236 or visit
https://www.franklintempleton.com/investments/options/mutual-funds.
https://www.franklintempleton.com/investments/options/mutual-funds.
Important data provider notices and terms available at www.franklintempletondatasources.com.
KEY FUND STATISTICS (as of April 30, 2026)
|
Total Net Assets
|
$538,915,982
|
|
Total Number of Portfolio Holdings
|
100
|
|
Total Management Fee Paid
|
$1,953,759
|
|
Portfolio Turnover Rate
|
27.09%
|
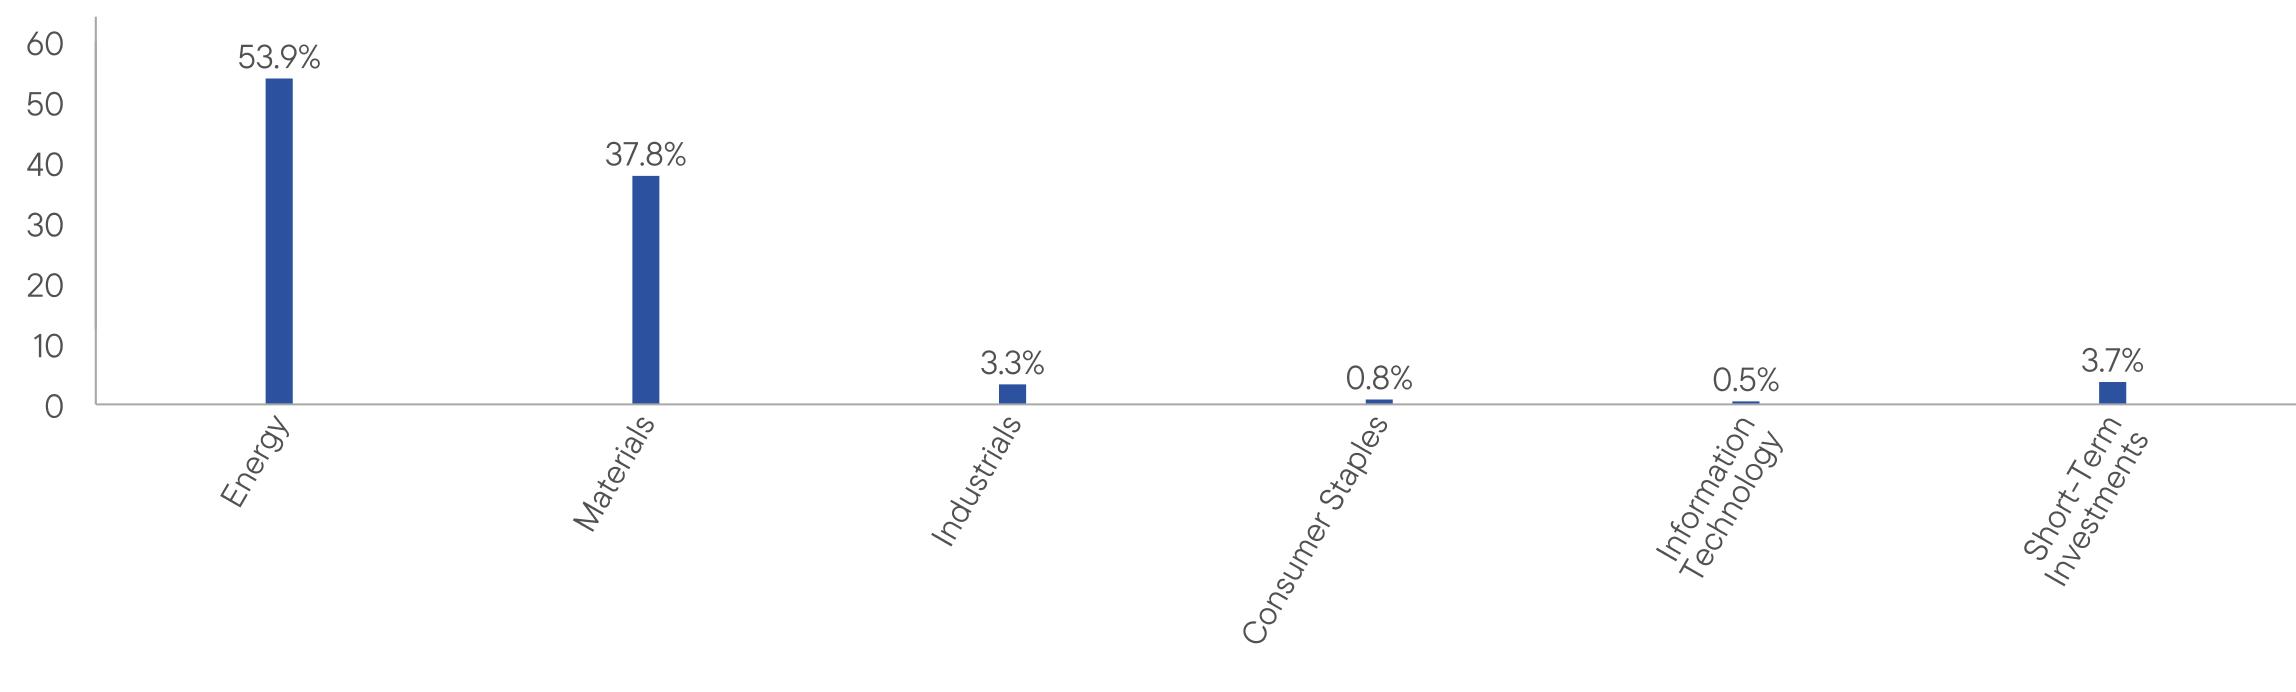
WHAT DID THE FUND INVEST IN? (as of April 30, 2026)
Portfolio Composition* (% of Total Investments)

WHAT WERE THE FUND COSTS FOR THE LAST YEAR? (based on a hypothetical $10,000 investment)
|
Class Name
|
Costs of a $10,000 investment
|
Costs paid as a percentage of a $10,000 investment*
|
|
Class C
|
$225
|
1.71%
|
HOW DID THE FUND PERFORM LAST YEAR AND WHAT AFFECTED ITS PERFORMANCE?
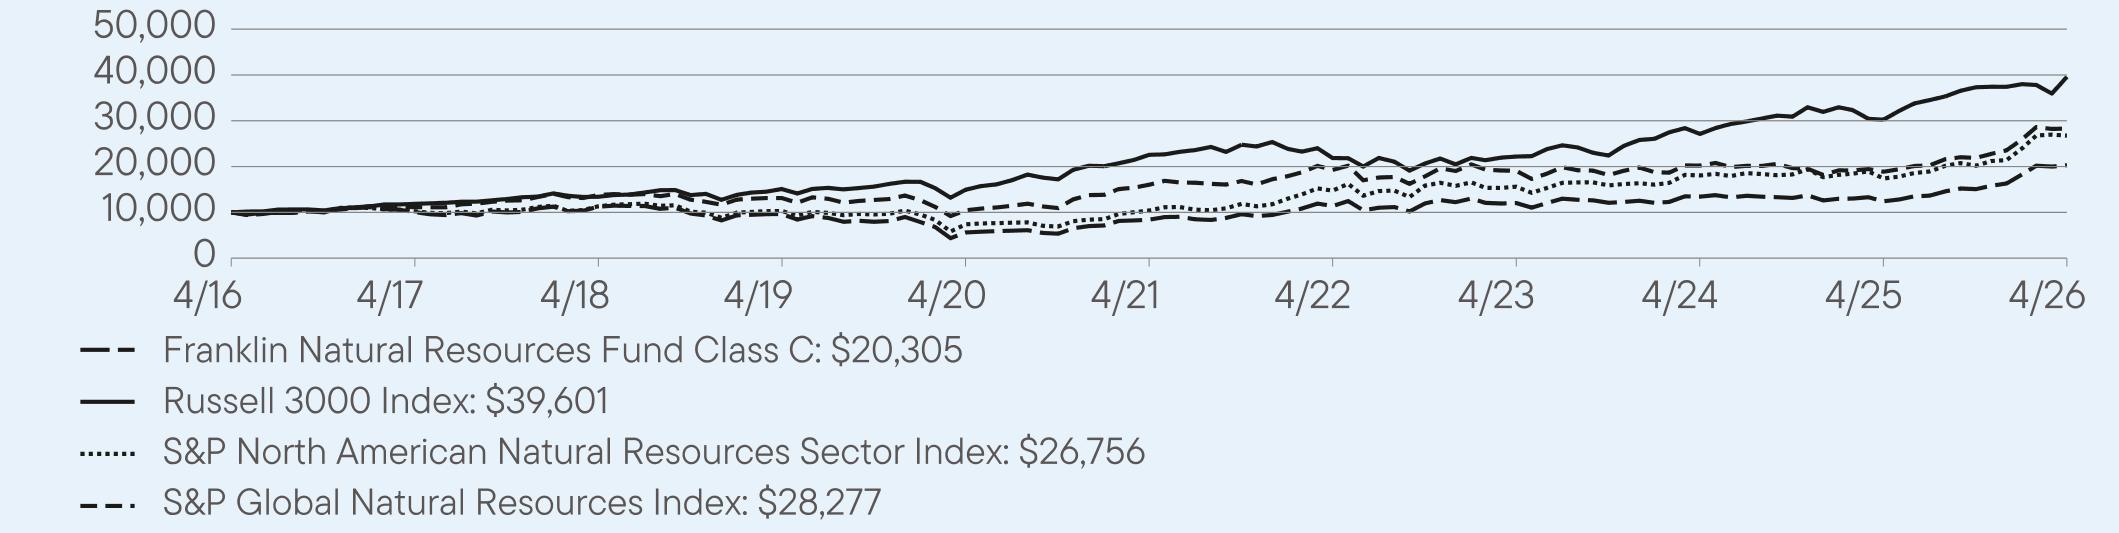
For the twelve months ended April 30, 2026, Class C shares of Franklin Natural Resources Fund returned 63.49%. The Fund compares its performance to the S&P North American Natural Resources Sector Index and the S&P Global Natural Resources Index, which returned 53.73% and 49.88%, respectively, for the same period.
PERFORMANCE HIGHLIGHTS
|
Top contributors to performance:
|
|
|
↑
|
Among metals producers, exceptionally strong gains for overweighted or off-benchmark positions in the diversified metals and mining industry, including rare earth development and production companies like Aclara Resources, MP Materials and Lindian Resources (purchased during the period); Copper-focused producers like Lundin Mining, ERO Copper and Antofagasta; and gold miners such as Barrick Mining and Newmont. Many of these stocks more than doubled in value as prices for copper, gold, silver, and other metals rose to all-time or multiyear highs.
|
|
↑
|
In the energy sector, beneficial underweighting and stock selection in the oil and gas storage and transportation industry (led by a much lighter-than-index exposure to Enbridge); overweighting and stock selection in oilfield services, where the Fund’s holdings collectively increased more than 100%; and effective stock selection in integrated oil and gas, as well as oil and gas exploration and production.
|
|
↑
|
Triple-digit percentage gains for select off-benchmark industry allocations, including specialty chemicals (led by key contributor Albemarle); electrical components and equipment (led by T1 Energy); and heavy electrical equipment (led by GE Vernova).
|
|
Top detractors from performance:
|
|
|
↓
|
Benchmark-lagging gains for off-index positions in Linde, as well as Air Products and Chemicals, in the industrial gases industry and, to a lesser extent, Corteva and Nutrien in fertilizers and agricultural chemicals.
|
|
↓
|
Underweighted exposures to select oil and gas refining and marketing companies that rallied well beyond the benchmark averages, including key detractor Valero Energy. Relative returns were further pressured by underweighting’s in other energy-related outliers to the upside, including uranium fuel producer Cameco and drilling contractor Baker Hughes.
|
|
↓
|
Negative returns in some of the Fund’s single-asset, off-benchmark industry allocations, with the detractors focused on water infrastructure plays such as Badger Meter (electronic equipment and instruments industry) and Xylem (industrial machinery, supplies and components).
|
AVERAGE ANNUAL TOTAL RETURNS (%) Period Ended April 30, 2026
|
|
1 Year
|
5 Year
|
10 Year
|
|
Class C
|
63.49
|
19.31
|
7.34
|
|
Class C (with sales charge)
|
62.49
|
19.31
|
7.34
|
|
Russell 3000 Index
|
31.01
|
11.91
|
14.76
|
|
S&P North American Natural Resources Sector Index
|
53.73
|
20.81
|
10.34
|
|
S&P Global Natural Resources Index
|
49.88
|
12.01
|
10.96
|
For current month-end performance, please call Franklin Templeton at (800) DIAL BEN/342-5236 or visit
https://www.franklintempleton.com/investments/options/mutual-funds.
https://www.franklintempleton.com/investments/options/mutual-funds.
Important data provider notices and terms available at www.franklintempletondatasources.com.
KEY FUND STATISTICS (as of April 30, 2026)
|
Total Net Assets
|
$538,915,982
|
|
Total Number of Portfolio Holdings
|
100
|
|
Total Management Fee Paid
|
$1,953,759
|
|
Portfolio Turnover Rate
|
27.09%
|
WHAT DID THE FUND INVEST IN? (as of April 30, 2026)
Portfolio Composition* (% of Total Investments)
WHAT WERE THE FUND COSTS FOR THE LAST YEAR? (based on a hypothetical $10,000 investment)
|
Class Name
|
Costs of a $10,000 investment
|
Costs paid as a percentage of a $10,000 investment*
|
|
Class R6
|
$78
|
0.59%
|
HOW DID THE FUND PERFORM LAST YEAR AND WHAT AFFECTED ITS PERFORMANCE?
For the twelve months ended April 30, 2026, Class R6 shares of Franklin Natural Resources Fund returned 65.36%. The Fund compares its performance to the S&P North American Natural Resources Sector Index and the S&P Global Natural Resources Index, which returned 53.73% and 49.88%, respectively, for the same period.
PERFORMANCE HIGHLIGHTS
|
Top contributors to performance:
|
|
|
↑
|
Among metals producers, exceptionally strong gains for overweighted or off-benchmark positions in the diversified metals and mining industry, including rare earth development and production companies like Aclara Resources, MP Materials and Lindian Resources (purchased during the period); Copper-focused producers like Lundin Mining, ERO Copper and Antofagasta; and gold miners such as Barrick Mining and Newmont. Many of these stocks more than doubled in value as prices for copper, gold, silver, and other metals rose to all-time or multiyear highs.
|
|
↑
|
In the energy sector, beneficial underweighting and stock selection in the oil and gas storage and transportation industry (led by a much lighter-than-index exposure to Enbridge); overweighting and stock selection in oilfield services, where the Fund’s holdings collectively increased more than 100%; and effective stock selection in integrated oil and gas, as well as oil and gas exploration and production.
|
|
↑
|
Triple-digit percentage gains for select off-benchmark industry allocations, including specialty chemicals (led by key contributor Albemarle); electrical components and equipment (led by T1 Energy); and heavy electrical equipment (led by GE Vernova).
|
|
Top detractors from performance:
|
|
|
↓
|
Benchmark-lagging gains for off-index positions in Linde, as well as Air Products and Chemicals, in the industrial gases industry and, to a lesser extent, Corteva and Nutrien in fertilizers and agricultural chemicals.
|
|
↓
|
Underweighted exposures to select oil and gas refining and marketing companies that rallied well beyond the benchmark averages, including key detractor Valero Energy. Relative returns were further pressured by underweighting’s in other energy-related outliers to the upside, including uranium fuel producer Cameco and drilling contractor Baker Hughes.
|
|
↓
|
Negative returns in some of the Fund’s single-asset, off-benchmark industry allocations, with the detractors focused on water infrastructure plays such as Badger Meter (electronic equipment and instruments industry) and Xylem (industrial machinery, supplies and components).
|

AVERAGE ANNUAL TOTAL RETURNS (%) Period Ended April 30, 2026
|
|
1 Year
|
5 Year
|
10 Year
|
|
Class R6
|
65.36
|
20.70
|
8.64
|
|
Russell 3000 Index
|
31.01
|
11.91
|
14.76
|
|
S&P North American Natural Resources Sector Index
|
53.73
|
20.81
|
10.34
|
|
S&P Global Natural Resources Index
|
49.88
|
12.01
|
10.96
|
For current month-end performance, please call Franklin Templeton at (800) DIAL BEN/342-5236 or visit
https://www.franklintempleton.com/investments/options/mutual-funds.
https://www.franklintempleton.com/investments/options/mutual-funds.
Important data provider notices and terms available at www.franklintempletondatasources.com.
KEY FUND STATISTICS (as of April 30, 2026)
|
Total Net Assets
|
$538,915,982
|
|
Total Number of Portfolio Holdings
|
100
|
|
Total Management Fee Paid
|
$1,953,759
|
|
Portfolio Turnover Rate
|
27.09%
|
WHAT DID THE FUND INVEST IN? (as of April 30, 2026)
Portfolio Composition* (% of Total Investments)

WHAT WERE THE FUND COSTS FOR THE LAST YEAR? (based on a hypothetical $10,000 investment)
|
Class Name
|
Costs of a $10,000 investment
|
Costs paid as a percentage of a $10,000 investment*
|
|
Advisor Class
|
$93
|
0.70%
|
HOW DID THE FUND PERFORM LAST YEAR AND WHAT AFFECTED ITS PERFORMANCE?
For the twelve months ended April 30, 2026, Advisor Class shares of Franklin Natural Resources Fund returned 65.18%. The Fund compares its performance to the S&P North American Natural Resources Sector Index and the S&P Global Natural Resources Index, which returned 53.73% and 49.88%, respectively, for the same period.
PERFORMANCE HIGHLIGHTS
|
Top contributors to performance:
|
|
|
↑
|
Among metals producers, exceptionally strong gains for overweighted or off-benchmark positions in the diversified metals and mining industry, including rare earth development and production companies like Aclara Resources, MP Materials and Lindian Resources (purchased during the period); Copper-focused producers like Lundin Mining, ERO Copper and Antofagasta; and gold miners such as Barrick Mining and Newmont. Many of these stocks more than doubled in value as prices for copper, gold, silver, and other metals rose to all-time or multiyear highs.
|
|
↑
|
In the energy sector, beneficial underweighting and stock selection in the oil and gas storage and transportation industry (led by a much lighter-than-index exposure to Enbridge); overweighting and stock selection in oilfield services, where the Fund’s holdings collectively increased more than 100%; and effective stock selection in integrated oil and gas, as well as oil and gas exploration and production.
|
|
↑
|
Triple-digit percentage gains for select off-benchmark industry allocations, including specialty chemicals (led by key contributor Albemarle); electrical components and equipment (led by T1 Energy); and heavy electrical equipment (led by GE Vernova).
|
|
Top detractors from performance:
|
|
|
↓
|
Benchmark-lagging gains for off-index positions in Linde, as well as Air Products and Chemicals, in the industrial gases industry and, to a lesser extent, Corteva and Nutrien in fertilizers and agricultural chemicals.
|
|
↓
|
Underweighted exposures to select oil and gas refining and marketing companies that rallied well beyond the benchmark averages, including key detractor Valero Energy. Relative returns were further pressured by underweighting’s in other energy-related outliers to the upside, including uranium fuel producer Cameco and drilling contractor Baker Hughes.
|
|
↓
|
Negative returns in some of the Fund’s single-asset, off-benchmark industry allocations, with the detractors focused on water infrastructure plays such as Badger Meter (electronic equipment and instruments industry) and Xylem (industrial machinery, supplies and components).
|
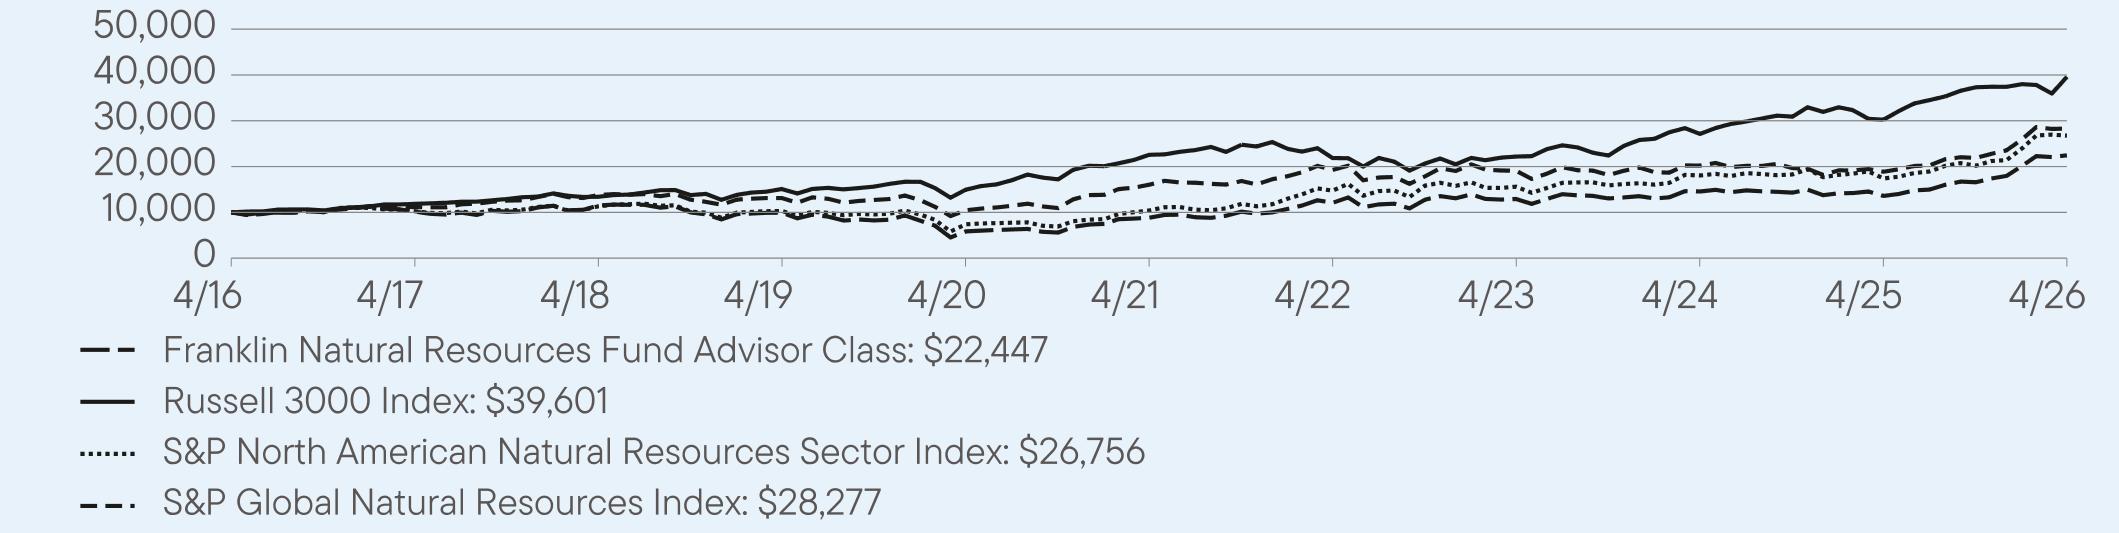
AVERAGE ANNUAL TOTAL RETURNS (%) Period Ended April 30, 2026
|
|
1 Year
|
5 Year
|
10 Year
|
|
Advisor Class
|
65.18
|
20.52
|
8.42
|
|
Russell 3000 Index
|
31.01
|
11.91
|
14.76
|
|
S&P North American Natural Resources Sector Index
|
53.73
|
20.81
|
10.34
|
|
S&P Global Natural Resources Index
|
49.88
|
12.01
|
10.96
|
For current month-end performance, please call Franklin Templeton at (800) DIAL BEN/342-5236 or visit
https://www.franklintempleton.com/investments/options/mutual-funds.
https://www.franklintempleton.com/investments/options/mutual-funds.
Important data provider notices and terms available at www.franklintempletondatasources.com.
KEY FUND STATISTICS (as of April 30, 2026)
|
Total Net Assets
|
$538,915,982
|
|
Total Number of Portfolio Holdings
|
100
|
|
Total Management Fee Paid
|
$1,953,759
|
|
Portfolio Turnover Rate
|
27.09%
|
WHAT DID THE FUND INVEST IN? (as of April 30, 2026)
Portfolio Composition* (% of Total Investments)

This report describes changes to the Fund that occurred during the reporting period.
WHAT WERE THE FUND COSTS FOR THE LAST YEAR? (based on a hypothetical $10,000 investment)
|
Class Name
|
Costs of a $10,000 investment
|
Costs paid as a percentage of a $10,000 investment*
|
|
Class A
|
$123
|
1.07%
|
HOW DID THE FUND PERFORM LAST YEAR AND WHAT AFFECTED ITS PERFORMANCE?
For the twelve months ended April 30, 2026, Class A shares of Franklin Small Cap Growth Fund returned 30.13%. The Fund compares its performance to the Russell 2000 Growth Index and the S&P 500 Index, which returned 42.64% and 31.05%, respectively, for the same period.
PERFORMANCE HIGHLIGHTS
|
Top contributors to performance:
|
|
|
↑
|
By sector, the largest contributor to relative returns was stock selection in the health care sector. However, the largest individual contributors all came from the information technology (IT) sector. An off-benchmark position in phototonics specialist Lumentum Holdings led relative contributors after the company reported strong fiscal second quarter 2026 financial results and upbeat forward guidance, driven by surging demand for artificial intelligence (AI) data center optics.
|
|
↑
|
Semiconductor manufacturer SiTime also advanced relative returns. Shares in the company, which makes precision timing chips, soared late in the period after the company posted strong revenue growth amid increased demand from AI data centers.
|
|
↑
|
Onto Innovation supported relative returns. The process control solutions company benefited from surging demand for advanced semiconductor packaging and metrology tools driven by AI chip growth.
|
|
Top detractors from performance:
|
|
|
↓
|
Stock selection and an overweight in the consumer staples sector held back relative returns. Within the sector, an off-benchmark holding in BellRing Brands was the leading detractor. The nutrition products company reported shrinking profit margins and decreasing demand for its protein shakes. Retailer inventory adjustments and reduced full year 2025 guidance were also headwinds for the company.
|
|
↓
|
Within IT, a broader market pivot away from software stocks had a negative impact on shares of software development platform GitLab, despite the company’s positive earnings reports.
|
|
↓
|
In the health care sector, relative performance was hurt by a position in health care software company Phreesia. The company reduced guidance for 2027, reporting that it is losing visibility into spending commitments from some of its clients.
|
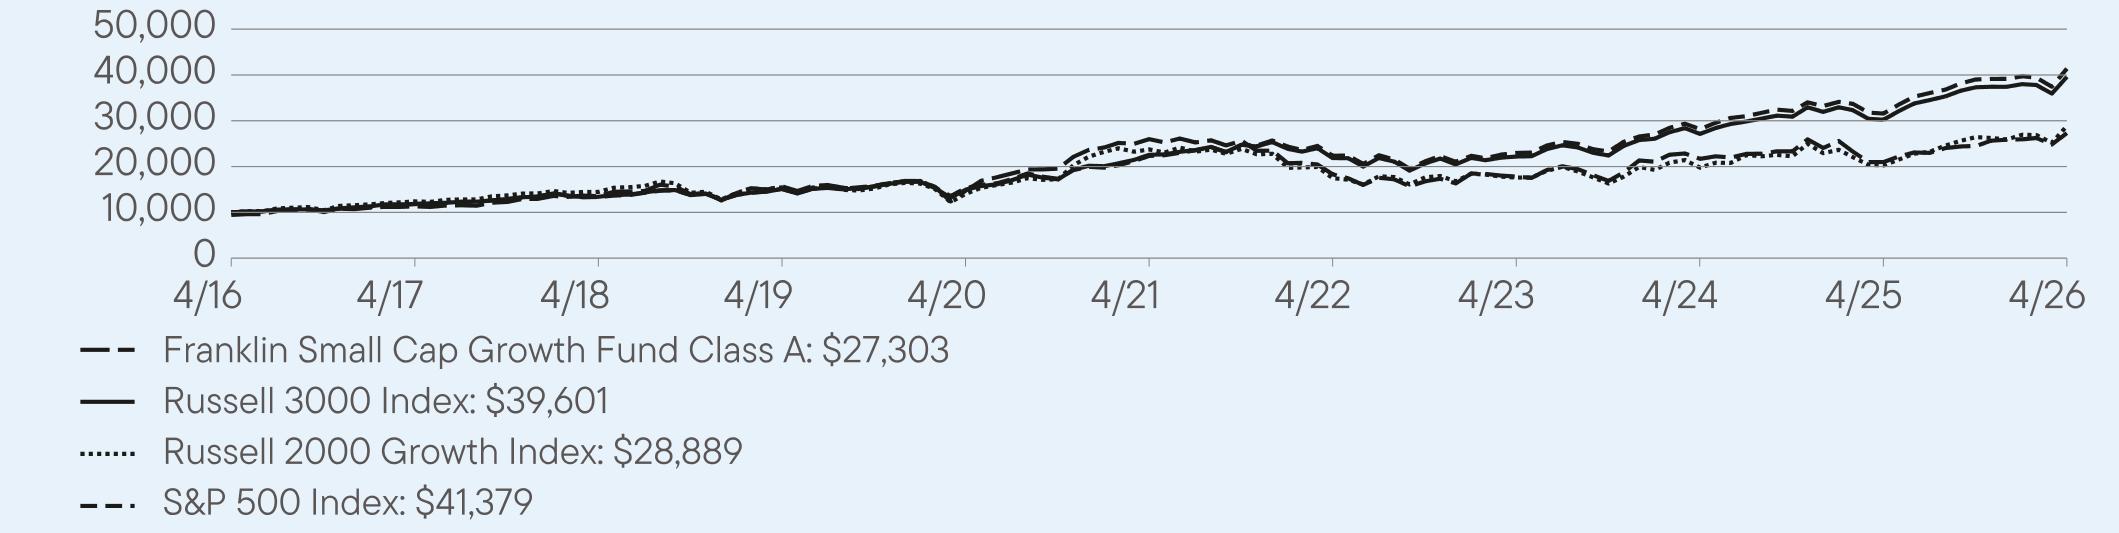
AVERAGE ANNUAL TOTAL RETURNS (%) Period Ended April 30, 2026
|
|
1 Year
|
5 Year
|
10 Year
|
|
Class A
|
30.13
|
0.99
|
11.19
|
|
Class A (with sales charge)
|
22.96
|
-0.14
|
10.57
|
|
Russell 3000 Index
|
31.01
|
11.91
|
14.76
|
|
Russell 2000 Growth Index
|
42.64
|
4.00
|
11.19
|
|
S&P 500 Index
|
31.05
|
13.14
|
15.26
|
For current month-end performance, please call Franklin Templeton at (800) DIAL BEN/342-5236 or visit
https://www.franklintempleton.com/investments/options/mutual-funds.
https://www.franklintempleton.com/investments/options/mutual-funds.
Important data provider notices and terms available at www.franklintempletondatasources.com.
KEY FUND STATISTICS (as of April 30, 2026)
|
Total Net Assets
|
$2,435,287,399
|
|
Total Number of Portfolio Holdings
|
129
|
|
Total Management Fee Paid
|
$15,084,958
|
|
Portfolio Turnover Rate
|
48.01%
|
WHAT DID THE FUND INVEST IN? (as of April 30, 2026)
Portfolio Composition*,† (% of Total Investments)

HOW HAS THE FUND CHANGED?
Effective December 31, 2025, Michael McCarthy no longer served as a portfolio manager of the Fund and Jacob Swartz was added as a portfolio manager of the Fund.
This is a summary of certain changes to the Fund since May 1, 2025. For more complete information, you may review the Fund’s current prospectus and any applicable supplements and the Fund’s next prospectus, which we expect to be available by September 1, 2026, at https://www.franklintempleton.com/regulatory-fund-documents or upon request at (800) DIAL BEN/342-5236 or
prospectus.us.franklintempleton@fisglobal.com.
prospectus.us.franklintempleton@fisglobal.com.
This report describes changes to the Fund that occurred during the reporting period.
WHAT WERE THE FUND COSTS FOR THE LAST YEAR? (based on a hypothetical $10,000 investment)
|
Class Name
|
Costs of a $10,000 investment
|
Costs paid as a percentage of a $10,000 investment*
|
|
Class C
|
$209
|
1.82%
|
HOW DID THE FUND PERFORM LAST YEAR AND WHAT AFFECTED ITS PERFORMANCE?
For the twelve months ended April 30, 2026, Class C shares of Franklin Small Cap Growth Fund returned 29.21%. The Fund compares its performance to the Russell 2000 Growth Index and the S&P 500 Index, which returned 42.64% and 31.05%, respectively, for the same period.
PERFORMANCE HIGHLIGHTS
|
Top contributors to performance:
|
|
|
↑
|
By sector, the largest contributor to relative returns was stock selection in the health care sector. However, the largest individual contributors all came from the information technology (IT) sector. An off-benchmark position in phototonics specialist Lumentum Holdings led relative contributors after the company reported strong fiscal second quarter 2026 financial results and upbeat forward guidance, driven by surging demand for artificial intelligence (AI) data center optics.
|
|
↑
|
Semiconductor manufacturer SiTime also advanced relative returns. Shares in the company, which makes precision timing chips, soared late in the period after the company posted strong revenue growth amid increased demand from AI data centers.
|
|
↑
|
Onto Innovation supported relative returns. The process control solutions company benefited from surging demand for advanced semiconductor packaging and metrology tools driven by AI chip growth.
|
|
Top detractors from performance:
|
|
|
↓
|
Stock selection and an overweight in the consumer staples sector held back relative returns. Within the sector, an off-benchmark holding in BellRing Brands was the leading detractor. The nutrition products company reported shrinking profit margins and decreasing demand for its protein shakes. Retailer inventory adjustments and reduced full year 2025 guidance were also headwinds for the company.
|
|
↓
|
Within IT, a broader market pivot away from software stocks had a negative impact on shares of software development platform GitLab, despite the company’s positive earnings reports.
|
|
↓
|
In the health care sector, relative performance was hurt by a position in health care software company Phreesia. The company reduced guidance for 2027, reporting that it is losing visibility into spending commitments from some of its clients.
|
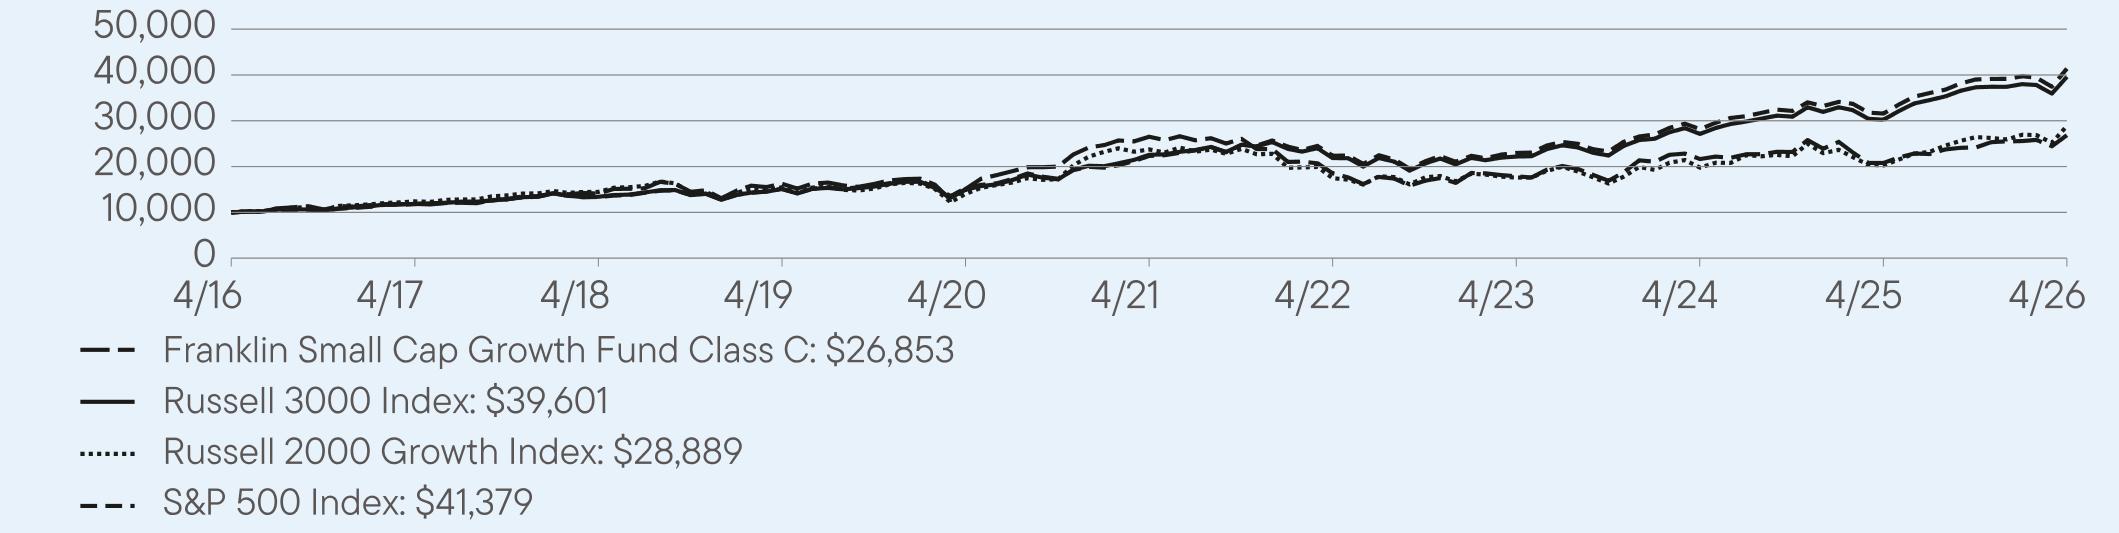
AVERAGE ANNUAL TOTAL RETURNS (%) Period Ended April 30, 2026
|
|
1 Year
|
5 Year
|
10 Year
|
|
Class C
|
29.21
|
0.26
|
10.38
|
|
Class C (with sales charge)
|
28.21
|
0.26
|
10.38
|
|
Russell 3000 Index
|
31.01
|
11.91
|
14.76
|
|
Russell 2000 Growth Index
|
42.64
|
4.00
|
11.19
|
|
S&P 500 Index
|
31.05
|
13.14
|
15.26
|
For current month-end performance, please call Franklin Templeton at (800) DIAL BEN/342-5236 or visit
https://www.franklintempleton.com/investments/options/mutual-funds.
https://www.franklintempleton.com/investments/options/mutual-funds.
Important data provider notices and terms available at www.franklintempletondatasources.com.
KEY FUND STATISTICS (as of April 30, 2026)
|
Total Net Assets
|
$2,435,287,399
|
|
Total Number of Portfolio Holdings
|
129
|
|
Total Management Fee Paid
|
$15,084,958
|
|
Portfolio Turnover Rate
|
48.01%
|
WHAT DID THE FUND INVEST IN? (as of April 30, 2026)
Portfolio Composition*,† (% of Total Investments)

HOW HAS THE FUND CHANGED?
Effective December 31, 2025, Michael McCarthy no longer served as a portfolio manager of the Fund and Jacob Swartz was added as a portfolio manager of the Fund.
This is a summary of certain changes to the Fund since May 1, 2025. For more complete information, you may review the Fund’s current prospectus and any applicable supplements and the Fund’s next prospectus, which we expect to be available by September 1, 2026, at https://www.franklintempleton.com/regulatory-fund-documents or upon request at (800) DIAL BEN/342-5236 or
prospectus.us.franklintempleton@fisglobal.com.
prospectus.us.franklintempleton@fisglobal.com.
This report describes changes to the Fund that occurred during the reporting period.
WHAT WERE THE FUND COSTS FOR THE LAST YEAR? (based on a hypothetical $10,000 investment)
|
Class Name
|
Costs of a $10,000 investment
|
Costs paid as a percentage of a $10,000 investment*
|
|
Class R
|
$152
|
1.32%
|
HOW DID THE FUND PERFORM LAST YEAR AND WHAT AFFECTED ITS PERFORMANCE?
For the twelve months ended April 30, 2026, Class R shares of Franklin Small Cap Growth Fund returned 29.79%. The Fund compares its performance to the Russell 2000 Growth Index and the S&P 500 Index, which returned 42.64% and 31.05%, respectively, for the same period.
PERFORMANCE HIGHLIGHTS
|
Top contributors to performance:
|
|
|
↑
|
By sector, the largest contributor to relative returns was stock selection in the health care sector. However, the largest individual contributors all came from the information technology (IT) sector. An off-benchmark position in phototonics specialist Lumentum Holdings led relative contributors after the company reported strong fiscal second quarter 2026 financial results and upbeat forward guidance, driven by surging demand for artificial intelligence (AI) data center optics.
|
|
↑
|
Semiconductor manufacturer SiTime also advanced relative returns. Shares in the company, which makes precision timing chips, soared late in the period after the company posted strong revenue growth amid increased demand from AI data centers.
|
|
↑
|
Onto Innovation supported relative returns. The process control solutions company benefited from surging demand for advanced semiconductor packaging and metrology tools driven by AI chip growth.
|
|
Top detractors from performance:
|
|
|
↓
|
Stock selection and an overweight in the consumer staples sector held back relative returns. Within the sector, an off-benchmark holding in BellRing Brands was the leading detractor. The nutrition products company reported shrinking profit margins and decreasing demand for its protein shakes. Retailer inventory adjustments and reduced full year 2025 guidance were also headwinds for the company.
|
|
↓
|
Within IT, a broader market pivot away from software stocks had a negative impact on shares of software development platform GitLab, despite the company’s positive earnings reports.
|
|
↓
|
In the health care sector, relative performance was hurt by a position in health care software company Phreesia. The company reduced guidance for 2027, reporting that it is losing visibility into spending commitments from some of its clients.
|

AVERAGE ANNUAL TOTAL RETURNS (%) Period Ended April 30, 2026
|
|
1 Year
|
5 Year
|
10 Year
|
|
Class R
|
29.79
|
0.74
|
10.91
|
|
Russell 3000 Index
|
31.01
|
11.91
|
14.76
|
|
Russell 2000 Growth Index
|
42.64
|
4.00
|
11.19
|
|
S&P 500 Index
|
31.05
|
13.14
|
15.26
|
For current month-end performance, please call Franklin Templeton at (800) DIAL BEN/342-5236 or visit
https://www.franklintempleton.com/investments/options/mutual-funds.
https://www.franklintempleton.com/investments/options/mutual-funds.
Important data provider notices and terms available at www.franklintempletondatasources.com.
KEY FUND STATISTICS (as of April 30, 2026)
|
Total Net Assets
|
$2,435,287,399
|
|
Total Number of Portfolio Holdings
|
129
|
|
Total Management Fee Paid
|
$15,084,958
|
|
Portfolio Turnover Rate
|
48.01%
|
WHAT DID THE FUND INVEST IN? (as of April 30, 2026)
Portfolio Composition*,† (% of Total Investments)

HOW HAS THE FUND CHANGED?
Effective December 31, 2025, Michael McCarthy no longer served as a portfolio manager of the Fund and Jacob Swartz was added as a portfolio manager of the Fund.
This is a summary of certain changes to the Fund since May 1, 2025. For more complete information, you may review the Fund’s current prospectus and any applicable supplements and the Fund’s next prospectus, which we expect to be available by September 1, 2026, at https://www.franklintempleton.com/regulatory-fund-documents or upon request at (800) DIAL BEN/342-5236 or
prospectus.us.franklintempleton@fisglobal.com.
prospectus.us.franklintempleton@fisglobal.com.
This report describes changes to the Fund that occurred during the reporting period.
WHAT WERE THE FUND COSTS FOR THE LAST YEAR? (based on a hypothetical $10,000 investment)
|
Class Name
|
Costs of a $10,000 investment
|
Costs paid as a percentage of a $10,000 investment*
|
|
Class R6
|
$76
|
0.66%
|
HOW DID THE FUND PERFORM LAST YEAR AND WHAT AFFECTED ITS PERFORMANCE?
For the twelve months ended April 30, 2026, Class R6 shares of Franklin Small Cap Growth Fund returned 30.66%. The Fund compares its performance to the Russell 2000 Growth Index and the S&P 500 Index, which returned 42.64% and 31.05%, respectively, for the same period.
PERFORMANCE HIGHLIGHTS
|
Top contributors to performance:
|
|
|
↑
|
By sector, the largest contributor to relative returns was stock selection in the health care sector. However, the largest individual contributors all came from the information technology (IT) sector. An off-benchmark position in phototonics specialist Lumentum Holdings led relative contributors after the company reported strong fiscal second quarter 2026 financial results and upbeat forward guidance, driven by surging demand for artificial intelligence (AI) data center optics.
|
|
↑
|
Semiconductor manufacturer SiTime also advanced relative returns. Shares in the company, which makes precision timing chips, soared late in the period after the company posted strong revenue growth amid increased demand from AI data centers.
|
|
↑
|
Onto Innovation supported relative returns. The process control solutions company benefited from surging demand for advanced semiconductor packaging and metrology tools driven by AI chip growth.
|
|
Top detractors from performance:
|
|
|
↓
|
Stock selection and an overweight in the consumer staples sector held back relative returns. Within the sector, an off-benchmark holding in BellRing Brands was the leading detractor. The nutrition products company reported shrinking profit margins and decreasing demand for its protein shakes. Retailer inventory adjustments and reduced full year 2025 guidance were also headwinds for the company.
|
|
↓
|
Within IT, a broader market pivot away from software stocks had a negative impact on shares of software development platform GitLab, despite the company’s positive earnings reports.
|
|
↓
|
In the health care sector, relative performance was hurt by a position in health care software company Phreesia. The company reduced guidance for 2027, reporting that it is losing visibility into spending commitments from some of its clients.
|
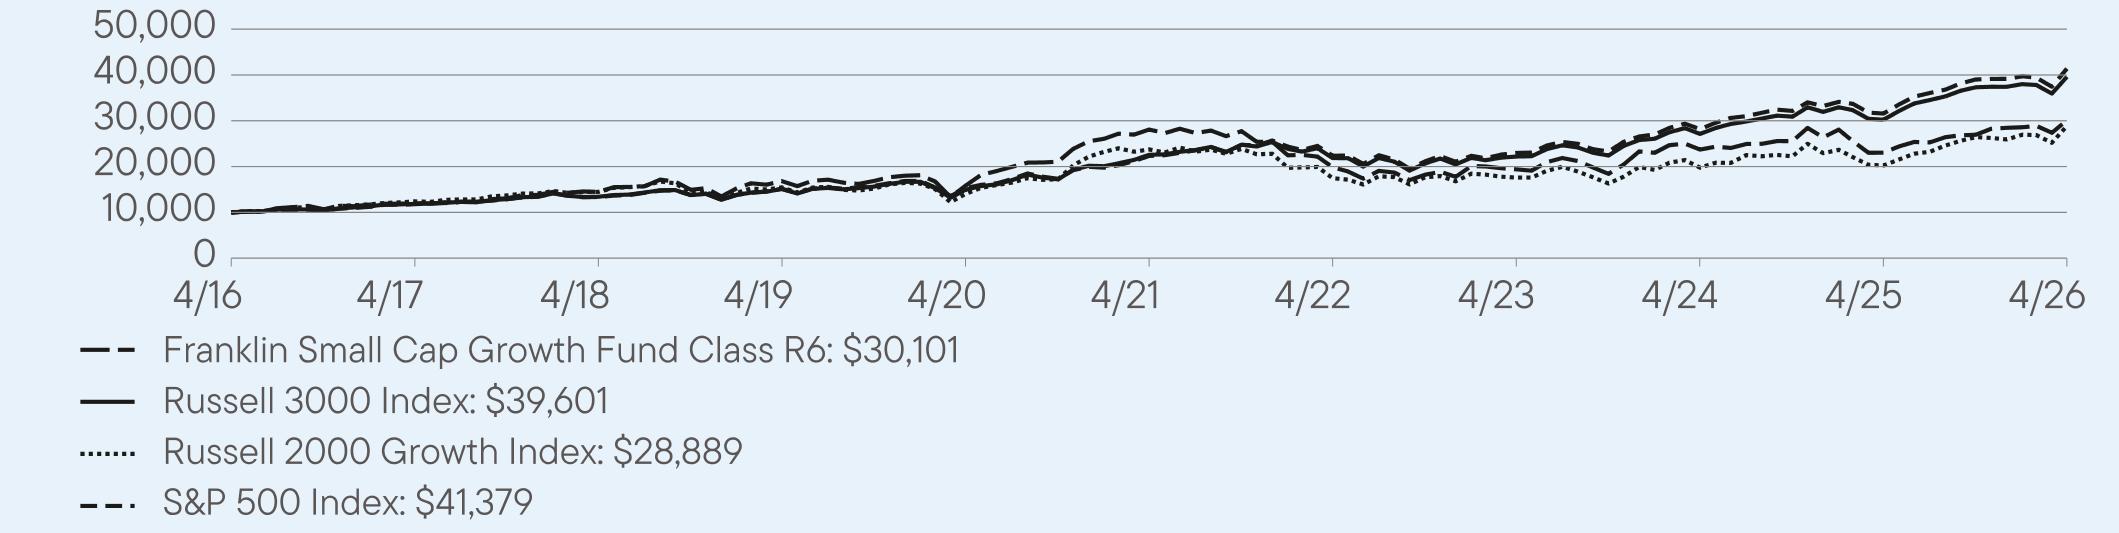
AVERAGE ANNUAL TOTAL RETURNS (%) Period Ended April 30, 2026
|
|
1 Year
|
5 Year
|
10 Year
|
|
Class R6
|
30.66
|
1.40
|
11.65
|
|
Russell 3000 Index
|
31.01
|
11.91
|
14.76
|
|
Russell 2000 Growth Index
|
42.64
|
4.00
|
11.19
|
|
S&P 500 Index
|
31.05
|
13.14
|
15.26
|
For current month-end performance, please call Franklin Templeton at (800) DIAL BEN/342-5236 or visit
https://www.franklintempleton.com/investments/options/mutual-funds.
https://www.franklintempleton.com/investments/options/mutual-funds.
Important data provider notices and terms available at www.franklintempletondatasources.com.
KEY FUND STATISTICS (as of April 30, 2026)
|
Total Net Assets
|
$2,435,287,399
|
|
Total Number of Portfolio Holdings
|
129
|
|
Total Management Fee Paid
|
$15,084,958
|
|
Portfolio Turnover Rate
|
48.01%
|
WHAT DID THE FUND INVEST IN? (as of April 30, 2026)
Portfolio Composition*,† (% of Total Investments)

HOW HAS THE FUND CHANGED?
Effective December 31, 2025, Michael McCarthy no longer served as a portfolio manager of the Fund and Jacob Swartz was added as a portfolio manager of the Fund.
This is a summary of certain changes to the Fund since May 1, 2025. For more complete information, you may review the Fund’s current prospectus and any applicable supplements and the Fund’s next prospectus, which we expect to be available by September 1, 2026, at https://www.franklintempleton.com/regulatory-fund-documents or upon request at (800) DIAL BEN/342-5236 or
prospectus.us.franklintempleton@fisglobal.com.
prospectus.us.franklintempleton@fisglobal.com.
This report describes changes to the Fund that occurred during the reporting period.
WHAT WERE THE FUND COSTS FOR THE LAST YEAR? (based on a hypothetical $10,000 investment)
|
Class Name
|
Costs of a $10,000 investment
|
Costs paid as a percentage of a $10,000 investment*
|
|
Advisor Class
|
$95
|
0.82%
|
HOW DID THE FUND PERFORM LAST YEAR AND WHAT AFFECTED ITS PERFORMANCE?
For the twelve months ended April 30, 2026, Advisor Class shares of Franklin Small Cap Growth Fund returned 30.50%. The Fund compares its performance to the Russell 2000 Growth Index and the S&P 500 Index, which returned 42.64% and 31.05%, respectively, for the same period.
PERFORMANCE HIGHLIGHTS
|
Top contributors to performance:
|
|
|
↑
|
By sector, the largest contributor to relative returns was stock selection in the health care sector. However, the largest individual contributors all came from the information technology (IT) sector. An off-benchmark position in phototonics specialist Lumentum Holdings led relative contributors after the company reported strong fiscal second quarter 2026 financial results and upbeat forward guidance, driven by surging demand for artificial intelligence (AI) data center optics.
|
|
↑
|
Semiconductor manufacturer SiTime also advanced relative returns. Shares in the company, which makes precision timing chips, soared late in the period after the company posted strong revenue growth amid increased demand from AI data centers.
|
|
↑
|
Onto Innovation supported relative returns. The process control solutions company benefited from surging demand for advanced semiconductor packaging and metrology tools driven by AI chip growth.
|
|
Top detractors from performance:
|
|
|
↓
|
Stock selection and an overweight in the consumer staples sector held back relative returns. Within the sector, an off-benchmark holding in BellRing Brands was the leading detractor. The nutrition products company reported shrinking profit margins and decreasing demand for its protein shakes. Retailer inventory adjustments and reduced full year 2025 guidance were also headwinds for the company.
|
|
↓
|
Within IT, a broader market pivot away from software stocks had a negative impact on shares of software development platform GitLab, despite the company’s positive earnings reports.
|
|
↓
|
In the health care sector, relative performance was hurt by a position in health care software company Phreesia. The company reduced guidance for 2027, reporting that it is losing visibility into spending commitments from some of its clients.
|
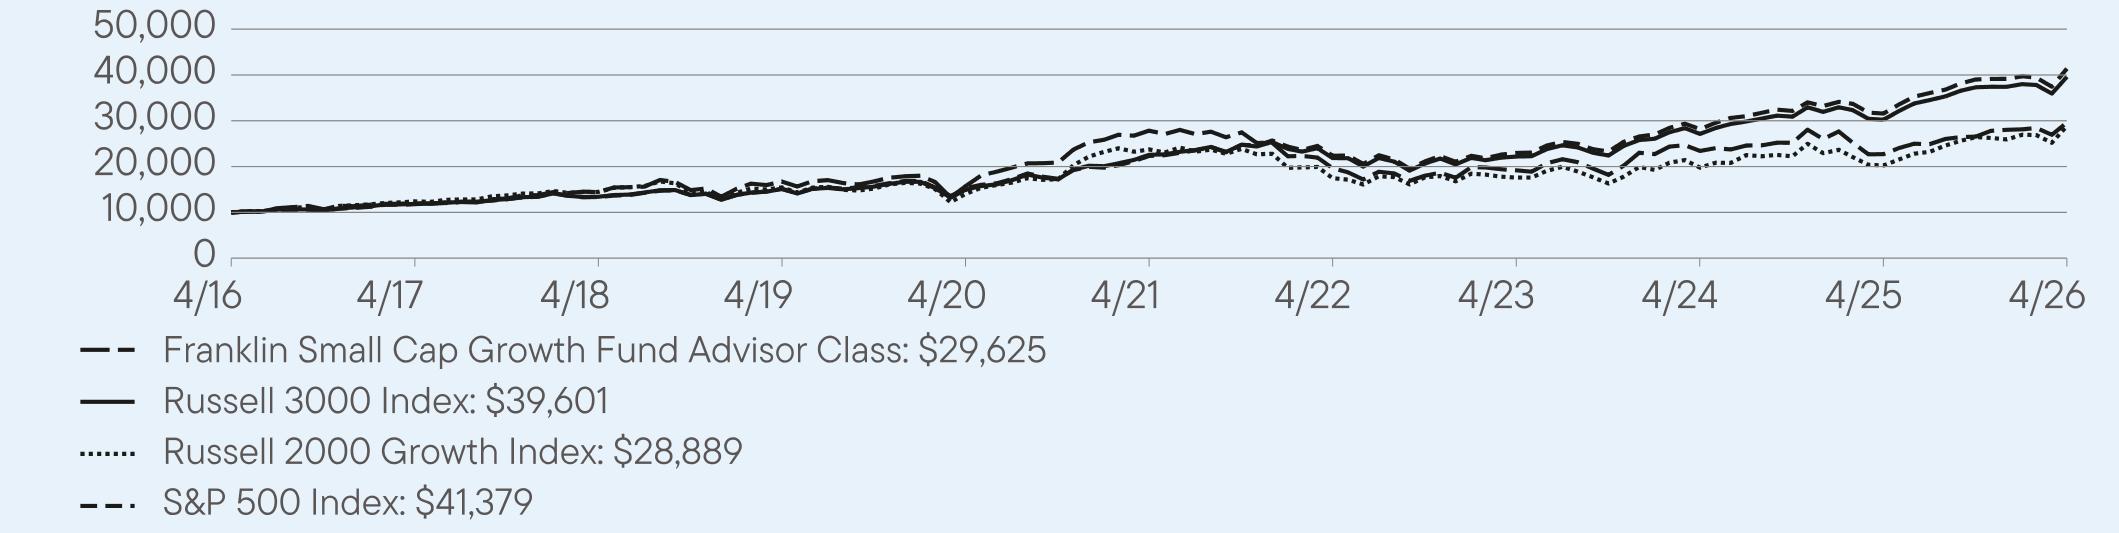
AVERAGE ANNUAL TOTAL RETURNS (%) Period Ended April 30, 2026
|
|
1 Year
|
5 Year
|
10 Year
|
|
Advisor Class
|
30.50
|
1.25
|
11.47
|
|
Russell 3000 Index
|
31.01
|
11.91
|
14.76
|
|
Russell 2000 Growth Index
|
42.64
|
4.00
|
11.19
|
|
S&P 500 Index
|
31.05
|
13.14
|
15.26
|
For current month-end performance, please call Franklin Templeton at (800) DIAL BEN/342-5236 or visit
https://www.franklintempleton.com/investments/options/mutual-funds.
https://www.franklintempleton.com/investments/options/mutual-funds.
Important data provider notices and terms available at www.franklintempletondatasources.com.
KEY FUND STATISTICS (as of April 30, 2026)
|
Total Net Assets
|
$2,435,287,399
|
|
Total Number of Portfolio Holdings
|
129
|
|
Total Management Fee Paid
|
$15,084,958
|
|
Portfolio Turnover Rate
|
48.01%
|
WHAT DID THE FUND INVEST IN? (as of April 30, 2026)
Portfolio Composition*,† (% of Total Investments)
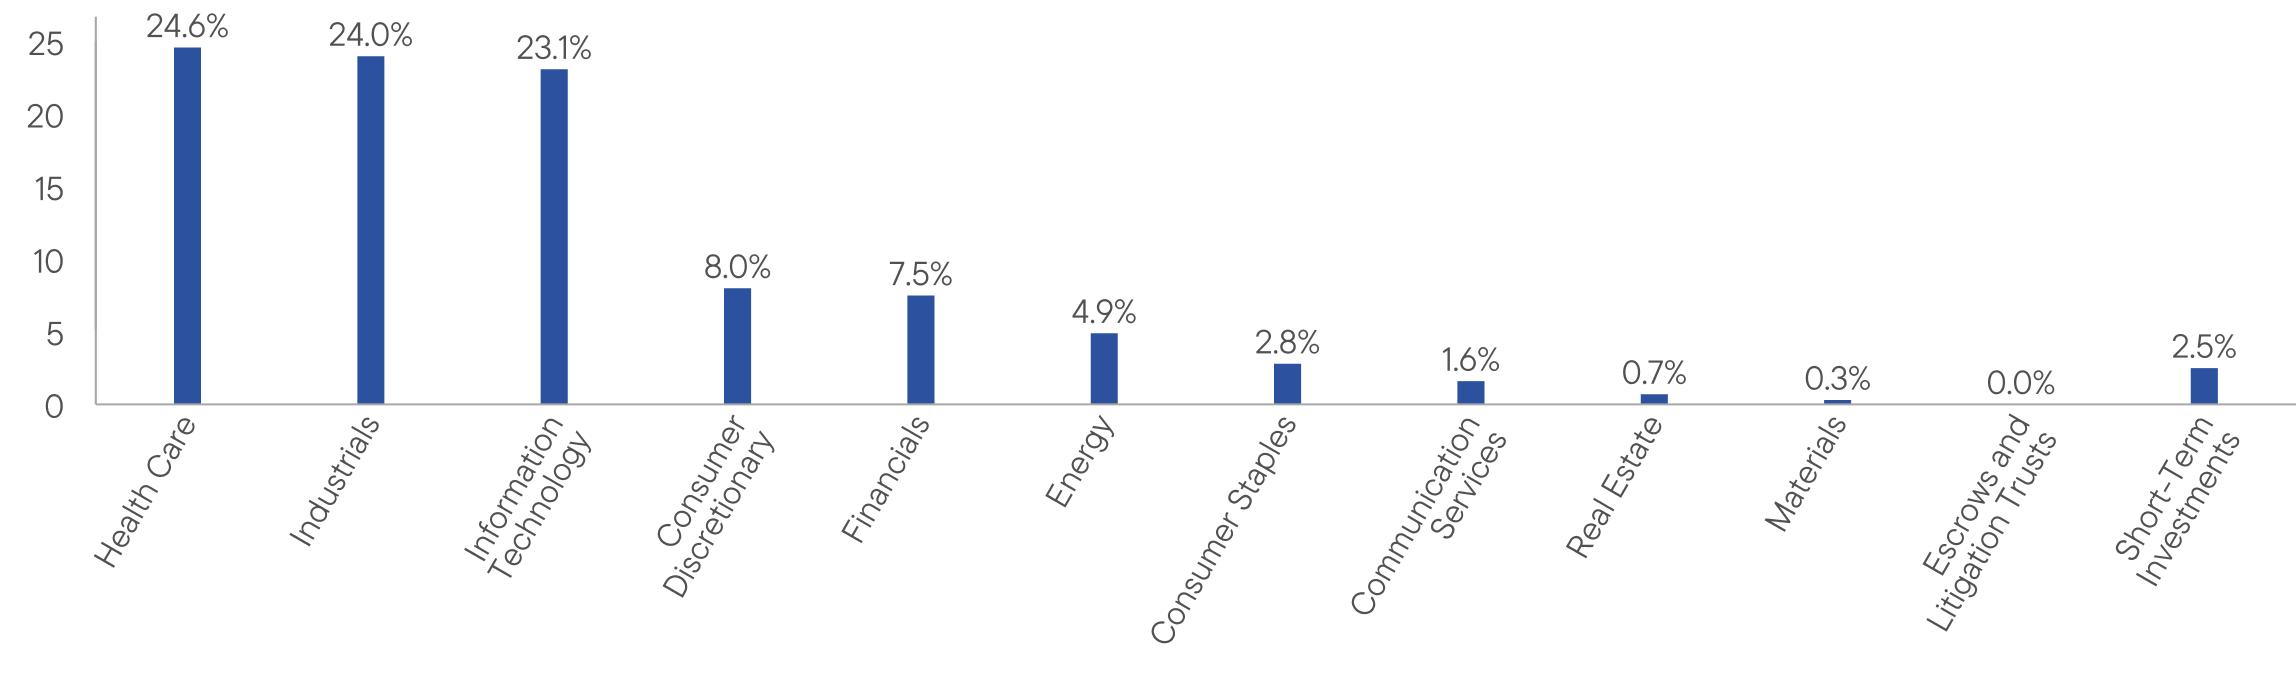
HOW HAS THE FUND CHANGED?
Effective December 31, 2025, Michael McCarthy no longer served as a portfolio manager of the Fund and Jacob Swartz was added as a portfolio manager of the Fund.
This is a summary of certain changes to the Fund since May 1, 2025. For more complete information, you may review the Fund’s current prospectus and any applicable supplements and the Fund’s next prospectus, which we expect to be available by September 1, 2026, at https://www.franklintempleton.com/regulatory-fund-documents or upon request at (800) DIAL BEN/342-5236 or
prospectus.us.franklintempleton@fisglobal.com.
prospectus.us.franklintempleton@fisglobal.com.
This report describes changes to the Fund that occurred during the reporting period.
WHAT WERE THE FUND COSTS FOR THE LAST YEAR? (based on a hypothetical $10,000 investment)
|
Class Name
|
Costs of a $10,000 investment
|
Costs paid as a percentage of a $10,000 investment*
|
|
Class A
|
$90
|
0.84%
|
HOW DID THE FUND PERFORM LAST YEAR AND WHAT AFFECTED ITS PERFORMANCE?
For the twelve months ended April 30, 2026, Class A shares of Franklin Small-Mid Cap Growth Fund returned 14.38%. The Fund compares its performance to the Russell Midcap Growth Index and the S&P 500 Index, which returned 12.86% and 31.05%, respectively, for the same period.
PERFORMANCE HIGHLIGHTS
|
Top contributors to performance:
|
|
|
↑
|
The Fund was helped most by stock selection in the information technology (IT) sector, where an off-benchmark holding in Arteris was a leading relative contributor. The company, which develops network-on-chip (NoC) technology, has been a beneficiary of the artificial intelligence (AI) chip boom, and has seen strong adoption of its Smart NoC product.
|
|
↑
|
Also in IT, Lattice Semiconductor lifted relative returns. The chipmaker reported solid fourth-quarter 2025 financial results and issued strong forward guidance, highlighting accelerating growth in AI and data-center applications.
|
|
↑
|
In the industrials sector, nuclear power components supplier BWX Technologies was a contributor. Shares in the company traded higher on the back of strong operational momentum and major national security contracts.
|
|
Top detractors from performance:
|
|
|
↓
|
Stock selection in the industrials sector weighed on relative returns over the period. Within the sector, data analytics and risk assessment firm, Verisk, was a leading detractor as investors worried that generative AI tools could weaken traditional data and analytics businesses.
|
|
↓
|
In financials, alternative asset manager Blue Owl Capital hampered relative returns. The company put a cap on withdrawals after investors tried to pull over $5 billion from two key funds, amid concerns about unregulated private lending markets.
|
|
↓
|
In the consumer staples sector, an off-benchmark holding in BellRing Brands was the leading detractor. The nutrition products company reported shrinking profit margins and decreasing demand for its protein shakes. Retailer inventory adjustments and reduced full year 2025 guidance were also headwinds for the company.
|
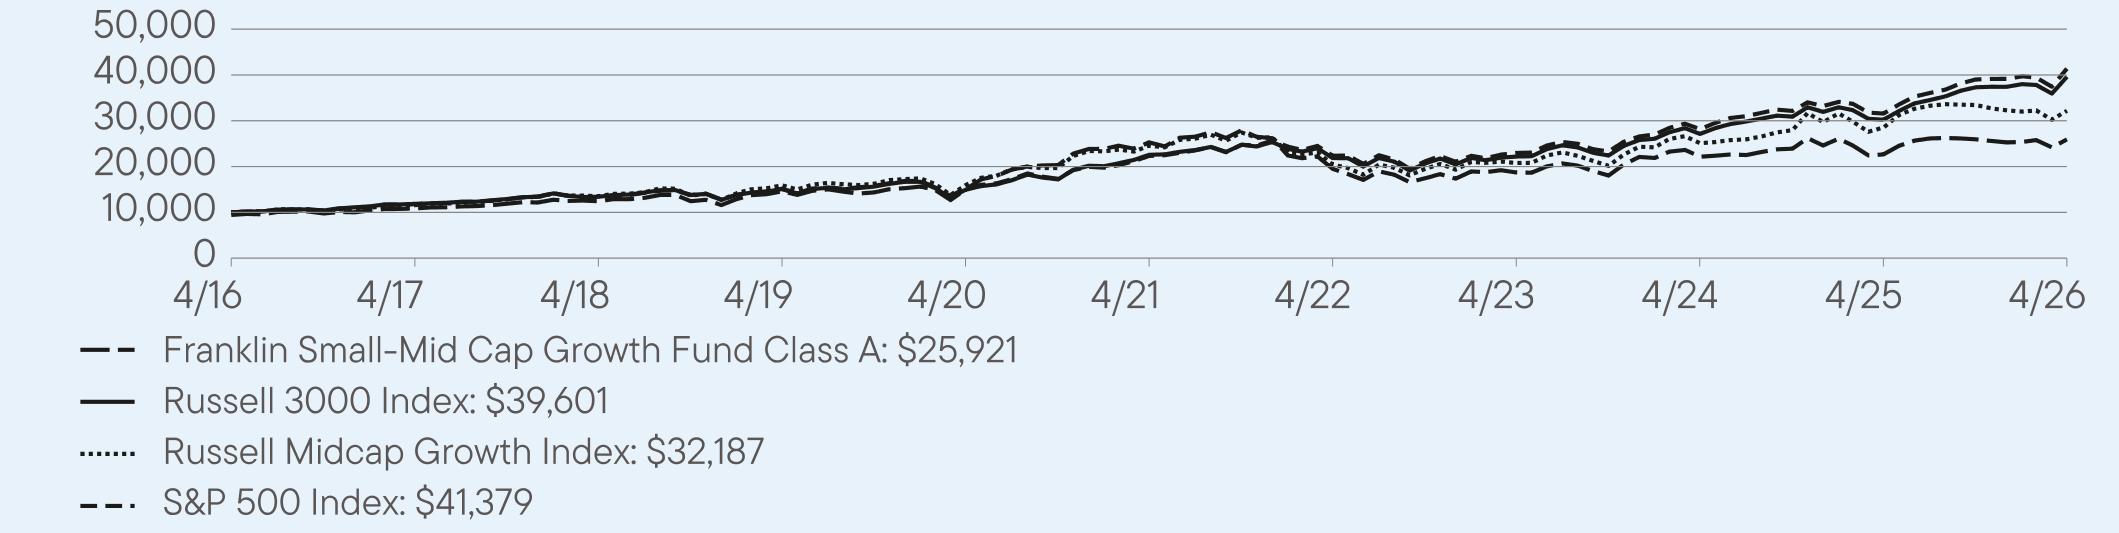
AVERAGE ANNUAL TOTAL RETURNS (%) Period Ended April 30, 2026
|
|
1 Year
|
5 Year
|
10 Year
|
|
Class A
|
14.38
|
0.50
|
10.62
|
|
Class A (with sales charge)
|
8.08
|
-0.63
|
9.99
|
|
Russell 3000 Index
|
31.01
|
11.91
|
14.76
|
|
Russell Midcap Growth Index
|
12.86
|
5.54
|
12.40
|
|
S&P 500 Index
|
31.05
|
13.14
|
15.26
|
For current month-end performance, please call Franklin Templeton at (800) DIAL BEN/342-5236 or visit
https://www.franklintempleton.com/investments/options/mutual-funds.
https://www.franklintempleton.com/investments/options/mutual-funds.
Important data provider notices and terms available at www.franklintempletondatasources.com.
KEY FUND STATISTICS (as of April 30, 2026)
|
Total Net Assets
|
$3,532,752,879
|
|
Total Number of Portfolio Holdings
|
87
|
|
Total Management Fee Paid
|
$16,900,774
|
|
Portfolio Turnover Rate
|
32.96%
|
WHAT DID THE FUND INVEST IN? (as of April 30, 2026)
Portfolio Composition* (% of Total Investments)

HOW HAS THE FUND CHANGED?
Effective December 31, 2025, Michael McCarthy no longer served as a portfolio manager of the Fund.
This is a summary of certain changes to the Fund since May 1, 2025. For more complete information, you may review the Fund’s current prospectus and any applicable supplements and the Fund’s next prospectus, which we expect to be available by September 1, 2026, at https://www.franklintempleton.com/regulatory-fund-documents or upon request at (800) DIAL BEN/342-5236 or prospectus.us.franklintempleton@fisglobal.com.
This report describes changes to the Fund that occurred during the reporting period.
WHAT WERE THE FUND COSTS FOR THE LAST YEAR? (based on a hypothetical $10,000 investment)
|
Class Name
|
Costs of a $10,000 investment
|
Costs paid as a percentage of a $10,000 investment*
|
|
Class C
|
$170
|
1.59%
|
HOW DID THE FUND PERFORM LAST YEAR AND WHAT AFFECTED ITS PERFORMANCE?
For the twelve months ended April 30, 2026, Class C shares of Franklin Small-Mid Cap Growth Fund returned 13.55%. The Fund compares its performance to the Russell Midcap Growth Index and the S&P 500 Index, which returned 12.86% and 31.05%, respectively, for the same period.
PERFORMANCE HIGHLIGHTS
|
Top contributors to performance:
|
|
|
↑
|
The Fund was helped most by stock selection in the information technology (IT) sector, where an off-benchmark holding in Arteris was a leading relative contributor. The company, which develops network-on-chip (NoC) technology, has been a beneficiary of the artificial intelligence (AI) chip boom, and has seen strong adoption of its Smart NoC product.
|
|
↑
|
Also in IT, Lattice Semiconductor lifted relative returns. The chipmaker reported solid fourth-quarter 2025 financial results and issued strong forward guidance, highlighting accelerating growth in AI and data-center applications.
|
|
↑
|
In the industrials sector, nuclear power components supplier BWX Technologies was a contributor. Shares in the company traded higher on the back of strong operational momentum and major national security contracts.
|
|
Top detractors from performance:
|
|
|
↓
|
Stock selection in the industrials sector weighed on relative returns over the period. Within the sector, data analytics and risk assessment firm, Verisk, was a leading detractor as investors worried that generative AI tools could weaken traditional data and analytics businesses.
|
|
↓
|
In financials, alternative asset manager Blue Owl Capital hampered relative returns. The company put a cap on withdrawals after investors tried to pull over $5 billion from two key funds, amid concerns about unregulated private lending markets.
|
|
↓
|
In the consumer staples sector, an off-benchmark holding in BellRing Brands was the leading detractor. The nutrition products company reported shrinking profit margins and decreasing demand for its protein shakes. Retailer inventory adjustments and reduced full year 2025 guidance were also headwinds for the company.
|
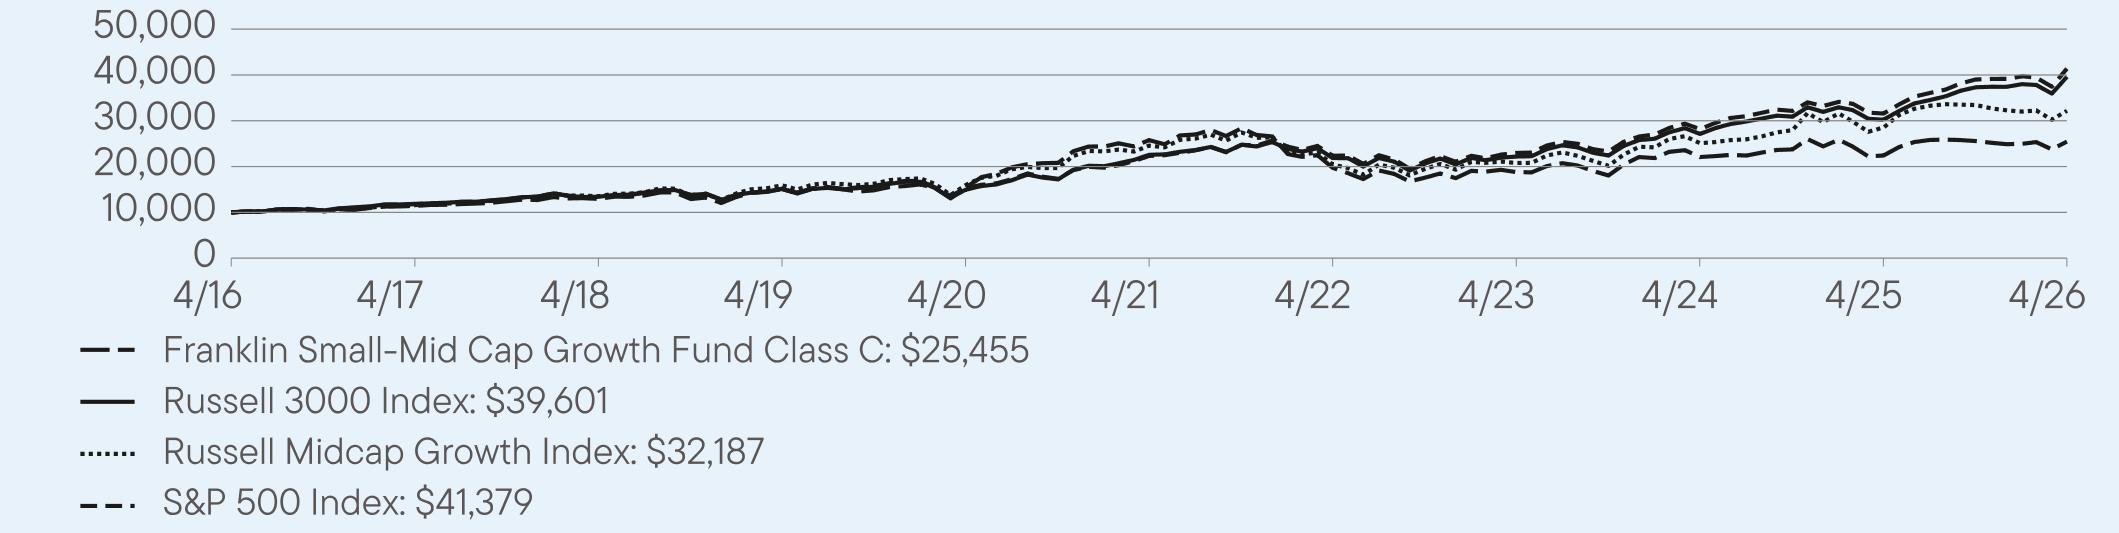
AVERAGE ANNUAL TOTAL RETURNS (%) Period Ended April 30, 2026
|
|
1 Year
|
5 Year
|
10 Year
|
|
Class C
|
13.55
|
-0.25
|
9.79
|
|
Class C (with sales charge)
|
12.60
|
-0.25
|
9.79
|
|
Russell 3000 Index
|
31.01
|
11.91
|
14.76
|
|
Russell Midcap Growth Index
|
12.86
|
5.54
|
12.40
|
|
S&P 500 Index
|
31.05
|
13.14
|
15.26
|
For current month-end performance, please call Franklin Templeton at (800) DIAL BEN/342-5236 or visit
https://www.franklintempleton.com/investments/options/mutual-funds.
https://www.franklintempleton.com/investments/options/mutual-funds.
Important data provider notices and terms available at www.franklintempletondatasources.com.
KEY FUND STATISTICS (as of April 30, 2026)
|
Total Net Assets
|
$3,532,752,879
|
|
Total Number of Portfolio Holdings
|
87
|
|
Total Management Fee Paid
|
$16,900,774
|
|
Portfolio Turnover Rate
|
32.96%
|
WHAT DID THE FUND INVEST IN? (as of April 30, 2026)
Portfolio Composition* (% of Total Investments)

HOW HAS THE FUND CHANGED?
Effective December 31, 2025, Michael McCarthy no longer served as a portfolio manager of the Fund.
This is a summary of certain changes to the Fund since May 1, 2025. For more complete information, you may review the Fund’s current prospectus and any applicable supplements and the Fund’s next prospectus, which we expect to be available by September 1, 2026, at https://www.franklintempleton.com/regulatory-fund-documents or upon request at (800) DIAL BEN/342-5236 or prospectus.us.franklintempleton@fisglobal.com.
This report describes changes to the Fund that occurred during the reporting period.
WHAT WERE THE FUND COSTS FOR THE LAST YEAR? (based on a hypothetical $10,000 investment)
|
Class Name
|
Costs of a $10,000 investment
|
Costs paid as a percentage of a $10,000 investment*
|
|
Class R
|
$117
|
1.09%
|
HOW DID THE FUND PERFORM LAST YEAR AND WHAT AFFECTED ITS PERFORMANCE?
For the twelve months ended April 30, 2026, Class R shares of Franklin Small-Mid Cap Growth Fund returned 14.07%. The Fund compares its performance to the Russell Midcap Growth Index and the S&P 500 Index, which returned 12.86% and 31.05%, respectively, for the same period.
PERFORMANCE HIGHLIGHTS
|
Top contributors to performance:
|
|
|
↑
|
The Fund was helped most by stock selection in the information technology (IT) sector, where an off-benchmark holding in Arteris was a leading relative contributor. The company, which develops network-on-chip (NoC) technology, has been a beneficiary of the artificial intelligence (AI) chip boom, and has seen strong adoption of its Smart NoC product.
|
|
↑
|
Also in IT, Lattice Semiconductor lifted relative returns. The chipmaker reported solid fourth-quarter 2025 financial results and issued strong forward guidance, highlighting accelerating growth in AI and data-center applications.
|
|
↑
|
In the industrials sector, nuclear power components supplier BWX Technologies was a contributor. Shares in the company traded higher on the back of strong operational momentum and major national security contracts.
|
|
Top detractors from performance:
|
|
|
↓
|
Stock selection in the industrials sector weighed on relative returns over the period. Within the sector, data analytics and risk assessment firm, Verisk, was a leading detractor as investors worried that generative AI tools could weaken traditional data and analytics businesses.
|
|
↓
|
In financials, alternative asset manager Blue Owl Capital hampered relative returns. The company put a cap on withdrawals after investors tried to pull over $5 billion from two key funds, amid concerns about unregulated private lending markets.
|
|
↓
|
In the consumer staples sector, an off-benchmark holding in BellRing Brands was the leading detractor. The nutrition products company reported shrinking profit margins and decreasing demand for its protein shakes. Retailer inventory adjustments and reduced full year 2025 guidance were also headwinds for the company.
|
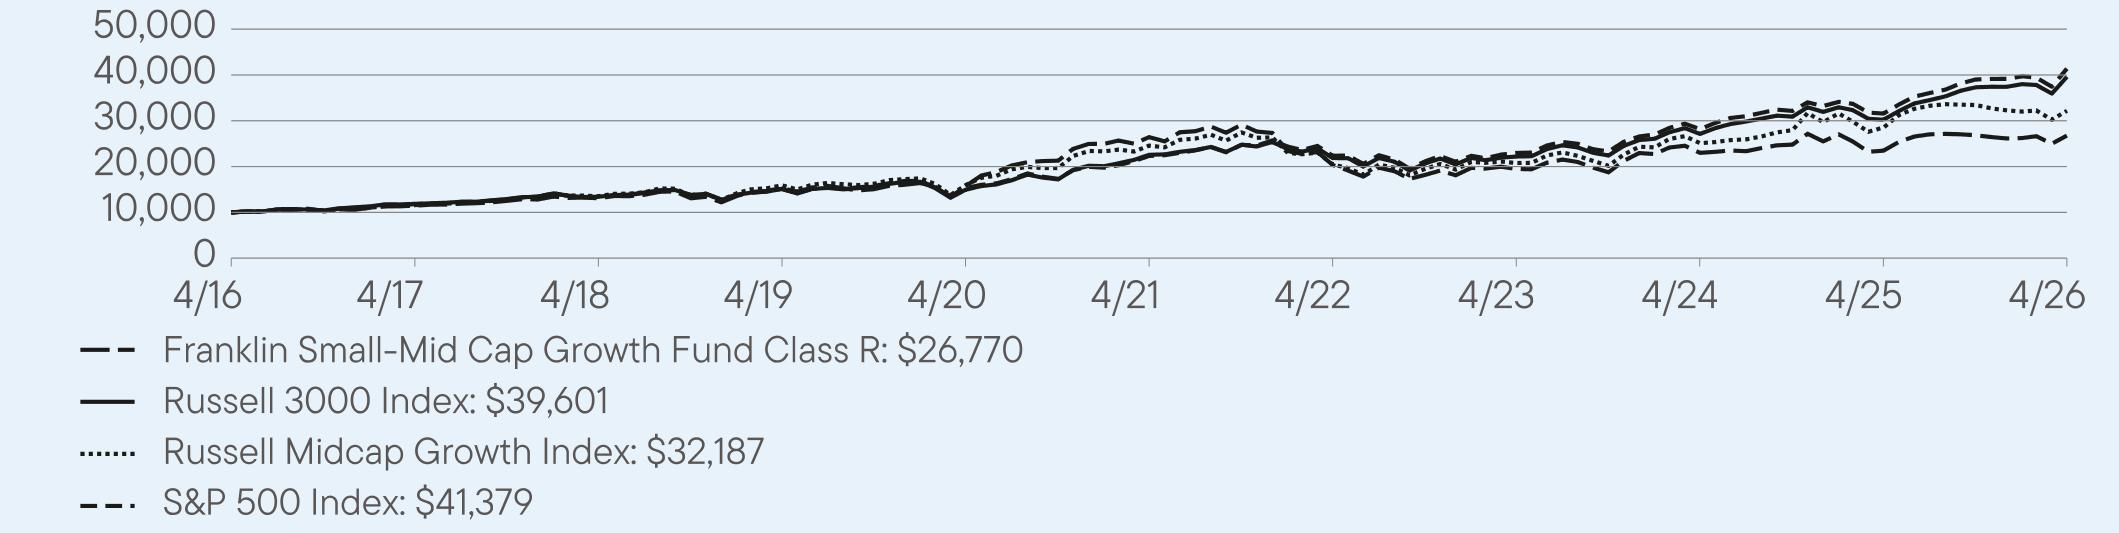
AVERAGE ANNUAL TOTAL RETURNS (%) Period Ended April 30, 2026
|
|
1 Year
|
5 Year
|
10 Year
|
|
Class R
|
14.07
|
0.26
|
10.35
|
|
Russell 3000 Index
|
31.01
|
11.91
|
14.76
|
|
Russell Midcap Growth Index
|
12.86
|
5.54
|
12.40
|
|
S&P 500 Index
|
31.05
|
13.14
|
15.26
|
For current month-end performance, please call Franklin Templeton at (800) DIAL BEN/342-5236 or visit
https://www.franklintempleton.com/investments/options/mutual-funds.
https://www.franklintempleton.com/investments/options/mutual-funds.
Important data provider notices and terms available at www.franklintempletondatasources.com.
KEY FUND STATISTICS (as of April 30, 2026)
|
Total Net Assets
|
$3,532,752,879
|
|
Total Number of Portfolio Holdings
|
87
|
|
Total Management Fee Paid
|
$16,900,774
|
|
Portfolio Turnover Rate
|
32.96%
|
WHAT DID THE FUND INVEST IN? (as of April 30, 2026)
Portfolio Composition* (% of Total Investments)

HOW HAS THE FUND CHANGED?
Effective December 31, 2025, Michael McCarthy no longer served as a portfolio manager of the Fund.
This is a summary of certain changes to the Fund since May 1, 2025. For more complete information, you may review the Fund’s current prospectus and any applicable supplements and the Fund’s next prospectus, which we expect to be available by September 1, 2026, at https://www.franklintempleton.com/regulatory-fund-documents or upon request at (800) DIAL BEN/342-5236 or prospectus.us.franklintempleton@fisglobal.com.
This report describes changes to the Fund that occurred during the reporting period.
WHAT WERE THE FUND COSTS FOR THE LAST YEAR? (based on a hypothetical $10,000 investment)
|
Class Name
|
Costs of a $10,000 investment
|
Costs paid as a percentage of a $10,000 investment*
|
|
Class R6
|
$54
|
0.50%
|
HOW DID THE FUND PERFORM LAST YEAR AND WHAT AFFECTED ITS PERFORMANCE?
For the twelve months ended April 30, 2026, Class R6 shares of Franklin Small-Mid Cap Growth Fund returned 14.79%. The Fund compares its performance to the Russell Midcap Growth Index and the S&P 500 Index, which returned 12.86% and 31.05%, respectively, for the same period.
PERFORMANCE HIGHLIGHTS
|
Top contributors to performance:
|
|
|
↑
|
The Fund was helped most by stock selection in the information technology (IT) sector, where an off-benchmark holding in Arteris was a leading relative contributor. The company, which develops network-on-chip (NoC) technology, has been a beneficiary of the artificial intelligence (AI) chip boom, and has seen strong adoption of its Smart NoC product.
|
|
↑
|
Also in IT, Lattice Semiconductor lifted relative returns. The chipmaker reported solid fourth-quarter 2025 financial results and issued strong forward guidance, highlighting accelerating growth in AI and data-center applications.
|
|
↑
|
In the industrials sector, nuclear power components supplier BWX Technologies was a contributor. Shares in the company traded higher on the back of strong operational momentum and major national security contracts.
|
|
Top detractors from performance:
|
|
|
↓
|
Stock selection in the industrials sector weighed on relative returns over the period. Within the sector, data analytics and risk assessment firm, Verisk, was a leading detractor as investors worried that generative AI tools could weaken traditional data and analytics businesses.
|
|
↓
|
In financials, alternative asset manager Blue Owl Capital hampered relative returns. The company put a cap on withdrawals after investors tried to pull over $5 billion from two key funds, amid concerns about unregulated private lending markets.
|
|
↓
|
In the consumer staples sector, an off-benchmark holding in BellRing Brands was the leading detractor. The nutrition products company reported shrinking profit margins and decreasing demand for its protein shakes. Retailer inventory adjustments and reduced full year 2025 guidance were also headwinds for the company.
|
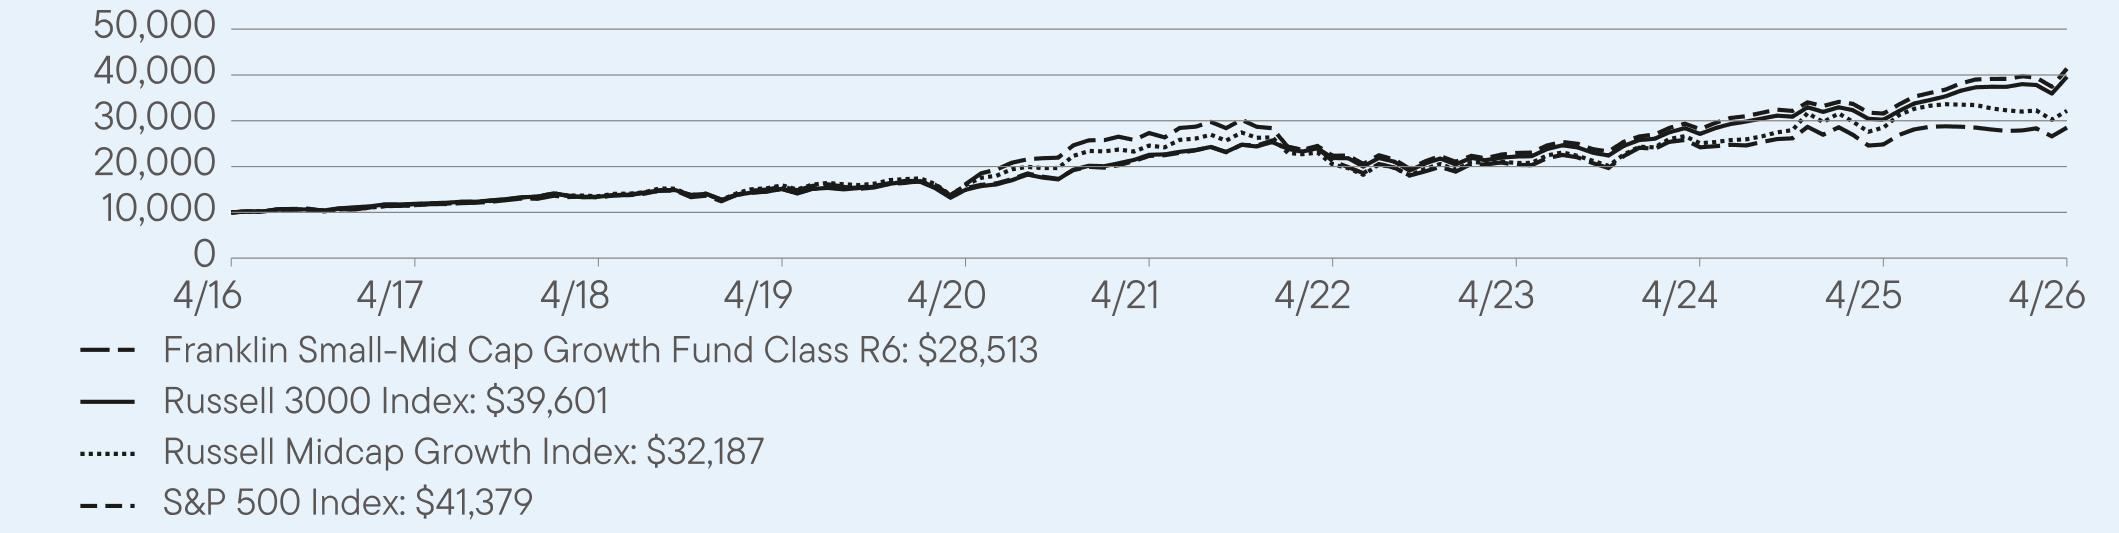
AVERAGE ANNUAL TOTAL RETURNS (%) Period Ended April 30, 2026
|
|
1 Year
|
5 Year
|
10 Year
|
|
Class R6
|
14.79
|
0.86
|
11.05
|
|
Russell 3000 Index
|
31.01
|
11.91
|
14.76
|
|
Russell Midcap Growth Index
|
12.86
|
5.54
|
12.40
|
|
S&P 500 Index
|
31.05
|
13.14
|
15.26
|
For current month-end performance, please call Franklin Templeton at (800) DIAL BEN/342-5236 or visit
https://www.franklintempleton.com/investments/options/mutual-funds.
https://www.franklintempleton.com/investments/options/mutual-funds.
Important data provider notices and terms available at www.franklintempletondatasources.com.
KEY FUND STATISTICS (as of April 30, 2026)
|
Total Net Assets
|
$3,532,752,879
|
|
Total Number of Portfolio Holdings
|
87
|
|
Total Management Fee Paid
|
$16,900,774
|
|
Portfolio Turnover Rate
|
32.96%
|
WHAT DID THE FUND INVEST IN? (as of April 30, 2026)
Portfolio Composition* (% of Total Investments)
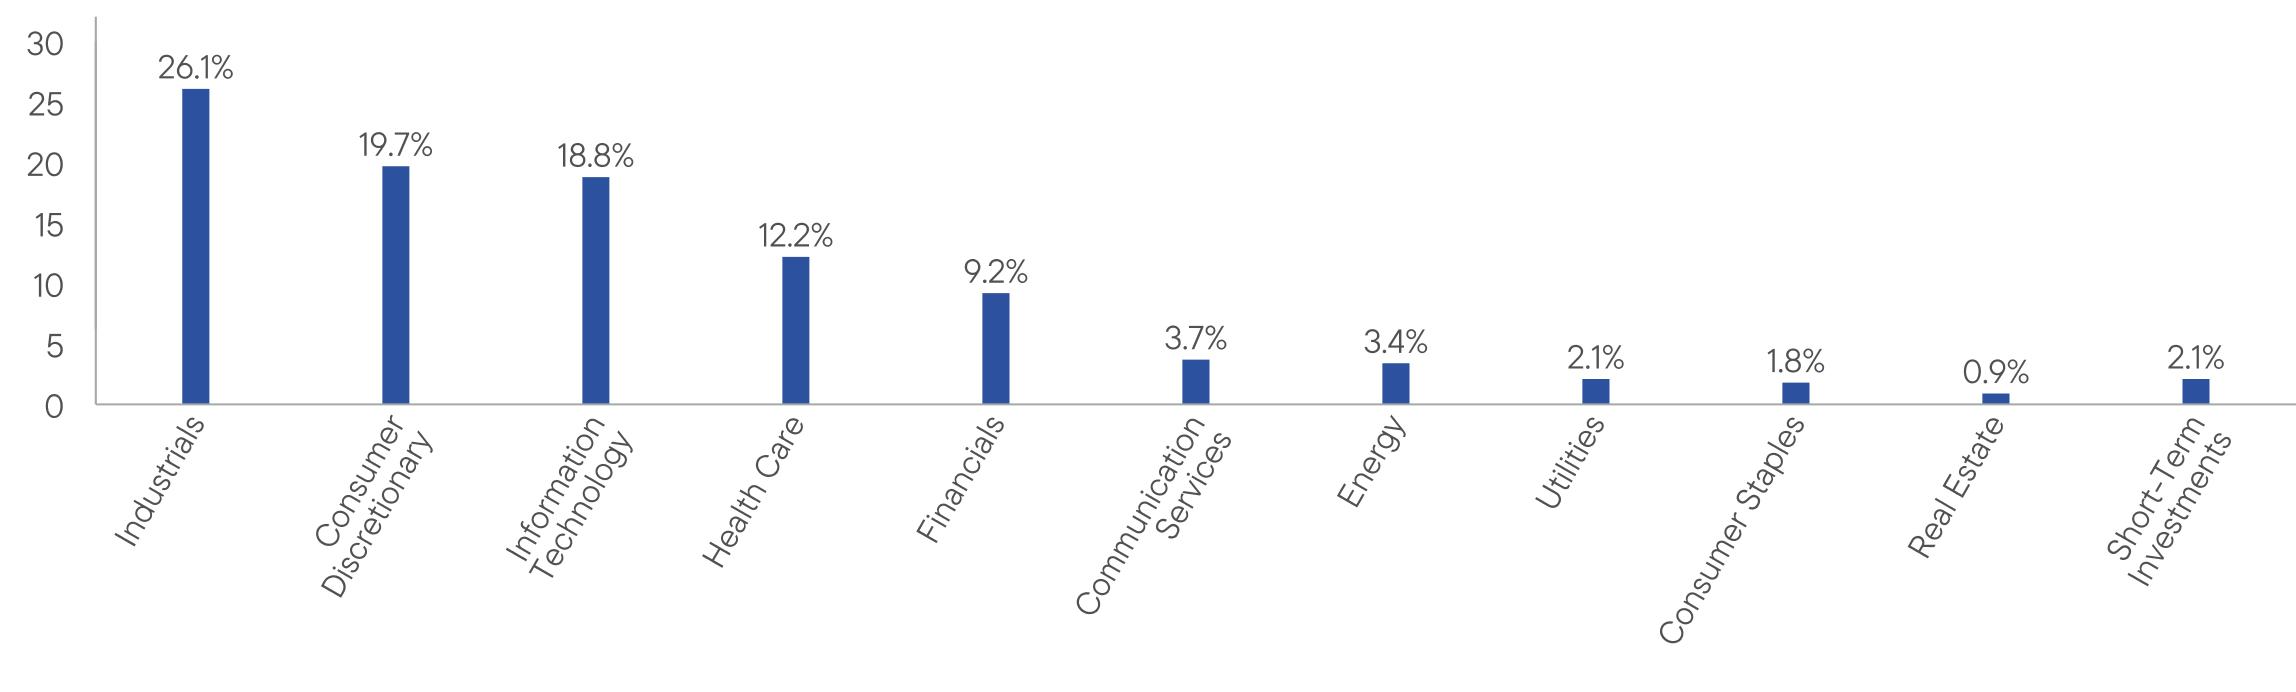
HOW HAS THE FUND CHANGED?
Effective December 31, 2025, Michael McCarthy no longer served as a portfolio manager of the Fund.
This is a summary of certain changes to the Fund since May 1, 2025. For more complete information, you may review the Fund’s current prospectus and any applicable supplements and the Fund’s next prospectus, which we expect to be available by September 1, 2026, at https://www.franklintempleton.com/regulatory-fund-documents or upon request at (800) DIAL BEN/342-5236 or prospectus.us.franklintempleton@fisglobal.com.
This report describes changes to the Fund that occurred during the reporting period.
WHAT WERE THE FUND COSTS FOR THE LAST YEAR? (based on a hypothetical $10,000 investment)
|
Class Name
|
Costs of a $10,000 investment
|
Costs paid as a percentage of a $10,000 investment*
|
|
Advisor Class
|
$63
|
0.59%
|
HOW DID THE FUND PERFORM LAST YEAR AND WHAT AFFECTED ITS PERFORMANCE?
For the twelve months ended April 30, 2026, Advisor Class shares of Franklin Small-Mid Cap Growth Fund returned 14.69%. The Fund compares its performance to the Russell Midcap Growth Index and the S&P 500 Index, which returned 12.86% and 31.05%, respectively, for the same period.
PERFORMANCE HIGHLIGHTS
|
Top contributors to performance:
|
|
|
↑
|
The Fund was helped most by stock selection in the information technology (IT) sector, where an off-benchmark holding in Arteris was a leading relative contributor. The company, which develops network-on-chip (NoC) technology, has been a beneficiary of the artificial intelligence (AI) chip boom, and has seen strong adoption of its Smart NoC product.
|
|
↑
|
Also in IT, Lattice Semiconductor lifted relative returns. The chipmaker reported solid fourth-quarter 2025 financial results and issued strong forward guidance, highlighting accelerating growth in AI and data-center applications.
|
|
↑
|
In the industrials sector, nuclear power components supplier BWX Technologies was a contributor. Shares in the company traded higher on the back of strong operational momentum and major national security contracts.
|
|
Top detractors from performance:
|
|
|
↓
|
Stock selection in the industrials sector weighed on relative returns over the period. Within the sector, data analytics and risk assessment firm, Verisk, was a leading detractor as investors worried that generative AI tools could weaken traditional data and analytics businesses.
|
|
↓
|
In financials, alternative asset manager Blue Owl Capital hampered relative returns. The company put a cap on withdrawals after investors tried to pull over $5 billion from two key funds, amid concerns about unregulated private lending markets.
|
|
↓
|
In the consumer staples sector, an off-benchmark holding in BellRing Brands was the leading detractor. The nutrition products company reported shrinking profit margins and decreasing demand for its protein shakes. Retailer inventory adjustments and reduced full year 2025 guidance were also headwinds for the company.
|
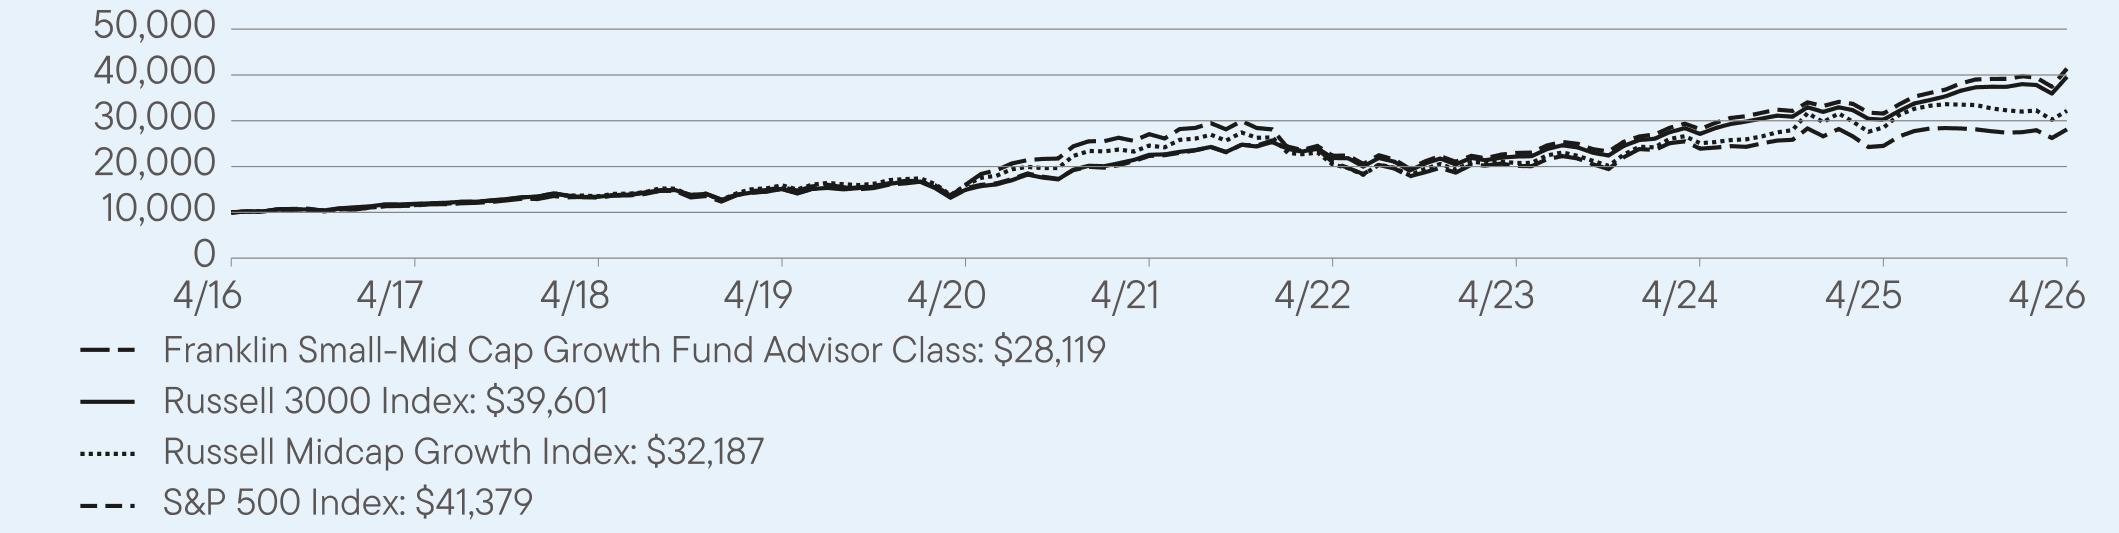
AVERAGE ANNUAL TOTAL RETURNS (%) Period Ended April 30, 2026
|
|
1 Year
|
5 Year
|
10 Year
|
|
Advisor Class
|
14.69
|
0.75
|
10.89
|
|
Russell 3000 Index
|
31.01
|
11.91
|
14.76
|
|
Russell Midcap Growth Index
|
12.86
|
5.54
|
12.40
|
|
S&P 500 Index
|
31.05
|
13.14
|
15.26
|
For current month-end performance, please call Franklin Templeton at (800) DIAL BEN/342-5236 or visit
https://www.franklintempleton.com/investments/options/mutual-funds.
https://www.franklintempleton.com/investments/options/mutual-funds.
Important data provider notices and terms available at www.franklintempletondatasources.com.
KEY FUND STATISTICS (as of April 30, 2026)
|
Total Net Assets
|
$3,532,752,879
|
|
Total Number of Portfolio Holdings
|
87
|
|
Total Management Fee Paid
|
$16,900,774
|
|
Portfolio Turnover Rate
|
32.96%
|
WHAT DID THE FUND INVEST IN? (as of April 30, 2026)
Portfolio Composition* (% of Total Investments)

HOW HAS THE FUND CHANGED?
Effective December 31, 2025, Michael McCarthy no longer served as a portfolio manager of the Fund.
This is a summary of certain changes to the Fund since May 1, 2025. For more complete information, you may review the Fund’s current prospectus and any applicable supplements and the Fund’s next prospectus, which we expect to be available by September 1, 2026, at https://www.franklintempleton.com/regulatory-fund-documents or upon request at (800) DIAL BEN/342-5236 or prospectus.us.franklintempleton@fisglobal.com.
| [1] |
|
||
| [2] |
|
||
| [3] |
|
||
| [4] |
|
||
| [5] |
|
||
| [6] |
|
||
| [7] |
|
||
| [8] |
|
||
| [9] |
|
||
| [10] |
|
||
| [11] |
|
||
| [12] |
|
||
| [13] |
|
||
| [14] |
|
||
| [15] |
|
||
| [16] |
|
||
| [17] |
|
||
| [18] |
|
||
| [19] |
|
||
| [20] |
|
||
| [21] |
|
||
| [22] |
|
||
| [23] |
|
||
| [24] |
|
||
| [25] |
|
||
| [26] |
|
||
| [27] |
|
||
| [28] |
|
||
| [29] |
|
||
| [30] |
|
||
| [31] |
|
||
| [32] |
|
||
| [33] |
|
||
| [34] |
|
||
| [35] |
|
||
| [36] |
|
||
| [37] |
|
||
| [38] |
|
||
| [39] |
|
||
| [40] |
|
||
| [41] |
|
||
| [42] |
|
||
| [43] |
|
||
| [44] |
|
||
| [45] |
|
||
| [46] |
|
||
| [47] |
|
||
| [48] |
|
||
| [49] |
|
||
| [50] |
|
||
| [51] |
|
||
| [52] |
|
||
| [53] |
|
||
| [54] |
|
||
| [55] |
|
||
| [56] |
|
||
| [57] |
|
||
| [58] |
|
||
| [59] |
|
||
| [60] |
|
||
| [61] |
|
||
| [62] |
|
||
| [63] |
|
||
| [64] |
|
||
| [65] |
|
||
| [66] |
|
||
| [67] |
|
||
| [68] |
|
||
| [69] |
|
||
| [70] |
|
||
| [71] |
|