The bar chart and Average Annual Total Returns table gives some indication of the risks of investing in the Fund. The bar chart shows the performance of the Fund for the calendar year since the Fund’s inception. The Average Annual Total Returns table shows how the Fund’s average annual returns compare with those of a broad measure of market performance. Remember, the Fund’s past performance, before and after taxes, is not necessarily an indication of how the Fund will perform in the future. Updated performance information will be available at no cost at www.PeakSharesFunds.com or by calling 877-57-PEAKS.
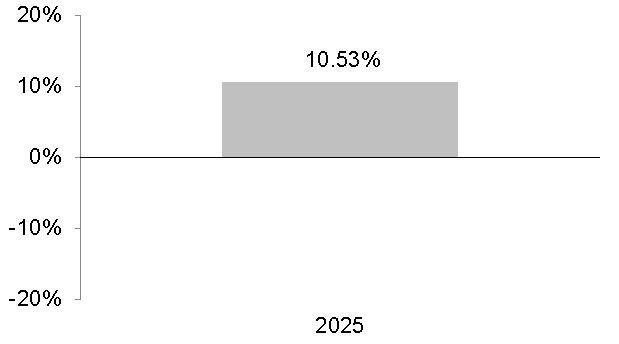
The year to date performance of the Fund through the most recent quarter ended March 31, 2026 is 10.12%.
During the period shown in the bar chart, the Fund’s highest quarterly return was 4.31% (for the quarter ended September 30, 2025), and the lowest quarterly return was (1.28)% (for the quarter ended March 31, 2025).
| One Year | Since Inception* | |
| Return Before Taxes | 10.53% | 13.38% |
| Return After Taxes on Distributions | 8.26% | 11.56% |
| Return After Taxes on Distributions and Sale of Fund Shares | 6.16% | 9.48% |
| S&P 500 ® Index | 17.88% | 20.58% |
| ICE BofA 3-Month U.S. Treasury Bill Index | 4.21% | 4.62% |
| * | The Fund commenced operations on April 29, 2024. |
After-tax returns are based on the highest historical individual federal marginal income tax rates, and do not reflect the impact of state and local taxes; actual after-tax returns depend on an individual investor’s tax situation and may differ from those shown. If you own shares of the Fund in a tax-deferred account, such as an individual retirement account or a 401(k) plan, this information is not applicable to your investment. A higher after-tax return results when a capital loss occurs upon redemption and translates into an assumed tax deduction that benefits the shareholder.
The S&P 500® is a widely accepted, unmanaged index of U.S. stock market performance, is the Fund’s regulatory index. The Fund’s regulatory index is shown in connection with certain regulatory requirements to provide a broad measure of market performance. The index does not take into account charges, fees and other expenses.
ICE BofA 3-Month U.S. Treasury Bill Index is a rules-based index that seeks to measure the performance of a rolling position in U.S. Treasury bills with a remaining maturity of approximately three months. The index is composed of the most recently issued (“on-the-run”) U.S. Treasury bill that matures closest to, but does not exceed, three months and is rebalanced on a monthly basis by replacing the existing security with a newly selected eligible Treasury bill.