Shareholder Report
|
12 Months Ended |
|
Apr. 30, 2026
USD ($)
Holding
|
|---|
| Shareholder Report [Line Items] |
|
| Document Type |
N-CSR
|
| Amendment Flag |
false
|
| Registrant Name |
Federated Hermes Income Securities Trust
|
| Entity Central Index Key |
0000789281
|
| Entity Investment Company Type |
N-1A
|
| Document Period End Date |
Apr. 30, 2026
|
| Shareholder Report Annual or Semi-Annual |
Annual Shareholder Report
|
| C000251008 |
|
| Shareholder Report [Line Items] |
|
| Fund Name |
Federated Hermes Intermediate Corporate
Bond Fund
|
| Class Name |
Class R6 Shares
|
| Trading Symbol |
ICBRX
|
| Annual or Semi-Annual Statement [Text Block] |
This annual shareholder report contains important information about the Federated Hermes Intermediate Corporate Bond Fund (the "Fund") for the period of May 1, 2025 to April 30, 2026.
|
| Additional Information [Text Block] |
You can find additional information at FederatedHermes.com/us/FundInformation. You can also request this information by contacting us at 1-800-341-7400, Option 4, or your financial advisor.
|
| Additional Information Phone Number |
1-800-341-7400
|
| Additional Information Website |
FederatedHermes.com/us/FundInformation
|
| Expenses [Text Block] |
What were the Fund costs for the last year? (based on a hypothetical $10,000 investment) Table SummaryClass Name | Costs of a $10,000 investment | Costs paid as a percentage of a $10,000 investment |
|---|
Class R6 Shares | $46 | 0.45% |
|---|
|
| Expenses Paid, Amount |
$ 46
|
| Expense Ratio, Percent |
0.45%
|
| Factors Affecting Performance [Text Block] |
Management's Discussion of Fund PerformanceThe following discussion compares the performance of the Fund to the Bloomberg US Intermediate Credit Index (the “Index”) to show how the Fund’s performance compares to the returns of similar investments for the reporting period. See the Average Annual Total Returns table below for the returns of the Fund and related indexes including the Bloomberg US Aggregate Bond Index, a required broad-based index which represents the overall U.S. fixed-income market. The Fund seeks to provide current income by investing in a diversified portfolio of investment-grade, fixed-income securities. Top Contributors to Performance Sector positioning in the Fund made the most positive contribution to relative performance. Underweight positioning relative to the Index in non-corporate credit sectors such as Supranational, Government Guarantee and Local Authority added to performance. These sectors underperformed the broader Index. The corporate credit sector positioning that added the most was Energy. Individual security selection in the Fund relative to the Index resulted in outperformance. Security selection was the second largest driver of positive Fund performance relative to the Index during the period. Individual holdings with the highest positive contribution to relative Fund performance were Inter-American Development Bank, Ovintiv, Morgan Stanley and Piedmont Realty Trust.
Top Detractors from Performance Overweight allocations to the defensive Consumer Non-Cyclical and Media & Entertainment sectors detracted from sector performance. Individual holdings with the most negative contribution to relative Fund performance were U.S. Treasury securities, Penske Truck Leasing and Roper Technologies. The use of derivatives, primarily U.S. Treasury futures to adjust duration and yield curve positioning, was a detractor to relative Fund performance.
|
| Performance Past Does Not Indicate Future [Text] |
Keep in mind that the Fund’s past performance is not a predictor of how the Fund will perform in the future.
|
| No Deduction of Taxes [Text Block] |
The graph and table do not reflect the deduction of taxes that a shareholder would pay on fund distributions or redemption of fund shares.
|
| Updated Performance Information Location [Text Block] |
FederatedHermes.com/us/FundInformation
|
| AssetsNet |
$ 459,187,938
|
| Holdings Count | Holding |
543
|
| Advisory Fees Paid, Amount |
$ 1,185,854
|
| InvestmentCompanyPortfolioTurnover |
27.00%
|
| Additional Fund Statistics [Text Block] |
- Net Assets$459,187,938
- Number of Investments543
- Portfolio Turnover27%
- Total Advisory Fees Paid$1,185,854
|
| Holdings [Text Block] |
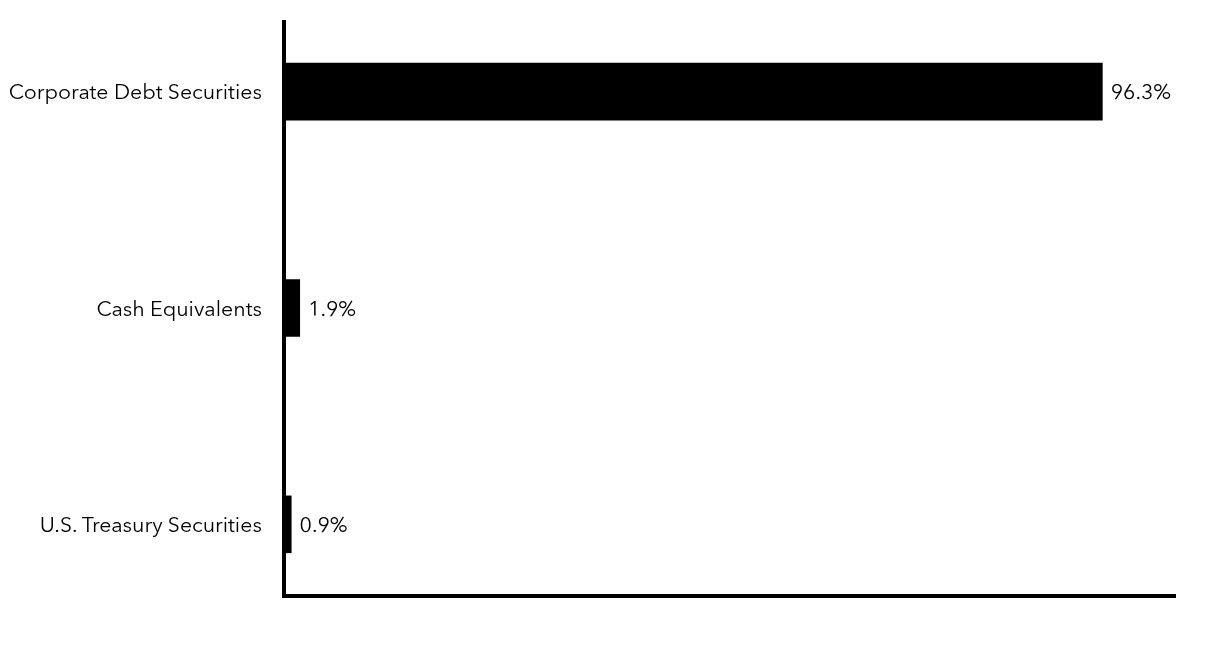
Top Security Types (% of Net Assets)Table SummaryValue | Value |
|---|
U.S. Treasury Securities | 0.9% | Cash Equivalents | 1.9% | Corporate Debt Securities | 96.3% | |
| Material Fund Change [Text Block] |
|
| C000024655 |
|
| Shareholder Report [Line Items] |
|
| Fund Name |
Federated Hermes Intermediate Corporate
Bond Fund
|
| Class Name |
Institutional Shares
|
| Trading Symbol |
FIIFX
|
| Annual or Semi-Annual Statement [Text Block] |
This annual shareholder report contains important information about the Federated Hermes Intermediate Corporate Bond Fund (the "Fund") for the period of May 1, 2025 to April 30, 2026.
|
| Additional Information [Text Block] |
You can find additional information at FederatedHermes.com/us/FundInformation. You can also request this information by contacting us at 1-800-341-7400, Option 4, or your financial advisor.
|
| Additional Information Phone Number |
1-800-341-7400
|
| Additional Information Website |
FederatedHermes.com/us/FundInformation
|
| Expenses [Text Block] |
What were the Fund costs for the last year? (based on a hypothetical $10,000 investment) Table SummaryClass Name | Costs of a $10,000 investment | Costs paid as a percentage of a $10,000 investment |
|---|
Institutional Shares | $52 | 0.51% |
|---|
|
| Expenses Paid, Amount |
$ 52
|
| Expense Ratio, Percent |
0.51%
|
| Factors Affecting Performance [Text Block] |
Management's Discussion of Fund PerformanceThe following discussion compares the performance of the Fund to the Bloomberg US Intermediate Credit Index (the “Index”) to show how the Fund’s performance compares to the returns of similar investments for the reporting period. See the Average Annual Total Returns table below for the returns of the Fund and related indexes including the Bloomberg US Aggregate Bond Index, a required broad-based index which represents the overall U.S. fixed-income market. The Fund seeks to provide current income by investing in a diversified portfolio of investment-grade, fixed-income securities. Top Contributors to Performance Sector positioning in the Fund made the most positive contribution to relative performance. Underweight positioning relative to the Index in non-corporate credit sectors such as Supranational, Government Guarantee and Local Authority added to performance. These sectors underperformed the broader Index. The corporate credit sector positioning that added the most was Energy. Individual security selection in the Fund relative to the Index resulted in outperformance. Security selection was the second largest driver of positive Fund performance relative to the Index during the period. Individual holdings with the highest positive contribution to relative Fund performance were Inter-American Development Bank, Ovintiv, Morgan Stanley and Piedmont Realty Trust.
Top Detractors from Performance Overweight allocations to the defensive Consumer Non-Cyclical and Media & Entertainment sectors detracted from sector performance. Individual holdings with the most negative contribution to relative Fund performance were U.S. Treasury securities, Penske Truck Leasing and Roper Technologies. The use of derivatives, primarily U.S. Treasury futures to adjust duration and yield curve positioning, was a detractor to relative Fund performance.
|
| Performance Past Does Not Indicate Future [Text] |
Keep in mind that the Fund’s past performance is not a predictor of how the Fund will perform in the future.
|
| No Deduction of Taxes [Text Block] |
The graph and table do not reflect the deduction of taxes that a shareholder would pay on fund distributions or redemption of fund shares.
|
| Updated Performance Information Location [Text Block] |
FederatedHermes.com/us/FundInformation
|
| AssetsNet |
$ 459,187,938
|
| Holdings Count | Holding |
543
|
| Advisory Fees Paid, Amount |
$ 1,185,854
|
| InvestmentCompanyPortfolioTurnover |
27.00%
|
| Additional Fund Statistics [Text Block] |
- Net Assets$459,187,938
- Number of Investments543
- Portfolio Turnover27%
- Total Advisory Fees Paid$1,185,854
|
| Holdings [Text Block] |
Top Security Types (% of Net Assets)Table SummaryValue | Value |
|---|
U.S. Treasury Securities | 0.9% | Cash Equivalents | 1.9% | Corporate Debt Securities | 96.3% | |
| Material Fund Change [Text Block] |
|
| C000024656 |
|
| Shareholder Report [Line Items] |
|
| Fund Name |
Federated Hermes Intermediate Corporate
Bond Fund
|
| Class Name |
Service Shares
|
| Trading Symbol |
INISX
|
| Annual or Semi-Annual Statement [Text Block] |
This annual shareholder report contains important information about the Federated Hermes Intermediate Corporate Bond Fund (the "Fund") for the period of May 1, 2025 to April 30, 2026.
|
| Additional Information [Text Block] |
You can find additional information at FederatedHermes.com/us/FundInformation. You can also request this information by contacting us at 1-800-341-7400, Option 4, or your financial advisor.
|
| Additional Information Phone Number |
1-800-341-7400
|
| Additional Information Website |
FederatedHermes.com/us/FundInformation
|
| Expenses [Text Block] |
What were the Fund costs for the last year? (based on a hypothetical $10,000 investment) Table SummaryClass Name | Costs of a $10,000 investment | Costs paid as a percentage of a $10,000 investment |
|---|
Service Shares | $78 | 0.76% |
|---|
|
| Expenses Paid, Amount |
$ 78
|
| Expense Ratio, Percent |
0.76%
|
| Factors Affecting Performance [Text Block] |
Management's Discussion of Fund PerformanceThe following discussion compares the performance of the Fund to the Bloomberg US Intermediate Credit Index (the “Index”) to show how the Fund’s performance compares to the returns of similar investments for the reporting period. See the Average Annual Total Returns table below for the returns of the Fund and related indexes including the Bloomberg US Aggregate Bond Index, a required broad-based index which represents the overall U.S. fixed-income market. The Fund seeks to provide current income by investing in a diversified portfolio of investment-grade, fixed-income securities. Top Contributors to Performance Sector positioning in the Fund made the most positive contribution to relative performance. Underweight positioning relative to the Index in non-corporate credit sectors such as Supranational, Government Guarantee and Local Authority added to performance. These sectors underperformed the broader Index. The corporate credit sector positioning that added the most was Energy. Individual security selection in the Fund relative to the Index resulted in outperformance. Security selection was the second largest driver of positive Fund performance relative to the Index during the period. Individual holdings with the highest positive contribution to relative Fund performance were Inter-American Development Bank, Ovintiv, Morgan Stanley and Piedmont Realty Trust.
Top Detractors from Performance Overweight allocations to the defensive Consumer Non-Cyclical and Media & Entertainment sectors detracted from sector performance. Individual holdings with the most negative contribution to relative Fund performance were U.S. Treasury securities, Penske Truck Leasing and Roper Technologies. The use of derivatives, primarily U.S. Treasury futures to adjust duration and yield curve positioning, was a detractor to relative Fund performance.
|
| Performance Past Does Not Indicate Future [Text] |
Keep in mind that the Fund’s past performance is not a predictor of how the Fund will perform in the future.
|
| No Deduction of Taxes [Text Block] |
The graph and table do not reflect the deduction of taxes that a shareholder would pay on fund distributions or redemption of fund shares.
|
| Updated Performance Information Location [Text Block] |
FederatedHermes.com/us/FundInformation
|
| AssetsNet |
$ 459,187,938
|
| Holdings Count | Holding |
543
|
| Advisory Fees Paid, Amount |
$ 1,185,854
|
| InvestmentCompanyPortfolioTurnover |
27.00%
|
| Additional Fund Statistics [Text Block] |
- Net Assets$459,187,938
- Number of Investments543
- Portfolio Turnover27%
- Total Advisory Fees Paid$1,185,854
|
| Holdings [Text Block] |
Top Security Types (% of Net Assets)Table SummaryValue | Value |
|---|
U.S. Treasury Securities | 0.9% | Cash Equivalents | 1.9% | Corporate Debt Securities | 96.3% | |
| Material Fund Change [Text Block] |
|
| C000024660 |
|
| Shareholder Report [Line Items] |
|
| Fund Name |
Federated Hermes Short-Term Income Fund
|
| Class Name |
Class A Shares
|
| Trading Symbol |
FTIAX
|
| Annual or Semi-Annual Statement [Text Block] |
This annual shareholder report contains important information about the Federated Hermes Short-Term Income Fund (the "Fund") for the period of May 1, 2025 to April 30, 2026.
|
| Additional Information [Text Block] |
You can find additional information at FederatedHermes.com/us/FundInformation. You can also request this information by contacting us at 1-800-341-7400, Option 4, or your financial advisor.
|
| Additional Information Phone Number |
1-800-341-7400
|
| Additional Information Website |
FederatedHermes.com/us/FundInformation
|
| Expenses [Text Block] |
What were the Fund costs for the last year? (based on a hypothetical $10,000 investment) Table SummaryClass Name | Costs of a $10,000 investment | Costs paid as a percentage of a $10,000 investment |
|---|
Class A Shares | $64 | 0.63% |
|---|
|
| Expenses Paid, Amount |
$ 64
|
| Expense Ratio, Percent |
0.63%
|
| Factors Affecting Performance [Text Block] |
Management's Discussion of Fund PerformanceThe following discussion compares the performance of the Fund to the Bloomberg 1-3 Year US Government/Credit Index (the “Index”) to show how the Fund’s performance compares to the returns of similar investments for the reporting period. See the Average Annual Total Returns table below for the returns of the Fund and related indexes including the Bloomberg US Aggregate Bond Index, a required broad-based index which represents the overall U.S. fixed-income market. The Fund seeks to provide current income by investing primarily in a diversified portfolio of short- and medium-term debt securities. Top Contributors to Performance Sector allocation added 124 basis points of excess returns primarily from asset-backed securities and to a lesser extent from high yield, commercial mortgage-backed and mortgage-backed securities which outperformed U.S. Treasury securities during the last fiscal year. Security selection, primarily from investment-grade corporate securities, added 34 basis points of excess returns during the last fiscal year. Yield curve management added two basis points to relative Fund performance due to the movement of the yield curve along the short end of the curve.
Top Detractors from Performance Duration management detracted six basis points from relative Fund performance as the Fund’s duration was positioned longer than the Index in a period of increasing interest rates during the reporting period.
|
| Performance Past Does Not Indicate Future [Text] |
Keep in mind that the Fund’s past performance is not a predictor of how the Fund will perform in the future.
|
| No Deduction of Taxes [Text Block] |
The graph and table do not reflect the deduction of taxes that a shareholder would pay on fund distributions or redemption of fund shares.
|
| Updated Performance Information Location [Text Block] |
FederatedHermes.com/us/FundInformation
|
| AssetsNet |
$ 1,850,235,697
|
| Holdings Count | Holding |
523
|
| Advisory Fees Paid, Amount |
$ 3,582,778
|
| InvestmentCompanyPortfolioTurnover |
17.00%
|
| Additional Fund Statistics [Text Block] |
- Net Assets$1,850,235,697
- Number of Investments523
- Portfolio Turnover17%
- Total Advisory Fees Paid$3,582,778
|
| Holdings [Text Block] |
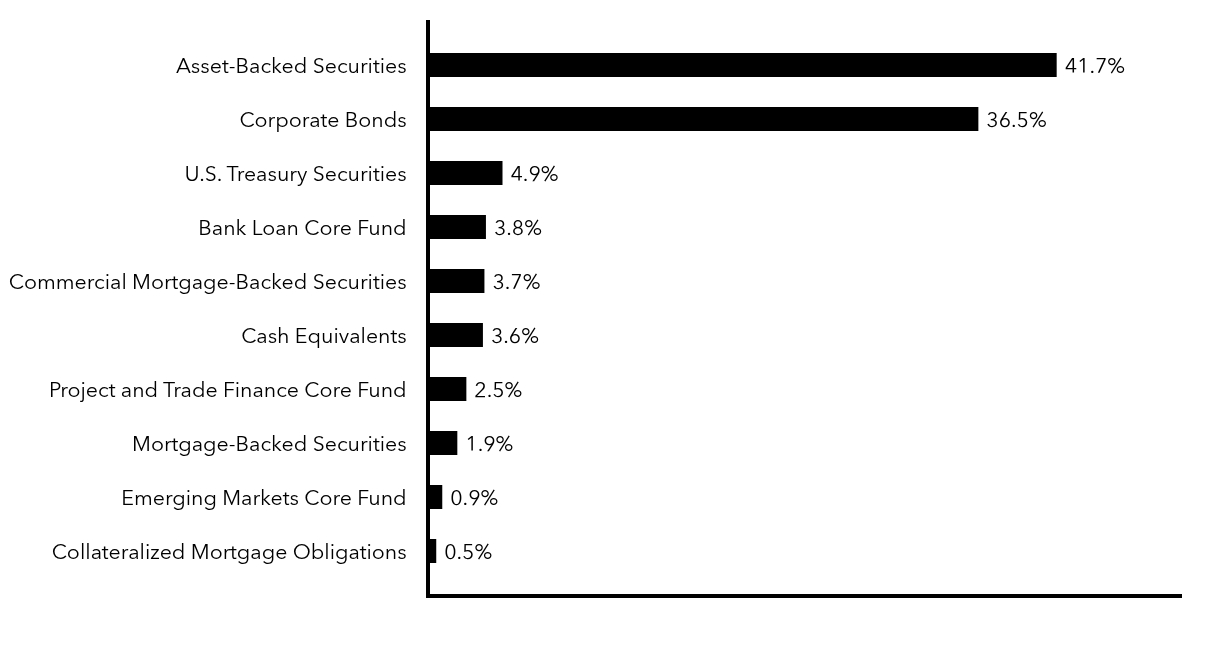
Top Security Types (% of Net Assets)Table SummaryValue | Value |
|---|
Collateralized Mortgage Obligations | 0.5% | Emerging Markets Core Fund | 0.9% | Mortgage-Backed Securities | 1.9% | Project and Trade Finance Core Fund | 2.5% | Cash Equivalents | 3.6% | Commercial Mortgage-Backed Securities | 3.7% | Bank Loan Core Fund | 3.8% | U.S. Treasury Securities | 4.9% | Corporate Bonds | 36.5% | Asset-Backed Securities | 41.7% | |
| Material Fund Change [Text Block] |
|
| C000024661 |
|
| Shareholder Report [Line Items] |
|
| Fund Name |
Federated Hermes Short-Term Income Fund
|
| Class Name |
Institutional Shares
|
| Trading Symbol |
FSTYX
|
| Annual or Semi-Annual Statement [Text Block] |
This annual shareholder report contains important information about the Federated Hermes Short-Term Income Fund (the "Fund") for the period of May 1, 2025 to April 30, 2026.
|
| Additional Information [Text Block] |
You can find additional information at FederatedHermes.com/us/FundInformation. You can also request this information by contacting us at 1-800-341-7400, Option 4, or your financial advisor.
|
| Additional Information Phone Number |
1-800-341-7400
|
| Additional Information Website |
FederatedHermes.com/us/FundInformation
|
| Expenses [Text Block] |
What were the Fund costs for the last year? (based on a hypothetical $10,000 investment) Table SummaryClass Name | Costs of a $10,000 investment | Costs paid as a percentage of a $10,000 investment |
|---|
Institutional Shares | $38 | 0.37% |
|---|
|
| Expenses Paid, Amount |
$ 38
|
| Expense Ratio, Percent |
0.37%
|
| Factors Affecting Performance [Text Block] |
Management's Discussion of Fund PerformanceThe following discussion compares the performance of the Fund to the Bloomberg 1-3 Year US Government/Credit Index (the “Index”) to show how the Fund’s performance compares to the returns of similar investments for the reporting period. See the Average Annual Total Returns table below for the returns of the Fund and related indexes including the Bloomberg US Aggregate Bond Index, a required broad-based index which represents the overall U.S. fixed-income market. The Fund seeks to provide current income by investing primarily in a diversified portfolio of short- and medium-term debt securities. Top Contributors to Performance Sector allocation added 124 basis points of excess returns primarily from asset-backed securities and to a lesser extent from high yield, commercial mortgage-backed and mortgage-backed securities which outperformed U.S. Treasury securities during the last fiscal year. Security selection, primarily from investment-grade corporate securities, added 34 basis points of excess returns during the last fiscal year. Yield curve management added two basis points to relative Fund performance due to the movement of the yield curve along the short end of the curve.
Top Detractors from Performance Duration management detracted six basis points from relative Fund performance as the Fund’s duration was positioned longer than the Index in a period of increasing interest rates during the reporting period.
|
| Performance Past Does Not Indicate Future [Text] |
Keep in mind that the Fund’s past performance is not a predictor of how the Fund will perform in the future.
|
| No Deduction of Taxes [Text Block] |
The graph and table do not reflect the deduction of taxes that a shareholder would pay on fund distributions or redemption of fund shares.
|
| Updated Performance Information Location [Text Block] |
FederatedHermes.com/us/FundInformation
|
| AssetsNet |
$ 1,850,235,697
|
| Holdings Count | Holding |
523
|
| Advisory Fees Paid, Amount |
$ 3,582,778
|
| InvestmentCompanyPortfolioTurnover |
17.00%
|
| Additional Fund Statistics [Text Block] |
- Net Assets$1,850,235,697
- Number of Investments523
- Portfolio Turnover17%
- Total Advisory Fees Paid$3,582,778
|
| Holdings [Text Block] |
Top Security Types (% of Net Assets)Table SummaryValue | Value |
|---|
Collateralized Mortgage Obligations | 0.5% | Emerging Markets Core Fund | 0.9% | Mortgage-Backed Securities | 1.9% | Project and Trade Finance Core Fund | 2.5% | Cash Equivalents | 3.6% | Commercial Mortgage-Backed Securities | 3.7% | Bank Loan Core Fund | 3.8% | U.S. Treasury Securities | 4.9% | Corporate Bonds | 36.5% | Asset-Backed Securities | 41.7% | |
| Material Fund Change [Text Block] |
|
| C000176845 |
|
| Shareholder Report [Line Items] |
|
| Fund Name |
Federated Hermes Short-Term Income Fund
|
| Class Name |
Class R6 Shares
|
| Trading Symbol |
FSILX
|
| Annual or Semi-Annual Statement [Text Block] |
This annual shareholder report contains important information about the Federated Hermes Short-Term Income Fund (the "Fund") for the period of May 1, 2025 to April 30, 2026.
|
| Additional Information [Text Block] |
You can find additional information at FederatedHermes.com/us/FundInformation. You can also request this information by contacting us at 1-800-341-7400, Option 4, or your financial advisor.
|
| Additional Information Phone Number |
1-800-341-7400
|
| Additional Information Website |
FederatedHermes.com/us/FundInformation
|
| Expenses [Text Block] |
What were the Fund costs for the last year? (based on a hypothetical $10,000 investment) Table SummaryClass Name | Costs of a $10,000 investment | Costs paid as a percentage of a $10,000 investment |
|---|
Class R6 Shares | $35 | 0.34% |
|---|
|
| Expenses Paid, Amount |
$ 35
|
| Expense Ratio, Percent |
0.34%
|
| Factors Affecting Performance [Text Block] |
Management's Discussion of Fund PerformanceThe following discussion compares the performance of the Fund to the Bloomberg 1-3 Year US Government/Credit Index (the “Index”) to show how the Fund’s performance compares to the returns of similar investments for the reporting period. See the Average Annual Total Returns table below for the returns of the Fund and related indexes including the Bloomberg US Aggregate Bond Index, a required broad-based index which represents the overall U.S. fixed-income market. The Fund seeks to provide current income by investing primarily in a diversified portfolio of short- and medium-term debt securities. Top Contributors to Performance Sector allocation added 124 basis points of excess returns primarily from asset-backed securities and to a lesser extent from high yield, commercial mortgage-backed and mortgage-backed securities which outperformed U.S. Treasury securities during the last fiscal year. Security selection, primarily from investment-grade corporate securities, added 34 basis points of excess returns during the last fiscal year. Yield curve management added two basis points to relative Fund performance due to the movement of the yield curve along the short end of the curve.
Top Detractors from Performance Duration management detracted six basis points from relative Fund performance as the Fund’s duration was positioned longer than the Index in a period of increasing interest rates during the reporting period.
|
| Performance Past Does Not Indicate Future [Text] |
Keep in mind that the Fund’s past performance is not a predictor of how the Fund will perform in the future.
|
| No Deduction of Taxes [Text Block] |
The graph and table do not reflect the deduction of taxes that a shareholder would pay on fund distributions or redemption of fund shares.
|
| Updated Performance Information Location [Text Block] |
FederatedHermes.com/us/FundInformation
|
| AssetsNet |
$ 1,850,235,697
|
| Holdings Count | Holding |
523
|
| Advisory Fees Paid, Amount |
$ 3,582,778
|
| InvestmentCompanyPortfolioTurnover |
17.00%
|
| Additional Fund Statistics [Text Block] |
- Net Assets$1,850,235,697
- Number of Investments523
- Portfolio Turnover17%
- Total Advisory Fees Paid$3,582,778
|
| Holdings [Text Block] |
Top Security Types (% of Net Assets)Table SummaryValue | Value |
|---|
Collateralized Mortgage Obligations | 0.5% | Emerging Markets Core Fund | 0.9% | Mortgage-Backed Securities | 1.9% | Project and Trade Finance Core Fund | 2.5% | Cash Equivalents | 3.6% | Commercial Mortgage-Backed Securities | 3.7% | Bank Loan Core Fund | 3.8% | U.S. Treasury Securities | 4.9% | Corporate Bonds | 36.5% | Asset-Backed Securities | 41.7% | |
| Material Fund Change [Text Block] |
|
| C000024662 |
|
| Shareholder Report [Line Items] |
|
| Fund Name |
Federated Hermes Short-Term Income Fund
|
| Class Name |
Service Shares
|
| Trading Symbol |
FSTIX
|
| Annual or Semi-Annual Statement [Text Block] |
This annual shareholder report contains important information about the Federated Hermes Short-Term Income Fund (the "Fund") for the period of May 1, 2025 to April 30, 2026.
|
| Additional Information [Text Block] |
You can find additional information at FederatedHermes.com/us/FundInformation. You can also request this information by contacting us at 1-800-341-7400, Option 4, or your financial advisor.
|
| Additional Information Phone Number |
1-800-341-7400
|
| Additional Information Website |
FederatedHermes.com/us/FundInformation
|
| Expenses [Text Block] |
What were the Fund costs for the last year? (based on a hypothetical $10,000 investment) Table SummaryClass Name | Costs of a $10,000 investment | Costs paid as a percentage of a $10,000 investment |
|---|
Service Shares | $66 | 0.65% |
|---|
|
| Expenses Paid, Amount |
$ 66
|
| Expense Ratio, Percent |
0.65%
|
| Factors Affecting Performance [Text Block] |
Management's Discussion of Fund PerformanceThe following discussion compares the performance of the Fund to the Bloomberg 1-3 Year US Government/Credit Index (the “Index”) to show how the Fund’s performance compares to the returns of similar investments for the reporting period. See the Average Annual Total Returns table below for the returns of the Fund and related indexes including the Bloomberg US Aggregate Bond Index, a required broad-based index which represents the overall U.S. fixed-income market. The Fund seeks to provide current income by investing primarily in a diversified portfolio of short- and medium-term debt securities. Top Contributors to Performance Sector allocation added 124 basis points of excess returns primarily from asset-backed securities and to a lesser extent from high yield, commercial mortgage-backed and mortgage-backed securities which outperformed U.S. Treasury securities during the last fiscal year. Security selection, primarily from investment-grade corporate securities, added 34 basis points of excess returns during the last fiscal year. Yield curve management added two basis points to relative Fund performance due to the movement of the yield curve along the short end of the curve.
Top Detractors from Performance Duration management detracted six basis points from relative Fund performance as the Fund’s duration was positioned longer than the Index in a period of increasing interest rates during the reporting period.
|
| Performance Past Does Not Indicate Future [Text] |
Keep in mind that the Fund’s past performance is not a predictor of how the Fund will perform in the future.
|
| No Deduction of Taxes [Text Block] |
The graph and table do not reflect the deduction of taxes that a shareholder would pay on fund distributions or redemption of fund shares.
|
| Updated Performance Information Location [Text Block] |
FederatedHermes.com/us/FundInformation
|
| AssetsNet |
$ 1,850,235,697
|
| Holdings Count | Holding |
523
|
| Advisory Fees Paid, Amount |
$ 3,582,778
|
| InvestmentCompanyPortfolioTurnover |
17.00%
|
| Additional Fund Statistics [Text Block] |
- Net Assets$1,850,235,697
- Number of Investments523
- Portfolio Turnover17%
- Total Advisory Fees Paid$3,582,778
|
| Holdings [Text Block] |
Top Security Types (% of Net Assets)Table SummaryValue | Value |
|---|
Collateralized Mortgage Obligations | 0.5% | Emerging Markets Core Fund | 0.9% | Mortgage-Backed Securities | 1.9% | Project and Trade Finance Core Fund | 2.5% | Cash Equivalents | 3.6% | Commercial Mortgage-Backed Securities | 3.7% | Bank Loan Core Fund | 3.8% | U.S. Treasury Securities | 4.9% | Corporate Bonds | 36.5% | Asset-Backed Securities | 41.7% | |
| Material Fund Change [Text Block] |
|