Shareholder Report
Apr. 30, 2026
USD ($)
Holding
FUND EXPENSES
What were the fund costs for the last year?
| (based on a hypothetical $10,000 investment) | ||
| Class Name | Costs of a $10,000 investment | Costs paid as a percentage of a $10,000 investment |
| A | $59 | 0.58% |
MANAGEMENT'S DISCUSSION OF FUND PERFORMANCE
-
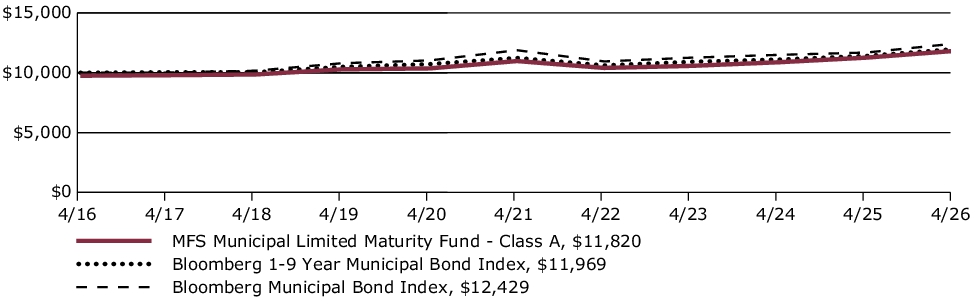
For the twelve months ended April 30, 2026, Class A shares of the MFS Municipal Limited Maturity Fund (fund) provided a total return of 4.95%, at net asset value. This compares with a return of 6.34% for the fund’s benchmark, the Bloomberg Municipal Bond Index. The fund's other benchmark, the Bloomberg 1-9 Year Municipal Bond Index, generated a return of 4.91%.
-
Considerable progress was made in trade talks between the US and many major trading partners, with a fragile truce between the US and China extended through late 2026. While the US Supreme Court struck down part of the Trump administration’s tariff strategy, the administration began deploying other authorities to largely replace the ones that were ruled unconstitutional.
-
Early in the period, moderating inflation pressures allowed many global central banks to ease monetary policy. Amid a difficult policymaking environment and slower job growth, the Federal Reserve resumed easing policy in September and delivered quarter-point rate cuts in October and December before pausing.
-
In fixed income markets, previously range-bound global bond yields spiked following the onset of the Middle East conflict, as energy-driven inflation fears appeared to have rattled bond investors. US rate volatility (as measured by the Merrill Lynch Option Volatility Estimate (MOVE) Index) similarly rose from intra-period lows, reflecting uncertainty around the scope and duration of the conflict and its implications for global growth. However, volatility later retracted as the risk of a broader regional military escalation appeared less likely. Global credit spreads widened only modestly before stabilizing near prior levels, supported by strong demand and resilient underlying fundamentals.
-
The municipal market produced positive returns over the trailing year, characterized by a supportive backdrop punctuated by bouts of volatility. Following a spike in April 2025, bond yield volatility generally trended lower through January of this year, providing a tailwind to returns. Additionally, the resumption of Fed rate cuts in late 2025 bolstered fixed income assets, including municipals. Volatility rose again in March of this year due to heightened geopolitical risks and related economic effects before returning to relatively low levels late in the period. Resilient inflows and generally solid credit fundamentals were key supports for the asset class. The benchmark index for this fund generated a return of 4.91% for the period. A positive for income-oriented investors, the yield (yield-to-worst) of the benchmark index ended the period at 3.03%, higher than the five-year average of 2.60%.
-
Top contributors to performance relative to the Bloomberg 1-9 Year Municipal Bond Index:
-
The fund’s overweight to the housing sector and underweight to general obligation bonds aided relative performance. Favorable security selection within both the transportation and education sectors also supported relative results.
-
From a quality perspective, an overweight to BBB-rated and below investment grade bonds benefited relative returns.
-
-
Top detractors from performance relative to the Bloomberg 1-9 Year Municipal Bond Index:
-
The fund's overweight to the 10 to 20-year segment of the yield curve detracted from relative returns as yields in that segment declined less than bonds with shorter maturities.
-
FUND PERFORMANCE
The fund’s past performance is not a good predictor of the fund’s future performance. The graph and table below do not reflect the deduction of taxes that a shareholder would pay on fund distributions or the redemption of fund shares. The graph and table below assume reinvestment of dividends and capital gain distributions.
Growth of a Hypothetical $10,000 Investment
This graph shows the performance of a hypothetical $10,000 investment in Class A over a ten year period or since inception, if shorter, in comparison to (i) a broad measure of market performance and (ii) an additional index that MFS believes more closely reflects the market segments in which the fund invests. This graph includes the deduction of the maximum applicable sales charge.
Average Annual Total Returns through 4/30/26
This table shows the average annual total returns of the class of shares noted for the periods shown, both with (if any) and without sales charges. It also shows the average annual total returns of (i) a broad measure of market performance and (ii) an additional index that MFS believes more closely reflects the market segments in which the fund invests, over the same periods.
| Share Class | 1-yr | 5-yr | 10-yr |
| A without sales charge | 4.95% | 1.49% | 1.94% |
| A with initial sales charge (2.50%) | 2.33% | 0.98% | 1.69% |
| Comparative Benchmark(s) | |||
| Bloomberg Municipal Bond Index ∆ | 6.34% | 0.90% | 2.20% |
| Bloomberg 1-9 Year Municipal Bond Index ∆ | 4.91% | 1.27% | 1.81% |
|
∆
|
Source: FactSet Research Systems Inc.
|
Visit mfs.com/perf/a for more recent performance information.
FUND STATISTICS AS OF 4/30/26
| Net Assets ($): | 3,116,903,553 | Average Effective Maturity (yrs): | 5.2 | |
| Total Number of Holdings: | 1,069 | Average Effective Duration (yrs): | 3.7 | |
| Total Management Fee ($)#: | 9,561,990 | |||
| Portfolio Turnover Rate (%): | 26 |
# Includes the effect of any management fee waivers, if applicable.
Where the fund holds derivatives, they are not included in the total number of portfolio holdings.
PORTFOLIO COMPOSITION (BASED ON TOTAL INVESTMENTS AS OF 4/30/26)
Portfolio structure
| Fixed Income | 96.4% |
| Money Market Funds | 3.6% |
Composition including fixed income credit
quality
quality
| AAA | 2.7% |
| AA | 34.4% |
| A | 37.0% |
| BBB | 13.6% |
| BB | 3.5% |
| B | 0.3% |
| Not Rated | 4.9% |
| Money Market Funds | 3.6% |
Ratings are assigned using Moody’s, Fitch, and Standard & Poor’s and applying a hierarchy: If all 3 agencies rate a security, the middle rating is assigned; if 2 agencies rate a security, the lower rating is assigned. If none of the 3 agencies rate a security, we use DBRS Morningstar. If none of the 4 agencies rate a security, we use Kroll Bond Rating Agency. Ratings are shown in the S&P and Fitch scale (e.g., AAA). All ratings are subject to change.
Ratings are assigned using Moody’s, Fitch, and Standard & Poor’s and applying a hierarchy: If all 3 agencies rate a security, the middle rating is assigned; if 2 agencies rate a security, the lower rating is assigned. If none of the 3 agencies rate a security, we use DBRS Morningstar. If none of the 4 agencies rate a security, we use Kroll Bond Rating Agency. Ratings are shown in the S&P and Fitch scale (e.g., AAA). All ratings are subject to change.
FUND EXPENSES
What were the fund costs for the last year?
| (based on a hypothetical $10,000 investment) | ||
| Class Name | Costs of a $10,000 investment | Costs paid as a percentage of a $10,000 investment |
| B | $136 | 1.33% |
MANAGEMENT'S DISCUSSION OF FUND PERFORMANCE
-
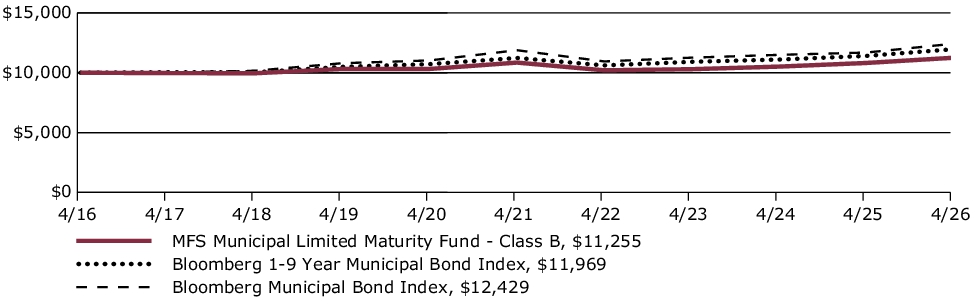
For the twelve months ended April 30, 2026, Class B shares of the MFS Municipal Limited Maturity Fund (fund) provided a total return of 4.04%, at net asset value. This compares with a return of 6.34% for the fund’s benchmark, the Bloomberg Municipal Bond Index. The fund's other benchmark, the Bloomberg 1-9 Year Municipal Bond Index, generated a return of 4.91%.
-
Considerable progress was made in trade talks between the US and many major trading partners, with a fragile truce between the US and China extended through late 2026. While the US Supreme Court struck down part of the Trump administration’s tariff strategy, the administration began deploying other authorities to largely replace the ones that were ruled unconstitutional.
-
Early in the period, moderating inflation pressures allowed many global central banks to ease monetary policy. Amid a difficult policymaking environment and slower job growth, the Federal Reserve resumed easing policy in September and delivered quarter-point rate cuts in October and December before pausing.
-
In fixed income markets, previously range-bound global bond yields spiked following the onset of the Middle East conflict, as energy-driven inflation fears appeared to have rattled bond investors. US rate volatility (as measured by the Merrill Lynch Option Volatility Estimate (MOVE) Index) similarly rose from intra-period lows, reflecting uncertainty around the scope and duration of the conflict and its implications for global growth. However, volatility later retracted as the risk of a broader regional military escalation appeared less likely. Global credit spreads widened only modestly before stabilizing near prior levels, supported by strong demand and resilient underlying fundamentals.
-
The municipal market produced positive returns over the trailing year, characterized by a supportive backdrop punctuated by bouts of volatility. Following a spike in April 2025, bond yield volatility generally trended lower through January of this year, providing a tailwind to returns. Additionally, the resumption of Fed rate cuts in late 2025 bolstered fixed income assets, including municipals. Volatility rose again in March of this year due to heightened geopolitical risks and related economic effects before returning to relatively low levels late in the period. Resilient inflows and generally solid credit fundamentals were key supports for the asset class. The benchmark index for this fund generated a return of 4.91% for the period. A positive for income-oriented investors, the yield (yield-to-worst) of the benchmark index ended the period at 3.03%, higher than the five-year average of 2.60%.
-
Top contributors to performance relative to the Bloomberg 1-9 Year Municipal Bond Index:
-
The fund’s overweight to the housing sector and underweight to general obligation bonds aided relative performance. Favorable security selection within both the transportation and education sectors also supported relative results.
-
From a quality perspective, an overweight to BBB-rated and below investment grade bonds benefited relative returns.
-
-
Top detractors from performance relative to the Bloomberg 1-9 Year Municipal Bond Index:
-
The fund's overweight to the 10 to 20-year segment of the yield curve detracted from relative returns as yields in that segment declined less than bonds with shorter maturities.
-
FUND PERFORMANCE
The fund’s past performance is not a good predictor of the fund’s future performance. The graph and table below do not reflect the deduction of taxes that a shareholder would pay on fund distributions or the redemption of fund shares. The graph and table below assume reinvestment of dividends and capital gain distributions.
Growth of a Hypothetical $10,000 Investment
This graph shows the performance of a hypothetical $10,000 investment in Class B over a ten year period or since inception, if shorter, in comparison to (i) a broad measure of market performance and (ii) an additional index that MFS believes more closely reflects the market segments in which the fund invests.
Average Annual Total Returns through 4/30/26
This table shows the average annual total returns of the class of shares noted for the periods shown, both with (if any) and without sales charges. It also shows the average annual total returns of (i) a broad measure of market performance and (ii) an additional index that MFS believes more closely reflects the market segments in which the fund invests, over the same periods.
| Share Class | 1-yr | 5-yr | 10-yr |
| B without sales charge | 4.04% | 0.74% | 1.19% |
| B with CDSC (declining over six years from 4% to 0%)× | 0.04% | 0.36% | 1.19% |
| Comparative Benchmark(s) | |||
| Bloomberg Municipal Bond Index ∆ | 6.34% | 0.90% | 2.20% |
| Bloomberg 1-9 Year Municipal Bond Index ∆ | 4.91% | 1.27% | 1.81% |
|
∆
|
Source: FactSet Research Systems Inc.
|
|
×
|
Assuming redemption at the end of the applicable period.
|
Visit mfs.com/perf/b for more recent performance information.
FUND STATISTICS AS OF 4/30/26
| Net Assets ($): | 3,116,903,553 | Average Effective Maturity (yrs): | 5.2 | |
| Total Number of Holdings: | 1,069 | Average Effective Duration (yrs): | 3.7 | |
| Total Management Fee ($)#: | 9,561,990 | |||
| Portfolio Turnover Rate (%): | 26 |
# Includes the effect of any management fee waivers, if applicable.
Where the fund holds derivatives, they are not included in the total number of portfolio holdings.
PORTFOLIO COMPOSITION (BASED ON TOTAL INVESTMENTS AS OF 4/30/26)
Portfolio structure
| Fixed Income | 96.4% |
| Money Market Funds | 3.6% |
Composition including fixed income credit
quality
quality
| AAA | 2.7% |
| AA | 34.4% |
| A | 37.0% |
| BBB | 13.6% |
| BB | 3.5% |
| B | 0.3% |
| Not Rated | 4.9% |
| Money Market Funds | 3.6% |
Ratings are assigned using Moody’s, Fitch, and Standard & Poor’s and applying a hierarchy: If all 3 agencies rate a security, the middle rating is assigned; if 2 agencies rate a security, the lower rating is assigned. If none of the 3 agencies rate a security, we use DBRS Morningstar. If none of the 4 agencies rate a security, we use Kroll Bond Rating Agency. Ratings are shown in the S&P and Fitch scale (e.g., AAA). All ratings are subject to change.
Ratings are assigned using Moody’s, Fitch, and Standard & Poor’s and applying a hierarchy: If all 3 agencies rate a security, the middle rating is assigned; if 2 agencies rate a security, the lower rating is assigned. If none of the 3 agencies rate a security, we use DBRS Morningstar. If none of the 4 agencies rate a security, we use Kroll Bond Rating Agency. Ratings are shown in the S&P and Fitch scale (e.g., AAA). All ratings are subject to change.
FUND EXPENSES
What were the fund costs for the last year?
| (based on a hypothetical $10,000 investment) | ||
| Class Name | Costs of a $10,000 investment | Costs paid as a percentage of a $10,000 investment |
| C | $146 | 1.43% |
MANAGEMENT'S DISCUSSION OF FUND PERFORMANCE
-
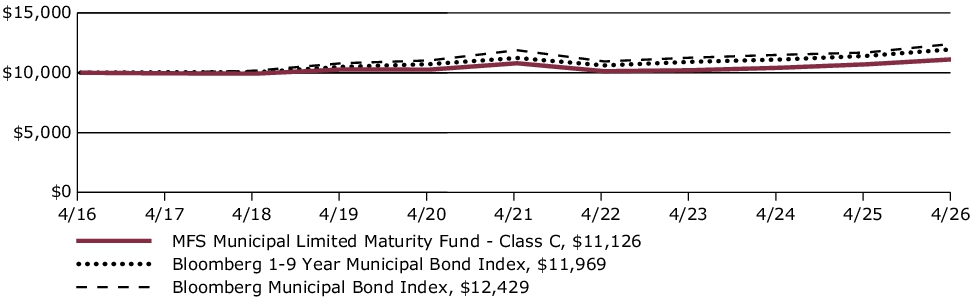
For the twelve months ended April 30, 2026, Class C shares of the MFS Municipal Limited Maturity Fund (fund) provided a total return of 3.94%, at net asset value. This compares with a return of 6.34% for the fund’s benchmark, the Bloomberg Municipal Bond Index. The fund's other benchmark, the Bloomberg 1-9 Year Municipal Bond Index, generated a return of 4.91%.
-
Considerable progress was made in trade talks between the US and many major trading partners, with a fragile truce between the US and China extended through late 2026. While the US Supreme Court struck down part of the Trump administration’s tariff strategy, the administration began deploying other authorities to largely replace the ones that were ruled unconstitutional.
-
Early in the period, moderating inflation pressures allowed many global central banks to ease monetary policy. Amid a difficult policymaking environment and slower job growth, the Federal Reserve resumed easing policy in September and delivered quarter-point rate cuts in October and December before pausing.
-
In fixed income markets, previously range-bound global bond yields spiked following the onset of the Middle East conflict, as energy-driven inflation fears appeared to have rattled bond investors. US rate volatility (as measured by the Merrill Lynch Option Volatility Estimate (MOVE) Index) similarly rose from intra-period lows, reflecting uncertainty around the scope and duration of the conflict and its implications for global growth. However, volatility later retracted as the risk of a broader regional military escalation appeared less likely. Global credit spreads widened only modestly before stabilizing near prior levels, supported by strong demand and resilient underlying fundamentals.
-
The municipal market produced positive returns over the trailing year, characterized by a supportive backdrop punctuated by bouts of volatility. Following a spike in April 2025, bond yield volatility generally trended lower through January of this year, providing a tailwind to returns. Additionally, the resumption of Fed rate cuts in late 2025 bolstered fixed income assets, including municipals. Volatility rose again in March of this year due to heightened geopolitical risks and related economic effects before returning to relatively low levels late in the period. Resilient inflows and generally solid credit fundamentals were key supports for the asset class. The benchmark index for this fund generated a return of 4.91% for the period. A positive for income-oriented investors, the yield (yield-to-worst) of the benchmark index ended the period at 3.03%, higher than the five-year average of 2.60%.
-
Top contributors to performance relative to the Bloomberg 1-9 Year Municipal Bond Index:
-
The fund’s overweight to the housing sector and underweight to general obligation bonds aided relative performance. Favorable security selection within both the transportation and education sectors also supported relative results.
-
From a quality perspective, an overweight to BBB-rated and below investment grade bonds benefited relative returns.
-
-
Top detractors from performance relative to the Bloomberg 1-9 Year Municipal Bond Index:
-
The fund's overweight to the 10 to 20-year segment of the yield curve detracted from relative returns as yields in that segment declined less than bonds with shorter maturities.
-
FUND PERFORMANCE
The fund’s past performance is not a good predictor of the fund’s future performance. The graph and table below do not reflect the deduction of taxes that a shareholder would pay on fund distributions or the redemption of fund shares. The graph and table below assume reinvestment of dividends and capital gain distributions.
Growth of a Hypothetical $10,000 Investment
This graph shows the performance of a hypothetical $10,000 investment in Class C over a ten year period or since inception, if shorter, in comparison to (i) a broad measure of market performance and (ii) an additional index that MFS believes more closely reflects the market segments in which the fund invests.
Average Annual Total Returns through 4/30/26
This table shows the average annual total returns of the class of shares noted for the periods shown, both with (if any) and without sales charges. It also shows the average annual total returns of (i) a broad measure of market performance and (ii) an additional index that MFS believes more closely reflects the market segments in which the fund invests, over the same periods.
| Share Class | 1-yr | 5-yr | 10-yr |
| C without sales charge | 3.94% | 0.61% | 1.07% |
| C with CDSC (1% for 12 months)× | 2.94% | 0.61% | 1.07% |
| Comparative Benchmark(s) | |||
| Bloomberg Municipal Bond Index ∆ | 6.34% | 0.90% | 2.20% |
| Bloomberg 1-9 Year Municipal Bond Index ∆ | 4.91% | 1.27% | 1.81% |
|
∆
|
Source: FactSet Research Systems Inc.
|
|
×
|
Assuming redemption at the end of the applicable period.
|
Visit mfs.com/perf/c for more recent performance information.
FUND STATISTICS AS OF 4/30/26
| Net Assets ($): | 3,116,903,553 | Average Effective Maturity (yrs): | 5.2 | |
| Total Number of Holdings: | 1,069 | Average Effective Duration (yrs): | 3.7 | |
| Total Management Fee ($)#: | 9,561,990 | |||
| Portfolio Turnover Rate (%): | 26 |
# Includes the effect of any management fee waivers, if applicable.
Where the fund holds derivatives, they are not included in the total number of portfolio holdings.
PORTFOLIO COMPOSITION (BASED ON TOTAL INVESTMENTS AS OF 4/30/26)
Portfolio structure
| Fixed Income | 96.4% |
| Money Market Funds | 3.6% |
Composition including fixed income credit quality
| AAA | 2.7% |
| AA | 34.4% |
| A | 37.0% |
| BBB | 13.6% |
| BB | 3.5% |
| B | 0.3% |
| Not Rated | 4.9% |
| Money Market Funds | 3.6% |
Ratings are assigned using Moody’s, Fitch, and Standard & Poor’s and applying a hierarchy: If all 3 agencies rate a security, the middle rating is assigned; if 2 agencies rate a security, the lower rating is assigned. If none of the 3 agencies rate a security, we use DBRS Morningstar. If none of the 4 agencies rate a security, we use Kroll Bond Rating Agency. Ratings are shown in the S&P and Fitch scale (e.g., AAA). All ratings are subject to change.
Ratings are assigned using Moody’s, Fitch, and Standard & Poor’s and applying a hierarchy: If all 3 agencies rate a security, the middle rating is assigned; if 2 agencies rate a security, the lower rating is assigned. If none of the 3 agencies rate a security, we use DBRS Morningstar. If none of the 4 agencies rate a security, we use Kroll Bond Rating Agency. Ratings are shown in the S&P and Fitch scale (e.g., AAA). All ratings are subject to change.
FUND EXPENSES
What were the fund costs for the last year?
| (based on a hypothetical $10,000 investment) | ||
| Class Name | Costs of a $10,000 investment | Costs paid as a percentage of a $10,000 investment |
| I | $44 | 0.43% |
MANAGEMENT'S DISCUSSION OF FUND PERFORMANCE
-
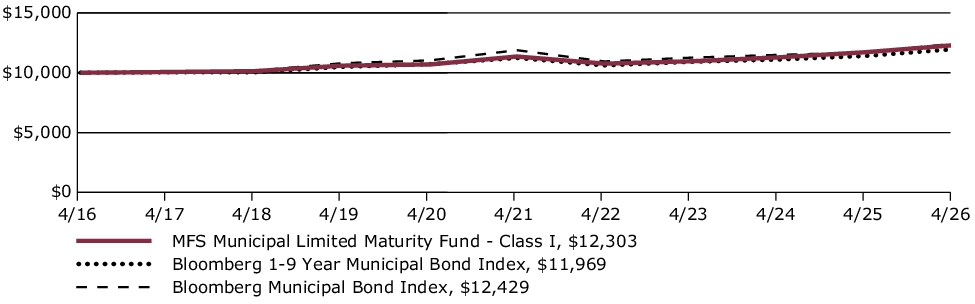
For the twelve months ended April 30, 2026, Class I shares of the MFS Municipal Limited Maturity Fund (fund) provided a total return of 4.98%, at net asset value. This compares with a return of 6.34% for the fund’s benchmark, the Bloomberg Municipal Bond Index. The fund's other benchmark, the Bloomberg 1-9 Year Municipal Bond Index, generated a return of 4.91%.
-
Considerable progress was made in trade talks between the US and many major trading partners, with a fragile truce between the US and China extended through late 2026. While the US Supreme Court struck down part of the Trump administration’s tariff strategy, the administration began deploying other authorities to largely replace the ones that were ruled unconstitutional.
-
Early in the period, moderating inflation pressures allowed many global central banks to ease monetary policy. Amid a difficult policymaking environment and slower job growth, the Federal Reserve resumed easing policy in September and delivered quarter-point rate cuts in October and December before pausing.
-
In fixed income markets, previously range-bound global bond yields spiked following the onset of the Middle East conflict, as energy-driven inflation fears appeared to have rattled bond investors. US rate volatility (as measured by the Merrill Lynch Option Volatility Estimate (MOVE) Index) similarly rose from intra-period lows, reflecting uncertainty around the scope and duration of the conflict and its implications for global growth. However, volatility later retracted as the risk of a broader regional military escalation appeared less likely. Global credit spreads widened only modestly before stabilizing near prior levels, supported by strong demand and resilient underlying fundamentals.
-
The municipal market produced positive returns over the trailing year, characterized by a supportive backdrop punctuated by bouts of volatility. Following a spike in April 2025, bond yield volatility generally trended lower through January of this year, providing a tailwind to returns. Additionally, the resumption of Fed rate cuts in late 2025 bolstered fixed income assets, including municipals. Volatility rose again in March of this year due to heightened geopolitical risks and related economic effects before returning to relatively low levels late in the period. Resilient inflows and generally solid credit fundamentals were key supports for the asset class. The benchmark index for this fund generated a return of 4.91% for the period. A positive for income-oriented investors, the yield (yield-to-worst) of the benchmark index ended the period at 3.03%, higher than the five-year average of 2.60%.
-
Top contributors to performance relative to the Bloomberg 1-9 Year Municipal Bond Index:
-
The fund’s overweight to the housing sector and underweight to general obligation bonds aided relative performance. Favorable security selection within both the transportation and education sectors also supported relative results.
-
From a quality perspective, an overweight to BBB-rated and below investment grade bonds benefited relative returns.
-
-
Top detractors from performance relative to the Bloomberg 1-9 Year Municipal Bond Index:
-
The fund's overweight to the 10 to 20-year segment of the yield curve detracted from relative returns as yields in that segment declined less than bonds with shorter maturities.
-
FUND PERFORMANCE
The fund’s past performance is not a good predictor of the fund’s future performance. The graph and table below do not reflect the deduction of taxes that a shareholder would pay on fund distributions or the redemption of fund shares. The graph and table below assume reinvestment of dividends and capital gain distributions.
Growth of a Hypothetical $10,000 Investment
This graph shows the performance of a hypothetical $10,000 investment in Class I over a ten year period or since inception, if shorter, in comparison to (i) a broad measure of market performance and (ii) an additional index that MFS believes more closely reflects the market segments in which the fund invests.
Average Annual Total Returns through 4/30/26
This table shows the average annual total returns of the class of shares noted for the periods shown, both with (if any) and without sales charges. It also shows the average annual total returns of (i) a broad measure of market performance and (ii) an additional index that MFS believes more closely reflects the market segments in which the fund invests, over the same periods.
| Share Class | 1-yr | 5-yr | 10-yr |
| I without sales charge | 4.98% | 1.61% | 2.09% |
| Comparative Benchmark(s) | |||
| Bloomberg Municipal Bond Index ∆ | 6.34% | 0.90% | 2.20% |
| Bloomberg 1-9 Year Municipal Bond Index ∆ | 4.91% | 1.27% | 1.81% |
|
∆
|
Source: FactSet Research Systems Inc.
|
Visit mfs.com/perf/i for more recent performance information.
FUND STATISTICS AS OF 4/30/26
| Net Assets ($): | 3,116,903,553 | Average Effective Maturity (yrs): | 5.2 | |
| Total Number of Holdings: | 1,069 | Average Effective Duration (yrs): | 3.7 | |
| Total Management Fee ($)#: | 9,561,990 | |||
| Portfolio Turnover Rate (%): | 26 |
# Includes the effect of any management fee waivers, if applicable.
Where the fund holds derivatives, they are not included in the total number of portfolio holdings.
PORTFOLIO COMPOSITION (BASED ON TOTAL INVESTMENTS AS OF 4/30/26)
Portfolio structure
| Fixed Income | 96.4% |
| Money Market Funds | 3.6% |
Composition including fixed income credit
quality
quality
| AAA | 2.7% |
| AA | 34.4% |
| A | 37.0% |
| BBB | 13.6% |
| BB | 3.5% |
| B | 0.3% |
| Not Rated | 4.9% |
| Money Market Funds | 3.6% |
Ratings are assigned using Moody’s, Fitch, and Standard & Poor’s and applying a hierarchy: If all 3 agencies rate a security, the middle rating is assigned; if 2 agencies rate a security, the lower rating is assigned. If none of the 3 agencies rate a security, we use DBRS Morningstar. If none of the 4 agencies rate a security, we use Kroll Bond Rating Agency. Ratings are shown in the S&P and Fitch scale (e.g., AAA). All ratings are subject to change.
Ratings are assigned using Moody’s, Fitch, and Standard & Poor’s and applying a hierarchy: If all 3 agencies rate a security, the middle rating is assigned; if 2 agencies rate a security, the lower rating is assigned. If none of the 3 agencies rate a security, we use DBRS Morningstar. If none of the 4 agencies rate a security, we use Kroll Bond Rating Agency. Ratings are shown in the S&P and Fitch scale (e.g., AAA). All ratings are subject to change.
FUND EXPENSES
What were the fund costs for the last year?
| (based on a hypothetical $10,000 investment) | ||
| Class Name | Costs of a $10,000 investment | Costs paid as a percentage of a $10,000 investment |
| R6 | $37 | 0.36% |
MANAGEMENT'S DISCUSSION OF FUND PERFORMANCE
-
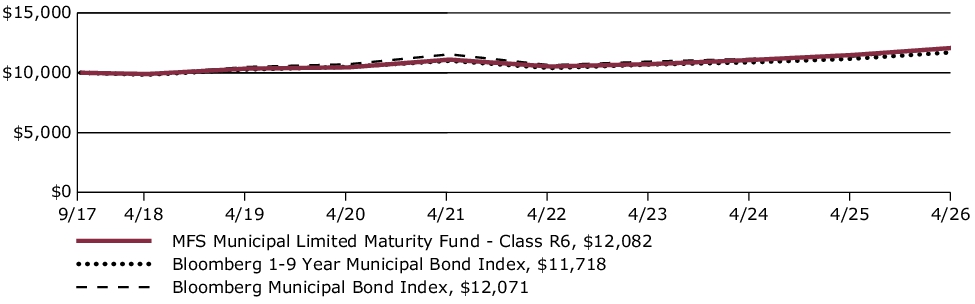
For the twelve months ended April 30, 2026, Class R6 shares of the MFS Municipal Limited Maturity Fund (fund) provided a total return of 5.19%, at net asset value. This compares with a return of 6.34% for the fund’s benchmark, the Bloomberg Municipal Bond Index. The fund's other benchmark, the Bloomberg 1-9 Year Municipal Bond Index, generated a return of 4.91%.
-
Considerable progress was made in trade talks between the US and many major trading partners, with a fragile truce between the US and China extended through late 2026. While the US Supreme Court struck down part of the Trump administration’s tariff strategy, the administration began deploying other authorities to largely replace the ones that were ruled unconstitutional.
-
Early in the period, moderating inflation pressures allowed many global central banks to ease monetary policy. Amid a difficult policymaking environment and slower job growth, the Federal Reserve resumed easing policy in September and delivered quarter-point rate cuts in October and December before pausing.
-
In fixed income markets, previously range-bound global bond yields spiked following the onset of the Middle East conflict, as energy-driven inflation fears appeared to have rattled bond investors. US rate volatility (as measured by the Merrill Lynch Option Volatility Estimate (MOVE) Index) similarly rose from intra-period lows, reflecting uncertainty around the scope and duration of the conflict and its implications for global growth. However, volatility later retracted as the risk of a broader regional military escalation appeared less likely. Global credit spreads widened only modestly before stabilizing near prior levels, supported by strong demand and resilient underlying fundamentals.
-
The municipal market produced positive returns over the trailing year, characterized by a supportive backdrop punctuated by bouts of volatility. Following a spike in April 2025, bond yield volatility generally trended lower through January of this year, providing a tailwind to returns. Additionally, the resumption of Fed rate cuts in late 2025 bolstered fixed income assets, including municipals. Volatility rose again in March of this year due to heightened geopolitical risks and related economic effects before returning to relatively low levels late in the period. Resilient inflows and generally solid credit fundamentals were key supports for the asset class. The benchmark index for this fund generated a return of 4.91% for the period. A positive for income-oriented investors, the yield (yield-to-worst) of the benchmark index ended the period at 3.03%, higher than the five-year average of 2.60%.
-
Top contributors to performance relative to the Bloomberg 1-9 Year Municipal Bond Index:
-
The fund’s overweight to the housing sector and underweight to general obligation bonds aided relative performance. Favorable security selection within both the transportation and education sectors also supported relative results.
-
From a quality perspective, an overweight to BBB-rated and below investment grade bonds benefited relative returns.
-
-
Top detractors from performance relative to the Bloomberg 1-9 Year Municipal Bond Index:
-
The fund's overweight to the 10 to 20-year segment of the yield curve detracted from relative returns as yields in that segment declined less than bonds with shorter maturities.
-
FUND PERFORMANCE
The fund’s past performance is not a good predictor of the fund’s future performance. The graph and table below do not reflect the deduction of taxes that a shareholder would pay on fund distributions or the redemption of fund shares. The graph and table below assume reinvestment of dividends and capital gain distributions.
Growth of a Hypothetical $10,000 Investment*
This graph shows the performance of a hypothetical $10,000 investment in Class R6 over a ten year period or since inception, if shorter, in comparison to (i) a broad measure of market performance and (ii) an additional index that MFS believes more closely reflects the market segments in which the fund invests.
Average Annual Total Returns through 4/30/26
This table shows the average annual total returns of the class of shares noted for the periods shown, both with (if any) and without sales charges. It also shows the average annual total returns of (i) a broad measure of market performance and (ii) an additional index that MFS believes more closely reflects the market segments in which the fund invests, over the same periods.
| Share Class | 1-yr | 5-yr | Life* |
| R6 without sales charge | 5.19% | 1.71% | 2.21% |
| Comparative Benchmark(s) | |||
| Bloomberg Municipal Bond Index ∆ | 6.34% | 0.90% | 2.20% |
| Bloomberg 1-9 Year Municipal Bond Index ∆ | 4.91% | 1.27% | 1.85% |
|
*
|
For the period from the commencement of the class's investment operations, September 1, 2017 through April 30, 2026.
|
|
∆
|
Source: FactSet Research Systems Inc.
|
Visit mfs.com/perf/r6 for more recent performance information.
FUND STATISTICS AS OF 4/30/26
| Net Assets ($): | 3,116,903,553 | Average Effective Maturity (yrs): | 5.2 | |
| Total Number of Holdings: | 1,069 | Average Effective Duration (yrs): | 3.7 | |
| Total Management Fee ($)#: | 9,561,990 | |||
| Portfolio Turnover Rate (%): | 26 |
# Includes the effect of any management fee waivers, if applicable.
Where the fund holds derivatives, they are not included in the total number of portfolio holdings.
PORTFOLIO COMPOSITION (BASED ON TOTAL INVESTMENTS AS OF 4/30/26)
Portfolio structure
| Fixed Income | 96.4% |
| Money Market Funds | 3.6% |
Composition including fixed income credit
quality
quality
| AAA | 2.7% |
| AA | 34.4% |
| A | 37.0% |
| BBB | 13.6% |
| BB | 3.5% |
| B | 0.3% |
| Not Rated | 4.9% |
| Money Market Funds | 3.6% |
Ratings are assigned using Moody’s, Fitch, and Standard & Poor’s and applying a hierarchy: If all 3 agencies rate a security, the middle rating is assigned; if 2 agencies rate a security, the lower rating is assigned. If none of the 3 agencies rate a security, we use DBRS Morningstar. If none of the 4 agencies rate a security, we use Kroll Bond Rating Agency. Ratings are shown in the S&P and Fitch scale (e.g., AAA). All ratings are subject to change.
Ratings are assigned using Moody’s, Fitch, and Standard & Poor’s and applying a hierarchy: If all 3 agencies rate a security, the middle rating is assigned; if 2 agencies rate a security, the lower rating is assigned. If none of the 3 agencies rate a security, we use DBRS Morningstar. If none of the 4 agencies rate a security, we use Kroll Bond Rating Agency. Ratings are shown in the S&P and Fitch scale (e.g., AAA). All ratings are subject to change.
FUND EXPENSES
What were the fund costs for the last year?
| (based on a hypothetical $10,000 investment) | ||
| Class Name | Costs of a $10,000 investment | Costs paid as a percentage of a $10,000 investment |
| A | $61 | 0.60% |
MANAGEMENT'S DISCUSSION OF FUND PERFORMANCE
-
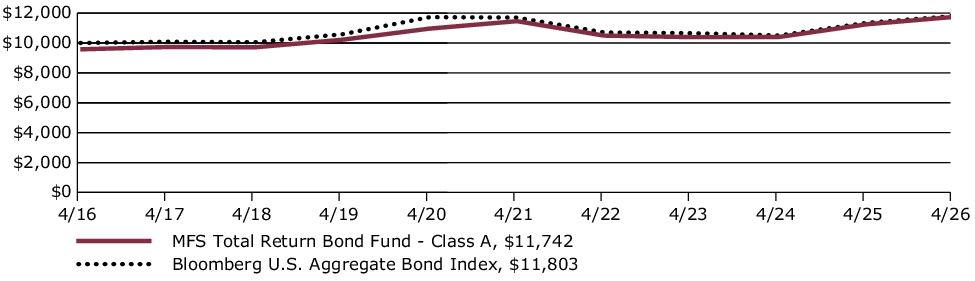
For the twelve months ended April 30, 2026, Class A shares of the MFS Total Return Bond Fund (fund) provided a total return of 4.40%, at net asset value. This compares with a return of 4.06% for the fund’s benchmark, the Bloomberg U.S. Aggregate Bond Index.
-
Global equity markets reached record levels during the period, withstanding considerable volatility amid tariffs, geopolitical conflict and high levels of uncertainty. A new geopolitical event distressed markets at the end of the period as US and Israeli forces launched strikes against Iran, disrupting Mideast oil and natural gas exports. During the period, a pro-growth tax and spending bill was signed into law in the US, while in Europe, renewed focus on defense and infrastructure spending brightened the economic outlook. In Japan, the election of a pro-growth prime minister sent stocks to new highs prior to the conflict in Iran. Optimism over artificial intelligence remained high.
-
Considerable progress was made in trade talks between the US and many major trading partners, with a fragile truce between the US and China extended through late 2026. While the US Supreme Court struck down part of the Trump administration’s tariff strategy, the administration began deploying other authorities to largely replace the ones that were ruled unconstitutional.
-
Early in the period, moderating inflation pressures allowed many global central banks to ease monetary policy. Amid a difficult policymaking environment and slower job growth, the Federal Reserve resumed easing policy in September and delivered quarter-point rate cuts in October and December before pausing.
-
In fixed income markets, previously range-bound global bond yields spiked following the onset of the Middle East conflict, as energy-driven inflation fears appeared to have rattled bond investors. US rate volatility (as measured by the Merrill Lynch Option Volatility Estimate (MOVE) Index) similarly rose from intra-period lows, reflecting uncertainty around the scope and duration of the conflict and its implications for global growth. However, volatility later retracted as the risk of a broader regional military escalation appeared less likely. Global credit spreads widened only modestly before stabilizing near prior levels, supported by strong demand and resilient underlying fundamentals.
-
Top contributors to performance relative to the Bloomberg U.S. Aggregate Bond Index:
-
The fund's underweight exposure to the treasury sector and out-of-benchmark exposure to the collateralized mortgage obligation (CMO) sector aided relative returns. Favorable security selection within the industrials sector also supported relative results.
-
From a quality perspective, the fund’s out-of-benchmark exposure to BB-rated bonds benefited relative returns. Security selection within BBB-rated bonds was another positive factor for relative performance.
-
-
Top detractors from performance relative to the Bloomberg U.S. Aggregate Bond Index:
-
The fund’s underweight exposure to the mortgage backed securities (MBS) agency fixed rate sector weighed on relative performance. Not owning any securities within the government-related sovereign sector also held back relative returns.
-
FUND PERFORMANCE
The fund’s past performance is not a good predictor of the fund’s future performance. The graph and table below do not reflect the deduction of taxes that a shareholder would pay on fund distributions or the redemption of fund shares. The graph and table below assume reinvestment of dividends and capital gain distributions.
Growth of a Hypothetical $10,000 Investment
This graph shows the performance of a hypothetical $10,000 investment in Class A over a ten year period or since inception, if shorter, in comparison to a broad measure of market performance. This graph includes the deduction of the maximum applicable sales charge.
Average Annual Total Returns through 4/30/26
This table shows the average annual total returns of the class of shares noted for the periods shown, both with (if any) and without sales charges. It also shows the average annual total returns of a broad measure of market performance over the same periods.
| Share Class | 1-yr | 5-yr | 10-yr |
| A without sales charge | 4.40% | 0.49% | 2.06% |
| A with initial sales charge (4.25%) | (0.03)% | (0.38)% | 1.62% |
| Comparative Benchmark(s) | |||
| Bloomberg U.S. Aggregate Bond Index ∆ | 4.06% | 0.18% | 1.67% |
|
∆
|
Source: FactSet Research Systems Inc.
|
Visit mfs.com/perf/a for more recent performance information.
FUND STATISTICS AS OF 4/30/26
| Net Assets ($): | 8,274,986,056 | Average Effective Maturity (yrs): | 7.4 | |
| Total Number of Holdings: | 1,074 | Average Effective Duration (yrs): | 5.8 | |
| Total Management Fee ($)#: | 28,761,662 | |||
| Portfolio Turnover Rate (%): | 48 |
# Includes the effect of any management fee waivers, if applicable.
Where the fund holds derivatives, they are not included in the total number of portfolio holdings.
PORTFOLIO COMPOSITION (BASED ON TOTAL INVESTMENTS AS OF 4/30/26)
Portfolio structure
| Fixed Income | 98.5% |
| Money Market Funds | 1.5% |
Composition including fixed income credit quality
| AAA | 13.7% |
| AA | 7.0% |
| A | 10.8% |
| BBB | 22.2% |
| BB | 4.0% |
| B | 1.9% |
| CCC | 0.0% |
| CC | 0.0% |
| U.S. Government | 24.0% |
| Federal Agencies | 14.7% |
| Not Rated | 0.2% |
| Money Market Funds | 1.5% |
Ratings are assigned using Moody’s, Fitch, and Standard & Poor’s and applying a hierarchy: If all 3 agencies rate a security, the middle rating is assigned; if 2 agencies rate a security, the lower rating is assigned. If none of the 3 agencies rate a security, we use DBRS Morningstar. If none of the 4 agencies rate a security, we use Kroll Bond Rating Agency. Ratings are shown in the S&P and Fitch scale (e.g., AAA). All ratings are subject to change.
Ratings are assigned using Moody’s, Fitch, and Standard & Poor’s and applying a hierarchy: If all 3 agencies rate a security, the middle rating is assigned; if 2 agencies rate a security, the lower rating is assigned. If none of the 3 agencies rate a security, we use DBRS Morningstar. If none of the 4 agencies rate a security, we use Kroll Bond Rating Agency. Ratings are shown in the S&P and Fitch scale (e.g., AAA). All ratings are subject to change.
FUND EXPENSES
What were the fund costs for the last year?
| (based on a hypothetical $10,000 investment) | ||
| Class Name | Costs of a $10,000 investment | Costs paid as a percentage of a $10,000 investment |
| B | $137 | 1.35% |
MANAGEMENT'S DISCUSSION OF FUND PERFORMANCE
-
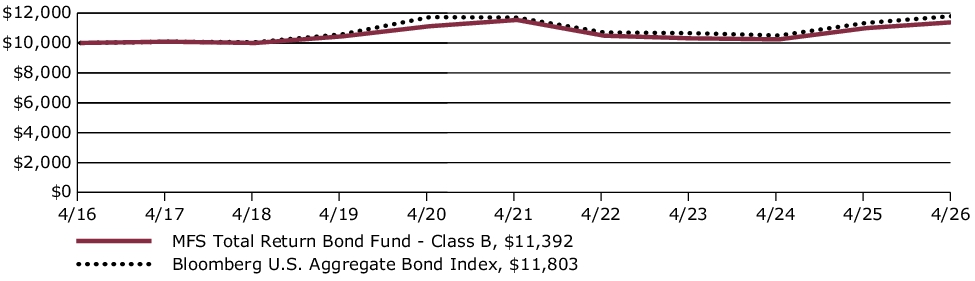
For the twelve months ended April 30, 2026, Class B shares of the MFS Total Return Bond Fund (fund) provided a total return of 3.63%, at net asset value. This compares with a return of 4.06% for the fund’s benchmark, the Bloomberg U.S. Aggregate Bond Index.
-
Global equity markets reached record levels during the period, withstanding considerable volatility amid tariffs, geopolitical conflict and high levels of uncertainty. A new geopolitical event distressed markets at the end of the period as US and Israeli forces launched strikes against Iran, disrupting Mideast oil and natural gas exports. During the period, a pro-growth tax and spending bill was signed into law in the US, while in Europe, renewed focus on defense and infrastructure spending brightened the economic outlook. In Japan, the election of a pro-growth prime minister sent stocks to new highs prior to the conflict in Iran. Optimism over artificial intelligence remained high.
-
Considerable progress was made in trade talks between the US and many major trading partners, with a fragile truce between the US and China extended through late 2026. While the US Supreme Court struck down part of the Trump administration’s tariff strategy, the administration began deploying other authorities to largely replace the ones that were ruled unconstitutional.
-
Early in the period, moderating inflation pressures allowed many global central banks to ease monetary policy. Amid a difficult policymaking environment and slower job growth, the Federal Reserve resumed easing policy in September and delivered quarter-point rate cuts in October and December before pausing.
-
In fixed income markets, previously range-bound global bond yields spiked following the onset of the Middle East conflict, as energy-driven inflation fears appeared to have rattled bond investors. US rate volatility (as measured by the Merrill Lynch Option Volatility Estimate (MOVE) Index) similarly rose from intra-period lows, reflecting uncertainty around the scope and duration of the conflict and its implications for global growth. However, volatility later retracted as the risk of a broader regional military escalation appeared less likely. Global credit spreads widened only modestly before stabilizing near prior levels, supported by strong demand and resilient underlying fundamentals.
-
Top contributors to performance relative to the Bloomberg U.S. Aggregate Bond Index:
-
The fund's underweight exposure to the treasury sector and out-of-benchmark exposure to the collateralized mortgage obligation (CMO) sector aided relative returns. Favorable security selection within the industrials sector also supported relative results.
-
From a quality perspective, the fund’s out-of-benchmark exposure to BB-rated bonds benefited relative returns. Security selection within BBB-rated bonds was another positive factor for relative performance.
-
-
Top detractors from performance relative to the Bloomberg U.S. Aggregate Bond Index:
-
The fund’s underweight exposure to the mortgage backed securities (MBS) agency fixed rate sector weighed on relative performance. Not owning any securities within the government-related sovereign sector also held back relative returns.
-
FUND PERFORMANCE
The fund’s past performance is not a good predictor of the fund’s future performance. The graph and table below do not reflect the deduction of taxes that a shareholder would pay on fund distributions or the redemption of fund shares. The graph and table below assume reinvestment of dividends and capital gain distributions.
Growth of a Hypothetical $10,000 Investment
This graph shows the performance of a hypothetical $10,000 investment in Class B over a ten year period or since inception, if shorter, in comparison to a broad measure of market performance.
Average Annual Total Returns through 4/30/26
This table shows the average annual total returns of the class of shares noted for the periods shown, both with (if any) and without sales charges. It also shows the average annual total returns of a broad measure of market performance over the same periods.
| Share Class | 1-yr | 5-yr | 10-yr |
| B without sales charge | 3.63% | (0.26)% | 1.31% |
| B with CDSC (declining over six years from 4% to 0%)× | (0.37)% | (0.60)% | 1.31% |
| Comparative Benchmark(s) | |||
| Bloomberg U.S. Aggregate Bond Index ∆ | 4.06% | 0.18% | 1.67% |
|
∆
|
Source: FactSet Research Systems Inc.
|
|
×
|
Assuming redemption at the end of the applicable period.
|
Visit mfs.com/perf/b for more recent performance information.
FUND STATISTICS AS OF 4/30/26
| Net Assets ($): | 8,274,986,056 | Average Effective Maturity (yrs): | 7.4 | |
| Total Number of Holdings: | 1,074 | Average Effective Duration (yrs): | 5.8 | |
| Total Management Fee ($)#: | 28,761,662 | |||
| Portfolio Turnover Rate (%): | 48 |
# Includes the effect of any management fee waivers, if applicable.
Where the fund holds derivatives, they are not included in the total number of portfolio holdings.
PORTFOLIO COMPOSITION (BASED ON TOTAL INVESTMENTS AS OF 4/30/26)
Portfolio structure
| Fixed Income | 98.5% |
| Money Market Funds | 1.5% |
Composition including fixed income credit quality
| AAA | 13.7% |
| AA | 7.0% |
| A | 10.8% |
| BBB | 22.2% |
| BB | 4.0% |
| B | 1.9% |
| CCC | 0.0% |
| CC | 0.0% |
| U.S. Government | 24.0% |
| Federal Agencies | 14.7% |
| Not Rated | 0.2% |
| Money Market Funds | 1.5% |
Ratings are assigned using Moody’s, Fitch, and Standard & Poor’s and applying a hierarchy: If all 3 agencies rate a security, the middle rating is assigned; if 2 agencies rate a security, the lower rating is assigned. If none of the 3 agencies rate a security, we use DBRS Morningstar. If none of the 4 agencies rate a security, we use Kroll Bond Rating Agency. Ratings are shown in the S&P and Fitch scale (e.g., AAA). All ratings are subject to change.
Ratings are assigned using Moody’s, Fitch, and Standard & Poor’s and applying a hierarchy: If all 3 agencies rate a security, the middle rating is assigned; if 2 agencies rate a security, the lower rating is assigned. If none of the 3 agencies rate a security, we use DBRS Morningstar. If none of the 4 agencies rate a security, we use Kroll Bond Rating Agency. Ratings are shown in the S&P and Fitch scale (e.g., AAA). All ratings are subject to change.
FUND EXPENSES
What were the fund costs for the last year?
| (based on a hypothetical $10,000 investment) | ||
| Class Name | Costs of a $10,000 investment | Costs paid as a percentage of a $10,000 investment |
| C | $148 | 1.45% |
MANAGEMENT'S DISCUSSION OF FUND PERFORMANCE
-
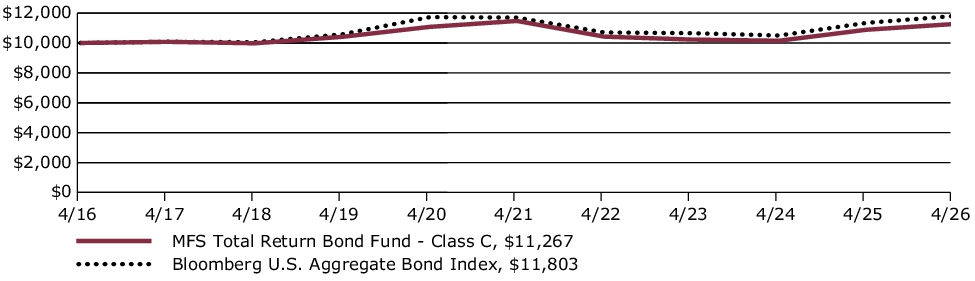
For the twelve months ended April 30, 2026, Class C shares of the MFS Total Return Bond Fund (fund) provided a total return of 3.52%, at net asset value. This compares with a return of 4.06% for the fund’s benchmark, the Bloomberg U.S. Aggregate Bond Index.
-
Global equity markets reached record levels during the period, withstanding considerable volatility amid tariffs, geopolitical conflict and high levels of uncertainty. A new geopolitical event distressed markets at the end of the period as US and Israeli forces launched strikes against Iran, disrupting Mideast oil and natural gas exports. During the period, a pro-growth tax and spending bill was signed into law in the US, while in Europe, renewed focus on defense and infrastructure spending brightened the economic outlook. In Japan, the election of a pro-growth prime minister sent stocks to new highs prior to the conflict in Iran. Optimism over artificial intelligence remained high.
-
Considerable progress was made in trade talks between the US and many major trading partners, with a fragile truce between the US and China extended through late 2026. While the US Supreme Court struck down part of the Trump administration’s tariff strategy, the administration began deploying other authorities to largely replace the ones that were ruled unconstitutional.
-
Early in the period, moderating inflation pressures allowed many global central banks to ease monetary policy. Amid a difficult policymaking environment and slower job growth, the Federal Reserve resumed easing policy in September and delivered quarter-point rate cuts in October and December before pausing.
-
In fixed income markets, previously range-bound global bond yields spiked following the onset of the Middle East conflict, as energy-driven inflation fears appeared to have rattled bond investors. US rate volatility (as measured by the Merrill Lynch Option Volatility Estimate (MOVE) Index) similarly rose from intra-period lows, reflecting uncertainty around the scope and duration of the conflict and its implications for global growth. However, volatility later retracted as the risk of a broader regional military escalation appeared less likely. Global credit spreads widened only modestly before stabilizing near prior levels, supported by strong demand and resilient underlying fundamentals.
-
Top contributors to performance relative to the Bloomberg U.S. Aggregate Bond Index:
-
The fund's underweight exposure to the treasury sector and out-of-benchmark exposure to the collateralized mortgage obligation (CMO) sector aided relative returns. Favorable security selection within the industrials sector also supported relative results.
-
From a quality perspective, the fund’s out-of-benchmark exposure to BB-rated bonds benefited relative returns. Security selection within BBB-rated bonds was another positive factor for relative performance.
-
-
Top detractors from performance relative to the Bloomberg U.S. Aggregate Bond Index:
-
The fund’s underweight exposure to the mortgage backed securities (MBS) agency fixed rate sector weighed on relative performance. Not owning any securities within the government-related sovereign sector also held back relative returns.
-
FUND PERFORMANCE
The fund’s past performance is not a good predictor of the fund’s future performance. The graph and table below do not reflect the deduction of taxes that a shareholder would pay on fund distributions or the redemption of fund shares. The graph and table below assume reinvestment of dividends and capital gain distributions.
Growth of a Hypothetical $10,000 Investment
This graph shows the performance of a hypothetical $10,000 investment in Class C over a ten year period or since inception, if shorter, in comparison to a broad measure of market performance.
Average Annual Total Returns through 4/30/26
This table shows the average annual total returns of the class of shares noted for the periods shown, both with (if any) and without sales charges. It also shows the average annual total returns of a broad measure of market performance over the same periods.
| Share Class | 1-yr | 5-yr | 10-yr |
| C without sales charge | 3.52% | (0.36)% | 1.20% |
| C with CDSC (1% for 12 months)× | 2.52% | (0.36)% | 1.20% |
| Comparative Benchmark(s) | |||
| Bloomberg U.S. Aggregate Bond Index ∆ | 4.06% | 0.18% | 1.67% |
|
∆
|
Source: FactSet Research Systems Inc.
|
|
×
|
Assuming redemption at the end of the applicable period.
|
Visit mfs.com/perf/c for more recent performance information.
FUND STATISTICS AS OF 4/30/26
| Net Assets ($): | 8,274,986,056 | Average Effective Maturity (yrs): | 7.4 | |
| Total Number of Holdings: | 1,074 | Average Effective Duration (yrs): | 5.8 | |
| Total Management Fee ($)#: | 28,761,662 | |||
| Portfolio Turnover Rate (%): | 48 |
# Includes the effect of any management fee waivers, if applicable.
Where the fund holds derivatives, they are not included in the total number of portfolio holdings.
PORTFOLIO COMPOSITION (BASED ON TOTAL INVESTMENTS AS OF 4/30/26)
Portfolio structure
| Fixed Income | 98.5% |
| Money Market Funds | 1.5% |
Composition including fixed income credit quality
| AAA | 13.7% |
| AA | 7.0% |
| A | 10.8% |
| BBB | 22.2% |
| BB | 4.0% |
| B | 1.9% |
| CCC | 0.0% |
| CC | 0.0% |
| U.S. Government | 24.0% |
| Federal Agencies | 14.7% |
| Not Rated | 0.2% |
| Money Market Funds | 1.5% |
Ratings are assigned using Moody’s, Fitch, and Standard & Poor’s and applying a hierarchy: If all 3 agencies rate a security, the middle rating is assigned; if 2 agencies rate a security, the lower rating is assigned. If none of the 3 agencies rate a security, we use DBRS Morningstar. If none of the 4 agencies rate a security, we use Kroll Bond Rating Agency. Ratings are shown in the S&P and Fitch scale (e.g., AAA). All ratings are subject to change.
FUND EXPENSES
What were the fund costs for the last year?
| (based on a hypothetical $10,000 investment) | ||
| Class Name | Costs of a $10,000 investment | Costs paid as a percentage of a $10,000 investment |
| I | $46 | 0.45% |
MANAGEMENT'S DISCUSSION OF FUND PERFORMANCE
-
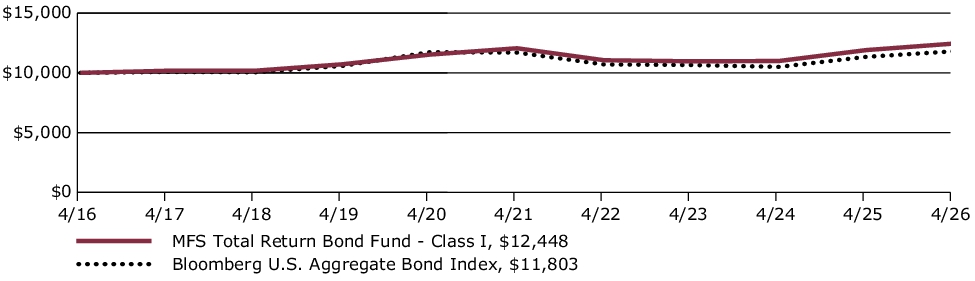
For the twelve months ended April 30, 2026, Class I shares of the MFS Total Return Bond Fund (fund) provided a total return of 4.56%, at net asset value. This compares with a return of 4.06% for the fund’s benchmark, the Bloomberg U.S. Aggregate Bond Index.
-
Global equity markets reached record levels during the period, withstanding considerable volatility amid tariffs, geopolitical conflict and high levels of uncertainty. A new geopolitical event distressed markets at the end of the period as US and Israeli forces launched strikes against Iran, disrupting Mideast oil and natural gas exports. During the period, a pro-growth tax and spending bill was signed into law in the US, while in Europe, renewed focus on defense and infrastructure spending brightened the economic outlook. In Japan, the election of a pro-growth prime minister sent stocks to new highs prior to the conflict in Iran. Optimism over artificial intelligence remained high.
-
Considerable progress was made in trade talks between the US and many major trading partners, with a fragile truce between the US and China extended through late 2026. While the US Supreme Court struck down part of the Trump administration’s tariff strategy, the administration began deploying other authorities to largely replace the ones that were ruled unconstitutional.
-
Early in the period, moderating inflation pressures allowed many global central banks to ease monetary policy. Amid a difficult policymaking environment and slower job growth, the Federal Reserve resumed easing policy in September and delivered quarter-point rate cuts in October and December before pausing.
-
In fixed income markets, previously range-bound global bond yields spiked following the onset of the Middle East conflict, as energy-driven inflation fears appeared to have rattled bond investors. US rate volatility (as measured by the Merrill Lynch Option Volatility Estimate (MOVE) Index) similarly rose from intra-period lows, reflecting uncertainty around the scope and duration of the conflict and its implications for global growth. However, volatility later retracted as the risk of a broader regional military escalation appeared less likely. Global credit spreads widened only modestly before stabilizing near prior levels, supported by strong demand and resilient underlying fundamentals.
-
Top contributors to performance relative to the Bloomberg U.S. Aggregate Bond Index:
-
The fund's underweight exposure to the treasury sector and out-of-benchmark exposure to the collateralized mortgage obligation (CMO) sector aided relative returns. Favorable security selection within the industrials sector also supported relative results.
-
From a quality perspective, the fund’s out-of-benchmark exposure to BB-rated bonds benefited relative returns. Security selection within BBB-rated bonds was another positive factor for relative performance.
-
-
Top detractors from performance relative to the Bloomberg U.S. Aggregate Bond Index:
-
The fund’s underweight exposure to the mortgage backed securities (MBS) agency fixed rate sector weighed on relative performance. Not owning any securities within the government-related sovereign sector also held back relative returns.
-
FUND PERFORMANCE
The fund’s past performance is not a good predictor of the fund’s future performance. The graph and table below do not reflect the deduction of taxes that a shareholder would pay on fund distributions or the redemption of fund shares. The graph and table below assume reinvestment of dividends and capital gain distributions.
Growth of a Hypothetical $10,000 Investment
This graph shows the performance of a hypothetical $10,000 investment in Class I over a ten year period or since inception, if shorter, in comparison to a broad measure of market performance.
Average Annual Total Returns through 4/30/26
This table shows the average annual total returns of the class of shares noted for the periods shown, both with (if any) and without sales charges. It also shows the average annual total returns of a broad measure of market performance over the same periods.
| Share Class | 1-yr | 5-yr | 10-yr |
| I without sales charge | 4.56% | 0.64% | 2.21% |
| Comparative Benchmark(s) | |||
| Bloomberg U.S. Aggregate Bond Index ∆ | 4.06% | 0.18% | 1.67% |
|
∆
|
Source: FactSet Research Systems Inc.
|
Visit mfs.com/perf/i for more recent performance information.
FUND STATISTICS AS OF 4/30/26
| Net Assets ($): | 8,274,986,056 | Average Effective Maturity (yrs): | 7.4 | |
| Total Number of Holdings: | 1,074 | Average Effective Duration (yrs): | 5.8 | |
| Total Management Fee ($)#: | 28,761,662 | |||
| Portfolio Turnover Rate (%): | 48 |
# Includes the effect of any management fee waivers, if applicable.
Where the fund holds derivatives, they are not included in the total number of portfolio holdings.
PORTFOLIO COMPOSITION (BASED ON TOTAL INVESTMENTS AS OF 4/30/26)
Portfolio structure
| Fixed Income | 98.5% |
| Money Market Funds | 1.5% |
Composition including fixed income credit quality
| AAA | 13.7% |
| AA | 7.0% |
| A | 10.8% |
| BBB | 22.2% |
| BB | 4.0% |
| B | 1.9% |
| CCC | 0.0% |
| CC | 0.0% |
| U.S. Government | 24.0% |
| Federal Agencies | 14.7% |
| Not Rated | 0.2% |
| Money Market Funds | 1.5% |
Ratings are assigned using Moody’s, Fitch, and Standard & Poor’s and applying a hierarchy: If all 3 agencies rate a security, the middle rating is assigned; if 2 agencies rate a security, the lower rating is assigned. If none of the 3 agencies rate a security, we use DBRS Morningstar. If none of the 4 agencies rate a security, we use Kroll Bond Rating Agency. Ratings are shown in the S&P and Fitch scale (e.g., AAA). All ratings are subject to change.
Ratings are assigned using Moody’s, Fitch, and Standard & Poor’s and applying a hierarchy: If all 3 agencies rate a security, the middle rating is assigned; if 2 agencies rate a security, the lower rating is assigned. If none of the 3 agencies rate a security, we use DBRS Morningstar. If none of the 4 agencies rate a security, we use Kroll Bond Rating Agency. Ratings are shown in the S&P and Fitch scale (e.g., AAA). All ratings are subject to change.
FUND EXPENSES
What were the fund costs for the last year?
| (based on a hypothetical $10,000 investment) | ||
| Class Name | Costs of a $10,000 investment | Costs paid as a percentage of a $10,000 investment |
| R1 | $148 | 1.45% |
MANAGEMENT'S DISCUSSION OF FUND PERFORMANCE
-
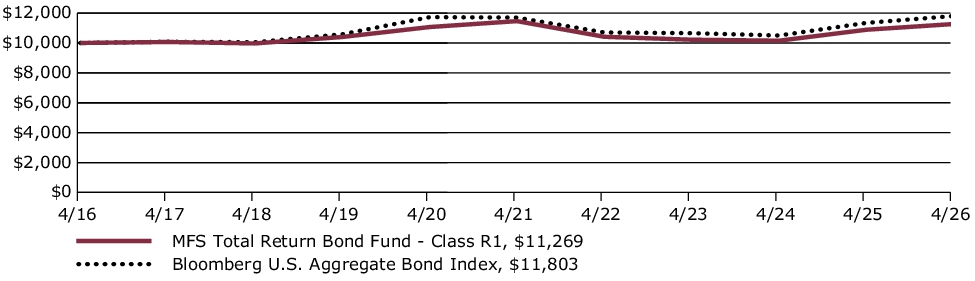
For the twelve months ended April 30, 2026, Class R1 shares of the MFS Total Return Bond Fund (fund) provided a total return of 3.52%, at net asset value. This compares with a return of 4.06% for the fund’s benchmark, the Bloomberg U.S. Aggregate Bond Index.
-
Global equity markets reached record levels during the period, withstanding considerable volatility amid tariffs, geopolitical conflict and high levels of uncertainty. A new geopolitical event distressed markets at the end of the period as US and Israeli forces launched strikes against Iran, disrupting Mideast oil and natural gas exports. During the period, a pro-growth tax and spending bill was signed into law in the US, while in Europe, renewed focus on defense and infrastructure spending brightened the economic outlook. In Japan, the election of a pro-growth prime minister sent stocks to new highs prior to the conflict in Iran. Optimism over artificial intelligence remained high.
-
Considerable progress was made in trade talks between the US and many major trading partners, with a fragile truce between the US and China extended through late 2026. While the US Supreme Court struck down part of the Trump administration’s tariff strategy, the administration began deploying other authorities to largely replace the ones that were ruled unconstitutional.
-
Early in the period, moderating inflation pressures allowed many global central banks to ease monetary policy. Amid a difficult policymaking environment and slower job growth, the Federal Reserve resumed easing policy in September and delivered quarter-point rate cuts in October and December before pausing.
-
In fixed income markets, previously range-bound global bond yields spiked following the onset of the Middle East conflict, as energy-driven inflation fears appeared to have rattled bond investors. US rate volatility (as measured by the Merrill Lynch Option Volatility Estimate (MOVE) Index) similarly rose from intra-period lows, reflecting uncertainty around the scope and duration of the conflict and its implications for global growth. However, volatility later retracted as the risk of a broader regional military escalation appeared less likely. Global credit spreads widened only modestly before stabilizing near prior levels, supported by strong demand and resilient underlying fundamentals.
-
Top contributors to performance relative to the Bloomberg U.S. Aggregate Bond Index:
-
The fund's underweight exposure to the treasury sector and out-of-benchmark exposure to the collateralized mortgage obligation (CMO) sector aided relative returns. Favorable security selection within the industrials sector also supported relative results.
-
From a quality perspective, the fund’s out-of-benchmark exposure to BB-rated bonds benefited relative returns. Security selection within BBB-rated bonds was another positive factor for relative performance.
-
-
Top detractors from performance relative to the Bloomberg U.S. Aggregate Bond Index:
-
The fund’s underweight exposure to the mortgage backed securities (MBS) agency fixed rate sector weighed on relative performance. Not owning any securities within the government-related sovereign sector also held back relative returns.
-
FUND PERFORMANCE
The fund’s past performance is not a good predictor of the fund’s future performance. The graph and table below do not reflect the deduction of taxes that a shareholder would pay on fund distributions or the redemption of fund shares. The graph and table below assume reinvestment of dividends and capital gain distributions.
Growth of a Hypothetical $10,000 Investment
This graph shows the performance of a hypothetical $10,000 investment in Class R1 over a ten year period or since inception, if shorter, in comparison to a broad measure of market performance.
Average Annual Total Returns through 4/30/26
This table shows the average annual total returns of the class of shares noted for the periods shown, both with (if any) and without sales charges. It also shows the average annual total returns of a broad measure of market performance over the same periods.
| Share Class | 1-yr | 5-yr | 10-yr |
| R1 without sales charge | 3.52% | (0.34)% | 1.20% |
| Comparative Benchmark(s) | |||
| Bloomberg U.S. Aggregate Bond Index ∆ | 4.06% | 0.18% | 1.67% |
|
∆
|
Source: FactSet Research Systems Inc.
|
Visit mfs.com/perf/r1 for more recent performance information.
FUND STATISTICS AS OF 4/30/26
| Net Assets ($): | 8,274,986,056 | Average Effective Maturity (yrs): | 7.4 | |
| Total Number of Holdings: | 1,074 | Average Effective Duration (yrs): | 5.8 | |
| Total Management Fee ($)#: | 28,761,662 | |||
| Portfolio Turnover Rate (%): | 48 |
# Includes the effect of any management fee waivers, if applicable.
Where the fund holds derivatives, they are not included in the total number of portfolio holdings.
PORTFOLIO COMPOSITION (BASED ON TOTAL INVESTMENTS AS OF 4/30/26)
Portfolio structure
| Fixed Income | 98.5% |
| Money Market Funds | 1.5% |
Composition including fixed income credit quality
| AAA | 13.7% |
| AA | 7.0% |
| A | 10.8% |
| BBB | 22.2% |
| BB | 4.0% |
| B | 1.9% |
| CCC | 0.0% |
| CC | 0.0% |
| U.S. Government | 24.0% |
| Federal Agencies | 14.7% |
| Not Rated | 0.2% |
| Money Market Funds | 1.5% |
Ratings are assigned using Moody’s, Fitch, and Standard & Poor’s and applying a hierarchy: If all 3 agencies rate a security, the middle rating is assigned; if 2 agencies rate a security, the lower rating is assigned. If none of the 3 agencies rate a security, we use DBRS Morningstar. If none of the 4 agencies rate a security, we use Kroll Bond Rating Agency. Ratings are shown in the S&P and Fitch scale (e.g., AAA). All ratings are subject to change.
Ratings are assigned using Moody’s, Fitch, and Standard & Poor’s and applying a hierarchy: If all 3 agencies rate a security, the middle rating is assigned; if 2 agencies rate a security, the lower rating is assigned. If none of the 3 agencies rate a security, we use DBRS Morningstar. If none of the 4 agencies rate a security, we use Kroll Bond Rating Agency. Ratings are shown in the S&P and Fitch scale (e.g., AAA). All ratings are subject to change.
FUND EXPENSES
What were the fund costs for the last year?
| (based on a hypothetical $10,000 investment) | ||
| Class Name | Costs of a $10,000 investment | Costs paid as a percentage of a $10,000 investment |
| R2 | $97 | 0.95% |
MANAGEMENT'S DISCUSSION OF FUND PERFORMANCE
-
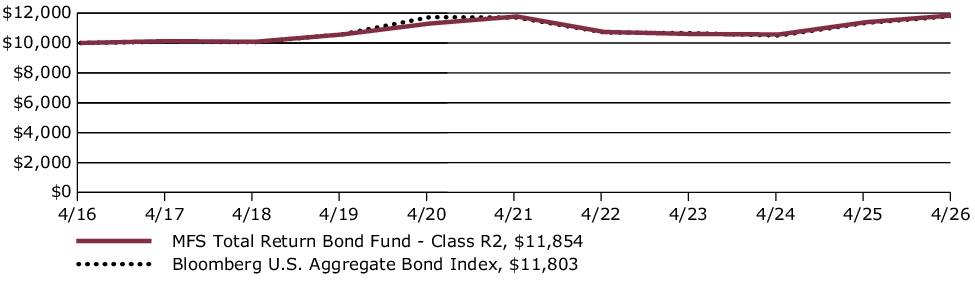
For the twelve months ended April 30, 2026, Class R2 shares of the MFS Total Return Bond Fund (fund) provided a total return of 4.04%, at net asset value. This compares with a return of 4.06% for the fund’s benchmark, the Bloomberg U.S. Aggregate Bond Index.
-
Global equity markets reached record levels during the period, withstanding considerable volatility amid tariffs, geopolitical conflict and high levels of uncertainty. A new geopolitical event distressed markets at the end of the period as US and Israeli forces launched strikes against Iran, disrupting Mideast oil and natural gas exports. During the period, a pro-growth tax and spending bill was signed into law in the US, while in Europe, renewed focus on defense and infrastructure spending brightened the economic outlook. In Japan, the election of a pro-growth prime minister sent stocks to new highs prior to the conflict in Iran. Optimism over artificial intelligence remained high.
-
Considerable progress was made in trade talks between the US and many major trading partners, with a fragile truce between the US and China extended through late 2026. While the US Supreme Court struck down part of the Trump administration’s tariff strategy, the administration began deploying other authorities to largely replace the ones that were ruled unconstitutional.
-
Early in the period, moderating inflation pressures allowed many global central banks to ease monetary policy. Amid a difficult policymaking environment and slower job growth, the Federal Reserve resumed easing policy in September and delivered quarter-point rate cuts in October and December before pausing.
-
In fixed income markets, previously range-bound global bond yields spiked following the onset of the Middle East conflict, as energy-driven inflation fears appeared to have rattled bond investors. US rate volatility (as measured by the Merrill Lynch Option Volatility Estimate (MOVE) Index) similarly rose from intra-period lows, reflecting uncertainty around the scope and duration of the conflict and its implications for global growth. However, volatility later retracted as the risk of a broader regional military escalation appeared less likely. Global credit spreads widened only modestly before stabilizing near prior levels, supported by strong demand and resilient underlying fundamentals.
-
Top contributors to performance relative to the Bloomberg U.S. Aggregate Bond Index:
-
The fund's underweight exposure to the treasury sector and out-of-benchmark exposure to the collateralized mortgage obligation (CMO) sector aided relative returns. Favorable security selection within the industrials sector also supported relative results.
-
From a quality perspective, the fund’s out-of-benchmark exposure to BB-rated bonds benefited relative returns. Security selection within BBB-rated bonds was another positive factor for relative performance.
-
-
Top detractors from performance relative to the Bloomberg U.S. Aggregate Bond Index:
-
The fund’s underweight exposure to the mortgage backed securities (MBS) agency fixed rate sector weighed on relative performance. Not owning any securities within the government-related sovereign sector also held back relative returns.
-
FUND PERFORMANCE
The fund’s past performance is not a good predictor of the fund’s future performance. The graph and table below do not reflect the deduction of taxes that a shareholder would pay on fund distributions or the redemption of fund shares. The graph and table below assume reinvestment of dividends and capital gain distributions.
Growth of a Hypothetical $10,000 Investment
This graph shows the performance of a hypothetical $10,000 investment in Class R2 over a ten year period or since inception, if shorter, in comparison to a broad measure of market performance.
Average Annual Total Returns through 4/30/26
This table shows the average annual total returns of the class of shares noted for the periods shown, both with (if any) and without sales charges. It also shows the average annual total returns of a broad measure of market performance over the same periods.
| Share Class | 1-yr | 5-yr | 10-yr |
| R2 without sales charge | 4.04% | 0.14% | 1.72% |
| Comparative Benchmark(s) | |||
| Bloomberg U.S. Aggregate Bond Index ∆ | 4.06% | 0.18% | 1.67% |
|
∆
|
Source: FactSet Research Systems Inc.
|
Visit mfs.com/perf/r2 for more recent performance information.
FUND STATISTICS AS OF 4/30/26
| Net Assets ($): | 8,274,986,056 | Average Effective Maturity (yrs): | 7.4 | |
| Total Number of Holdings: | 1,074 | Average Effective Duration (yrs): | 5.8 | |
| Total Management Fee ($)#: | 28,761,662 | |||
| Portfolio Turnover Rate (%): | 48 |
# Includes the effect of any management fee waivers, if applicable.
Where the fund holds derivatives, they are not included in the total number of portfolio holdings.
PORTFOLIO COMPOSITION (BASED ON TOTAL INVESTMENTS AS OF 4/30/26)
Portfolio structure
| Fixed Income | 98.5% |
| Money Market Funds | 1.5% |
Composition including fixed income credit quality
| AAA | 13.7% |
| AA | 7.0% |
| A | 10.8% |
| BBB | 22.2% |
| BB | 4.0% |
| B | 1.9% |
| CCC | 0.0% |
| CC | 0.0% |
| U.S. Government | 24.0% |
| Federal Agencies | 14.7% |
| Not Rated | 0.2% |
| Money Market Funds | 1.5% |
Ratings are assigned using Moody’s, Fitch, and Standard & Poor’s and applying a hierarchy: If all 3 agencies rate a security, the middle rating is assigned; if 2 agencies rate a security, the lower rating is assigned. If none of the 3 agencies rate a security, we use DBRS Morningstar. If none of the 4 agencies rate a security, we use Kroll Bond Rating Agency. Ratings are shown in the S&P and Fitch scale (e.g., AAA). All ratings are subject to change.
Ratings are assigned using Moody’s, Fitch, and Standard & Poor’s and applying a hierarchy: If all 3 agencies rate a security, the middle rating is assigned; if 2 agencies rate a security, the lower rating is assigned. If none of the 3 agencies rate a security, we use DBRS Morningstar. If none of the 4 agencies rate a security, we use Kroll Bond Rating Agency. Ratings are shown in the S&P and Fitch scale (e.g., AAA). All ratings are subject to change.
FUND EXPENSES
What were the fund costs for the last year?
| (based on a hypothetical $10,000 investment) | ||
| Class Name | Costs of a $10,000 investment | Costs paid as a percentage of a $10,000 investment |
| R3 | $72 | 0.70% |
MANAGEMENT'S DISCUSSION OF FUND PERFORMANCE
-
For the twelve months ended April 30, 2026, Class R3 shares of the MFS Total Return Bond Fund (fund) provided a total return of 4.30%, at net asset value. This compares with a return of 4.06% for the fund’s benchmark, the Bloomberg U.S. Aggregate Bond Index.
-
Global equity markets reached record levels during the period, withstanding considerable volatility amid tariffs, geopolitical conflict and high levels of uncertainty. A new geopolitical event distressed markets at the end of the period as US and Israeli forces launched strikes against Iran, disrupting Mideast oil and natural gas exports. During the period, a pro-growth tax and spending bill was signed into law in the US, while in Europe, renewed focus on defense and infrastructure spending brightened the economic outlook. In Japan, the election of a pro-growth prime minister sent stocks to new highs prior to the conflict in Iran. Optimism over artificial intelligence remained high.
-
Considerable progress was made in trade talks between the US and many major trading partners, with a fragile truce between the US and China extended through late 2026. While the US Supreme Court struck down part of the Trump administration’s tariff strategy, the administration began deploying other authorities to largely replace the ones that were ruled unconstitutional.
-
Early in the period, moderating inflation pressures allowed many global central banks to ease monetary policy. Amid a difficult policymaking environment and slower job growth, the Federal Reserve resumed easing policy in September and delivered quarter-point rate cuts in October and December before pausing.
-
In fixed income markets, previously range-bound global bond yields spiked following the onset of the Middle East conflict, as energy-driven inflation fears appeared to have rattled bond investors. US rate volatility (as measured by the Merrill Lynch Option Volatility Estimate (MOVE) Index) similarly rose from intra-period lows, reflecting uncertainty around the scope and duration of the conflict and its implications for global growth. However, volatility later retracted as the risk of a broader regional military escalation appeared less likely. Global credit spreads widened only modestly before stabilizing near prior levels, supported by strong demand and resilient underlying fundamentals.
-
Top contributors to performance relative to the Bloomberg U.S. Aggregate Bond Index:
-
The fund's underweight exposure to the treasury sector and out-of-benchmark exposure to the collateralized mortgage obligation (CMO) sector aided relative returns. Favorable security selection within the industrials sector also supported relative results.
-
From a quality perspective, the fund’s out-of-benchmark exposure to BB-rated bonds benefited relative returns. Security selection within BBB-rated bonds was another positive factor for relative performance.
-
-
Top detractors from performance relative to the Bloomberg U.S. Aggregate Bond Index:
-
The fund’s underweight exposure to the mortgage backed securities (MBS) agency fixed rate sector weighed on relative performance. Not owning any securities within the government-related sovereign sector also held back relative returns.
-
FUND PERFORMANCE
The fund’s past performance is not a good predictor of the fund’s future performance. The graph and table below do not reflect the deduction of taxes that a shareholder would pay on fund distributions or the redemption of fund shares. The graph and table below assume reinvestment of dividends and capital gain distributions.
Growth of a Hypothetical $10,000 Investment
This graph shows the performance of a hypothetical $10,000 investment in Class R3 over a ten year period or since inception, if shorter, in comparison to a broad measure of market performance.
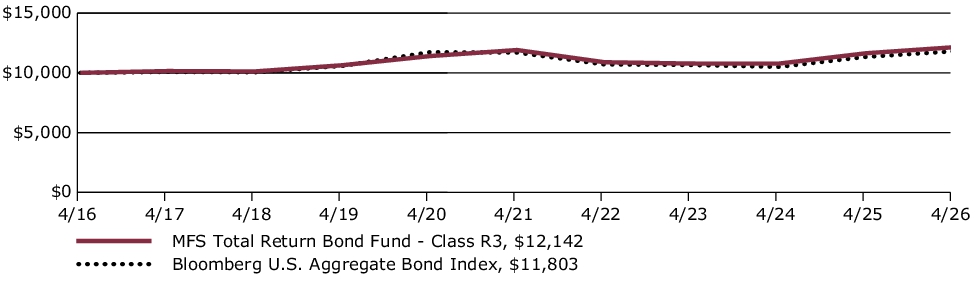
Average Annual Total Returns through 4/30/26
This table shows the average annual total returns of the class of shares noted for the periods shown, both with (if any) and without sales charges. It also shows the average annual total returns of a broad measure of market performance over the same periods.
| Share Class | 1-yr | 5-yr | 10-yr |
| R3 without sales charge | 4.30% | 0.39% | 1.96% |
| Comparative Benchmark(s) | |||
| Bloomberg U.S. Aggregate Bond Index ∆ | 4.06% | 0.18% | 1.67% |
|
∆
|
Source: FactSet Research Systems Inc.
|
Visit mfs.com/perf/r3 for more recent performance information.
FUND STATISTICS AS OF 4/30/26
| Net Assets ($): | 8,274,986,056 | Average Effective Maturity (yrs): | 7.4 | |
| Total Number of Holdings: | 1,074 | Average Effective Duration (yrs): | 5.8 | |
| Total Management Fee ($)#: | 28,761,662 | |||
| Portfolio Turnover Rate (%): | 48 |
# Includes the effect of any management fee waivers, if applicable.
Where the fund holds derivatives, they are not included in the total number of portfolio holdings.
PORTFOLIO COMPOSITION (BASED ON TOTAL INVESTMENTS AS OF 4/30/26)
Portfolio structure
| Fixed Income | 98.5% |
| Money Market Funds | 1.5% |
Composition including fixed income credit quality
| AAA | 13.7% |
| AA | 7.0% |
| A | 10.8% |
| BBB | 22.2% |
| BB | 4.0% |
| B | 1.9% |
| CCC | 0.0% |
| CC | 0.0% |
| U.S. Government | 24.0% |
| Federal Agencies | 14.7% |
| Not Rated | 0.2% |
| Money Market Funds | 1.5% |
Ratings are assigned using Moody’s, Fitch, and Standard & Poor’s and applying a hierarchy: If all 3 agencies rate a security, the middle rating is assigned; if 2 agencies rate a security, the lower rating is assigned. If none of the 3 agencies rate a security, we use DBRS Morningstar. If none of the 4 agencies rate a security, we use Kroll Bond Rating Agency. Ratings are shown in the S&P and Fitch scale (e.g., AAA). All ratings are subject to change.
Ratings are assigned using Moody’s, Fitch, and Standard & Poor’s and applying a hierarchy: If all 3 agencies rate a security, the middle rating is assigned; if 2 agencies rate a security, the lower rating is assigned. If none of the 3 agencies rate a security, we use DBRS Morningstar. If none of the 4 agencies rate a security, we use Kroll Bond Rating Agency. Ratings are shown in the S&P and Fitch scale (e.g., AAA). All ratings are subject to change.
FUND EXPENSES
What were the fund costs for the last year?
| (based on a hypothetical $10,000 investment) | ||
| Class Name | Costs of a $10,000 investment | Costs paid as a percentage of a $10,000 investment |
| R4 | $46 | 0.45% |
MANAGEMENT'S DISCUSSION OF FUND PERFORMANCE
-
For the twelve months ended April 30, 2026, Class R4 shares of the MFS Total Return Bond Fund (fund) provided a total return of 4.56%, at net asset value. This compares with a return of 4.06% for the fund’s benchmark, the Bloomberg U.S. Aggregate Bond Index.
-
Global equity markets reached record levels during the period, withstanding considerable volatility amid tariffs, geopolitical conflict and high levels of uncertainty. A new geopolitical event distressed markets at the end of the period as US and Israeli forces launched strikes against Iran, disrupting Mideast oil and natural gas exports. During the period, a pro-growth tax and spending bill was signed into law in the US, while in Europe, renewed focus on defense and infrastructure spending brightened the economic outlook. In Japan, the election of a pro-growth prime minister sent stocks to new highs prior to the conflict in Iran. Optimism over artificial intelligence remained high.
-
Considerable progress was made in trade talks between the US and many major trading partners, with a fragile truce between the US and China extended through late 2026. While the US Supreme Court struck down part of the Trump administration’s tariff strategy, the administration began deploying other authorities to largely replace the ones that were ruled unconstitutional.
-
Early in the period, moderating inflation pressures allowed many global central banks to ease monetary policy. Amid a difficult policymaking environment and slower job growth, the Federal Reserve resumed easing policy in September and delivered quarter-point rate cuts in October and December before pausing.
-
In fixed income markets, previously range-bound global bond yields spiked following the onset of the Middle East conflict, as energy-driven inflation fears appeared to have rattled bond investors. US rate volatility (as measured by the Merrill Lynch Option Volatility Estimate (MOVE) Index) similarly rose from intra-period lows, reflecting uncertainty around the scope and duration of the conflict and its implications for global growth. However, volatility later retracted as the risk of a broader regional military escalation appeared less likely. Global credit spreads widened only modestly before stabilizing near prior levels, supported by strong demand and resilient underlying fundamentals.
-
Top contributors to performance relative to the Bloomberg U.S. Aggregate Bond Index:
-
The fund's underweight exposure to the treasury sector and out-of-benchmark exposure to the collateralized mortgage obligation (CMO) sector aided relative returns. Favorable security selection within the industrials sector also supported relative results.
-
From a quality perspective, the fund’s out-of-benchmark exposure to BB-rated bonds benefited relative returns. Security selection within BBB-rated bonds was another positive factor for relative performance.
-
-
Top detractors from performance relative to the Bloomberg U.S. Aggregate Bond Index:
-
The fund’s underweight exposure to the mortgage backed securities (MBS) agency fixed rate sector weighed on relative performance. Not owning any securities within the government-related sovereign sector also held back relative returns.
-
FUND PERFORMANCE
The fund’s past performance is not a good predictor of the fund’s future performance. The graph and table below do not reflect the deduction of taxes that a shareholder would pay on fund distributions or the redemption of fund shares. The graph and table below assume reinvestment of dividends and capital gain distributions.
Growth of a Hypothetical $10,000 Investment
This graph shows the performance of a hypothetical $10,000 investment in Class R4 over a ten year period or since inception, if shorter, in comparison to a broad measure of market performance.
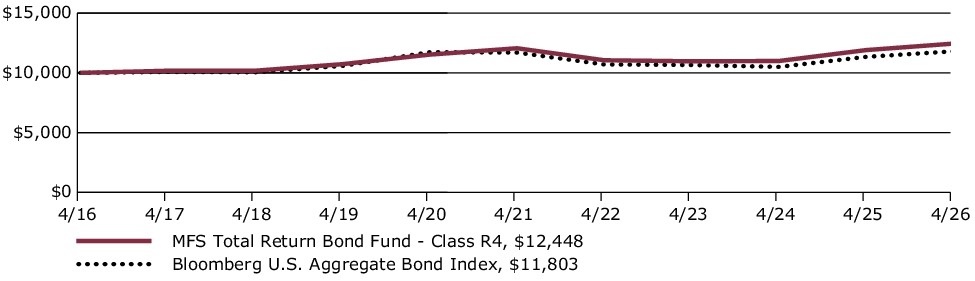
Average Annual Total Returns through 4/30/26
This table shows the average annual total returns of the class of shares noted for the periods shown, both with (if any) and without sales charges. It also shows the average annual total returns of a broad measure of market performance over the same periods.
| Share Class | 1-yr | 5-yr | 10-yr |
| R4 without sales charge | 4.56% | 0.64% | 2.21% |
| Comparative Benchmark(s) | |||
| Bloomberg U.S. Aggregate Bond Index ∆ | 4.06% | 0.18% | 1.67% |
|
∆
|
Source: FactSet Research Systems Inc.
|
Visit mfs.com/perf/r4 for more recent performance information.
FUND STATISTICS AS OF 4/30/26
| Net Assets ($): | 8,274,986,056 | Average Effective Maturity (yrs): | 7.4 | |
| Total Number of Holdings: | 1,074 | Average Effective Duration (yrs): | 5.8 | |
| Total Management Fee ($)#: | 28,761,662 | |||
| Portfolio Turnover Rate (%): | 48 |
# Includes the effect of any management fee waivers, if applicable.
Where the fund holds derivatives, they are not included in the total number of portfolio holdings.
PORTFOLIO COMPOSITION (BASED ON TOTAL INVESTMENTS AS OF 4/30/26)
Portfolio structure
| Fixed Income | 98.5% |
| Money Market Funds | 1.5% |
Composition including fixed income credit quality
| AAA | 13.7% |
| AA | 7.0% |
| A | 10.8% |
| BBB | 22.2% |
| BB | 4.0% |
| B | 1.9% |
| CCC | 0.0% |
| CC | 0.0% |
| U.S. Government | 24.0% |
| Federal Agencies | 14.7% |
| Not Rated | 0.2% |
| Money Market Funds | 1.5% |
Ratings are assigned using Moody’s, Fitch, and Standard & Poor’s and applying a hierarchy: If all 3 agencies rate a security, the middle rating is assigned; if 2 agencies rate a security, the lower rating is assigned. If none of the 3 agencies rate a security, we use DBRS Morningstar. If none of the 4 agencies rate a security, we use Kroll Bond Rating Agency. Ratings are shown in the S&P and Fitch scale (e.g., AAA). All ratings are subject to change.
Ratings are assigned using Moody’s, Fitch, and Standard & Poor’s and applying a hierarchy: If all 3 agencies rate a security, the middle rating is assigned; if 2 agencies rate a security, the lower rating is assigned. If none of the 3 agencies rate a security, we use DBRS Morningstar. If none of the 4 agencies rate a security, we use Kroll Bond Rating Agency. Ratings are shown in the S&P and Fitch scale (e.g., AAA). All ratings are subject to change.
FUND EXPENSES
What were the fund costs for the last year?
| (based on a hypothetical $10,000 investment) | ||
| Class Name | Costs of a $10,000 investment | Costs paid as a percentage of a $10,000 investment |
| R6 | $36 | 0.35% |
MANAGEMENT'S DISCUSSION OF FUND PERFORMANCE
-
For the twelve months ended April 30, 2026, Class R6 shares of the MFS Total Return Bond Fund (fund) provided a total return of 4.66%, at net asset value. This compares with a return of 4.06% for the fund’s benchmark, the Bloomberg U.S. Aggregate Bond Index.
-
Global equity markets reached record levels during the period, withstanding considerable volatility amid tariffs, geopolitical conflict and high levels of uncertainty. A new geopolitical event distressed markets at the end of the period as US and Israeli forces launched strikes against Iran, disrupting Mideast oil and natural gas exports. During the period, a pro-growth tax and spending bill was signed into law in the US, while in Europe, renewed focus on defense and infrastructure spending brightened the economic outlook. In Japan, the election of a pro-growth prime minister sent stocks to new highs prior to the conflict in Iran. Optimism over artificial intelligence remained high.
-
Considerable progress was made in trade talks between the US and many major trading partners, with a fragile truce between the US and China extended through late 2026. While the US Supreme Court struck down part of the Trump administration’s tariff strategy, the administration began deploying other authorities to largely replace the ones that were ruled unconstitutional.
-
Early in the period, moderating inflation pressures allowed many global central banks to ease monetary policy. Amid a difficult policymaking environment and slower job growth, the Federal Reserve resumed easing policy in September and delivered quarter-point rate cuts in October and December before pausing.
-
In fixed income markets, previously range-bound global bond yields spiked following the onset of the Middle East conflict, as energy-driven inflation fears appeared to have rattled bond investors. US rate volatility (as measured by the Merrill Lynch Option Volatility Estimate (MOVE) Index) similarly rose from intra-period lows, reflecting uncertainty around the scope and duration of the conflict and its implications for global growth. However, volatility later retracted as the risk of a broader regional military escalation appeared less likely. Global credit spreads widened only modestly before stabilizing near prior levels, supported by strong demand and resilient underlying fundamentals.
-
Top contributors to performance relative to the Bloomberg U.S. Aggregate Bond Index:
-
The fund's underweight exposure to the treasury sector and out-of-benchmark exposure to the collateralized mortgage obligation (CMO) sector aided relative returns. Favorable security selection within the industrials sector also supported relative results.
-
From a quality perspective, the fund’s out-of-benchmark exposure to BB-rated bonds benefited relative returns. Security selection within BBB-rated bonds was another positive factor for relative performance.
-
-
Top detractors from performance relative to the Bloomberg U.S. Aggregate Bond Index:
-
The fund’s underweight exposure to the mortgage backed securities (MBS) agency fixed rate sector weighed on relative performance. Not owning any securities within the government-related sovereign sector also held back relative returns.
-
FUND PERFORMANCE
The fund’s past performance is not a good predictor of the fund’s future performance. The graph and table below do not reflect the deduction of taxes that a shareholder would pay on fund distributions or the redemption of fund shares. The graph and table below assume reinvestment of dividends and capital gain distributions.
Growth of a Hypothetical $10,000 Investment
This graph shows the performance of a hypothetical $10,000 investment in Class R6 over a ten year period or since inception, if shorter, in comparison to a broad measure of market performance.
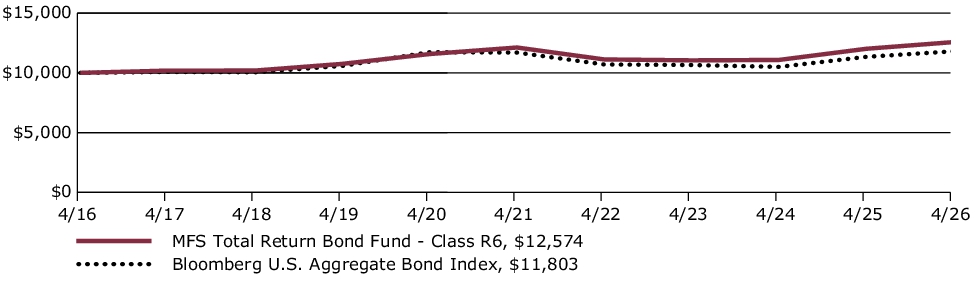
Average Annual Total Returns through 4/30/26
This table shows the average annual total returns of the class of shares noted for the periods shown, both with (if any) and without sales charges. It also shows the average annual total returns of a broad measure of market performance over the same periods.
| Share Class | 1-yr | 5-yr | 10-yr |
| R6 without sales charge | 4.66% | 0.74% | 2.32% |
| Comparative Benchmark(s) | |||
| Bloomberg U.S. Aggregate Bond Index ∆ | 4.06% | 0.18% | 1.67% |
|
∆
|
Source: FactSet Research Systems Inc.
|
Visit mfs.com/perf/r6 for more recent performance information.
FUND STATISTICS AS OF 4/30/26
| Net Assets ($): | 8,274,986,056 | Average Effective Maturity (yrs): | 7.4 | |
| Total Number of Holdings: | 1,074 | Average Effective Duration (yrs): | 5.8 | |
| Total Management Fee ($)#: | 28,761,662 | |||
| Portfolio Turnover Rate (%): | 48 |
# Includes the effect of any management fee waivers, if applicable.
Where the fund holds derivatives, they are not included in the total number of portfolio holdings.
PORTFOLIO COMPOSITION (BASED ON TOTAL INVESTMENTS AS OF 4/30/26)
Portfolio structure
| Fixed Income | 98.5% |
| Money Market Funds | 1.5% |
Composition including fixed income credit quality
| AAA | 13.7% |
| AA | 7.0% |
| A | 10.8% |
| BBB | 22.2% |
| BB | 4.0% |
| B | 1.9% |
| CCC | 0.0% |
| CC | 0.0% |
| U.S. Government | 24.0% |
| Federal Agencies | 14.7% |
| Not Rated | 0.2% |
| Money Market Funds | 1.5% |
Ratings are assigned using Moody’s, Fitch, and Standard & Poor’s and applying a hierarchy: If all 3 agencies rate a security, the middle rating is assigned; if 2 agencies rate a security, the lower rating is assigned. If none of the 3 agencies rate a security, we use DBRS Morningstar. If none of the 4 agencies rate a security, we use Kroll Bond Rating Agency. Ratings are shown in the S&P and Fitch scale (e.g., AAA). All ratings are subject to change.
Ratings are assigned using Moody’s, Fitch, and Standard & Poor’s and applying a hierarchy: If all 3 agencies rate a security, the middle rating is assigned; if 2 agencies rate a security, the lower rating is assigned. If none of the 3 agencies rate a security, we use DBRS Morningstar. If none of the 4 agencies rate a security, we use Kroll Bond Rating Agency. Ratings are shown in the S&P and Fitch scale (e.g., AAA). All ratings are subject to change.
FUND EXPENSES
What were the fund costs for the last year?
| (based on a hypothetical $10,000 investment) | ||
| Class Name | Costs of a $10,000 investment | Costs paid as a percentage of a $10,000 investment |
| B | $154 | 1.51% |
MANAGEMENT'S DISCUSSION OF FUND PERFORMANCE
-
For the twelve months ended April 30, 2026, Class B shares of the MFS Corporate Bond Fund (fund) provided a total return of 4.42%, at net asset value. This compares with a return of 4.06% for the fund’s benchmark, the Bloomberg U.S. Aggregate Bond Index. The fund's other benchmark, the Bloomberg U.S. Credit Index, generated a return of 5.25%.
-
Global equity markets reached record levels during the period, withstanding considerable volatility amid tariffs, geopolitical conflict and high levels of uncertainty. A new geopolitical event distressed markets at the end of the period as US and Israeli forces launched strikes against Iran, disrupting Mideast oil and natural gas exports. During the period, a pro-growth tax and spending bill was signed into law in the US, while in Europe, renewed focus on defense and infrastructure spending brightened the economic outlook. In Japan, the election of a pro-growth prime minister sent stocks to new highs prior to the conflict in Iran. Optimism over artificial intelligence remained high.
-
Considerable progress was made in trade talks between the US and many major trading partners, with a fragile truce between the US and China extended through late 2026. While the US Supreme Court struck down part of the Trump administration’s tariff strategy, the administration began deploying other authorities to largely replace the ones that were ruled unconstitutional.
-
Early in the period, moderating inflation pressures allowed many global central banks to ease monetary policy. Amid a difficult policymaking environment and slower job growth, the Federal Reserve resumed easing policy in September and delivered quarter-point rate cuts in October and December before pausing.
-
In fixed income markets, previously range-bound global bond yields spiked following the onset of the Middle East conflict, as energy-driven inflation fears appeared to have rattled bond investors. US rate volatility (as measured by the Merrill Lynch Option Volatility Estimate (MOVE) Index) similarly rose from intra-period lows, reflecting uncertainty around the scope and duration of the conflict and its implications for global growth. However, volatility later retracted as the risk of a broader regional military escalation appeared less likely. Global credit spreads widened only modestly before stabilizing near prior levels, supported by strong demand and resilient underlying fundamentals.
-
Top contributors to performance relative to the Bloomberg U.S. Credit Index:
-
The fund's out-of-benchmark exposure to both the BB and B-rated credit quality segments, and its overweight exposure to BBB-rated bonds, supported relative performance.
-
Favorable security selection within both A and BBB-rated bonds, particularly within the communications sector, also contributed to the fund's relative returns.
-
-
Top detractors from performance relative to the Bloomberg U.S. Credit Index:
-
The fund's underweight exposure to A-rated bonds held back relative performance.
-
Security selection within the energy sector also weakened relative returns.
-
FUND PERFORMANCE
The fund’s past performance is not a good predictor of the fund’s future performance. The graph and table below do not reflect the deduction of taxes that a shareholder would pay on fund distributions or the redemption of fund shares. The graph and table below assume reinvestment of dividends and capital gain distributions.
Growth of a Hypothetical $10,000 Investment
This graph shows the performance of a hypothetical $10,000 investment in Class B over a ten year period or since inception, if shorter, in comparison to (i) a broad measure of market performance and (ii) an additional index that MFS believes more closely reflects the market segments in which the fund invests.
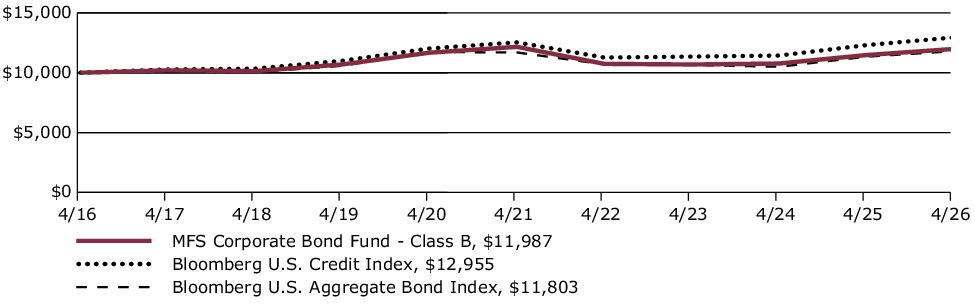
Average Annual Total Returns through 4/30/26
This table shows the average annual total returns of the class of shares noted for the periods shown, both with (if any) and without sales charges. It also shows the average annual total returns of (i) a broad measure of market performance and (ii) an additional index that MFS believes more closely reflects the market segments in which the fund invests, over the same periods.
| Share Class | 1-yr | 5-yr | 10-yr |
| B without sales charge | 4.42% | (0.30)% | 1.83% |
| B with CDSC (declining over six years from 4% to 0%)× | 0.42% | (0.63)% | 1.83% |
| Comparative Benchmark(s) | |||
| Bloomberg U.S. Aggregate Bond Index ∆ | 4.06% | 0.18% | 1.67% |
| Bloomberg U.S. Credit Index ∆ | 5.25% | 0.65% | 2.62% |
|
∆
|
Source: FactSet Research Systems Inc.
|
|
×
|
Assuming redemption at the end of the applicable period.
|
Visit mfs.com/perf/b for more recent performance information.
FUND STATISTICS AS OF 4/30/26
| Net Assets ($): | 4,394,650,297 | Average Effective Maturity (yrs): | 9.3 | |
| Total Number of Holdings: | 427 | Average Effective Duration (yrs): | 6.6 | |
| Total Management Fee ($)#: | 16,745,757 | |||
| Portfolio Turnover Rate (%): | 41 |
# Includes the effect of any management fee waivers, if applicable.
Where the fund holds derivatives, they are not included in the total number of portfolio holdings.
PORTFOLIO COMPOSITION (BASED ON TOTAL INVESTMENTS AS OF 4/30/26)
Portfolio structure
| Fixed Income | 98.2% |
| Money Market Funds | 1.8% |
Composition including fixed income credit
quality
quality
| AAA | 3.2% |
| AA | 2.7% |
| A | 32.1% |
| BBB | 50.0% |
| BB | 7.0% |
| B | 1.9% |
| D | 0.2% |
| U.S. Government | 1.1% |
| Not Rated | 0.0% |
| Money Market Funds | 1.8% |
Ratings are assigned using Moody’s, Fitch, and Standard & Poor’s and applying a hierarchy: If all 3 agencies rate a security, the middle rating is assigned; if 2 agencies rate a security, the lower rating is assigned. If none of the 3 agencies rate a security, we use DBRS Morningstar. If none of the 4 agencies rate a security, we use Kroll Bond Rating Agency. Ratings are shown in the S&P and Fitch scale (e.g., AAA). All ratings are subject to change.
Ratings are assigned using Moody’s, Fitch, and Standard & Poor’s and applying a hierarchy: If all 3 agencies rate a security, the middle rating is assigned; if 2 agencies rate a security, the lower rating is assigned. If none of the 3 agencies rate a security, we use DBRS Morningstar. If none of the 4 agencies rate a security, we use Kroll Bond Rating Agency. Ratings are shown in the S&P and Fitch scale (e.g., AAA). All ratings are subject to change.
FUND EXPENSES
What were the fund costs for the last year?
| (based on a hypothetical $10,000 investment) | ||
| Class Name | Costs of a $10,000 investment | Costs paid as a percentage of a $10,000 investment |
| A | $78 | 0.76% |
MANAGEMENT'S DISCUSSION OF FUND PERFORMANCE
-
For the twelve months ended April 30, 2026, Class A shares of the MFS Corporate Bond Fund (fund) provided a total return of 5.20%, at net asset value. This compares with a return of 4.06% for the fund’s benchmark, the Bloomberg U.S. Aggregate Bond Index. The fund's other benchmark, the Bloomberg U.S. Credit Index, generated a return of 5.25%.
-
Global equity markets reached record levels during the period, withstanding considerable volatility amid tariffs, geopolitical conflict and high levels of uncertainty. A new geopolitical event distressed markets at the end of the period as US and Israeli forces launched strikes against Iran, disrupting Mideast oil and natural gas exports. During the period, a pro-growth tax and spending bill was signed into law in the US, while in Europe, renewed focus on defense and infrastructure spending brightened the economic outlook. In Japan, the election of a pro-growth prime minister sent stocks to new highs prior to the conflict in Iran. Optimism over artificial intelligence remained high.
-
Considerable progress was made in trade talks between the US and many major trading partners, with a fragile truce between the US and China extended through late 2026. While the US Supreme Court struck down part of the Trump administration’s tariff strategy, the administration began deploying other authorities to largely replace the ones that were ruled unconstitutional.
-
Early in the period, moderating inflation pressures allowed many global central banks to ease monetary policy. Amid a difficult policymaking environment and slower job growth, the Federal Reserve resumed easing policy in September and delivered quarter-point rate cuts in October and December before pausing.
-
In fixed income markets, previously range-bound global bond yields spiked following the onset of the Middle East conflict, as energy-driven inflation fears appeared to have rattled bond investors. US rate volatility (as measured by the Merrill Lynch Option Volatility Estimate (MOVE) Index) similarly rose from intra-period lows, reflecting uncertainty around the scope and duration of the conflict and its implications for global growth. However, volatility later retracted as the risk of a broader regional military escalation appeared less likely. Global credit spreads widened only modestly before stabilizing near prior levels, supported by strong demand and resilient underlying fundamentals.
-
Top contributors to performance relative to the Bloomberg U.S. Credit Index:
-
The fund's out-of-benchmark exposure to both the BB and B-rated credit quality segments, and its overweight exposure to BBB-rated bonds, supported relative performance.
-
Favorable security selection within both A and BBB-rated bonds, particularly within the communications sector, also contributed to the fund's relative returns.
-
-
Top detractors from performance relative to the Bloomberg U.S. Credit Index:
-
The fund's underweight exposure to A-rated bonds held back relative performance.
-
Security selection within the energy sector also weakened relative returns.
-
FUND PERFORMANCE
The fund’s past performance is not a good predictor of the fund’s future performance. The graph and table below do not reflect the deduction of taxes that a shareholder would pay on fund distributions or the redemption of fund shares. The graph and table below assume reinvestment of dividends and capital gain distributions.
Growth of a Hypothetical $10,000 Investment
This graph shows the performance of a hypothetical $10,000 investment in Class A over a ten year period or since inception, if shorter, in comparison to (i) a broad measure of market performance and (ii) an additional index that MFS believes more closely reflects the market segments in which the fund invests. This graph includes the deduction of the maximum applicable sales charge.
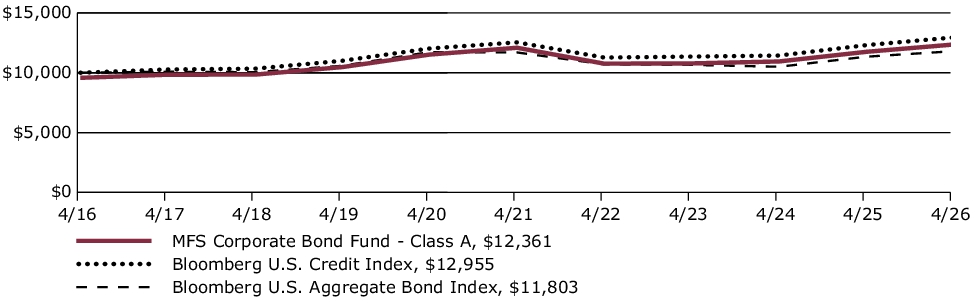
Average Annual Total Returns through 4/30/26
This table shows the average annual total returns of the class of shares noted for the periods shown, both with (if any) and without sales charges. It also shows the average annual total returns of (i) a broad measure of market performance and (ii) an additional index that MFS believes more closely reflects the market segments in which the fund invests, over the same periods.
| Share Class | 1-yr | 5-yr | 10-yr |
| A without sales charge | 5.20% | 0.44% | 2.59% |
| A with initial sales charge (4.25%) | 0.73% | (0.42)% | 2.14% |
| Comparative Benchmark(s) | |||
| Bloomberg U.S. Aggregate Bond Index ∆ | 4.06% | 0.18% | 1.67% |
| Bloomberg U.S. Credit Index ∆ | 5.25% | 0.65% | 2.62% |
|
∆
|
Source: FactSet Research Systems Inc.
|
Visit mfs.com/perf/a for more recent performance information.
FUND STATISTICS AS OF 4/30/26
| Net Assets ($): | 4,394,650,297 | Average Effective Maturity (yrs): | 9.3 | |
| Total Number of Holdings: | 427 | Average Effective Duration (yrs): | 6.6 | |
| Total Management Fee ($)#: | 16,745,757 | |||
| Portfolio Turnover Rate (%): | 41 |
# Includes the effect of any management fee waivers, if applicable.
Where the fund holds derivatives, they are not included in the total number of portfolio holdings.
PORTFOLIO COMPOSITION (BASED ON TOTAL INVESTMENTS AS OF 4/30/26)
Portfolio structure
| Fixed Income | 98.2% |
| Money Market Funds | 1.8% |
Composition including fixed income credit
quality
quality
| AAA | 3.2% |
| AA | 2.7% |
| A | 32.1% |
| BBB | 50.0% |
| BB | 7.0% |
| B | 1.9% |
| D | 0.2% |
| U.S. Government | 1.1% |
| Not Rated | 0.0% |
| Money Market Funds | 1.8% |
Ratings are assigned using Moody’s, Fitch, and Standard & Poor’s and applying a hierarchy: If all 3 agencies rate a security, the middle rating is assigned; if 2 agencies rate a security, the lower rating is assigned. If none of the 3 agencies rate a security, we use DBRS Morningstar. If none of the 4 agencies rate a security, we use Kroll Bond Rating Agency. Ratings are shown in the S&P and Fitch scale (e.g., AAA). All ratings are subject to change.
Ratings are assigned using Moody’s, Fitch, and Standard & Poor’s and applying a hierarchy: If all 3 agencies rate a security, the middle rating is assigned; if 2 agencies rate a security, the lower rating is assigned. If none of the 3 agencies rate a security, we use DBRS Morningstar. If none of the 4 agencies rate a security, we use Kroll Bond Rating Agency. Ratings are shown in the S&P and Fitch scale (e.g., AAA). All ratings are subject to change.
FUND EXPENSES
What were the fund costs for the last year?
| (based on a hypothetical $10,000 investment) | ||
| Class Name | Costs of a $10,000 investment | Costs paid as a percentage of a $10,000 investment |
| R6 | $35 | 0.34% |
MANAGEMENT'S DISCUSSION OF FUND PERFORMANCE
-
For the twelve months ended April 30, 2026, Class R6 shares of the MFS Limited Maturity Fund (fund) provided a total return of 4.28%, at net asset value. This compares with a return of 4.06% for the fund’s benchmark, the Bloomberg U.S. Aggregate Bond Index. The fund's other benchmark, the Bloomberg 1-3 Year U.S. Government/Credit Bond Index, generated a return of 3.42%.
-
Global equity markets reached record levels during the period, withstanding considerable volatility amid tariffs, geopolitical conflict and high levels of uncertainty. A new geopolitical event distressed markets at the end of the period as US and Israeli forces launched strikes against Iran, disrupting Mideast oil and natural gas exports. During the period, a pro-growth tax and spending bill was signed into law in the US, while in Europe, renewed focus on defense and infrastructure spending brightened the economic outlook. In Japan, the election of a pro-growth prime minister sent stocks to new highs prior to the conflict in Iran. Optimism over artificial intelligence remained high.
-
Considerable progress was made in trade talks between the US and many major trading partners, with a fragile truce between the US and China extended through late 2026. While the US Supreme Court struck down part of the Trump administration’s tariff strategy, the administration began deploying other authorities to largely replace the ones that were ruled unconstitutional.
-
Early in the period, moderating inflation pressures allowed many global central banks to ease monetary policy. Amid a difficult policymaking environment and slower job growth, the Federal Reserve resumed easing policy in September and delivered quarter-point rate cuts in October and December before pausing.
-
In fixed income markets, previously range-bound global bond yields spiked following the onset of the Middle East conflict, as energy-driven inflation fears appeared to have rattled bond investors. US rate volatility (as measured by the Merrill Lynch Option Volatility Estimate (MOVE) Index) similarly rose from intra-period lows, reflecting uncertainty around the scope and duration of the conflict and its implications for global growth. However, volatility later retracted as the risk of a broader regional military escalation appeared less likely. Global credit spreads widened only modestly before stabilizing near prior levels, supported by strong demand and resilient underlying fundamentals.
-
Top contributors to performance relative to the Bloomberg 1-3 Year U.S. Government/Credit Bond Index:
-
The fund's out-of-benchmark exposure to the collateralized mortgage obligation (CMO) sector strengthened relative performance. Security selection within the industrials sector also supported relative results.
-
From a quality perspective, security selection within BBB-rated bonds benefited relative returns.
-
-
Top detractors from performance relative to the Bloomberg 1-3 Year U.S. Government/Credit Bond Index:
-
There were no material detractors from relative performance during the reporting period.
-
FUND PERFORMANCE
The fund’s past performance is not a good predictor of the fund’s future performance. The graph and table below do not reflect the deduction of taxes that a shareholder would pay on fund distributions or the redemption of fund shares. The graph and table below assume reinvestment of dividends and capital gain distributions.
Growth of a Hypothetical $10,000 Investment
This graph shows the performance of a hypothetical $10,000 investment in Class R6 over a ten year period or since inception, if shorter, in comparison to (i) a broad measure of market performance and (ii) an additional index that MFS believes more closely reflects the market segments in which the fund invests.
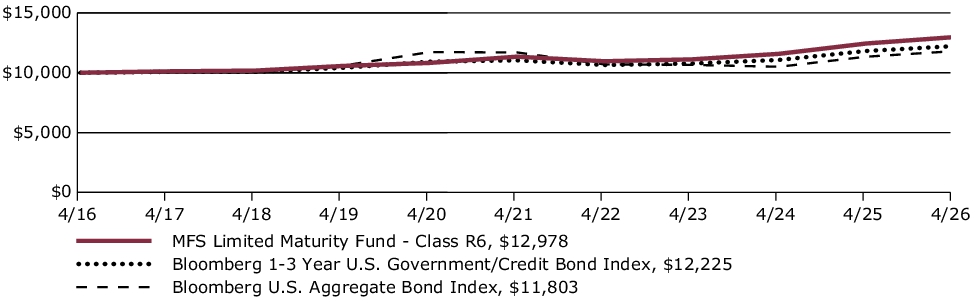
Average Annual Total Returns through 4/30/26
This table shows the average annual total returns of the class of shares noted for the periods shown, both with (if any) and without sales charges. It also shows the average annual total returns of (i) a broad measure of market performance and (ii) an additional index that MFS believes more closely reflects the market segments in which the fund invests, over the same periods.
| Share Class | 1-yr | 5-yr | 10-yr |
| R6 without sales charge | 4.28% | 2.73% | 2.64% |
| Comparative Benchmark(s) | |||
| Bloomberg U.S. Aggregate Bond Index ∆ | 4.06% | 0.18% | 1.67% |
| Bloomberg 1-3 Year U.S. Government/Credit Bond Index ∆ | 3.42% | 2.07% | 2.03% |
|
∆
|
Source: FactSet Research Systems Inc.
|
Visit mfs.com/perf/r6 for more recent performance information.
FUND STATISTICS AS OF 4/30/26
| Net Assets ($): | 3,352,561,328 | Average Effective Maturity (yrs): | 2.9 | |
| Total Number of Holdings: | 396 | Average Effective Duration (yrs): | 2.1 | |
| Total Management Fee ($)#: | 11,048,122 | |||
| Portfolio Turnover Rate (%): | 50 |
# Includes the effect of any management fee waivers, if applicable.
Where the fund holds derivatives, they are not included in the total number of portfolio holdings.
PORTFOLIO COMPOSITION (BASED ON TOTAL INVESTMENTS AS OF 4/30/26)
Portfolio structure
| Fixed Income | 97.2% |
| Money Market Funds | 2.8% |
Composition including fixed income credit quality
| AAA | 12.9% |
| AA | 11.2% |
| A | 18.6% |
| BBB | 31.9% |
| CCC | 0.0% |
| CC | 0.0% |
| U.S. Government | 22.2% |
| Federal Agencies | 0.4% |
| Not Rated | 0.0% |
| Money Market Funds | 2.8% |
Ratings are assigned using Moody’s, Fitch, and Standard & Poor’s and applying a hierarchy: If all 3 agencies rate a security, the middle rating is assigned; if 2 agencies rate a security, the lower rating is assigned. If none of the 3 agencies rate a security, we use DBRS Morningstar. If none of the 4 agencies rate a security, we use Kroll Bond Rating Agency. Ratings are shown in the S&P and Fitch scale (e.g., AAA). All ratings are subject to change.
Ratings are assigned using Moody’s, Fitch, and Standard & Poor’s and applying a hierarchy: If all 3 agencies rate a security, the middle rating is assigned; if 2 agencies rate a security, the lower rating is assigned. If none of the 3 agencies rate a security, we use DBRS Morningstar. If none of the 4 agencies rate a security, we use Kroll Bond Rating Agency. Ratings are shown in the S&P and Fitch scale (e.g., AAA). All ratings are subject to change.
FUND EXPENSES
What were the fund costs for the last year?
| (based on a hypothetical $10,000 investment) | ||
| Class Name | Costs of a $10,000 investment | Costs paid as a percentage of a $10,000 investment |
| C | $154 | 1.51% |
MANAGEMENT'S DISCUSSION OF FUND PERFORMANCE
-
For the twelve months ended April 30, 2026, Class C shares of the MFS Corporate Bond Fund (fund) provided a total return of 4.42%, at net asset value. This compares with a return of 4.06% for the fund’s benchmark, the Bloomberg U.S. Aggregate Bond Index. The fund's other benchmark, the Bloomberg U.S. Credit Index, generated a return of 5.25%.
-
Global equity markets reached record levels during the period, withstanding considerable volatility amid tariffs, geopolitical conflict and high levels of uncertainty. A new geopolitical event distressed markets at the end of the period as US and Israeli forces launched strikes against Iran, disrupting Mideast oil and natural gas exports. During the period, a pro-growth tax and spending bill was signed into law in the US, while in Europe, renewed focus on defense and infrastructure spending brightened the economic outlook. In Japan, the election of a pro-growth prime minister sent stocks to new highs prior to the conflict in Iran. Optimism over artificial intelligence remained high.
-
Considerable progress was made in trade talks between the US and many major trading partners, with a fragile truce between the US and China extended through late 2026. While the US Supreme Court struck down part of the Trump administration’s tariff strategy, the administration began deploying other authorities to largely replace the ones that were ruled unconstitutional.
-
Early in the period, moderating inflation pressures allowed many global central banks to ease monetary policy. Amid a difficult policymaking environment and slower job growth, the Federal Reserve resumed easing policy in September and delivered quarter-point rate cuts in October and December before pausing.
-
In fixed income markets, previously range-bound global bond yields spiked following the onset of the Middle East conflict, as energy-driven inflation fears appeared to have rattled bond investors. US rate volatility (as measured by the Merrill Lynch Option Volatility Estimate (MOVE) Index) similarly rose from intra-period lows, reflecting uncertainty around the scope and duration of the conflict and its implications for global growth. However, volatility later retracted as the risk of a broader regional military escalation appeared less likely. Global credit spreads widened only modestly before stabilizing near prior levels, supported by strong demand and resilient underlying fundamentals.
-
Top contributors to performance relative to the Bloomberg U.S. Credit Index:
-
The fund's out-of-benchmark exposure to both the BB and B-rated credit quality segments, and its overweight exposure to BBB-rated bonds, supported relative performance.
-
Favorable security selection within both A and BBB-rated bonds, particularly within the communications sector, also contributed to the fund's relative returns.
-
-
Top detractors from performance relative to the Bloomberg U.S. Credit Index:
-
The fund's underweight exposure to A-rated bonds held back relative performance.
-
Security selection within the energy sector also weakened relative returns.
-
FUND PERFORMANCE
The fund’s past performance is not a good predictor of the fund’s future performance. The graph and table below do not reflect the deduction of taxes that a shareholder would pay on fund distributions or the redemption of fund shares. The graph and table below assume reinvestment of dividends and capital gain distributions.
Growth of a Hypothetical $10,000 Investment
This graph shows the performance of a hypothetical $10,000 investment in Class C over a ten year period or since inception, if shorter, in comparison to (i) a broad measure of market performance and (ii) an additional index that MFS believes more closely reflects the market segments in which the fund invests.
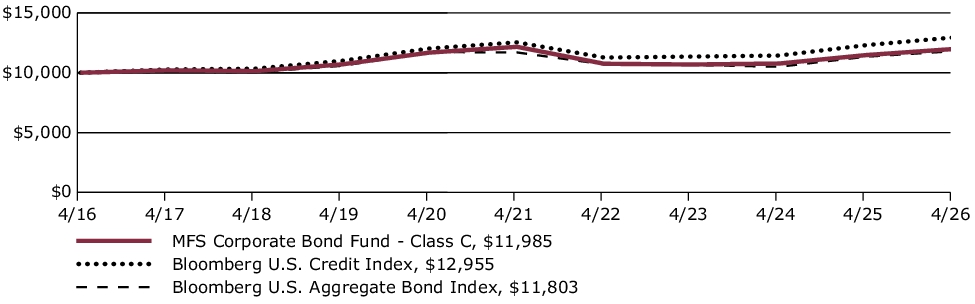
Average Annual Total Returns through 4/30/26
This table shows the average annual total returns of the class of shares noted for the periods shown, both with (if any) and without sales charges. It also shows the average annual total returns of (i) a broad measure of market performance and (ii) an additional index that MFS believes more closely reflects the market segments in which the fund invests, over the same periods.
| Share Class | 1-yr | 5-yr | 10-yr |
| C without sales charge | 4.42% | (0.30)% | 1.83% |
| C with CDSC (1% for 12 months)× | 3.42% | (0.30)% | 1.83% |
| Comparative Benchmark(s) | |||
| Bloomberg U.S. Aggregate Bond Index ∆ | 4.06% | 0.18% | 1.67% |
| Bloomberg U.S. Credit Index ∆ | 5.25% | 0.65% | 2.62% |
|
∆
|
Source: FactSet Research Systems Inc.
|
|
×
|
Assuming redemption at the end of the applicable period.
|
Visit mfs.com/perf/c for more recent performance information.
FUND STATISTICS AS OF 4/30/26
| Net Assets ($): | 4,394,650,297 | Average Effective Maturity (yrs): | 9.3 | |
| Total Number of Holdings: | 427 | Average Effective Duration (yrs): | 6.6 | |
| Total Management Fee ($)#: | 16,745,757 | |||
| Portfolio Turnover Rate (%): | 41 |
# Includes the effect of any management fee waivers, if applicable.
Where the fund holds derivatives, they are not included in the total number of portfolio holdings.
PORTFOLIO COMPOSITION (BASED ON TOTAL INVESTMENTS AS OF 4/30/26)
Portfolio structure
| Fixed Income | 98.2% |
| Money Market Funds | 1.8% |
Composition including fixed income credit
quality
quality
| AAA | 3.2% |
| AA | 2.7% |
| A | 32.1% |
| BBB | 50.0% |
| BB | 7.0% |
| B | 1.9% |
| D | 0.2% |
| U.S. Government | 1.1% |
| Not Rated | 0.0% |
| Money Market Funds | 1.8% |
Ratings are assigned using Moody’s, Fitch, and Standard & Poor’s and applying a hierarchy: If all 3 agencies rate a security, the middle rating is assigned; if 2 agencies rate a security, the lower rating is assigned. If none of the 3 agencies rate a security, we use DBRS Morningstar. If none of the 4 agencies rate a security, we use Kroll Bond Rating Agency. Ratings are shown in the S&P and Fitch scale (e.g., AAA). All ratings are subject to change.
Ratings are assigned using Moody’s, Fitch, and Standard & Poor’s and applying a hierarchy: If all 3 agencies rate a security, the middle rating is assigned; if 2 agencies rate a security, the lower rating is assigned. If none of the 3 agencies rate a security, we use DBRS Morningstar. If none of the 4 agencies rate a security, we use Kroll Bond Rating Agency. Ratings are shown in the S&P and Fitch scale (e.g., AAA). All ratings are subject to change.
FUND EXPENSES
What were the fund costs for the last year?
| (based on a hypothetical $10,000 investment) | ||
| Class Name | Costs of a $10,000 investment | Costs paid as a percentage of a $10,000 investment |
| I | $52 | 0.51% |
MANAGEMENT'S DISCUSSION OF FUND PERFORMANCE
-
For the twelve months ended April 30, 2026, Class I shares of the MFS Corporate Bond Fund (fund) provided a total return of 5.55%, at net asset value. This compares with a return of 4.06% for the fund’s benchmark, the Bloomberg U.S. Aggregate Bond Index. The fund's other benchmark, the Bloomberg U.S. Credit Index, generated a return of 5.25%.
-
Global equity markets reached record levels during the period, withstanding considerable volatility amid tariffs, geopolitical conflict and high levels of uncertainty. A new geopolitical event distressed markets at the end of the period as US and Israeli forces launched strikes against Iran, disrupting Mideast oil and natural gas exports. During the period, a pro-growth tax and spending bill was signed into law in the US, while in Europe, renewed focus on defense and infrastructure spending brightened the economic outlook. In Japan, the election of a pro-growth prime minister sent stocks to new highs prior to the conflict in Iran. Optimism over artificial intelligence remained high.
-
Considerable progress was made in trade talks between the US and many major trading partners, with a fragile truce between the US and China extended through late 2026. While the US Supreme Court struck down part of the Trump administration’s tariff strategy, the administration began deploying other authorities to largely replace the ones that were ruled unconstitutional.
-
Early in the period, moderating inflation pressures allowed many global central banks to ease monetary policy. Amid a difficult policymaking environment and slower job growth, the Federal Reserve resumed easing policy in September and delivered quarter-point rate cuts in October and December before pausing.
-
In fixed income markets, previously range-bound global bond yields spiked following the onset of the Middle East conflict, as energy-driven inflation fears appeared to have rattled bond investors. US rate volatility (as measured by the Merrill Lynch Option Volatility Estimate (MOVE) Index) similarly rose from intra-period lows, reflecting uncertainty around the scope and duration of the conflict and its implications for global growth. However, volatility later retracted as the risk of a broader regional military escalation appeared less likely. Global credit spreads widened only modestly before stabilizing near prior levels, supported by strong demand and resilient underlying fundamentals.
-
Top contributors to performance relative to the Bloomberg U.S. Credit Index:
-
The fund's out-of-benchmark exposure to both the BB and B-rated credit quality segments, and its overweight exposure to BBB-rated bonds, supported relative performance.
-
Favorable security selection within both A and BBB-rated bonds, particularly within the communications sector, also contributed to the fund's relative returns.
-
-
Top detractors from performance relative to the Bloomberg U.S. Credit Index:
-
The fund's underweight exposure to A-rated bonds held back relative performance.
-
Security selection within the energy sector also weakened relative returns.
-
FUND PERFORMANCE
The fund’s past performance is not a good predictor of the fund’s future performance. The graph and table below do not reflect the deduction of taxes that a shareholder would pay on fund distributions or the redemption of fund shares. The graph and table below assume reinvestment of dividends and capital gain distributions.
Growth of a Hypothetical $10,000 Investment
This graph shows the performance of a hypothetical $10,000 investment in Class I over a ten year period or since inception, if shorter, in comparison to (i) a broad measure of market performance and (ii) an additional index that MFS believes more closely reflects the market segments in which the fund invests.
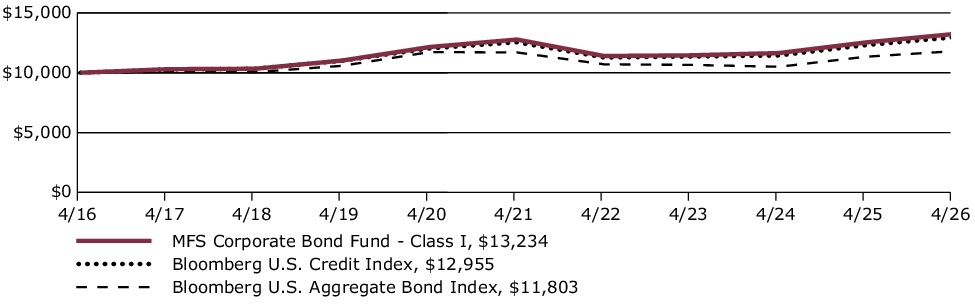
Average Annual Total Returns through 4/30/26
This table shows the average annual total returns of the class of shares noted for the periods shown, both with (if any) and without sales charges. It also shows the average annual total returns of (i) a broad measure of market performance and (ii) an additional index that MFS believes more closely reflects the market segments in which the fund invests, over the same periods.
| Share Class | 1-yr | 5-yr | 10-yr |
| I without sales charge | 5.55% | 0.71% | 2.84% |
| Comparative Benchmark(s) | |||
| Bloomberg U.S. Aggregate Bond Index ∆ | 4.06% | 0.18% | 1.67% |
| Bloomberg U.S. Credit Index ∆ | 5.25% | 0.65% | 2.62% |
|
∆
|
Source: FactSet Research Systems Inc.
|
Visit mfs.com/perf/i for more recent performance information.
FUND STATISTICS AS OF 4/30/26
| Net Assets ($): | 4,394,650,297 | Average Effective Maturity (yrs): | 9.3 | |
| Total Number of Holdings: | 427 | Average Effective Duration (yrs): | 6.6 | |
| Total Management Fee ($)#: | 16,745,757 | |||
| Portfolio Turnover Rate (%): | 41 |
# Includes the effect of any management fee waivers, if applicable.
Where the fund holds derivatives, they are not included in the total number of portfolio holdings.
PORTFOLIO COMPOSITION (BASED ON TOTAL INVESTMENTS AS OF 4/30/26)
Portfolio structure
| Fixed Income | 98.2% |
| Money Market Funds | 1.8% |
Composition including fixed income credit quality
| AAA | 3.2% |
| AA | 2.7% |
| A | 32.1% |
| BBB | 50.0% |
| BB | 7.0% |
| B | 1.9% |
| D | 0.2% |
| U.S. Government | 1.1% |
| Not Rated | 0.0% |
| Money Market Funds | 1.8% |
Ratings are assigned using Moody’s, Fitch, and Standard & Poor’s and applying a hierarchy: If all 3 agencies rate a security, the middle rating is assigned; if 2 agencies rate a security, the lower rating is assigned. If none of the 3 agencies rate a security, we use DBRS Morningstar. If none of the 4 agencies rate a security, we use Kroll Bond Rating Agency. Ratings are shown in the S&P and Fitch scale (e.g., AAA). All ratings are subject to change.
Ratings are assigned using Moody’s, Fitch, and Standard & Poor’s and applying a hierarchy: If all 3 agencies rate a security, the middle rating is assigned; if 2 agencies rate a security, the lower rating is assigned. If none of the 3 agencies rate a security, we use DBRS Morningstar. If none of the 4 agencies rate a security, we use Kroll Bond Rating Agency. Ratings are shown in the S&P and Fitch scale (e.g., AAA). All ratings are subject to change.
FUND EXPENSES
What were the fund costs for the last year?
| (based on a hypothetical $10,000 investment) | ||
| Class Name | Costs of a $10,000 investment | Costs paid as a percentage of a $10,000 investment |
| R1 | $154 | 1.51% |
MANAGEMENT'S DISCUSSION OF FUND PERFORMANCE
-
For the twelve months ended April 30, 2026, Class R1 shares of the MFS Corporate Bond Fund (fund) provided a total return of 4.51%, at net asset value. This compares with a return of 4.06% for the fund’s benchmark, the Bloomberg U.S. Aggregate Bond Index. The fund's other benchmark, the Bloomberg U.S. Credit Index, generated a return of 5.25%.
-
Global equity markets reached record levels during the period, withstanding considerable volatility amid tariffs, geopolitical conflict and high levels of uncertainty. A new geopolitical event distressed markets at the end of the period as US and Israeli forces launched strikes against Iran, disrupting Mideast oil and natural gas exports. During the period, a pro-growth tax and spending bill was signed into law in the US, while in Europe, renewed focus on defense and infrastructure spending brightened the economic outlook. In Japan, the election of a pro-growth prime minister sent stocks to new highs prior to the conflict in Iran. Optimism over artificial intelligence remained high.
-
Considerable progress was made in trade talks between the US and many major trading partners, with a fragile truce between the US and China extended through late 2026. While the US Supreme Court struck down part of the Trump administration’s tariff strategy, the administration began deploying other authorities to largely replace the ones that were ruled unconstitutional.
-
Early in the period, moderating inflation pressures allowed many global central banks to ease monetary policy. Amid a difficult policymaking environment and slower job growth, the Federal Reserve resumed easing policy in September and delivered quarter-point rate cuts in October and December before pausing.
-
In fixed income markets, previously range-bound global bond yields spiked following the onset of the Middle East conflict, as energy-driven inflation fears appeared to have rattled bond investors. US rate volatility (as measured by the Merrill Lynch Option Volatility Estimate (MOVE) Index) similarly rose from intra-period lows, reflecting uncertainty around the scope and duration of the conflict and its implications for global growth. However, volatility later retracted as the risk of a broader regional military escalation appeared less likely. Global credit spreads widened only modestly before stabilizing near prior levels, supported by strong demand and resilient underlying fundamentals.
-
Top contributors to performance relative to the Bloomberg U.S. Credit Index:
-
The fund's out-of-benchmark exposure to both the BB and B-rated credit quality segments, and its overweight exposure to BBB-rated bonds, supported relative performance.
-
Favorable security selection within both A and BBB-rated bonds, particularly within the communications sector, also contributed to the fund's relative returns.
-
-
Top detractors from performance relative to the Bloomberg U.S. Credit Index:
-
The fund's underweight exposure to A-rated bonds held back relative performance.
-
Security selection within the energy sector also weakened relative returns.
-
FUND PERFORMANCE
The fund’s past performance is not a good predictor of the fund’s future performance. The graph and table below do not reflect the deduction of taxes that a shareholder would pay on fund distributions or the redemption of fund shares. The graph and table below assume reinvestment of dividends and capital gain distributions.
Growth of a Hypothetical $10,000 Investment
This graph shows the performance of a hypothetical $10,000 investment in Class R1 over a ten year period or since inception, if shorter, in comparison to (i) a broad measure of market performance and (ii) an additional index that MFS believes more closely reflects the market segments in which the fund invests.

Average Annual Total Returns through 4/30/26
This table shows the average annual total returns of the class of shares noted for the periods shown, both with (if any) and without sales charges. It also shows the average annual total returns of (i) a broad measure of market performance and (ii) an additional index that MFS believes more closely reflects the market segments in which the fund invests, over the same periods.
| Share Class | 1-yr | 5-yr | 10-yr |
| R1 without sales charge | 4.51% | (0.28)% | 1.84% |
| Comparative Benchmark(s) | |||
| Bloomberg U.S. Aggregate Bond Index ∆ | 4.06% | 0.18% | 1.67% |
| Bloomberg U.S. Credit Index ∆ | 5.25% | 0.65% | 2.62% |
|
∆
|
Source: FactSet Research Systems Inc.
|
Visit mfs.com/perf/r1 for more recent performance information.
FUND STATISTICS AS OF 4/30/26
| Net Assets ($): | 4,394,650,297 | Average Effective Maturity (yrs): | 9.3 | |
| Total Number of Holdings: | 427 | Average Effective Duration (yrs): | 6.6 | |
| Total Management Fee ($)#: | 16,745,757 | |||
| Portfolio Turnover Rate (%): | 41 |
# Includes the effect of any management fee waivers, if applicable.
Where the fund holds derivatives, they are not included in the total number of portfolio holdings.
PORTFOLIO COMPOSITION (BASED ON TOTAL INVESTMENTS AS OF 4/30/26)
Portfolio structure
| Fixed Income | 98.2% |
| Money Market Funds | 1.8% |
Composition including fixed income credit quality
| AAA | 3.2% |
| AA | 2.7% |
| A | 32.1% |
| BBB | 50.0% |
| BB | 7.0% |
| B | 1.9% |
| D | 0.2% |
| U.S. Government | 1.1% |
| Not Rated | 0.0% |
| Money Market Funds | 1.8% |
Ratings are assigned using Moody’s, Fitch, and Standard & Poor’s and applying a hierarchy: If all 3 agencies rate a security, the middle rating is assigned; if 2 agencies rate a security, the lower rating is assigned. If none of the 3 agencies rate a security, we use DBRS Morningstar. If none of the 4 agencies rate a security, we use Kroll Bond Rating Agency. Ratings are shown in the S&P and Fitch scale (e.g., AAA). All ratings are subject to change.
Ratings are assigned using Moody’s, Fitch, and Standard & Poor’s and applying a hierarchy: If all 3 agencies rate a security, the middle rating is assigned; if 2 agencies rate a security, the lower rating is assigned. If none of the 3 agencies rate a security, we use DBRS Morningstar. If none of the 4 agencies rate a security, we use Kroll Bond Rating Agency. Ratings are shown in the S&P and Fitch scale (e.g., AAA). All ratings are subject to change.
FUND EXPENSES
What were the fund costs for the last year?
| (based on a hypothetical $10,000 investment) | ||
| Class Name | Costs of a $10,000 investment | Costs paid as a percentage of a $10,000 investment |
| R2 | $103 | 1.01% |
MANAGEMENT'S DISCUSSION OF FUND PERFORMANCE
-
For the twelve months ended April 30, 2026, Class R2 shares of the MFS Corporate Bond Fund (fund) provided a total return of 4.94%, at net asset value. This compares with a return of 4.06% for the fund’s benchmark, the Bloomberg U.S. Aggregate Bond Index. The fund's other benchmark, the Bloomberg U.S. Credit Index, generated a return of 5.25%.
-
Global equity markets reached record levels during the period, withstanding considerable volatility amid tariffs, geopolitical conflict and high levels of uncertainty. A new geopolitical event distressed markets at the end of the period as US and Israeli forces launched strikes against Iran, disrupting Mideast oil and natural gas exports. During the period, a pro-growth tax and spending bill was signed into law in the US, while in Europe, renewed focus on defense and infrastructure spending brightened the economic outlook. In Japan, the election of a pro-growth prime minister sent stocks to new highs prior to the conflict in Iran. Optimism over artificial intelligence remained high.
-
Considerable progress was made in trade talks between the US and many major trading partners, with a fragile truce between the US and China extended through late 2026. While the US Supreme Court struck down part of the Trump administration’s tariff strategy, the administration began deploying other authorities to largely replace the ones that were ruled unconstitutional.
-
Early in the period, moderating inflation pressures allowed many global central banks to ease monetary policy. Amid a difficult policymaking environment and slower job growth, the Federal Reserve resumed easing policy in September and delivered quarter-point rate cuts in October and December before pausing.
-
In fixed income markets, previously range-bound global bond yields spiked following the onset of the Middle East conflict, as energy-driven inflation fears appeared to have rattled bond investors. US rate volatility (as measured by the Merrill Lynch Option Volatility Estimate (MOVE) Index) similarly rose from intra-period lows, reflecting uncertainty around the scope and duration of the conflict and its implications for global growth. However, volatility later retracted as the risk of a broader regional military escalation appeared less likely. Global credit spreads widened only modestly before stabilizing near prior levels, supported by strong demand and resilient underlying fundamentals.
-
Top contributors to performance relative to the Bloomberg U.S. Credit Index:
-
The fund's out-of-benchmark exposure to both the BB and B-rated credit quality segments, and its overweight exposure to BBB-rated bonds, supported relative performance.
-
Favorable security selection within both A and BBB-rated bonds, particularly within the communications sector, also contributed to the fund's relative returns.
-
-
Top detractors from performance relative to the Bloomberg U.S. Credit Index:
-
The fund's underweight exposure to A-rated bonds held back relative performance.
-
Security selection within the energy sector also weakened relative returns.
-
FUND PERFORMANCE
The fund’s past performance is not a good predictor of the fund’s future performance. The graph and table below do not reflect the deduction of taxes that a shareholder would pay on fund distributions or the redemption of fund shares. The graph and table below assume reinvestment of dividends and capital gain distributions.
Growth of a Hypothetical $10,000 Investment
This graph shows the performance of a hypothetical $10,000 investment in Class R2 over a ten year period or since inception, if shorter, in comparison to (i) a broad measure of market performance and (ii) an additional index that MFS believes more closely reflects the market segments in which the fund invests.
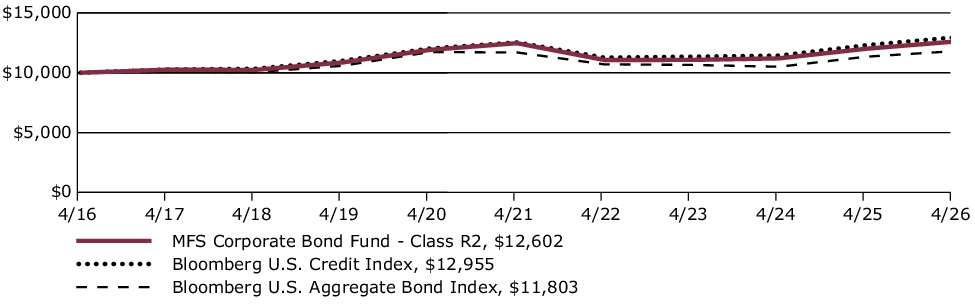
Average Annual Total Returns through 4/30/26
This table shows the average annual total returns of the class of shares noted for the periods shown, both with (if any) and without sales charges. It also shows the average annual total returns of (i) a broad measure of market performance and (ii) an additional index that MFS believes more closely reflects the market segments in which the fund invests, over the same periods.
| Share Class | 1-yr | 5-yr | 10-yr |
| R2 without sales charge | 4.94% | 0.21% | 2.34% |
| Comparative Benchmark(s) | |||
| Bloomberg U.S. Aggregate Bond Index ∆ | 4.06% | 0.18% | 1.67% |
| Bloomberg U.S. Credit Index ∆ | 5.25% | 0.65% | 2.62% |
|
∆
|
Source: FactSet Research Systems Inc.
|
Visit mfs.com/perf/r2 for more recent performance information.
FUND STATISTICS AS OF 4/30/26
| Net Assets ($): | 4,394,650,297 | Average Effective Maturity (yrs): | 9.3 | |
| Total Number of Holdings: | 427 | Average Effective Duration (yrs): | 6.6 | |
| Total Management Fee ($)#: | 16,745,757 | |||
| Portfolio Turnover Rate (%): | 41 |
# Includes the effect of any management fee waivers, if applicable.
Where the fund holds derivatives, they are not included in the total number of portfolio holdings.
PORTFOLIO COMPOSITION (BASED ON TOTAL INVESTMENTS AS OF 4/30/26)
Portfolio structure
| Fixed Income | 98.2% |
| Money Market Funds | 1.8% |
Composition including fixed income credit quality
| AAA | 3.2% |
| AA | 2.7% |
| A | 32.1% |
| BBB | 50.0% |
| BB | 7.0% |
| B | 1.9% |
| D | 0.2% |
| U.S. Government | 1.1% |
| Not Rated | 0.0% |
| Money Market Funds | 1.8% |
Ratings are assigned using Moody’s, Fitch, and Standard & Poor’s and applying a hierarchy: If all 3 agencies rate a security, the middle rating is assigned; if 2 agencies rate a security, the lower rating is assigned. If none of the 3 agencies rate a security, we use DBRS Morningstar. If none of the 4 agencies rate a security, we use Kroll Bond Rating Agency. Ratings are shown in the S&P and Fitch scale (e.g., AAA). All ratings are subject to change.
Ratings are assigned using Moody’s, Fitch, and Standard & Poor’s and applying a hierarchy: If all 3 agencies rate a security, the middle rating is assigned; if 2 agencies rate a security, the lower rating is assigned. If none of the 3 agencies rate a security, we use DBRS Morningstar. If none of the 4 agencies rate a security, we use Kroll Bond Rating Agency. Ratings are shown in the S&P and Fitch scale (e.g., AAA). All ratings are subject to change.
FUND EXPENSES
What were the fund costs for the last year?
| (based on a hypothetical $10,000 investment) | ||
| Class Name | Costs of a $10,000 investment | Costs paid as a percentage of a $10,000 investment |
| R3 | $78 | 0.76% |
MANAGEMENT'S DISCUSSION OF FUND PERFORMANCE
-
For the twelve months ended April 30, 2026, Class R3 shares of the MFS Corporate Bond Fund (fund) provided a total return of 5.20%, at net asset value. This compares with a return of 4.06% for the fund’s benchmark, the Bloomberg U.S. Aggregate Bond Index. The fund's other benchmark, the Bloomberg U.S. Credit Index, generated a return of 5.25%.
-
Global equity markets reached record levels during the period, withstanding considerable volatility amid tariffs, geopolitical conflict and high levels of uncertainty. A new geopolitical event distressed markets at the end of the period as US and Israeli forces launched strikes against Iran, disrupting Mideast oil and natural gas exports. During the period, a pro-growth tax and spending bill was signed into law in the US, while in Europe, renewed focus on defense and infrastructure spending brightened the economic outlook. In Japan, the election of a pro-growth prime minister sent stocks to new highs prior to the conflict in Iran. Optimism over artificial intelligence remained high.
-
Considerable progress was made in trade talks between the US and many major trading partners, with a fragile truce between the US and China extended through late 2026. While the US Supreme Court struck down part of the Trump administration’s tariff strategy, the administration began deploying other authorities to largely replace the ones that were ruled unconstitutional.
-
Early in the period, moderating inflation pressures allowed many global central banks to ease monetary policy. Amid a difficult policymaking environment and slower job growth, the Federal Reserve resumed easing policy in September and delivered quarter-point rate cuts in October and December before pausing.
-
In fixed income markets, previously range-bound global bond yields spiked following the onset of the Middle East conflict, as energy-driven inflation fears appeared to have rattled bond investors. US rate volatility (as measured by the Merrill Lynch Option Volatility Estimate (MOVE) Index) similarly rose from intra-period lows, reflecting uncertainty around the scope and duration of the conflict and its implications for global growth. However, volatility later retracted as the risk of a broader regional military escalation appeared less likely. Global credit spreads widened only modestly before stabilizing near prior levels, supported by strong demand and resilient underlying fundamentals.
-
Top contributors to performance relative to the Bloomberg U.S. Credit Index:
-
The fund's out-of-benchmark exposure to both the BB and B-rated credit quality segments, and its overweight exposure to BBB-rated bonds, supported relative performance.
-
Favorable security selection within both A and BBB-rated bonds, particularly within the communications sector, also contributed to the fund's relative returns.
-
-
Top detractors from performance relative to the Bloomberg U.S. Credit Index:
-
The fund's underweight exposure to A-rated bonds held back relative performance.
-
Security selection within the energy sector also weakened relative returns.
-
FUND PERFORMANCE
The fund’s past performance is not a good predictor of the fund’s future performance. The graph and table below do not reflect the deduction of taxes that a shareholder would pay on fund distributions or the redemption of fund shares. The graph and table below assume reinvestment of dividends and capital gain distributions.
Growth of a Hypothetical $10,000 Investment
This graph shows the performance of a hypothetical $10,000 investment in Class R3 over a ten year period or since inception, if shorter, in comparison to (i) a broad measure of market performance and (ii) an additional index that MFS believes more closely reflects the market segments in which the fund invests.
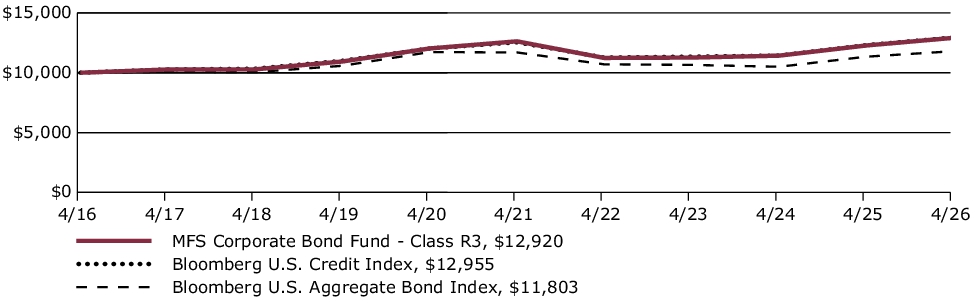
Average Annual Total Returns through 4/30/26
This table shows the average annual total returns of the class of shares noted for the periods shown, both with (if any) and without sales charges. It also shows the average annual total returns of (i) a broad measure of market performance and (ii) an additional index that MFS believes more closely reflects the market segments in which the fund invests, over the same periods.
| Share Class | 1-yr | 5-yr | 10-yr |
| R3 without sales charge | 5.20% | 0.46% | 2.60% |
| Comparative Benchmark(s) | |||
| Bloomberg U.S. Aggregate Bond Index ∆ | 4.06% | 0.18% | 1.67% |
| Bloomberg U.S. Credit Index ∆ | 5.25% | 0.65% | 2.62% |
|
∆
|
Source: FactSet Research Systems Inc.
|
Visit mfs.com/perf/r3 for more recent performance information.
FUND STATISTICS AS OF 4/30/26
| Net Assets ($): | 4,394,650,297 | Average Effective Maturity (yrs): | 9.3 | |
| Total Number of Holdings: | 427 | Average Effective Duration (yrs): | 6.6 | |
| Total Management Fee ($)#: | 16,745,757 | |||
| Portfolio Turnover Rate (%): | 41 |
# Includes the effect of any management fee waivers, if applicable.
Where the fund holds derivatives, they are not included in the total number of portfolio holdings.
PORTFOLIO COMPOSITION (BASED ON TOTAL INVESTMENTS AS OF 4/30/26)
Portfolio structure
| Fixed Income | 98.2% |
| Money Market Funds | 1.8% |
Composition including fixed income credit quality
| AAA | 3.2% |
| AA | 2.7% |
| A | 32.1% |
| BBB | 50.0% |
| BB | 7.0% |
| B | 1.9% |
| D | 0.2% |
| U.S. Government | 1.1% |
| Not Rated | 0.0% |
| Money Market Funds | 1.8% |
Ratings are assigned using Moody’s, Fitch, and Standard & Poor’s and applying a hierarchy: If all 3 agencies rate a security, the middle rating is assigned; if 2 agencies rate a security, the lower rating is assigned. If none of the 3 agencies rate a security, we use DBRS Morningstar. If none of the 4 agencies rate a security, we use Kroll Bond Rating Agency. Ratings are shown in the S&P and Fitch scale (e.g., AAA). All ratings are subject to change.
Ratings are assigned using Moody’s, Fitch, and Standard & Poor’s and applying a hierarchy: If all 3 agencies rate a security, the middle rating is assigned; if 2 agencies rate a security, the lower rating is assigned. If none of the 3 agencies rate a security, we use DBRS Morningstar. If none of the 4 agencies rate a security, we use Kroll Bond Rating Agency. Ratings are shown in the S&P and Fitch scale (e.g., AAA). All ratings are subject to change.
FUND EXPENSES
What were the fund costs for the last year?
| (based on a hypothetical $10,000 investment) | ||
| Class Name | Costs of a $10,000 investment | Costs paid as a percentage of a $10,000 investment |
| R4 | $52 | 0.51% |
MANAGEMENT'S DISCUSSION OF FUND PERFORMANCE
-
For the twelve months ended April 30, 2026, Class R4 shares of the MFS Corporate Bond Fund (fund) provided a total return of 5.63%, at net asset value. This compares with a return of 4.06% for the fund’s benchmark, the Bloomberg U.S. Aggregate Bond Index. The fund's other benchmark, the Bloomberg U.S. Credit Index, generated a return of 5.25%.
-
Global equity markets reached record levels during the period, withstanding considerable volatility amid tariffs, geopolitical conflict and high levels of uncertainty. A new geopolitical event distressed markets at the end of the period as US and Israeli forces launched strikes against Iran, disrupting Mideast oil and natural gas exports. During the period, a pro-growth tax and spending bill was signed into law in the US, while in Europe, renewed focus on defense and infrastructure spending brightened the economic outlook. In Japan, the election of a pro-growth prime minister sent stocks to new highs prior to the conflict in Iran. Optimism over artificial intelligence remained high.
-
Considerable progress was made in trade talks between the US and many major trading partners, with a fragile truce between the US and China extended through late 2026. While the US Supreme Court struck down part of the Trump administration’s tariff strategy, the administration began deploying other authorities to largely replace the ones that were ruled unconstitutional.
-
Early in the period, moderating inflation pressures allowed many global central banks to ease monetary policy. Amid a difficult policymaking environment and slower job growth, the Federal Reserve resumed easing policy in September and delivered quarter-point rate cuts in October and December before pausing.
-
In fixed income markets, previously range-bound global bond yields spiked following the onset of the Middle East conflict, as energy-driven inflation fears appeared to have rattled bond investors. US rate volatility (as measured by the Merrill Lynch Option Volatility Estimate (MOVE) Index) similarly rose from intra-period lows, reflecting uncertainty around the scope and duration of the conflict and its implications for global growth. However, volatility later retracted as the risk of a broader regional military escalation appeared less likely. Global credit spreads widened only modestly before stabilizing near prior levels, supported by strong demand and resilient underlying fundamentals.
-
Top contributors to performance relative to the Bloomberg U.S. Credit Index:
-
The fund's out-of-benchmark exposure to both the BB and B-rated credit quality segments, and its overweight exposure to BBB-rated bonds, supported relative performance.
-
Favorable security selection within both A and BBB-rated bonds, particularly within the communications sector, also contributed to the fund's relative returns.
-
-
Top detractors from performance relative to the Bloomberg U.S. Credit Index:
-
The fund's underweight exposure to A-rated bonds held back relative performance.
-
Security selection within the energy sector also weakened relative returns.
-
FUND PERFORMANCE
The fund’s past performance is not a good predictor of the fund’s future performance. The graph and table below do not reflect the deduction of taxes that a shareholder would pay on fund distributions or the redemption of fund shares. The graph and table below assume reinvestment of dividends and capital gain distributions.
Growth of a Hypothetical $10,000 Investment
This graph shows the performance of a hypothetical $10,000 investment in Class R4 over a ten year period or since inception, if shorter, in comparison to (i) a broad measure of market performance and (ii) an additional index that MFS believes more closely reflects the market segments in which the fund invests.
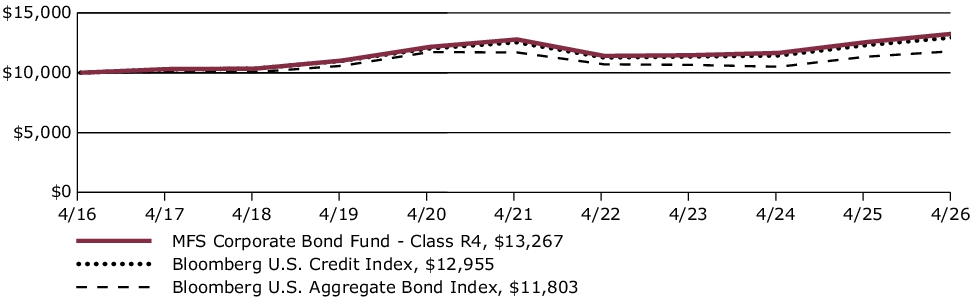
Average Annual Total Returns through 4/30/26
This table shows the average annual total returns of the class of shares noted for the periods shown, both with (if any) and without sales charges. It also shows the average annual total returns of (i) a broad measure of market performance and (ii) an additional index that MFS believes more closely reflects the market segments in which the fund invests, over the same periods.
| Share Class | 1-yr | 5-yr | 10-yr |
| R4 without sales charge | 5.63% | 0.74% | 2.87% |
| Comparative Benchmark(s) | |||
| Bloomberg U.S. Aggregate Bond Index ∆ | 4.06% | 0.18% | 1.67% |
| Bloomberg U.S. Credit Index ∆ | 5.25% | 0.65% | 2.62% |
|
∆
|
Source: FactSet Research Systems Inc.
|
Visit mfs.com/perf/r4 for more recent performance information.
FUND STATISTICS AS OF 4/30/26
| Net Assets ($): | 4,394,650,297 | Average Effective Maturity (yrs): | 9.3 | |
| Total Number of Holdings: | 427 | Average Effective Duration (yrs): | 6.6 | |
| Total Management Fee ($)#: | 16,745,757 | |||
| Portfolio Turnover Rate (%): | 41 |
# Includes the effect of any management fee waivers, if applicable.
Where the fund holds derivatives, they are not included in the total number of portfolio holdings.
PORTFOLIO COMPOSITION (BASED ON TOTAL INVESTMENTS AS OF 4/30/26)
Portfolio structure
| Fixed Income | 98.2% |
| Money Market Funds | 1.8% |
Composition including fixed income credit quality
| AAA | 3.2% |
| AA | 2.7% |
| A | 32.1% |
| BBB | 50.0% |
| BB | 7.0% |
| B | 1.9% |
| D | 0.2% |
| U.S. Government | 1.1% |
| Not Rated | 0.0% |
| Money Market Funds | 1.8% |
Ratings are assigned using Moody’s, Fitch, and Standard & Poor’s and applying a hierarchy: If all 3 agencies rate a security, the middle rating is assigned; if 2 agencies rate a security, the lower rating is assigned. If none of the 3 agencies rate a security, we use DBRS Morningstar. If none of the 4 agencies rate a security, we use Kroll Bond Rating Agency. Ratings are shown in the S&P and Fitch scale (e.g., AAA). All ratings are subject to change.
Ratings are assigned using Moody’s, Fitch, and Standard & Poor’s and applying a hierarchy: If all 3 agencies rate a security, the middle rating is assigned; if 2 agencies rate a security, the lower rating is assigned. If none of the 3 agencies rate a security, we use DBRS Morningstar. If none of the 4 agencies rate a security, we use Kroll Bond Rating Agency. Ratings are shown in the S&P and Fitch scale (e.g., AAA). All ratings are subject to change.
FUND EXPENSES
What were the fund costs for the last year?
| (based on a hypothetical $10,000 investment) | ||
| Class Name | Costs of a $10,000 investment | Costs paid as a percentage of a $10,000 investment |
| R6 | $42 | 0.41% |
MANAGEMENT'S DISCUSSION OF FUND PERFORMANCE
-
For the twelve months ended April 30, 2026, Class R6 shares of the MFS Corporate Bond Fund (fund) provided a total return of 5.65%, at net asset value. This compares with a return of 4.06% for the fund’s benchmark, the Bloomberg U.S. Aggregate Bond Index. The fund's other benchmark, the Bloomberg U.S. Credit Index, generated a return of 5.25%.
-
Global equity markets reached record levels during the period, withstanding considerable volatility amid tariffs, geopolitical conflict and high levels of uncertainty. A new geopolitical event distressed markets at the end of the period as US and Israeli forces launched strikes against Iran, disrupting Mideast oil and natural gas exports. During the period, a pro-growth tax and spending bill was signed into law in the US, while in Europe, renewed focus on defense and infrastructure spending brightened the economic outlook. In Japan, the election of a pro-growth prime minister sent stocks to new highs prior to the conflict in Iran. Optimism over artificial intelligence remained high.
-
Considerable progress was made in trade talks between the US and many major trading partners, with a fragile truce between the US and China extended through late 2026. While the US Supreme Court struck down part of the Trump administration’s tariff strategy, the administration began deploying other authorities to largely replace the ones that were ruled unconstitutional.
-
Early in the period, moderating inflation pressures allowed many global central banks to ease monetary policy. Amid a difficult policymaking environment and slower job growth, the Federal Reserve resumed easing policy in September and delivered quarter-point rate cuts in October and December before pausing.
-
In fixed income markets, previously range-bound global bond yields spiked following the onset of the Middle East conflict, as energy-driven inflation fears appeared to have rattled bond investors. US rate volatility (as measured by the Merrill Lynch Option Volatility Estimate (MOVE) Index) similarly rose from intra-period lows, reflecting uncertainty around the scope and duration of the conflict and its implications for global growth. However, volatility later retracted as the risk of a broader regional military escalation appeared less likely. Global credit spreads widened only modestly before stabilizing near prior levels, supported by strong demand and resilient underlying fundamentals.
-
Top contributors to performance relative to the Bloomberg U.S. Credit Index:
-
The fund's out-of-benchmark exposure to both the BB and B-rated credit quality segments, and its overweight exposure to BBB-rated bonds, supported relative performance.
-
Favorable security selection within both A and BBB-rated bonds, particularly within the communications sector, also contributed to the fund's relative returns.
-
-
Top detractors from performance relative to the Bloomberg U.S. Credit Index:
-
The fund's underweight exposure to A-rated bonds held back relative performance.
-
Security selection within the energy sector also weakened relative returns.
-
FUND PERFORMANCE
The fund’s past performance is not a good predictor of the fund’s future performance. The graph and table below do not reflect the deduction of taxes that a shareholder would pay on fund distributions or the redemption of fund shares. The graph and table below assume reinvestment of dividends and capital gain distributions.
Growth of a Hypothetical $10,000 Investment
This graph shows the performance of a hypothetical $10,000 investment in Class R6 over a ten year period or since inception, if shorter, in comparison to (i) a broad measure of market performance and (ii) an additional index that MFS believes more closely reflects the market segments in which the fund invests.
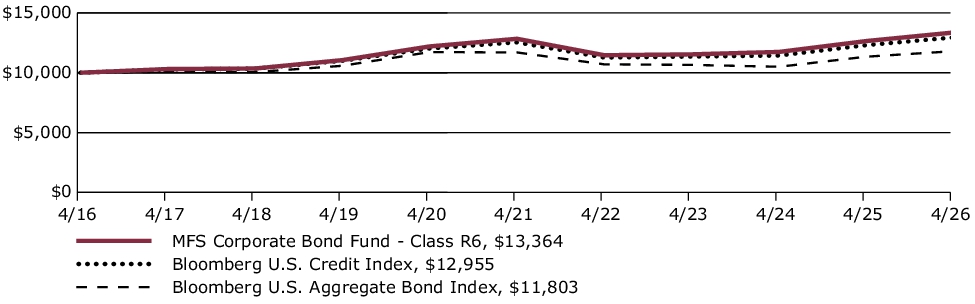
Average Annual Total Returns through 4/30/26
This table shows the average annual total returns of the class of shares noted for the periods shown, both with (if any) and without sales charges. It also shows the average annual total returns of (i) a broad measure of market performance and (ii) an additional index that MFS believes more closely reflects the market segments in which the fund invests, over the same periods.
| Share Class | 1-yr | 5-yr | 10-yr |
| R6 without sales charge | 5.65% | 0.80% | 2.94% |
| Comparative Benchmark(s) | |||
| Bloomberg U.S. Aggregate Bond Index ∆ | 4.06% | 0.18% | 1.67% |
| Bloomberg U.S. Credit Index ∆ | 5.25% | 0.65% | 2.62% |
|
∆
|
Source: FactSet Research Systems Inc.
|
Visit mfs.com/perf/r6 for more recent performance information.
FUND STATISTICS AS OF 4/30/26
| Net Assets ($): | 4,394,650,297 | Average Effective Maturity (yrs): | 9.3 | |
| Total Number of Holdings: | 427 | Average Effective Duration (yrs): | 6.6 | |
| Total Management Fee ($)#: | 16,745,757 | |||
| Portfolio Turnover Rate (%): | 41 |
# Includes the effect of any management fee waivers, if applicable.
Where the fund holds derivatives, they are not included in the total number of portfolio holdings.
PORTFOLIO COMPOSITION (BASED ON TOTAL INVESTMENTS AS OF 4/30/26)
Portfolio structure
| Fixed Income | 98.2% |
| Money Market Funds | 1.8% |
Composition including fixed income credit quality
| AAA | 3.2% |
| AA | 2.7% |
| A | 32.1% |
| BBB | 50.0% |
| BB | 7.0% |
| B | 1.9% |
| D | 0.2% |
| U.S. Government | 1.1% |
| Not Rated | 0.0% |
| Money Market Funds | 1.8% |
Ratings are assigned using Moody’s, Fitch, and Standard & Poor’s and applying a hierarchy: If all 3 agencies rate a security, the middle rating is assigned; if 2 agencies rate a security, the lower rating is assigned. If none of the 3 agencies rate a security, we use DBRS Morningstar. If none of the 4 agencies rate a security, we use Kroll Bond Rating Agency. Ratings are shown in the S&P and Fitch scale (e.g., AAA). All ratings are subject to change.
FUND EXPENSES
What were the fund costs for the last year?
| (based on a hypothetical $10,000 investment) | ||
| Class Name | Costs of a $10,000 investment | Costs paid as a percentage of a $10,000 investment |
| A | $58 | 0.57% |
MANAGEMENT'S DISCUSSION OF FUND PERFORMANCE
-
For the twelve months ended April 30, 2026, Class A shares of the MFS Limited Maturity Fund (fund) provided a total return of 4.04%, at net asset value. This compares with a return of 4.06% for the fund’s benchmark, the Bloomberg U.S. Aggregate Bond Index. The fund's other benchmark, the Bloomberg 1-3 Year U.S. Government/Credit Bond Index, generated a return of 3.42%.
-
Global equity markets reached record levels during the period, withstanding considerable volatility amid tariffs, geopolitical conflict and high levels of uncertainty. A new geopolitical event distressed markets at the end of the period as US and Israeli forces launched strikes against Iran, disrupting Mideast oil and natural gas exports. During the period, a pro-growth tax and spending bill was signed into law in the US, while in Europe, renewed focus on defense and infrastructure spending brightened the economic outlook. In Japan, the election of a pro-growth prime minister sent stocks to new highs prior to the conflict in Iran. Optimism over artificial intelligence remained high.
-
Considerable progress was made in trade talks between the US and many major trading partners, with a fragile truce between the US and China extended through late 2026. While the US Supreme Court struck down part of the Trump administration’s tariff strategy, the administration began deploying other authorities to largely replace the ones that were ruled unconstitutional.
-
Early in the period, moderating inflation pressures allowed many global central banks to ease monetary policy. Amid a difficult policymaking environment and slower job growth, the Federal Reserve resumed easing policy in September and delivered quarter-point rate cuts in October and December before pausing.
-
In fixed income markets, previously range-bound global bond yields spiked following the onset of the Middle East conflict, as energy-driven inflation fears appeared to have rattled bond investors. US rate volatility (as measured by the Merrill Lynch Option Volatility Estimate (MOVE) Index) similarly rose from intra-period lows, reflecting uncertainty around the scope and duration of the conflict and its implications for global growth. However, volatility later retracted as the risk of a broader regional military escalation appeared less likely. Global credit spreads widened only modestly before stabilizing near prior levels, supported by strong demand and resilient underlying fundamentals.
-
Top contributors to performance relative to the Bloomberg 1-3 Year U.S. Government/Credit Bond Index:
-
The fund's out-of-benchmark exposure to the collateralized mortgage obligation (CMO) sector strengthened relative performance. Security selection within the industrials sector also supported relative results.
-
From a quality perspective, security selection within BBB-rated bonds benefited relative returns.
-
-
Top detractors from performance relative to the Bloomberg 1-3 Year U.S. Government/Credit Bond Index:
-
There were no material detractors from relative performance during the reporting period.
-
FUND PERFORMANCE
The fund’s past performance is not a good predictor of the fund’s future performance. The graph and table below do not reflect the deduction of taxes that a shareholder would pay on fund distributions or the redemption of fund shares. The graph and table below assume reinvestment of dividends and capital gain distributions.
Growth of a Hypothetical $10,000 Investment
This graph shows the performance of a hypothetical $10,000 investment in Class A over a ten year period or since inception, if shorter, in comparison to (i) a broad measure of market performance and (ii) an additional index that MFS believes more closely reflects the market segments in which the fund invests. This graph includes the deduction of the maximum applicable sales charge.
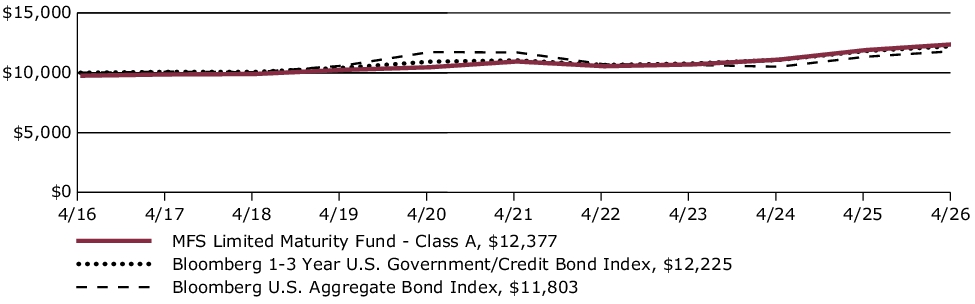
Average Annual Total Returns through 4/30/26
This table shows the average annual total returns of the class of shares noted for the periods shown, both with (if any) and without sales charges. It also shows the average annual total returns of (i) a broad measure of market performance and (ii) an additional index that MFS believes more closely reflects the market segments in which the fund invests, over the same periods.
| Share Class | 1-yr | 5-yr | 10-yr |
| A without sales charge | 4.04% | 2.50% | 2.41% |
| A with initial sales charge (2.50%) | 1.44% | 1.98% | 2.16% |
| Comparative Benchmark(s) | |||
| Bloomberg U.S. Aggregate Bond Index ∆ | 4.06% | 0.18% | 1.67% |
| Bloomberg 1-3 Year U.S. Government/Credit Bond Index ∆ | 3.42% | 2.07% | 2.03% |
|
∆
|
Source: FactSet Research Systems Inc.
|
Visit mfs.com/perf/a for more recent performance information.
FUND STATISTICS AS OF 4/30/26
| Net Assets ($): | 3,352,561,328 | Average Effective Maturity (yrs): | 2.9 | |
| Total Number of Holdings: | 396 | Average Effective Duration (yrs): | 2.1 | |
| Total Management Fee ($)#: | 11,048,122 | |||
| Portfolio Turnover Rate (%): | 50 |
# Includes the effect of any management fee waivers, if applicable.
Where the fund holds derivatives, they are not included in the total number of portfolio holdings.
PORTFOLIO COMPOSITION (BASED ON TOTAL INVESTMENTS AS OF 4/30/26)
Portfolio structure
| Fixed Income | 97.2% |
| Money Market Funds | 2.8% |
Composition including fixed income credit quality
| AAA | 12.9% |
| AA | 11.2% |
| A | 18.6% |
| BBB | 31.9% |
| CCC | 0.0% |
| CC | 0.0% |
| U.S. Government | 22.2% |
| Federal Agencies | 0.4% |
| Not Rated | 0.0% |
| Money Market Funds | 2.8% |
Ratings are assigned using Moody’s, Fitch, and Standard & Poor’s and applying a hierarchy: If all 3 agencies rate a security, the middle rating is assigned; if 2 agencies rate a security, the lower rating is assigned. If none of the 3 agencies rate a security, we use DBRS Morningstar. If none of the 4 agencies rate a security, we use Kroll Bond Rating Agency. Ratings are shown in the S&P and Fitch scale (e.g., AAA). All ratings are subject to change.
FUND EXPENSES
What were the fund costs for the last year?
| (based on a hypothetical $10,000 investment) | ||
| Class Name | Costs of a $10,000 investment | Costs paid as a percentage of a $10,000 investment |
| B | $134 | 1.32% |
MANAGEMENT'S DISCUSSION OF FUND PERFORMANCE
-
For the twelve months ended April 30, 2026, Class B shares of the MFS Limited Maturity Fund (fund) provided a total return of 3.44%, at net asset value. This compares with a return of 4.06% for the fund’s benchmark, the Bloomberg U.S. Aggregate Bond Index. The fund's other benchmark, the Bloomberg 1-3 Year U.S. Government/Credit Bond Index, generated a return of 3.42%.
-
Global equity markets reached record levels during the period, withstanding considerable volatility amid tariffs, geopolitical conflict and high levels of uncertainty. A new geopolitical event distressed markets at the end of the period as US and Israeli forces launched strikes against Iran, disrupting Mideast oil and natural gas exports. During the period, a pro-growth tax and spending bill was signed into law in the US, while in Europe, renewed focus on defense and infrastructure spending brightened the economic outlook. In Japan, the election of a pro-growth prime minister sent stocks to new highs prior to the conflict in Iran. Optimism over artificial intelligence remained high.
-
Considerable progress was made in trade talks between the US and many major trading partners, with a fragile truce between the US and China extended through late 2026. While the US Supreme Court struck down part of the Trump administration’s tariff strategy, the administration began deploying other authorities to largely replace the ones that were ruled unconstitutional.
-
Early in the period, moderating inflation pressures allowed many global central banks to ease monetary policy. Amid a difficult policymaking environment and slower job growth, the Federal Reserve resumed easing policy in September and delivered quarter-point rate cuts in October and December before pausing.
-
In fixed income markets, previously range-bound global bond yields spiked following the onset of the Middle East conflict, as energy-driven inflation fears appeared to have rattled bond investors. US rate volatility (as measured by the Merrill Lynch Option Volatility Estimate (MOVE) Index) similarly rose from intra-period lows, reflecting uncertainty around the scope and duration of the conflict and its implications for global growth. However, volatility later retracted as the risk of a broader regional military escalation appeared less likely. Global credit spreads widened only modestly before stabilizing near prior levels, supported by strong demand and resilient underlying fundamentals.
-
Top contributors to performance relative to the Bloomberg 1-3 Year U.S. Government/Credit Bond Index:
-
The fund's out-of-benchmark exposure to the collateralized mortgage obligation (CMO) sector strengthened relative performance. Security selection within the industrials sector also supported relative results.
-
From a quality perspective, security selection within BBB-rated bonds benefited relative returns.
-
-
Top detractors from performance relative to the Bloomberg 1-3 Year U.S. Government/Credit Bond Index:
-
There were no material detractors from relative performance during the reporting period.
-
FUND PERFORMANCE
The fund’s past performance is not a good predictor of the fund’s future performance. The graph and table below do not reflect the deduction of taxes that a shareholder would pay on fund distributions or the redemption of fund shares. The graph and table below assume reinvestment of dividends and capital gain distributions.
Growth of a Hypothetical $10,000 Investment
This graph shows the performance of a hypothetical $10,000 investment in Class B over a ten year period or since inception, if shorter, in comparison to (i) a broad measure of market performance and (ii) an additional index that MFS believes more closely reflects the market segments in which the fund invests.
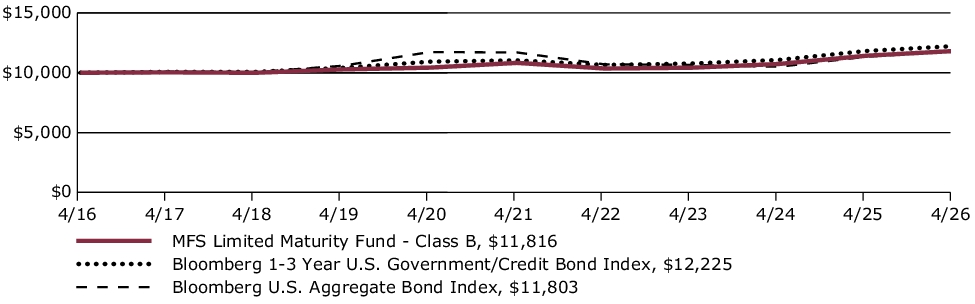
Average Annual Total Returns through 4/30/26
This table shows the average annual total returns of the class of shares noted for the periods shown, both with (if any) and without sales charges. It also shows the average annual total returns of (i) a broad measure of market performance and (ii) an additional index that MFS believes more closely reflects the market segments in which the fund invests, over the same periods.
| Share Class | 1-yr | 5-yr | 10-yr |
| B without sales charge | 3.44% | 1.77% | 1.68% |
| B with CDSC (declining over six years from 4% to 0%)× | (0.55)% | 1.41% | 1.68% |
| Comparative Benchmark(s) | |||
| Bloomberg U.S. Aggregate Bond Index ∆ | 4.06% | 0.18% | 1.67% |
| Bloomberg 1-3 Year U.S. Government/Credit Bond Index ∆ | 3.42% | 2.07% | 2.03% |
|
∆
|
Source: FactSet Research Systems Inc.
|
|
×
|
Assuming redemption at the end of the applicable period.
|
Visit mfs.com/perf/b for more recent performance information.
FUND STATISTICS AS OF 4/30/26
| Net Assets ($): | 3,352,561,328 | Average Effective Maturity (yrs): | 2.9 | |
| Total Number of Holdings: | 396 | Average Effective Duration (yrs): | 2.1 | |
| Total Management Fee ($)#: | 11,048,122 | |||
| Portfolio Turnover Rate (%): | 50 |
# Includes the effect of any management fee waivers, if applicable.
Where the fund holds derivatives, they are not included in the total number of portfolio holdings.
PORTFOLIO COMPOSITION (BASED ON TOTAL INVESTMENTS AS OF 4/30/26)
Portfolio structure
| Fixed Income | 97.2% |
| Money Market Funds | 2.8% |
Composition including fixed income credit quality
| AAA | 12.9% |
| AA | 11.2% |
| A | 18.6% |
| BBB | 31.9% |
| CCC | 0.0% |
| CC | 0.0% |
| U.S. Government | 22.2% |
| Federal Agencies | 0.4% |
| Not Rated | 0.0% |
| Money Market Funds | 2.8% |
Ratings are assigned using Moody’s, Fitch, and Standard & Poor’s and applying a hierarchy: If all 3 agencies rate a security, the middle rating is assigned; if 2 agencies rate a security, the lower rating is assigned. If none of the 3 agencies rate a security, we use DBRS Morningstar. If none of the 4 agencies rate a security, we use Kroll Bond Rating Agency. Ratings are shown in the S&P and Fitch scale (e.g., AAA). All ratings are subject to change.
FUND EXPENSES
What were the fund costs for the last year?
| (based on a hypothetical $10,000 investment) | ||
| Class Name | Costs of a $10,000 investment | Costs paid as a percentage of a $10,000 investment |
| C | $144 | 1.42% |
MANAGEMENT'S DISCUSSION OF FUND PERFORMANCE
-
For the twelve months ended April 30, 2026, Class C shares of the MFS Limited Maturity Fund (fund) provided a total return of 3.16%, at net asset value. This compares with a return of 4.06% for the fund’s benchmark, the Bloomberg U.S. Aggregate Bond Index. The fund's other benchmark, the Bloomberg 1-3 Year U.S. Government/Credit Bond Index, generated a return of 3.42%.
-
Global equity markets reached record levels during the period, withstanding considerable volatility amid tariffs, geopolitical conflict and high levels of uncertainty. A new geopolitical event distressed markets at the end of the period as US and Israeli forces launched strikes against Iran, disrupting Mideast oil and natural gas exports. During the period, a pro-growth tax and spending bill was signed into law in the US, while in Europe, renewed focus on defense and infrastructure spending brightened the economic outlook. In Japan, the election of a pro-growth prime minister sent stocks to new highs prior to the conflict in Iran. Optimism over artificial intelligence remained high.
-
Considerable progress was made in trade talks between the US and many major trading partners, with a fragile truce between the US and China extended through late 2026. While the US Supreme Court struck down part of the Trump administration’s tariff strategy, the administration began deploying other authorities to largely replace the ones that were ruled unconstitutional.
-
Early in the period, moderating inflation pressures allowed many global central banks to ease monetary policy. Amid a difficult policymaking environment and slower job growth, the Federal Reserve resumed easing policy in September and delivered quarter-point rate cuts in October and December before pausing.
-
In fixed income markets, previously range-bound global bond yields spiked following the onset of the Middle East conflict, as energy-driven inflation fears appeared to have rattled bond investors. US rate volatility (as measured by the Merrill Lynch Option Volatility Estimate (MOVE) Index) similarly rose from intra-period lows, reflecting uncertainty around the scope and duration of the conflict and its implications for global growth. However, volatility later retracted as the risk of a broader regional military escalation appeared less likely. Global credit spreads widened only modestly before stabilizing near prior levels, supported by strong demand and resilient underlying fundamentals.
-
Top contributors to performance relative to the Bloomberg 1-3 Year U.S. Government/Credit Bond Index:
-
The fund's out-of-benchmark exposure to the collateralized mortgage obligation (CMO) sector strengthened relative performance. Security selection within the industrials sector also supported relative results.
-
From a quality perspective, security selection within BBB-rated bonds benefited relative returns.
-
-
Top detractors from performance relative to the Bloomberg 1-3 Year U.S. Government/Credit Bond Index:
-
There were no material detractors from relative performance during the reporting period.
-
FUND PERFORMANCE
The fund’s past performance is not a good predictor of the fund’s future performance. The graph and table below do not reflect the deduction of taxes that a shareholder would pay on fund distributions or the redemption of fund shares. The graph and table below assume reinvestment of dividends and capital gain distributions.
Growth of a Hypothetical $10,000 Investment
This graph shows the performance of a hypothetical $10,000 investment in Class C over a ten year period or since inception, if shorter, in comparison to (i) a broad measure of market performance and (ii) an additional index that MFS believes more closely reflects the market segments in which the fund invests.
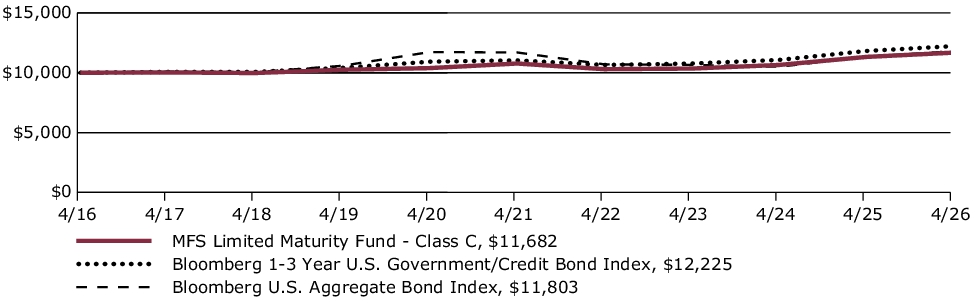
Average Annual Total Returns through 4/30/26
This table shows the average annual total returns of the class of shares noted for the periods shown, both with (if any) and without sales charges. It also shows the average annual total returns of (i) a broad measure of market performance and (ii) an additional index that MFS believes more closely reflects the market segments in which the fund invests, over the same periods.
| Share Class | 1-yr | 5-yr | 10-yr |
| C without sales charge | 3.16% | 1.63% | 1.57% |
| C with CDSC (1% for 12 months)× | 2.17% | 1.63% | 1.57% |
| Comparative Benchmark(s) | |||
| Bloomberg U.S. Aggregate Bond Index ∆ | 4.06% | 0.18% | 1.67% |
| Bloomberg 1-3 Year U.S. Government/Credit Bond Index ∆ | 3.42% | 2.07% | 2.03% |
|
∆
|
Source: FactSet Research Systems Inc.
|
|
×
|
Assuming redemption at the end of the applicable period.
|
Visit mfs.com/perf/c for more recent performance information.
FUND STATISTICS AS OF 4/30/26
| Net Assets ($): | 3,352,561,328 | Average Effective Maturity (yrs): | 2.9 | |
| Total Number of Holdings: | 396 | Average Effective Duration (yrs): | 2.1 | |
| Total Management Fee ($)#: | 11,048,122 | |||
| Portfolio Turnover Rate (%): | 50 |
# Includes the effect of any management fee waivers, if applicable.
Where the fund holds derivatives, they are not included in the total number of portfolio holdings.
PORTFOLIO COMPOSITION (BASED ON TOTAL INVESTMENTS AS OF 4/30/26)
Portfolio structure
| Fixed Income | 97.2% |
| Money Market Funds | 2.8% |
Composition including fixed income credit quality
| AAA | 12.9% |
| AA | 11.2% |
| A | 18.6% |
| BBB | 31.9% |
| CCC | 0.0% |
| CC | 0.0% |
| U.S. Government | 22.2% |
| Federal Agencies | 0.4% |
| Not Rated | 0.0% |
| Money Market Funds | 2.8% |
Ratings are assigned using Moody’s, Fitch, and Standard & Poor’s and applying a hierarchy: If all 3 agencies rate a security, the middle rating is assigned; if 2 agencies rate a security, the lower rating is assigned. If none of the 3 agencies rate a security, we use DBRS Morningstar. If none of the 4 agencies rate a security, we use Kroll Bond Rating Agency. Ratings are shown in the S&P and Fitch scale (e.g., AAA). All ratings are subject to change.
FUND EXPENSES
What were the fund costs for the last year?
| (based on a hypothetical $10,000 investment) | ||
| Class Name | Costs of a $10,000 investment | Costs paid as a percentage of a $10,000 investment |
| I | $43 | 0.42% |
MANAGEMENT'S DISCUSSION OF FUND PERFORMANCE
-
For the twelve months ended April 30, 2026, Class I shares of the MFS Limited Maturity Fund (fund) provided a total return of 4.37%, at net asset value. This compares with a return of 4.06% for the fund’s benchmark, the Bloomberg U.S. Aggregate Bond Index. The fund's other benchmark, the Bloomberg 1-3 Year U.S. Government/Credit Bond Index, generated a return of 3.42%.
-
Global equity markets reached record levels during the period, withstanding considerable volatility amid tariffs, geopolitical conflict and high levels of uncertainty. A new geopolitical event distressed markets at the end of the period as US and Israeli forces launched strikes against Iran, disrupting Mideast oil and natural gas exports. During the period, a pro-growth tax and spending bill was signed into law in the US, while in Europe, renewed focus on defense and infrastructure spending brightened the economic outlook. In Japan, the election of a pro-growth prime minister sent stocks to new highs prior to the conflict in Iran. Optimism over artificial intelligence remained high.
-
Considerable progress was made in trade talks between the US and many major trading partners, with a fragile truce between the US and China extended through late 2026. While the US Supreme Court struck down part of the Trump administration’s tariff strategy, the administration began deploying other authorities to largely replace the ones that were ruled unconstitutional.
-
Early in the period, moderating inflation pressures allowed many global central banks to ease monetary policy. Amid a difficult policymaking environment and slower job growth, the Federal Reserve resumed easing policy in September and delivered quarter-point rate cuts in October and December before pausing.
-
In fixed income markets, previously range-bound global bond yields spiked following the onset of the Middle East conflict, as energy-driven inflation fears appeared to have rattled bond investors. US rate volatility (as measured by the Merrill Lynch Option Volatility Estimate (MOVE) Index) similarly rose from intra-period lows, reflecting uncertainty around the scope and duration of the conflict and its implications for global growth. However, volatility later retracted as the risk of a broader regional military escalation appeared less likely. Global credit spreads widened only modestly before stabilizing near prior levels, supported by strong demand and resilient underlying fundamentals.
-
Top contributors to performance relative to the Bloomberg 1-3 Year U.S. Government/Credit Bond Index:
-
The fund's out-of-benchmark exposure to the collateralized mortgage obligation (CMO) sector strengthened relative performance. Security selection within the industrials sector also supported relative results.
-
From a quality perspective, security selection within BBB-rated bonds benefited relative returns.
-
-
Top detractors from performance relative to the Bloomberg 1-3 Year U.S. Government/Credit Bond Index:
-
There were no material detractors from relative performance during the reporting period.
-
FUND PERFORMANCE
The fund’s past performance is not a good predictor of the fund’s future performance. The graph and table below do not reflect the deduction of taxes that a shareholder would pay on fund distributions or the redemption of fund shares. The graph and table below assume reinvestment of dividends and capital gain distributions.
Growth of a Hypothetical $10,000 Investment
This graph shows the performance of a hypothetical $10,000 investment in Class I over a ten year period or since inception, if shorter, in comparison to (i) a broad measure of market performance and (ii) an additional index that MFS believes more closely reflects the market segments in which the fund invests.

Average Annual Total Returns through 4/30/26
This table shows the average annual total returns of the class of shares noted for the periods shown, both with (if any) and without sales charges. It also shows the average annual total returns of (i) a broad measure of market performance and (ii) an additional index that MFS believes more closely reflects the market segments in which the fund invests, over the same periods.
| Share Class | 1-yr | 5-yr | 10-yr |
| I without sales charge | 4.37% | 2.65% | 2.58% |
| Comparative Benchmark(s) | |||
| Bloomberg U.S. Aggregate Bond Index ∆ | 4.06% | 0.18% | 1.67% |
| Bloomberg 1-3 Year U.S. Government/Credit Bond Index ∆ | 3.42% | 2.07% | 2.03% |
|
∆
|
Source: FactSet Research Systems Inc.
|
Visit mfs.com/perf/i for more recent performance information.
FUND STATISTICS AS OF 4/30/26
| Net Assets ($): | 3,352,561,328 | Average Effective Maturity (yrs): | 2.9 | |
| Total Number of Holdings: | 396 | Average Effective Duration (yrs): | 2.1 | |
| Total Management Fee ($)#: | 11,048,122 | |||
| Portfolio Turnover Rate (%): | 50 |
# Includes the effect of any management fee waivers, if applicable.
Where the fund holds derivatives, they are not included in the total number of portfolio holdings.
PORTFOLIO COMPOSITION (BASED ON TOTAL INVESTMENTS AS OF 4/30/26)
Portfolio structure
| Fixed Income | 97.2% |
| Money Market Funds | 2.8% |
Composition including fixed income credit
quality
quality
| AAA | 12.9% |
| AA | 11.2% |
| A | 18.6% |
| BBB | 31.9% |
| CCC | 0.0% |
| CC | 0.0% |
| U.S. Government | 22.2% |
| Federal Agencies | 0.4% |
| Not Rated | 0.0% |
| Money Market Funds | 2.8% |
Ratings are assigned using Moody’s, Fitch, and Standard & Poor’s and applying a hierarchy: If all 3 agencies rate a security, the middle rating is assigned; if 2 agencies rate a security, the lower rating is assigned. If none of the 3 agencies rate a security, we use DBRS Morningstar. If none of the 4 agencies rate a security, we use Kroll Bond Rating Agency. Ratings are shown in the S&P and Fitch scale (e.g., AAA). All ratings are subject to change.
Ratings are assigned using Moody’s, Fitch, and Standard & Poor’s and applying a hierarchy: If all 3 agencies rate a security, the middle rating is assigned; if 2 agencies rate a security, the lower rating is assigned. If none of the 3 agencies rate a security, we use DBRS Morningstar. If none of the 4 agencies rate a security, we use Kroll Bond Rating Agency. Ratings are shown in the S&P and Fitch scale (e.g., AAA). All ratings are subject to change.
FUND EXPENSES
What were the fund costs for the last year?
| (based on a hypothetical $10,000 investment) | ||
| Class Name | Costs of a $10,000 investment | Costs paid as a percentage of a $10,000 investment |
| R1 | $144 | 1.42% |
MANAGEMENT'S DISCUSSION OF FUND PERFORMANCE
-
For the twelve months ended April 30, 2026, Class R1 shares of the MFS Limited Maturity Fund (fund) provided a total return of 3.16%, at net asset value. This compares with a return of 4.06% for the fund’s benchmark, the Bloomberg U.S. Aggregate Bond Index. The fund's other benchmark, the Bloomberg 1-3 Year U.S. Government/Credit Bond Index, generated a return of 3.42%.
-
Global equity markets reached record levels during the period, withstanding considerable volatility amid tariffs, geopolitical conflict and high levels of uncertainty. A new geopolitical event distressed markets at the end of the period as US and Israeli forces launched strikes against Iran, disrupting Mideast oil and natural gas exports. During the period, a pro-growth tax and spending bill was signed into law in the US, while in Europe, renewed focus on defense and infrastructure spending brightened the economic outlook. In Japan, the election of a pro-growth prime minister sent stocks to new highs prior to the conflict in Iran. Optimism over artificial intelligence remained high.
-
Considerable progress was made in trade talks between the US and many major trading partners, with a fragile truce between the US and China extended through late 2026. While the US Supreme Court struck down part of the Trump administration’s tariff strategy, the administration began deploying other authorities to largely replace the ones that were ruled unconstitutional.
-
Early in the period, moderating inflation pressures allowed many global central banks to ease monetary policy. Amid a difficult policymaking environment and slower job growth, the Federal Reserve resumed easing policy in September and delivered quarter-point rate cuts in October and December before pausing.
-
In fixed income markets, previously range-bound global bond yields spiked following the onset of the Middle East conflict, as energy-driven inflation fears appeared to have rattled bond investors. US rate volatility (as measured by the Merrill Lynch Option Volatility Estimate (MOVE) Index) similarly rose from intra-period lows, reflecting uncertainty around the scope and duration of the conflict and its implications for global growth. However, volatility later retracted as the risk of a broader regional military escalation appeared less likely. Global credit spreads widened only modestly before stabilizing near prior levels, supported by strong demand and resilient underlying fundamentals.
-
Top contributors to performance relative to the Bloomberg 1-3 Year U.S. Government/Credit Bond Index:
-
The fund's out-of-benchmark exposure to the collateralized mortgage obligation (CMO) sector strengthened relative performance. Security selection within the industrials sector also supported relative results.
-
From a quality perspective, security selection within BBB-rated bonds benefited relative returns.
-
-
Top detractors from performance relative to the Bloomberg 1-3 Year U.S. Government/Credit Bond Index:
-
There were no material detractors from relative performance during the reporting period.
-
FUND PERFORMANCE
The fund’s past performance is not a good predictor of the fund’s future performance. The graph and table below do not reflect the deduction of taxes that a shareholder would pay on fund distributions or the redemption of fund shares. The graph and table below assume reinvestment of dividends and capital gain distributions.
Growth of a Hypothetical $10,000 Investment
This graph shows the performance of a hypothetical $10,000 investment in Class R1 over a ten year period or since inception, if shorter, in comparison to (i) a broad measure of market performance and (ii) an additional index that MFS believes more closely reflects the market segments in which the fund invests.
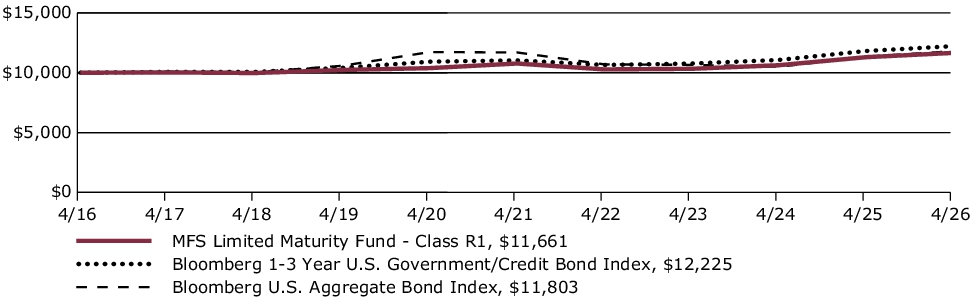
Average Annual Total Returns through 4/30/26
This table shows the average annual total returns of the class of shares noted for the periods shown, both with (if any) and without sales charges. It also shows the average annual total returns of (i) a broad measure of market performance and (ii) an additional index that MFS believes more closely reflects the market segments in which the fund invests, over the same periods.
| Share Class | 1-yr | 5-yr | 10-yr |
| R1 without sales charge | 3.16% | 1.60% | 1.55% |
| Comparative Benchmark(s) | |||
| Bloomberg U.S. Aggregate Bond Index ∆ | 4.06% | 0.18% | 1.67% |
| Bloomberg 1-3 Year U.S. Government/Credit Bond Index ∆ | 3.42% | 2.07% | 2.03% |
|
∆
|
Source: FactSet Research Systems Inc.
|
Visit mfs.com/perf/r1 for more recent performance information.
FUND STATISTICS AS OF 4/30/26
| Net Assets ($): | 3,352,561,328 | Average Effective Maturity (yrs): | 2.9 | |
| Total Number of Holdings: | 396 | Average Effective Duration (yrs): | 2.1 | |
| Total Management Fee ($)#: | 11,048,122 | |||
| Portfolio Turnover Rate (%): | 50 |
# Includes the effect of any management fee waivers, if applicable.
Where the fund holds derivatives, they are not included in the total number of portfolio holdings.
PORTFOLIO COMPOSITION (BASED ON TOTAL INVESTMENTS AS OF 4/30/26)
Portfolio structure
| Fixed Income | 97.2% |
| Money Market Funds | 2.8% |
Composition including fixed income credit
quality
quality
| AAA | 12.9% |
| AA | 11.2% |
| A | 18.6% |
| BBB | 31.9% |
| CCC | 0.0% |
| CC | 0.0% |
| U.S. Government | 22.2% |
| Federal Agencies | 0.4% |
| Not Rated | 0.0% |
| Money Market Funds | 2.8% |
Ratings are assigned using Moody’s, Fitch, and Standard & Poor’s and applying a hierarchy: If all 3 agencies rate a security, the middle rating is assigned; if 2 agencies rate a security, the lower rating is assigned. If none of the 3 agencies rate a security, we use DBRS Morningstar. If none of the 4 agencies rate a security, we use Kroll Bond Rating Agency. Ratings are shown in the S&P and Fitch scale (e.g., AAA). All ratings are subject to change.
Ratings are assigned using Moody’s, Fitch, and Standard & Poor’s and applying a hierarchy: If all 3 agencies rate a security, the middle rating is assigned; if 2 agencies rate a security, the lower rating is assigned. If none of the 3 agencies rate a security, we use DBRS Morningstar. If none of the 4 agencies rate a security, we use Kroll Bond Rating Agency. Ratings are shown in the S&P and Fitch scale (e.g., AAA). All ratings are subject to change.
FUND EXPENSES
What were the fund costs for the last year?
| (based on a hypothetical $10,000 investment) | ||
| Class Name | Costs of a $10,000 investment | Costs paid as a percentage of a $10,000 investment |
| R2 | $84 | 0.82% |
MANAGEMENT'S DISCUSSION OF FUND PERFORMANCE
-
For the twelve months ended April 30, 2026, Class R2 shares of the MFS Limited Maturity Fund (fund) provided a total return of 3.96%, at net asset value. This compares with a return of 4.06% for the fund’s benchmark, the Bloomberg U.S. Aggregate Bond Index. The fund's other benchmark, the Bloomberg 1-3 Year U.S. Government/Credit Bond Index, generated a return of 3.42%.
-
Global equity markets reached record levels during the period, withstanding considerable volatility amid tariffs, geopolitical conflict and high levels of uncertainty. A new geopolitical event distressed markets at the end of the period as US and Israeli forces launched strikes against Iran, disrupting Mideast oil and natural gas exports. During the period, a pro-growth tax and spending bill was signed into law in the US, while in Europe, renewed focus on defense and infrastructure spending brightened the economic outlook. In Japan, the election of a pro-growth prime minister sent stocks to new highs prior to the conflict in Iran. Optimism over artificial intelligence remained high.
-
Considerable progress was made in trade talks between the US and many major trading partners, with a fragile truce between the US and China extended through late 2026. While the US Supreme Court struck down part of the Trump administration’s tariff strategy, the administration began deploying other authorities to largely replace the ones that were ruled unconstitutional.
-
Early in the period, moderating inflation pressures allowed many global central banks to ease monetary policy. Amid a difficult policymaking environment and slower job growth, the Federal Reserve resumed easing policy in September and delivered quarter-point rate cuts in October and December before pausing.
-
In fixed income markets, previously range-bound global bond yields spiked following the onset of the Middle East conflict, as energy-driven inflation fears appeared to have rattled bond investors. US rate volatility (as measured by the Merrill Lynch Option Volatility Estimate (MOVE) Index) similarly rose from intra-period lows, reflecting uncertainty around the scope and duration of the conflict and its implications for global growth. However, volatility later retracted as the risk of a broader regional military escalation appeared less likely. Global credit spreads widened only modestly before stabilizing near prior levels, supported by strong demand and resilient underlying fundamentals.
-
Top contributors to performance relative to the Bloomberg 1-3 Year U.S. Government/Credit Bond Index:
-
The fund's out-of-benchmark exposure to the collateralized mortgage obligation (CMO) sector strengthened relative performance. Security selection within the industrials sector also supported relative results.
-
From a quality perspective, security selection within BBB-rated bonds benefited relative returns.
-
-
Top detractors from performance relative to the Bloomberg 1-3 Year U.S. Government/Credit Bond Index:
-
There were no material detractors from relative performance during the reporting period.
-
FUND PERFORMANCE
The fund’s past performance is not a good predictor of the fund’s future performance. The graph and table below do not reflect the deduction of taxes that a shareholder would pay on fund distributions or the redemption of fund shares. The graph and table below assume reinvestment of dividends and capital gain distributions.
Growth of a Hypothetical $10,000 Investment
This graph shows the performance of a hypothetical $10,000 investment in Class R2 over a ten year period or since inception, if shorter, in comparison to (i) a broad measure of market performance and (ii) an additional index that MFS believes more closely reflects the market segments in which the fund invests.
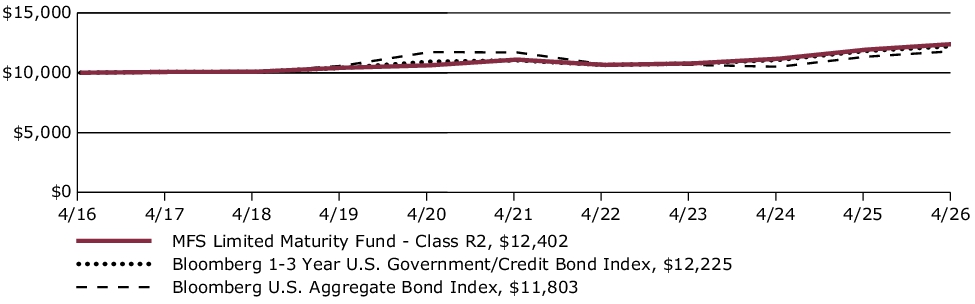
Average Annual Total Returns through 4/30/26
This table shows the average annual total returns of the class of shares noted for the periods shown, both with (if any) and without sales charges. It also shows the average annual total returns of (i) a broad measure of market performance and (ii) an additional index that MFS believes more closely reflects the market segments in which the fund invests, over the same periods.
| Share Class | 1-yr | 5-yr | 10-yr |
| R2 without sales charge | 3.96% | 2.24% | 2.18% |
| Comparative Benchmark(s) | |||
| Bloomberg U.S. Aggregate Bond Index ∆ | 4.06% | 0.18% | 1.67% |
| Bloomberg 1-3 Year U.S. Government/Credit Bond Index ∆ | 3.42% | 2.07% | 2.03% |
|
∆
|
Source: FactSet Research Systems Inc.
|
Visit mfs.com/perf/r2 for more recent performance information.
FUND STATISTICS AS OF 4/30/26
| Net Assets ($): | 3,352,561,328 | Average Effective Maturity (yrs): | 2.9 | |
| Total Number of Holdings: | 396 | Average Effective Duration (yrs): | 2.1 | |
| Total Management Fee ($)#: | 11,048,122 | |||
| Portfolio Turnover Rate (%): | 50 |
# Includes the effect of any management fee waivers, if applicable.
Where the fund holds derivatives, they are not included in the total number of portfolio holdings.
PORTFOLIO COMPOSITION (BASED ON TOTAL INVESTMENTS AS OF 4/30/26)
Portfolio structure
| Fixed Income | 97.2% |
| Money Market Funds | 2.8% |
Composition including fixed income credit
quality
quality
| AAA | 12.9% |
| AA | 11.2% |
| A | 18.6% |
| BBB | 31.9% |
| CCC | 0.0% |
| CC | 0.0% |
| U.S. Government | 22.2% |
| Federal Agencies | 0.4% |
| Not Rated | 0.0% |
| Money Market Funds | 2.8% |
Ratings are assigned using Moody’s, Fitch, and Standard & Poor’s and applying a hierarchy: If all 3 agencies rate a security, the middle rating is assigned; if 2 agencies rate a security, the lower rating is assigned. If none of the 3 agencies rate a security, we use DBRS Morningstar. If none of the 4 agencies rate a security, we use Kroll Bond Rating Agency. Ratings are shown in the S&P and Fitch scale (e.g., AAA). All ratings are subject to change.
Ratings are assigned using Moody’s, Fitch, and Standard & Poor’s and applying a hierarchy: If all 3 agencies rate a security, the middle rating is assigned; if 2 agencies rate a security, the lower rating is assigned. If none of the 3 agencies rate a security, we use DBRS Morningstar. If none of the 4 agencies rate a security, we use Kroll Bond Rating Agency. Ratings are shown in the S&P and Fitch scale (e.g., AAA). All ratings are subject to change.
FUND EXPENSES
What were the fund costs for the last year?
| (based on a hypothetical $10,000 investment) | ||
| Class Name | Costs of a $10,000 investment | Costs paid as a percentage of a $10,000 investment |
| R3 | $68 | 0.67% |
MANAGEMENT'S DISCUSSION OF FUND PERFORMANCE
-
For the twelve months ended April 30, 2026, Class R3 shares of the MFS Limited Maturity Fund (fund) provided a total return of 4.11%, at net asset value. This compares with a return of 4.06% for the fund’s benchmark, the Bloomberg U.S. Aggregate Bond Index. The fund's other benchmark, the Bloomberg 1-3 Year U.S. Government/Credit Bond Index, generated a return of 3.42%.
-
Global equity markets reached record levels during the period, withstanding considerable volatility amid tariffs, geopolitical conflict and high levels of uncertainty. A new geopolitical event distressed markets at the end of the period as US and Israeli forces launched strikes against Iran, disrupting Mideast oil and natural gas exports. During the period, a pro-growth tax and spending bill was signed into law in the US, while in Europe, renewed focus on defense and infrastructure spending brightened the economic outlook. In Japan, the election of a pro-growth prime minister sent stocks to new highs prior to the conflict in Iran. Optimism over artificial intelligence remained high.
-
Considerable progress was made in trade talks between the US and many major trading partners, with a fragile truce between the US and China extended through late 2026. While the US Supreme Court struck down part of the Trump administration’s tariff strategy, the administration began deploying other authorities to largely replace the ones that were ruled unconstitutional.
-
Early in the period, moderating inflation pressures allowed many global central banks to ease monetary policy. Amid a difficult policymaking environment and slower job growth, the Federal Reserve resumed easing policy in September and delivered quarter-point rate cuts in October and December before pausing.
-
In fixed income markets, previously range-bound global bond yields spiked following the onset of the Middle East conflict, as energy-driven inflation fears appeared to have rattled bond investors. US rate volatility (as measured by the Merrill Lynch Option Volatility Estimate (MOVE) Index) similarly rose from intra-period lows, reflecting uncertainty around the scope and duration of the conflict and its implications for global growth. However, volatility later retracted as the risk of a broader regional military escalation appeared less likely. Global credit spreads widened only modestly before stabilizing near prior levels, supported by strong demand and resilient underlying fundamentals.
-
Top contributors to performance relative to the Bloomberg 1-3 Year U.S. Government/Credit Bond Index:
-
The fund's out-of-benchmark exposure to the collateralized mortgage obligation (CMO) sector strengthened relative performance. Security selection within the industrials sector also supported relative results.
-
From a quality perspective, security selection within BBB-rated bonds benefited relative returns.
-
-
Top detractors from performance relative to the Bloomberg 1-3 Year U.S. Government/Credit Bond Index:
-
There were no material detractors from relative performance during the reporting period.
-
FUND PERFORMANCE
The fund’s past performance is not a good predictor of the fund’s future performance. The graph and table below do not reflect the deduction of taxes that a shareholder would pay on fund distributions or the redemption of fund shares. The graph and table below assume reinvestment of dividends and capital gain distributions.
Growth of a Hypothetical $10,000 Investment
This graph shows the performance of a hypothetical $10,000 investment in Class R3 over a ten year period or since inception, if shorter, in comparison to (i) a broad measure of market performance and (ii) an additional index that MFS believes more closely reflects the market segments in which the fund invests.
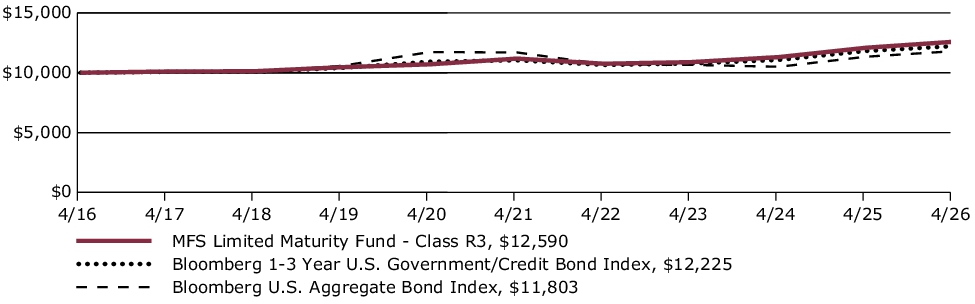
Average Annual Total Returns through 4/30/26
This table shows the average annual total returns of the class of shares noted for the periods shown, both with (if any) and without sales charges. It also shows the average annual total returns of (i) a broad measure of market performance and (ii) an additional index that MFS believes more closely reflects the market segments in which the fund invests, over the same periods.
| Share Class | 1-yr | 5-yr | 10-yr |
| R3 without sales charge | 4.11% | 2.40% | 2.33% |
| Comparative Benchmark(s) | |||
| Bloomberg U.S. Aggregate Bond Index ∆ | 4.06% | 0.18% | 1.67% |
| Bloomberg 1-3 Year U.S. Government/Credit Bond Index ∆ | 3.42% | 2.07% | 2.03% |
|
∆
|
Source: FactSet Research Systems Inc.
|
Visit mfs.com/perf/r3 for more recent performance information.
FUND STATISTICS AS OF 4/30/26
| Net Assets ($): | 3,352,561,328 | Average Effective Maturity (yrs): | 2.9 | |
| Total Number of Holdings: | 396 | Average Effective Duration (yrs): | 2.1 | |
| Total Management Fee ($)#: | 11,048,122 | |||
| Portfolio Turnover Rate (%): | 50 |
# Includes the effect of any management fee waivers, if applicable.
Where the fund holds derivatives, they are not included in the total number of portfolio holdings.
PORTFOLIO COMPOSITION (BASED ON TOTAL INVESTMENTS AS OF 4/30/26)
Portfolio structure
| Fixed Income | 97.2% |
| Money Market Funds | 2.8% |
Composition including fixed income credit
quality
quality
| AAA | 12.9% |
| AA | 11.2% |
| A | 18.6% |
| BBB | 31.9% |
| CCC | 0.0% |
| CC | 0.0% |
| U.S. Government | 22.2% |
| Federal Agencies | 0.4% |
| Not Rated | 0.0% |
| Money Market Funds | 2.8% |
Ratings are assigned using Moody’s, Fitch, and Standard & Poor’s and applying a hierarchy: If all 3 agencies rate a security, the middle rating is assigned; if 2 agencies rate a security, the lower rating is assigned. If none of the 3 agencies rate a security, we use DBRS Morningstar. If none of the 4 agencies rate a security, we use Kroll Bond Rating Agency. Ratings are shown in the S&P and Fitch scale (e.g., AAA). All ratings are subject to change.
Ratings are assigned using Moody’s, Fitch, and Standard & Poor’s and applying a hierarchy: If all 3 agencies rate a security, the middle rating is assigned; if 2 agencies rate a security, the lower rating is assigned. If none of the 3 agencies rate a security, we use DBRS Morningstar. If none of the 4 agencies rate a security, we use Kroll Bond Rating Agency. Ratings are shown in the S&P and Fitch scale (e.g., AAA). All ratings are subject to change.
FUND EXPENSES
What were the fund costs for the last year?
| (based on a hypothetical $10,000 investment) | ||
| Class Name | Costs of a $10,000 investment | Costs paid as a percentage of a $10,000 investment |
| R4 | $43 | 0.42% |
MANAGEMENT'S DISCUSSION OF FUND PERFORMANCE
-
For the twelve months ended April 30, 2026, Class R4 shares of the MFS Limited Maturity Fund (fund) provided a total return of 4.20%, at net asset value. This compares with a return of 4.06% for the fund’s benchmark, the Bloomberg U.S. Aggregate Bond Index. The fund's other benchmark, the Bloomberg 1-3 Year U.S. Government/Credit Bond Index, generated a return of 3.42%.
-
Global equity markets reached record levels during the period, withstanding considerable volatility amid tariffs, geopolitical conflict and high levels of uncertainty. A new geopolitical event distressed markets at the end of the period as US and Israeli forces launched strikes against Iran, disrupting Mideast oil and natural gas exports. During the period, a pro-growth tax and spending bill was signed into law in the US, while in Europe, renewed focus on defense and infrastructure spending brightened the economic outlook. In Japan, the election of a pro-growth prime minister sent stocks to new highs prior to the conflict in Iran. Optimism over artificial intelligence remained high.
-
Considerable progress was made in trade talks between the US and many major trading partners, with a fragile truce between the US and China extended through late 2026. While the US Supreme Court struck down part of the Trump administration’s tariff strategy, the administration began deploying other authorities to largely replace the ones that were ruled unconstitutional.
-
Early in the period, moderating inflation pressures allowed many global central banks to ease monetary policy. Amid a difficult policymaking environment and slower job growth, the Federal Reserve resumed easing policy in September and delivered quarter-point rate cuts in October and December before pausing.
-
In fixed income markets, previously range-bound global bond yields spiked following the onset of the Middle East conflict, as energy-driven inflation fears appeared to have rattled bond investors. US rate volatility (as measured by the Merrill Lynch Option Volatility Estimate (MOVE) Index) similarly rose from intra-period lows, reflecting uncertainty around the scope and duration of the conflict and its implications for global growth. However, volatility later retracted as the risk of a broader regional military escalation appeared less likely. Global credit spreads widened only modestly before stabilizing near prior levels, supported by strong demand and resilient underlying fundamentals.
-
Top contributors to performance relative to the Bloomberg 1-3 Year U.S. Government/Credit Bond Index:
-
The fund's out-of-benchmark exposure to the collateralized mortgage obligation (CMO) sector strengthened relative performance. Security selection within the industrials sector also supported relative results.
-
From a quality perspective, security selection within BBB-rated bonds benefited relative returns.
-
-
Top detractors from performance relative to the Bloomberg 1-3 Year U.S. Government/Credit Bond Index:
-
There were no material detractors from relative performance during the reporting period.
-
FUND PERFORMANCE
The fund’s past performance is not a good predictor of the fund’s future performance. The graph and table below do not reflect the deduction of taxes that a shareholder would pay on fund distributions or the redemption of fund shares. The graph and table below assume reinvestment of dividends and capital gain distributions.
Growth of a Hypothetical $10,000 Investment
This graph shows the performance of a hypothetical $10,000 investment in Class R4 over a ten year period or since inception, if shorter, in comparison to (i) a broad measure of market performance and (ii) an additional index that MFS believes more closely reflects the market segments in which the fund invests.
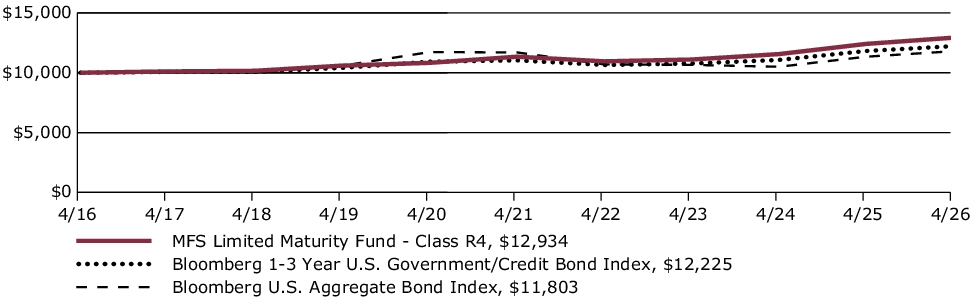
Average Annual Total Returns through 4/30/26
This table shows the average annual total returns of the class of shares noted for the periods shown, both with (if any) and without sales charges. It also shows the average annual total returns of (i) a broad measure of market performance and (ii) an additional index that MFS believes more closely reflects the market segments in which the fund invests, over the same periods.
| Share Class | 1-yr | 5-yr | 10-yr |
| R4 without sales charge | 4.20% | 2.66% | 2.61% |
| Comparative Benchmark(s) | |||
| Bloomberg U.S. Aggregate Bond Index ∆ | 4.06% | 0.18% | 1.67% |
| Bloomberg 1-3 Year U.S. Government/Credit Bond Index ∆ | 3.42% | 2.07% | 2.03% |
|
∆
|
Source: FactSet Research Systems Inc.
|
Visit mfs.com/perf/r4 for more recent performance information.
FUND STATISTICS AS OF 4/30/26
| Net Assets ($): | 3,352,561,328 | Average Effective Maturity (yrs): | 2.9 | |
| Total Number of Holdings: | 396 | Average Effective Duration (yrs): | 2.1 | |
| Total Management Fee ($)#: | 11,048,122 | |||
| Portfolio Turnover Rate (%): | 50 |
# Includes the effect of any management fee waivers, if applicable.
Where the fund holds derivatives, they are not included in the total number of portfolio holdings.
PORTFOLIO COMPOSITION (BASED ON TOTAL INVESTMENTS AS OF 4/30/26)
Portfolio structure
| Fixed Income | 97.2% |
| Money Market Funds | 2.8% |
Composition including fixed income credit
quality
quality
| AAA | 12.9% |
| AA | 11.2% |
| A | 18.6% |
| BBB | 31.9% |
| CCC | 0.0% |
| CC | 0.0% |
| U.S. Government | 22.2% |
| Federal Agencies | 0.4% |
| Not Rated | 0.0% |
| Money Market Funds | 2.8% |
Ratings are assigned using Moody’s, Fitch, and Standard & Poor’s and applying a hierarchy: If all 3 agencies rate a security, the middle rating is assigned; if 2 agencies rate a security, the lower rating is assigned. If none of the 3 agencies rate a security, we use DBRS Morningstar. If none of the 4 agencies rate a security, we use Kroll Bond Rating Agency. Ratings are shown in the S&P and Fitch scale (e.g., AAA). All ratings are subject to change.
Ratings are assigned using Moody’s, Fitch, and Standard & Poor’s and applying a hierarchy: If all 3 agencies rate a security, the middle rating is assigned; if 2 agencies rate a security, the lower rating is assigned. If none of the 3 agencies rate a security, we use DBRS Morningstar. If none of the 4 agencies rate a security, we use Kroll Bond Rating Agency. Ratings are shown in the S&P and Fitch scale (e.g., AAA). All ratings are subject to change.
| [1] | Includes the effect of any management fee waivers, if applicable. |
| [2] | Includes the effect of any management fee waivers, if applicable. |
| [3] | Includes the effect of any management fee waivers, if applicable. |
| [4] | Includes the effect of any management fee waivers, if applicable. |
| [5] | Includes the effect of any management fee waivers, if applicable. |
| [6] | Includes the effect of any management fee waivers, if applicable. |
| [7] | Includes the effect of any management fee waivers, if applicable. |
| [8] | Includes the effect of any management fee waivers, if applicable. |
| [9] | Includes the effect of any management fee waivers, if applicable. |
| [10] | Includes the effect of any management fee waivers, if applicable. |
| [11] | Includes the effect of any management fee waivers, if applicable. |
| [12] | Includes the effect of any management fee waivers, if applicable. |
| [13] | Includes the effect of any management fee waivers, if applicable. |
| [14] | Includes the effect of any management fee waivers, if applicable. |
| [15] | Includes the effect of any management fee waivers, if applicable. |
| [16] | Includes the effect of any management fee waivers, if applicable. |
| [17] | Includes the effect of any management fee waivers, if applicable. |
| [18] | Includes the effect of any management fee waivers, if applicable. |
| [19] | Includes the effect of any management fee waivers, if applicable. |
| [20] | Includes the effect of any management fee waivers, if applicable. |
| [21] | Includes the effect of any management fee waivers, if applicable. |
| [22] | Includes the effect of any management fee waivers, if applicable. |
| [23] | Includes the effect of any management fee waivers, if applicable. |
| [24] | Includes the effect of any management fee waivers, if applicable. |
| [25] | Includes the effect of any management fee waivers, if applicable. |
| [26] | Includes the effect of any management fee waivers, if applicable. |
| [27] | Includes the effect of any management fee waivers, if applicable. |
| [28] | Includes the effect of any management fee waivers, if applicable. |
| [29] | Includes the effect of any management fee waivers, if applicable. |
| [30] | Includes the effect of any management fee waivers, if applicable. |
| [31] | Includes the effect of any management fee waivers, if applicable. |
| [32] | Includes the effect of any management fee waivers, if applicable. |