Pay vs Performance Disclosure
Mar. 31, 2026
USD ($)
Pay Versus Performance
The following table provides information regarding the “Compensation Actually Paid” to (i) each of the individuals who served as our principal executive officer during fiscal year 2026 and (ii), on average, to our remaining NEOs (the “Other NEOs”) collectively as determined and defined in Item 402(v) of Regulation
S-K
and does not reflect compensation actually earned, realized, or received by our CEOs and the Other NEOs. The Board did not consider the pay versus performance disclosure below in making its pay decisions for the fiscal year ended March 31, 2026. Summary Compensation Table Total for Simon Allen (1) ($) |
Summary Compensation Table Total for Philip Moyer (1) ($) |
Compensation Actually Paid to Simon Allen (1) ($) |
Compensation Actually Paid to Philip Moyer (1) ($) |
Average Summary Compensation Table Total for Other NEOs (1) ($) |
Value of Initial Fixed $100 Investment based on: (2) |
|||||||||||||||||||||||||||||||||||||||||||||
| Year |
Average Compensation Actually Paid to Other NEOs (1) ($) |
McGraw TSR ($) |
Peer Group TSR ($) |
Net Income ($Millions) |
Adjusted EBITDA ($Millions) (3) | |||||||||||||||||||||||||||||||||||||||||||||
| 2026 |
3,401,562 |
8,290,848 |
(12,369,501 |
) |
9,571,503 |
1,150,284 |
(2,279,018 |
) |
80.59 |
70.58 |
78.66 |
744.26 |
||||||||||||||||||||||||||||||||||||||
(1) |
This table presents pay versus performance information for the following executive officers: |
| Fiscal Year |
Former CEO |
CEO |
Other NEOs | |||
2026 |
Simon Allen |
Philip Moyer |
Robert Sallmann, David Cortese, David B. Stafford, Tracey Tiska | |||
2026 Compensation Actually Paid reflects the following adjustments to the applicable amounts in the “Fiscal Year 2026 Summary Compensation Table” (“SCT”):
Simon Allen ($) |
Philip Moyer ($) |
Average of Other NEOs ($) (b) |
||||||||||
| 2026 Total Compensation Reported in SCT |
3,401,562 |
8,290,848 |
1,150,284 |
|||||||||
| Less, value of stock awards reported in SCT |
0 |
(6,552,040 |
) |
0 |
||||||||
| Less, value of option awards reported in SCT |
0 |
0 |
(159,433 |
) | ||||||||
| Plus, year-end value of awards granted in fiscal year 2026 that were unvested and outstanding as of 3/31/2026(a) |
0 |
7,332,697 |
97,985 |
|||||||||
| Plus, amount equal to the change as of 3/31/2026 in the value of awards granted in fiscal year 2025 that were unvested and outstanding as of 3/31/2026 (a) |
(13,909,900 |
) |
0 |
(3,282,851 |
) | |||||||
| Plus, value of awards granted in fiscal year 2026 that vested in fiscal year 2026 |
0 |
499,998 |
7,430 |
|||||||||
| Plus, amount equal to the change as of the vesting date in the value of awards granted in fiscal year 2025 for which all applicable vesting conditions were satisfied as of 3/31/2026 (a) |
(1,861,163 |
) |
0 |
(92,433 |
) | |||||||
| Less, the value as of 3/31/2026 of any awards granted in any prior fiscal year that failed to meet the applicable vesting conditions during fiscal year 2026 |
0 |
0 |
0 |
|||||||||
| Plus, the value of any dividends or other earnings paid on stock or option awards in fiscal year 2026 prior to the vesting date that are not otherwise included in the total compensation for fiscal year 2026 |
0 |
0 |
0 |
|||||||||
| Compensation Actually Paid for fiscal year 2026 |
(12,369,501 |
) |
9,571,503 |
(2,279,018 |
) | |||||||
(a) |
The fair value of the RSUs is based on a price of $13.70 per share, which was the closing sale price of the Company’s Common Stock on the NYSE on March 31, 2026, the last trading day of the fiscal year ended March 31, 2026. For the PSUs and stock options subject to a market condition, fair value is calculated in accordance with FASB ASC 718 using a Monte Carlo Simulation model. For the other stock options, fair value is calculated in accordance with FASB ASC 718 using the Black-Scholes option-pricing model. |
(b) |
Figures for all Other NEOs are included in the average figures shown in this column. |
(2) |
The Peer Group total shareholder return (“TSR”) is calculated using the peer group used for compensation purposes, as described in “Compensation Discussion and Analysis- Benchmarking and Peer Group Data.” The comparison assumes $100 was invested for the period starting July 23, 2025, through March 31, 2026 (the “Measurement Period”) for purposes of calculating the cumulative TSR of the Company and the peer group over the Measurement Period. Historical stock price performance is not necessarily indicative of future stock price performance. |
(3) |
We determined Adjusted EBITDA to be the most important financial performance measure used to link Company performance to Compensation Actually Paid in fiscal year 2026. This performance measure may not have been the most important financial performance measure in prior fiscal years, and we may determine a different financial performance measure to be the most important financial performance measure in future fiscal years. For more information about this measure, including how it is calculated, see “Compensation Discussion and Analysis-Components of Compensation for the Fiscal Year Ended March 31, 2026-AIP EBITDA Table.” |
(1) |
This table presents pay versus performance information for the following executive officers: |
| Fiscal Year |
Former CEO |
CEO |
Other NEOs | |||
2026 |
Simon Allen |
Philip Moyer |
Robert Sallmann, David Cortese, David B. Stafford, Tracey Tiska | |||
(2) |
The Peer Group total shareholder return (“TSR”) is calculated using the peer group used for compensation purposes, as described in “Compensation Discussion and Analysis- Benchmarking and Peer Group Data.” The comparison assumes $100 was invested for the period starting July 23, 2025, through March 31, 2026 (the “Measurement Period”) for purposes of calculating the cumulative TSR of the Company and the peer group over the Measurement Period. Historical stock price performance is not necessarily indicative of future stock price performance. |
2026 Compensation Actually Paid reflects the following adjustments to the applicable amounts in the “Fiscal Year 2026 Summary Compensation Table” (“SCT”):
Simon Allen ($) |
Philip Moyer ($) |
Average of Other NEOs ($) (b) |
||||||||||
| 2026 Total Compensation Reported in SCT |
3,401,562 |
8,290,848 |
1,150,284 |
|||||||||
| Less, value of stock awards reported in SCT |
0 |
(6,552,040 |
) |
0 |
||||||||
| Less, value of option awards reported in SCT |
0 |
0 |
(159,433 |
) | ||||||||
| Plus, year-end value of awards granted in fiscal year 2026 that were unvested and outstanding as of 3/31/2026(a) |
0 |
7,332,697 |
97,985 |
|||||||||
| Plus, amount equal to the change as of 3/31/2026 in the value of awards granted in fiscal year 2025 that were unvested and outstanding as of 3/31/2026 (a) |
(13,909,900 |
) |
0 |
(3,282,851 |
) | |||||||
| Plus, value of awards granted in fiscal year 2026 that vested in fiscal year 2026 |
0 |
499,998 |
7,430 |
|||||||||
| Plus, amount equal to the change as of the vesting date in the value of awards granted in fiscal year 2025 for which all applicable vesting conditions were satisfied as of 3/31/2026 (a) |
(1,861,163 |
) |
0 |
(92,433 |
) | |||||||
| Less, the value as of 3/31/2026 of any awards granted in any prior fiscal year that failed to meet the applicable vesting conditions during fiscal year 2026 |
0 |
0 |
0 |
|||||||||
| Plus, the value of any dividends or other earnings paid on stock or option awards in fiscal year 2026 prior to the vesting date that are not otherwise included in the total compensation for fiscal year 2026 |
0 |
0 |
0 |
|||||||||
| Compensation Actually Paid for fiscal year 2026 |
(12,369,501 |
) |
9,571,503 |
(2,279,018 |
) | |||||||
(a) |
The fair value of the RSUs is based on a price of $13.70 per share, which was the closing sale price of the Company’s Common Stock on the NYSE on March 31, 2026, the last trading day of the fiscal year ended March 31, 2026. For the PSUs and stock options subject to a market condition, fair value is calculated in accordance with FASB ASC 718 using a Monte Carlo Simulation model. For the other stock options, fair value is calculated in accordance with FASB ASC 718 using the Black-Scholes option-pricing model. |
(b) |
Figures for all Other NEOs are included in the average figures shown in this column. |
2026 Compensation Actually Paid reflects the following adjustments to the applicable amounts in the “Fiscal Year 2026 Summary Compensation Table” (“SCT”):
Simon Allen ($) |
Philip Moyer ($) |
Average of Other NEOs ($) (b) |
||||||||||
| 2026 Total Compensation Reported in SCT |
3,401,562 |
8,290,848 |
1,150,284 |
|||||||||
| Less, value of stock awards reported in SCT |
0 |
(6,552,040 |
) |
0 |
||||||||
| Less, value of option awards reported in SCT |
0 |
0 |
(159,433 |
) | ||||||||
| Plus, year-end value of awards granted in fiscal year 2026 that were unvested and outstanding as of 3/31/2026(a) |
0 |
7,332,697 |
97,985 |
|||||||||
| Plus, amount equal to the change as of 3/31/2026 in the value of awards granted in fiscal year 2025 that were unvested and outstanding as of 3/31/2026 (a) |
(13,909,900 |
) |
0 |
(3,282,851 |
) | |||||||
| Plus, value of awards granted in fiscal year 2026 that vested in fiscal year 2026 |
0 |
499,998 |
7,430 |
|||||||||
| Plus, amount equal to the change as of the vesting date in the value of awards granted in fiscal year 2025 for which all applicable vesting conditions were satisfied as of 3/31/2026 (a) |
(1,861,163 |
) |
0 |
(92,433 |
) | |||||||
| Less, the value as of 3/31/2026 of any awards granted in any prior fiscal year that failed to meet the applicable vesting conditions during fiscal year 2026 |
0 |
0 |
0 |
|||||||||
| Plus, the value of any dividends or other earnings paid on stock or option awards in fiscal year 2026 prior to the vesting date that are not otherwise included in the total compensation for fiscal year 2026 |
0 |
0 |
0 |
|||||||||
| Compensation Actually Paid for fiscal year 2026 |
(12,369,501 |
) |
9,571,503 |
(2,279,018 |
) | |||||||
(a) |
The fair value of the RSUs is based on a price of $13.70 per share, which was the closing sale price of the Company’s Common Stock on the NYSE on March 31, 2026, the last trading day of the fiscal year ended March 31, 2026. For the PSUs and stock options subject to a market condition, fair value is calculated in accordance with FASB ASC 718 using a Monte Carlo Simulation model. For the other stock options, fair value is calculated in accordance with FASB ASC 718 using the Black-Scholes option-pricing model. |
(b) |
Figures for all Other NEOs are included in the average figures shown in this column. |
Relationship Between Compensation Actually Paid and TSR
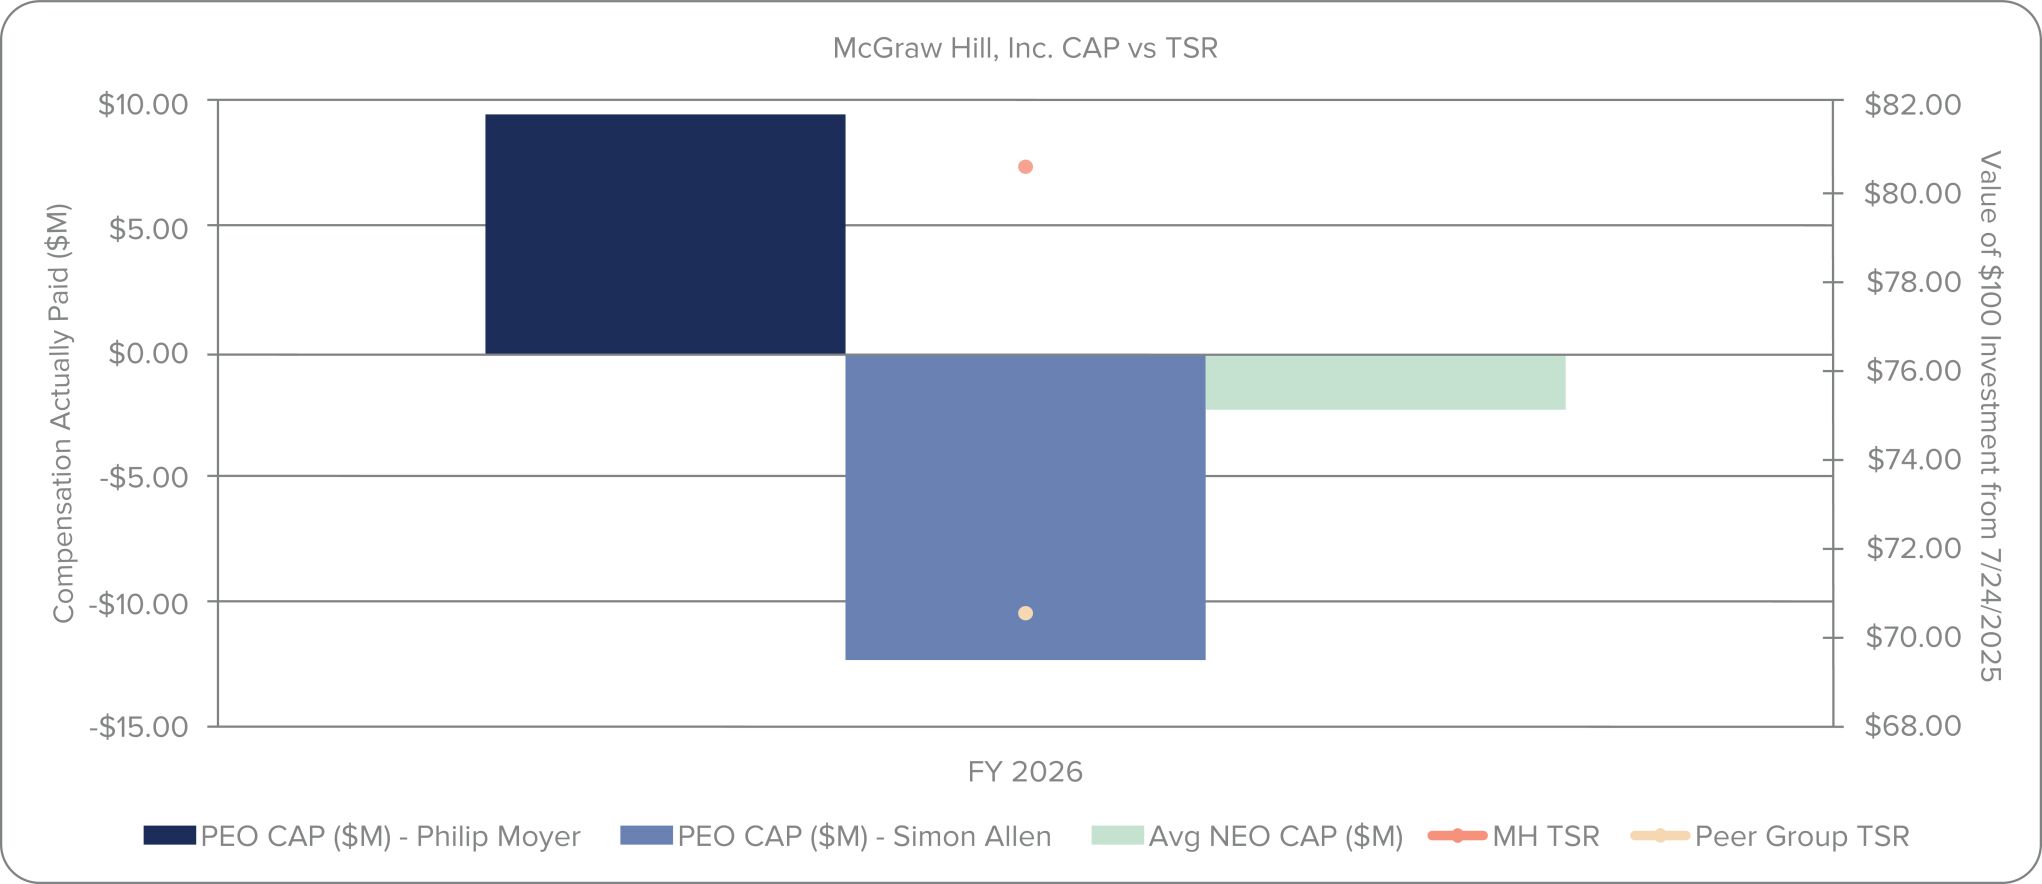
The following chart sets forth the relationship between: (i) 2026 Compensation Actually Paid to our CEO and the average of 2026 Compensation Actually Paid to the Other NEOs and (ii) the Company’s cumulative TSR over the Measurement Period and between the Company’s cumulative TSR and the Peer Group’s cumulative TSR over the same period.
CEO and Average Other NEO Compensation Actually Paid Versus Company TSR Versus Peer Group TSR
Relationship Between Compensation Actually Paid and Net Income
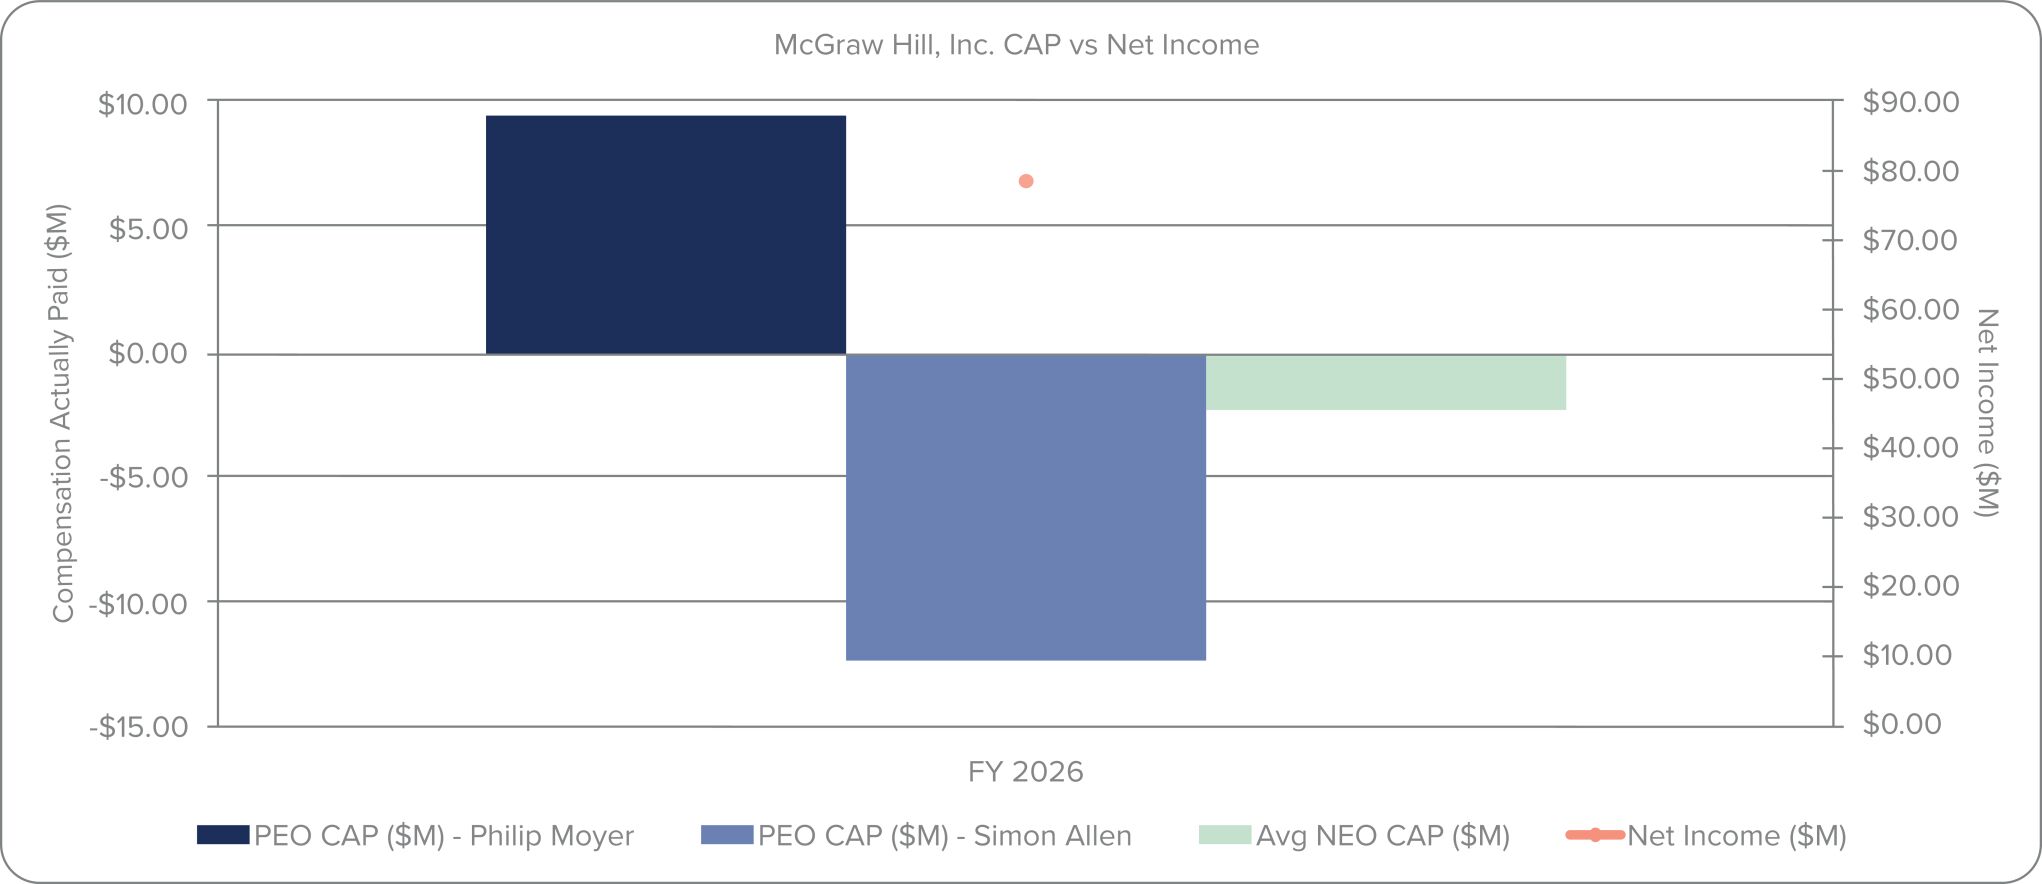
The following chart sets forth the relationship between: (i) 2026 Compensation Actually Paid to our CEOs and the average of
2026
Compensation Actually Paid to the Other NEOs and (ii) our 2026 Net Income. CEO and Average Other NEO Compensation Actually Paid Versus Net Income
Relationship Between Compensation Actually Paid and Adjusted EBITDA
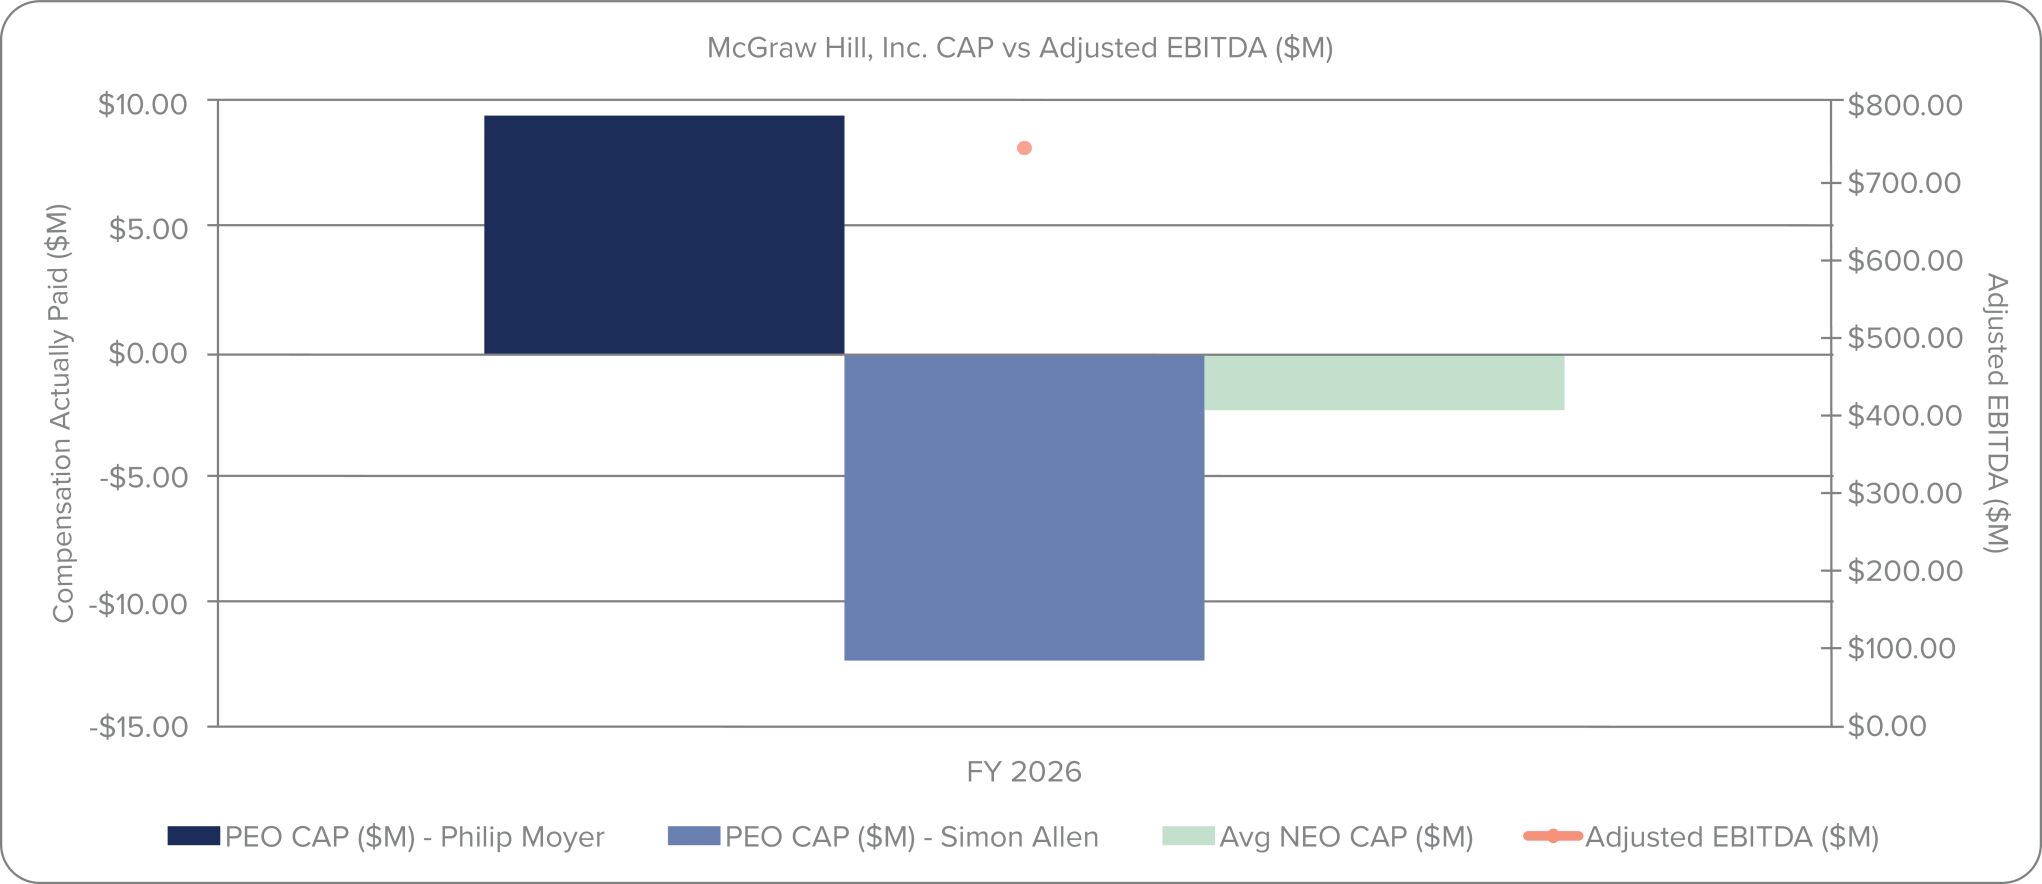
The following chart sets forth the relationship between: (i) 2026 Compensation Actually Paid to our CEOs and the average of 2026 Compensation Actually Paid to the Other NEOs and (ii) our 2026 Adjusted EBITDA.
CEO and Average Other NEO Compensation Actually Paid Versus Adjusted EBITDA
Relationship Between Compensation Actually Paid and TSR
The following chart sets forth the relationship between: (i) 2026 Compensation Actually Paid to our CEO and the average of 2026 Compensation Actually Paid to the Other NEOs and (ii) the Company’s cumulative TSR over the Measurement Period and between the Company’s cumulative TSR and the Peer Group’s cumulative TSR over the same period.
CEO and Average Other NEO Compensation Actually Paid Versus Company TSR Versus Peer Group TSR
Most Important Financial Performance Measures
The following table presents the financial performance measures that the Company considers to have been the most important in linking Compensation Actually Paid to our NEOs for the fiscal year ended March 31, 2026 to Company performance. For more information about these measures, see “Compensation Discussion and Analysis- Components of Compensation for the Fiscal Year Ended March 31,
2026
.” The measures in these tables are not ranked. | Most Important Financial Performance Measures for the Fiscal Year Ended March 31, 2026 |
| Adjusted EBITDA |
| Share price |
| Multiple of invested capital |