Pay vs Performance Disclosure - USD ($)
Dec. 31, 2025
Dec. 31, 2024
Dec. 31, 2023
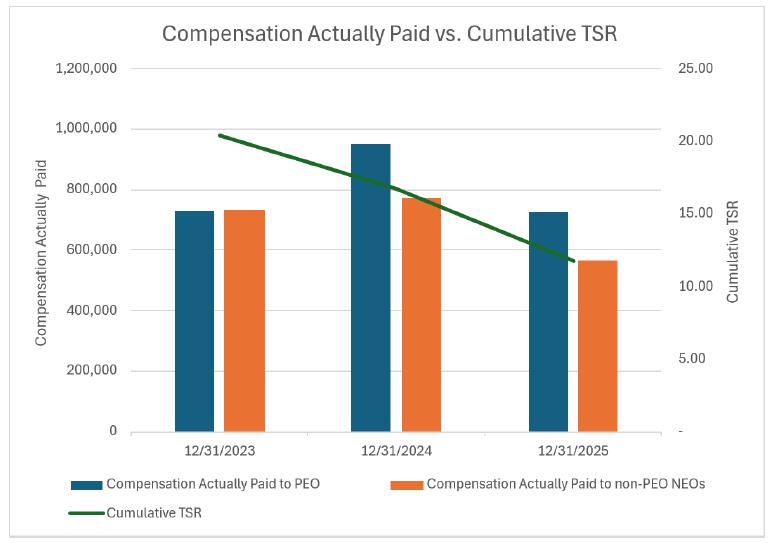
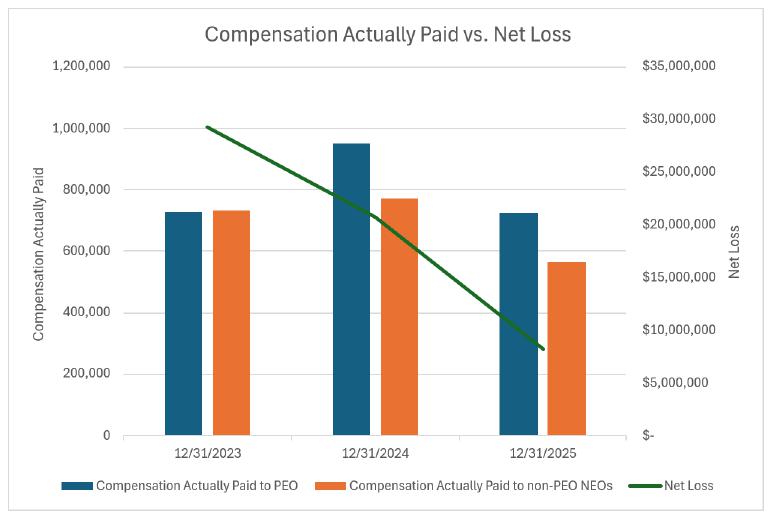
| Year | Summary Compensation Table Total for PEO($)(1) | Compensation Actually Paid to PEO($)(2) | Average Summary Compensation Table Total for Non-PEO Named Executive Officers($) | Average Compensation Actually Paid to Non-PEO Named Executive Officers($)(3) | Value of Initial Fixed $100 Investment Based On Total Shareholder Return($) | Net Income/(Loss) ($) | |||||||||||||||||||
| 2025 | $ | 808,431 | $ | 723,164 | $ | 679,233 | $ | 564,719 | $ | 11.73 | $ | (8,197,439 | ) | ||||||||||||
| 2024 | $ | 899,695 | $ | 953,144 | $ | 895,556 | $ | 770,636 | $ | 16.70 | $ | (20,718,957 | ) | ||||||||||||
| 2023 | $ | 1,333,401 | $ | 729,761 | $ | 994,690 | $ | 734,380 | $ | 20.37 | $ | (29,246,760 | ) | ||||||||||||
| (1) | For years 2025, 2024 and 2023, Dr. Phillip P. Chan has been our Principal Executive Officer. The averages for year 2025 for our Non-PEO Named Executive Officers consist of our President and Chief Operating Officer (Vincent J. Capponi), our Chief Financial Officer (Peter J. Mariani), and our Chief Medical Officer (Efthymios, N. Deliargyris). The averages for 2024 for our Non-PEO Named Executive Officers consists of Vincent J. Capponi, our Chief Financial Officer (Kathleen P. Bloch from January 1, 2024 to August 13, 2024 and Peter J. Mariani from August 14, 2024 to December 31, 2024), and Efthymios, N. Deliargyris. The averages for 2023 for our Non-PEO Named Executive Officers consists of Vincent J. Capponi, Kathleen P. Bloch, and Efthymios, N. Deliargyris. |
| (2) | Adjustment to Compensation Actually Paid to PEO include deduction of “stock awards” and “options awards” for the year, which include a) add award granted in the year that remain outstanding and unvested at fair value as of end of the year, b) add award granted in the year that vested in the same year at fair value as of the vesting date, c) add or subtract (if negative) any award granted before the year and remain outstanding and unvested as of year-end at fair value, d) add or subtract (if negative) any award granted before the year but vested during the year at fair value as of the vesting date, e) subtract any award vested and forfeited at fair value as of end of the prior year, f) add unvested award on which dividends or other earnings were paid during the year not otherwise included in summary total compensation column. |
| (3) | Adjustment to Average Compensation Actually Paid to Non-PEO Named Executive Officers. |
| Adjustment to Determine Compensation “Actually Paid” to PEO | ||||||||||||
| 2025 | 2024 | 2023 | ||||||||||
| Deduction for Amounts Reported under the “Stock Awards” Column in the SCT | (105,600 | ) | (91,680 | ) | (307,110 | ) | ||||||
| Deduction for Amounts Reported under the “Option Awards” Column in the SCT | (100,862 | ) | (169,888 | ) | (374,514 | ) | ||||||
| Increase for Fair Value of Awards Granted During the Year that Remain Unvested as of Year-end | 27,428 | 144,361 | 188,015 | |||||||||
| Increase for Fair Value of Awards Granted During the Year that Vested During the Year | ||||||||||||
| Increase/(Decrease) for Change in Fair Value from Prior Year-end to Current Year-end of Awards Granted Prior to Year that were Outstanding and Unvested as of Year-end | (32,639 | ) | (58,377 | ) | (341,105 | ) | ||||||
| Increase/(Decrease) for Change in Fair Value from Prior Year-end to Vesting Date of Awards Granted Prior to Year that Vested During the Year | 126,406 | 229,032 | 231,073 | |||||||||
| Deduction of Fair Value of Awards Granted Prior to year that were Forfeited during year | ||||||||||||
| Increase based on Dividends or Other Earnings Paid during year Prior to Vesting Date of Award | ||||||||||||
| Total Adjustments | (85,267 | ) | 53,448 | (603,641 | ) | |||||||
| Deduction for Amounts Reported under the “Stock Awards” Column in the SCT | (76,867 | ) | (122,274 | ) | (180,313 | ) | ||||||
| Deduction for Amounts Reported under the “Option Awards” Column in the SCT | (72,984 | ) | (244,350 | ) | (242,195 | ) | ||||||
| Increase/(Decrease) for Fair Value of Awards Granted During the Year that Remain Unvested as of Year-end | 19,724 | 188,731 | 130,704 | |||||||||
| Increase for Fair Value of Awards Granted During the Year that Vested During the Year | 20,886 | |||||||||||
| Increase/(Decrease) for Change in Fair Value from Prior Year-end to Current Year-end of Awards Granted Prior to Year that were Outstanding and Unvested as of Year-end | (53,424 | ) | (106,288 | ) | (164,467 | ) | ||||||
| Increase/(Decrease) for Change in Fair Value from Prior Year-end to Vesting Date of Awards Granted Prior to Year that Vested During the Year | 69,037 | 159,261 | 175,076 | |||||||||
| Deduction of Fair Value of Awards Granted Prior to year that were Forfeited during year | ||||||||||||
| Increase based on Dividends or Other Earnings Paid during year Prior to Vesting Date of Award | ||||||||||||
| Total Adjustments | (114,514 | ) | (124,920 | ) | (260,310 | ) | ||||||