Shareholder Report
Apr. 30, 2026
USD ($)
$ / shares
This report describes changes to the Fund that occurred during the reporting period.
WHAT WERE THE FUND COSTS FOR THE LAST YEAR? (based on a hypothetical $10,000 investment)
|
Fund Name
|
Costs of a $10,000 investment
|
Costs paid as a percentage of a $10,000 investment*
|
|
Putnam PanAgora ESG International Equity ETF
|
$54
|
0.49%
|
HOW DID THE FUND PERFORM LAST YEAR AND WHAT AFFECTED ITS PERFORMANCE?
For the twelve months ended April 30, 2026, Putnam PanAgora ESG International Equity ETF returned 22.11%. The Fund compares its performance to the MSCI EAFE Index-NR, which returned 24.60% for the same period.
PERFORMANCE HIGHLIGHTS
|
Top contributors to performance:
|
|
|
↑
|
Market intelligence and management & governance factor composites outperformed.
|
|
↑
|
Among countries, Sweden was the top contributor. Within the country, an overweight position in Sandvik AB, an engineering group serving mining, rock processing, metal cutting and advanced manufacturing, contributed the most. Its stock rose because orders and revenue strengthened, mining demand stayed robust, margins remained resilient, and tungsten-related demand boosted investor expectations after a strong Q1 2026 report. The company was held overweight due to its high scores in environmental and growth factors.
|
|
↑
|
Among sectors, information technology was the top contributor. An underweight position in SAP SE, a Germany-based enterprise software supplier in cloud ERP, business applications, and AI-enabled corporate systems, was the top performer in the sector. Its stock fell driven by weaker-than-expected cloud backlog guidance, slower cloud migration momentum, larger deal timing, artificial intelligence (AI) competition concerns, tariff uncertainty, and broader software-sector rotation. The company was held underweight due to its low scores in value, social, and environmental factors.
|
|
Top detractors from performance:
|
|
|
↓
|
The alpha model detracted from performance.
|
|
↓
|
Among countries, the U.K. was the top detractor. An overweight in 3i Group PLC, a private equity and infrastructure investment company, was the top laggard. Its stock fell due to slowing growth at Action, its key Dutch non-food discount retailer, plus weakness in France, valuation concerns, analyst downgrades, weather pressures, and skepticism over Action’s costly U.S. expansion. The company was held overweight due to its high factor scores in governance and value.
|
|
↓
|
Among sectors, consumer discretionary was the top detractor. An overweight position in Sony Group Corp, a Japan-based multinational entertainment and technology company, was one of the top laggards in the sector. Its stock declined despite solid fundamentals, mainly due to concerns over rising memory costs pressuring PlayStation margins, uncertainty around the BRAVIA TV joint venture with TCL, a one-time impairment charge in gaming, weaker consumer electronics demand, tariff risks, and layoffs at Sony Pictures. The Fund continued to hold an overweight position in Sony Group Corp due to its positive scores in social and quality factors.
|
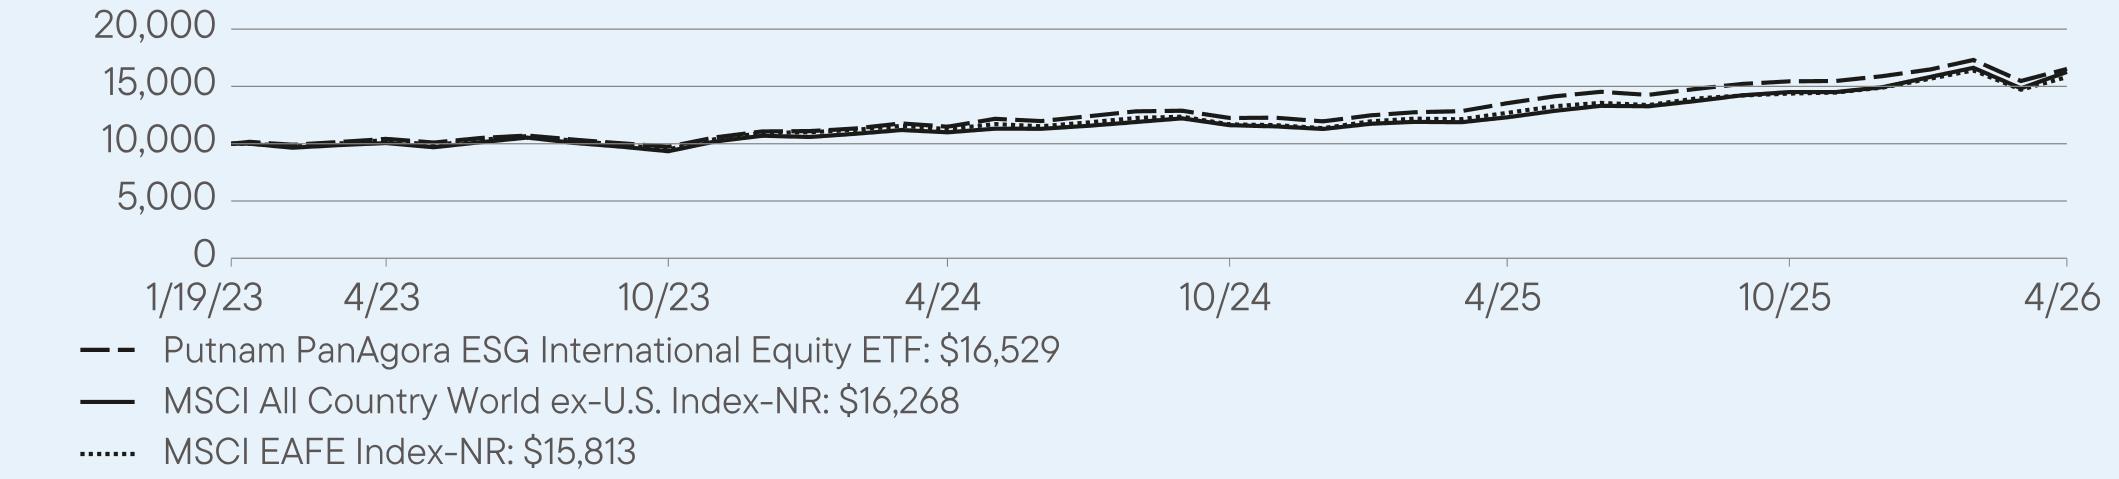
AVERAGE ANNUAL TOTAL RETURNS (%) Period Ended April 30, 2026
|
|
1 Year
|
Since Inception
(1/19/2023) |
|
Putnam PanAgora ESG International Equity ETF (NAV)
|
22.11
|
16.56
|
|
MSCI All Country World ex-U.S. Index-NR
|
32.20
|
16.03
|
|
MSCI EAFE Index-NR
|
24.60
|
14.93
|
For current month-end performance, please call Franklin Templeton at (800) DIAL BEN/342-5236 or visit
https://www.franklintempleton.com/investments/options/exchange-traded-funds.
https://www.franklintempleton.com/investments/options/exchange-traded-funds.
Important data provider notices and terms available at www.franklintempletondatasources.com.
KEY FUND STATISTICS (as of April 30, 2026)
|
Total Net Assets
|
$4,147,013
|
|
Total Number of Portfolio Holdings
|
138
|
|
Total Management Fee Paid (based on a unitary fee)
|
$1,057,543
|
|
Portfolio Turnover Rate
|
89%
|
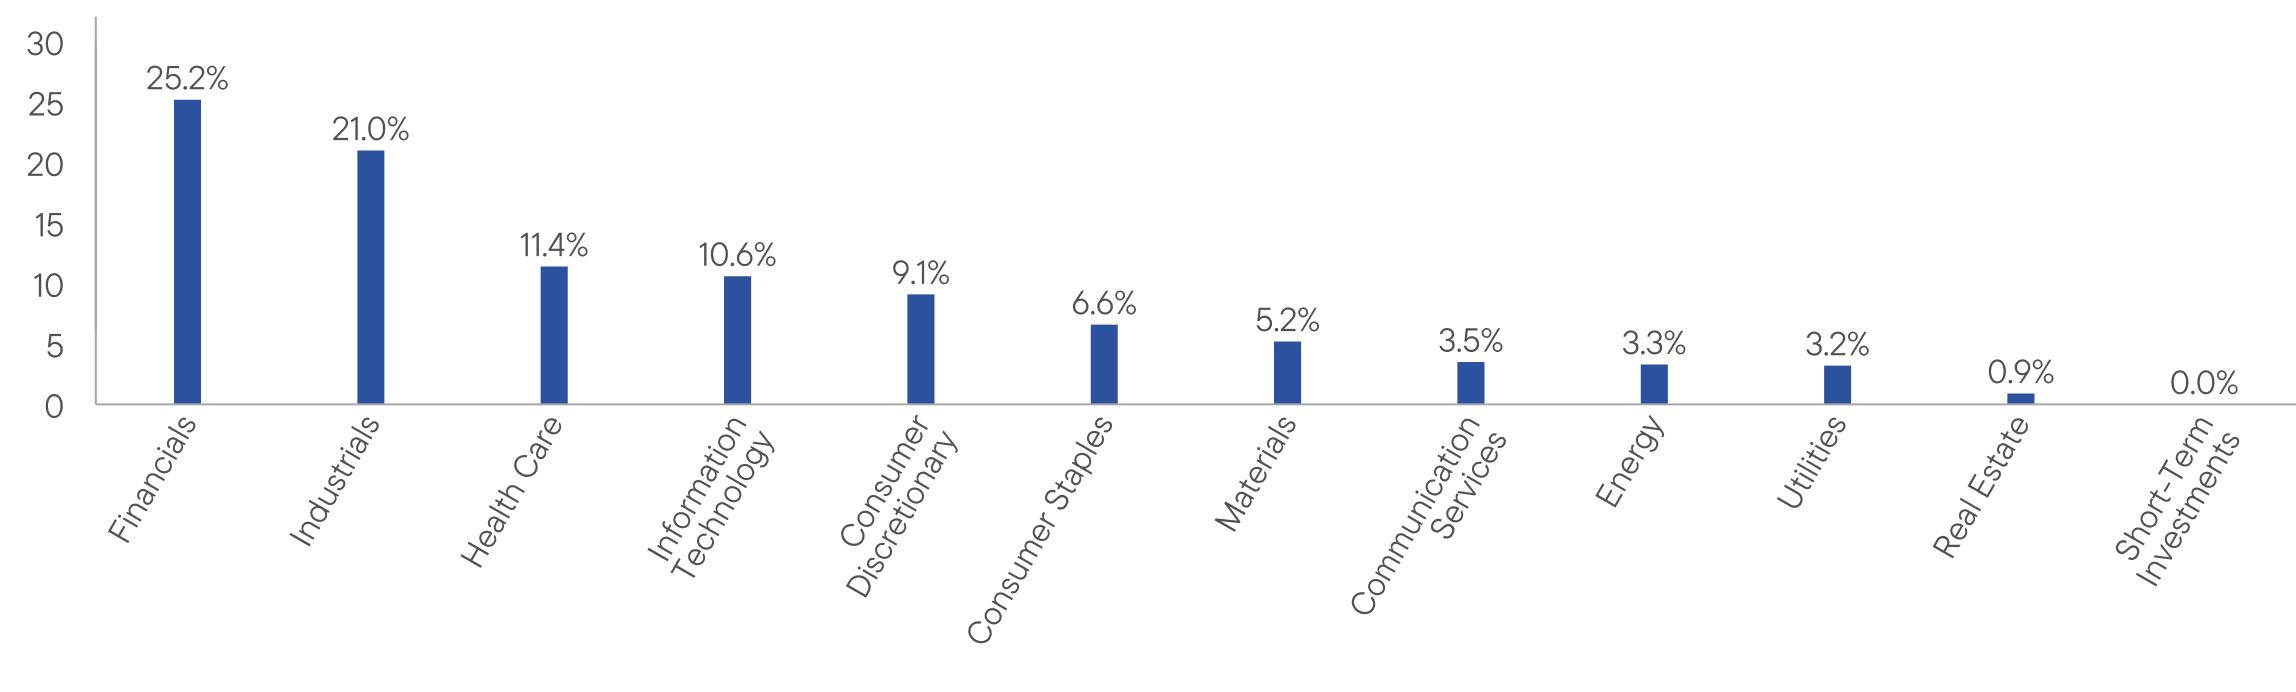
WHAT DID THE FUND INVEST IN? (as of April 30, 2026)
Portfolio Composition*,† (% of Total Investments)
HOW HAS THE FUND CHANGED?
At a meeting held on March 26, 2026, the Board of Trustees of Putnam ETF Trust, on behalf of the Fund, approved a plan to liquidate and dissolve the Fund, upon recommendation by Putnam Investment Management, LLC, the Fund’s investment adviser.
The liquidation of the Fund is expected to occur on or about June 16, 2026 (the “Liquidation Date”), although the Fund may make dispositions of portfolio holdings prior to the Liquidation Date.
Effective as of the close of business on May 19, 2026, the Fund will no longer accept orders for the purchase of creation units, and effective as of the close of business on June 9, 2026, the Fund will no longer accept redemption orders. Trading for the Fund on NYSE Arca, Inc. will be suspended prior to market open on June 10, 2026.
When the Funds are in the process of liquidating their portfolios, which is anticipated to commence prior to June 10, 2026, the Funds will hold cash and securities that may not be consistent with the Funds’ investment objectives and strategies.
This is a summary of certain changes to the Fund since May 1, 2025. For more complete information, you may review the Fund’s current prospectus and any applicable supplements, at https://www.franklintempleton.com/regulatory-fund-documents or upon request at (800) DIAL BEN/342-5236 or ETFs-Product@franklintempleton.com.
| [1] |
|
||
| [2] |
|
||
| [3] |
|