| Fiscal Year | Summary Compensation Table Total for CEO | Compensation Actually Paid to CEO (1) | Summary Compensation Table Total for CFO | Compensation Actually Paid to CFO (1) | Value of Initial Fixed $100 Investment Based on Total Shareholder Return | Net Loss | ||||||||||||||||||
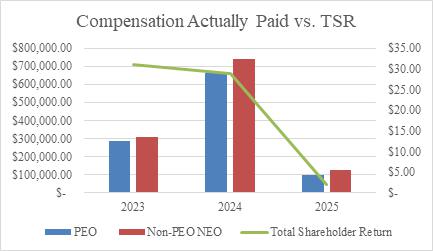
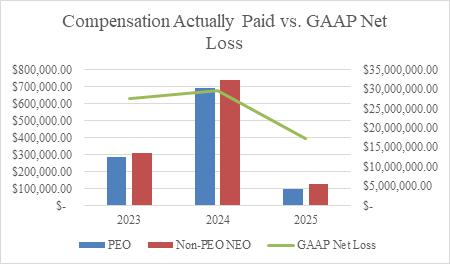
| 2025 | $ | 738,500 | $ | 96,059 | $ | 687,960 | $ | 126,801 | $ | 2.07 | $ | 17,300,000 | ||||||||||||
| 2024 | $ | 1,448,350 | $ | 660,990 | $ | 1,424,644 | $ | 739,958 | $ | 28.89 | $ | 29,700,000 | ||||||||||||
| 2023 | $ | 1,303,800 | $ | 283,915 | $ | 1,193,150 | $ | 309,338 | $ | 31.11 | $ | 36,200,000 | ||||||||||||
| (1) | The amounts represent compensation actually paid to Dr. Spana, our CEO, and Mr. Wills, our CFO. See “Executive Compensation – Summary Compensation Table” for certain other compensation and awards granted to our CEO and CFO for each of the fiscal years ended June 30, 2025, 2024 and 2023. |
Compensation actually paid to our CEO represents the total compensation reported in the Summary Compensation Table for the applicable fiscal year, as adjusted as follows:
| Adjustments to Determine Compensation “Actually Paid” to Our CEO | 2025 | 2024 | 2023 | |||||||||
| Total Compensation in the Summary Compensation Table | $ | 738,500 | $ | 1,448,350 | $ | 1,303,800 | ||||||
| Deduction for Amounts Reported Under the Columns “Stock Awards,” “Option Awards,” and “All Other Compensation” in the Summary Compensation Table | (17,500 | ) | (391,350 | ) | (341,300 | ) | ||||||
| Fair Value as of the End of the Covered Fiscal Year of All Awards Granted During the Covered Fiscal Year that Are Outstanding and Unvested as of the End of the Covered Fiscal Year | 395,680 | 309,785 | ||||||||||
| Change in Fair Value of Outstanding and Unvested Stock Awards and Option Awards Granted in Prior Fiscal Year | (214,148 | ) | (1,991 | ) | (130,591 | ) | ||||||
| Change in Fair Value as of Vesting Date of Stock Awards and Option Awards Granted in Prior Fiscal Years For Which Applicable Vesting Conditions Were Satisfied During Fiscal Year | (410,793 | ) | (789,699 | ) | (857,779 | ) | ||||||
| Fair Value as of Prior Fiscal Year End of Stock Awards and Option Awards Granted in Prior Fiscal Years That Failed to Meet Applicable Vesting Conditions During Fiscal Year | ||||||||||||
| Total Adjustments | (642,441 | ) | (787,360 | ) | (1,019,885 | ) | ||||||
| Compensation Actually Paid to the CEO | $ | 96,059 | $ | 660,990 | $ | 283,915 | ||||||
Compensation actually paid to our CFO represents the total compensation reported in the Summary Compensation Table for the applicable fiscal year, as adjusted as follows:
| Adjustments to Determine Compensation “Actually Paid” to Our CFO | 2025 | 2024 | 2023 | |||||||||
| Total Compensation in the Summary Compensation Table | $ | 687,960 | $ | 1,424,644 | $ | 1,193,150 | ||||||
| Deduction for Amounts Reported Under the Columns “Stock Awards,” “Option Awards,” and “All Other Compensation” in the Summary Compensation Table | (17,960 | ) | (342,444 | ) | (299,350 | ) | ||||||
| Fair Value as of the End of the Covered Fiscal Year of All Awards Granted During the Covered Fiscal Year that Are Outstanding and Unvested as of the End of the Covered Fiscal Year | 345,270 | 269,650 | ||||||||||
| Change in Fair Value of Outstanding and Unvested Stock Awards and Option Awards Granted in Prior Fiscal Year | (186,915 | ) | (2,700 | ) | (113,350 | ) | ||||||
| Change in Fair Value of Outstanding and Unvested Stock Awards and Option Awards Granted in Prior Fiscal Years | (356,284 | ) | (684,812 | ) | (740,762 | ) | ||||||
| Fair Value as of Prior Fiscal Year End of Stock Awards and Option Awards Granted in Prior Fiscal Years That Failed to Meet Applicable Vesting Conditions During Fiscal Year | ||||||||||||
| Total Adjustments | (561,159 | ) | (684,686 | ) | (883,812 | ) | ||||||
| Compensation Actually Paid to the CFO | $ | 126,801 | $ | 739,958 | $ | 309,338 | ||||||
Compensation Actually Paid and Cumulative Total Shareholder Return (“TSR”)
The following chart sets forth the relationship between compensation actually paid to the PEO and the NEO, compared to our cumulative TSR for each of the years presented:
Compensation Actually Paid and Net Loss
The following chart sets forth the relationship between compensation actually paid to the PEO and the NEO, compared to our net loss reported in our most recent 10-K filings for each of the years presented:
| [1] | The amounts represent compensation actually paid to Dr. Spana, our CEO, and Mr. Wills, our CFO. See “Executive Compensation – Summary Compensation Table” for certain other compensation and awards granted to our CEO and CFO for each of the fiscal years ended June 30, 2025, 2024 and 2023. |