Exhibit 99.1


LOGO

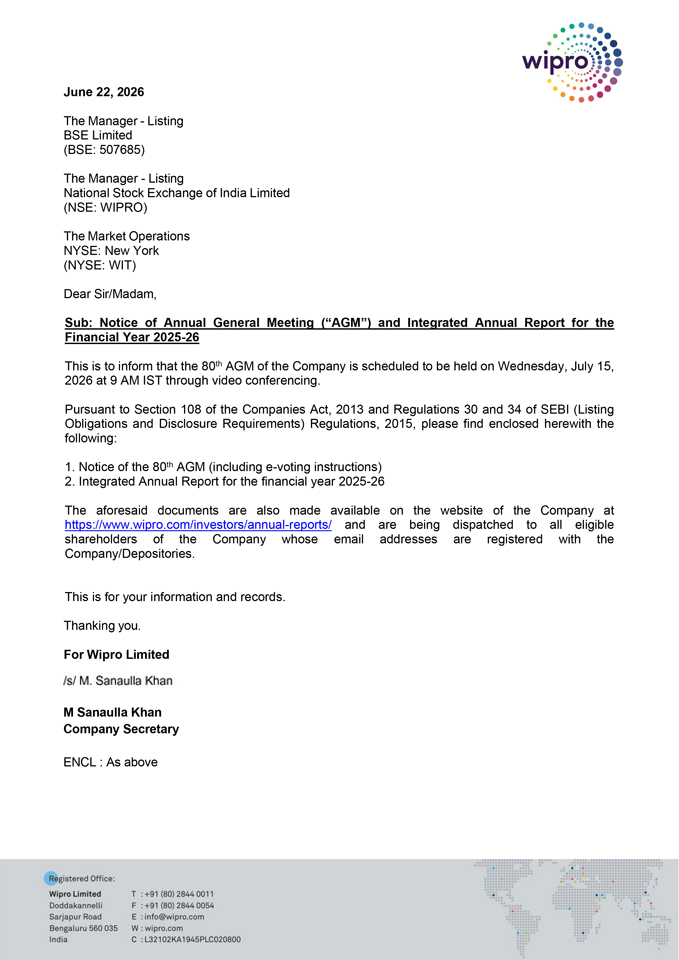
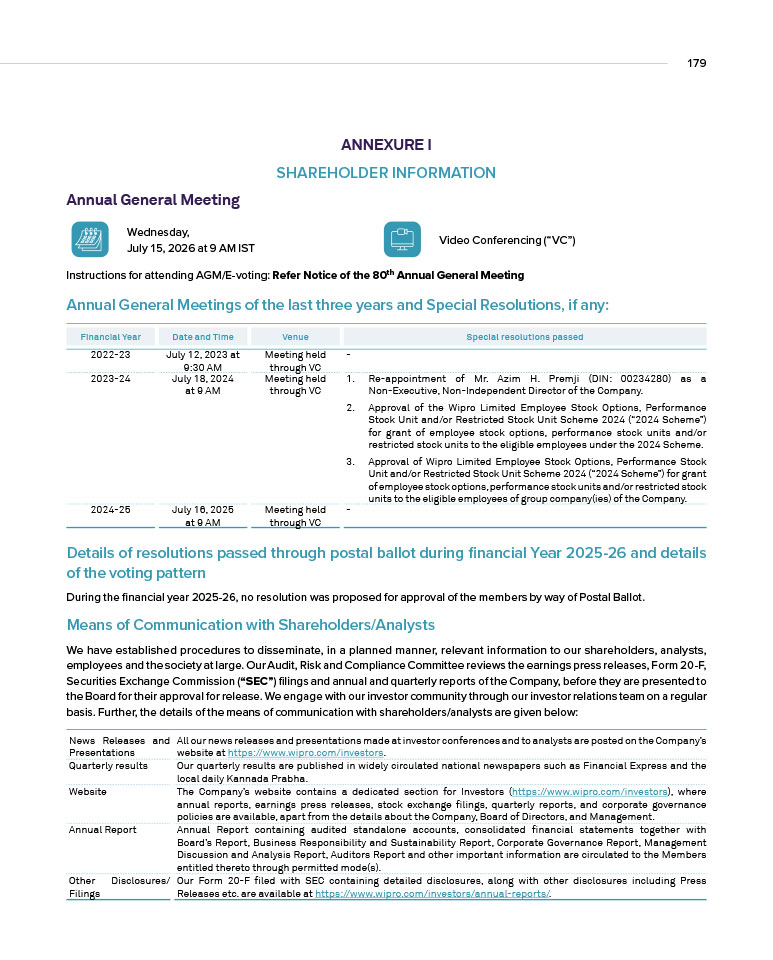
June 22, 2026 The Manager—Listing BSE Limited (BSE: 507685) The Manager—Listing National Stock Exchange of India Limited (NSE: WIPRO) The Market Operations NYSE: New York (NYSE: WIT) Dear Sir/Madam, Sub: Notice of Annual General Meeting (“AGM”) and Integrated Annual Report for the Financial Year 2025-26 This is to inform that the 80th AGM of the Company is scheduled to be held on Wednesday, July 15, 2026 at 9 AM IST through video conferencing. Pursuant to Section 108 of the Companies Act, 2013 and Regulations 30 and 34 of SEBI (Listing Obligations and Disclosure Requirements) Regulations, 2015, please find enclosed herewith the following: 1. Notice of the 80th AGM (including e-voting instructions) 2. Integrated Annual Report for the financial year 2025-26 The aforesaid documents are also made available on the website of the Company at https://www.wipro.com/investors/annual-reports/ and are being dispatched to all eligible shareholders of the Company whose email addresses are registered with the Company/Depositories. This is for your information and records. Thanking you. For Wipro Limited M Sanaulla Khan Company Secretary ENCL : As above


LOGO

Empowering enterprises to lead in an AI-first world


LOGO

Reporting Context 01 01 About the Report About the Report 02 Empowering enterprises to lead in an AI-first world We are happy to present our 11th and Exchange Board of India (SEBI). Corporate Overview Integrated Annual Report. This Report The Climate Risk and Environmental 04 About Wipro includes financial and non-financial Sustainability sections of this report AI-powered performance of our IT business and include the recommendations set out 06 Consulting-led 18 AI-powered is aligned to principles of Integrated by the Task Force on Climate-Related 24 Industry-focused Framework (updated January 2021), Financial Disclosures (TCFD) and the 26 Client-centric now part of IFRS Foundation. IFRS S1/S2 standards. 30 Purpose-driven Reporting Framework Reporting Scope and 31 Year in Review 32 Awards and Recognitions In addition, this Report is aligned to Boundary 33 Analyst Recognitions 18 the Integrated Reporting Framework The Report complies with financial 34 Board of Directors by the International Sustainability and statutory data requirements of the Standards Board (ISSB), Sustainability Companies Act, 2013 (including the Leadership Insights and Outlook Accounting Standards Board (SASB), Rules made thereunder), Accounting ISO 14064, United Nations Global Standards, the Securities and Exchange 36 Chairman’s Letter Compact (UNGC), WEF Stakeholder 38 CEO’s Letter Board of India (Listing Obligations and Capitalism metrics and Business Disclosure Requirements) Regulations, 40 Management Discussion and Analysis Responsibility and Sustainability Report Management 2015 and the Secretarial Standards, as Discussion (BRSR) requirements of Securities may be applicable. Sustainability at Wipro and Analysis Navigate our Report 54 Value Creation Model 56 Impact Valuation Report 60 Stakeholder Engagement Capitals Stakeholder Groups Read more on page 54. Read more on page 60. 64 Materiality Assessment 68 ESG Strategy and Governance 40 N F Value Creation for Stakeholders Natural Financial Customers Employees I H 70 Investor Returns Intellectual Human Suppliers Communities 72 Environmental Sustainability 84 Community Initiatives S M 94 Customer Stewardship Social and Relationship Manufactured Investors Planet (and Human 98 Supplier Synergies Well-being) 106 People Strategic Priorities and Value Creation Mapping Our Approach to Managing Risk Capitals Impacted Stakeholders Impacted 112 Risk Management Building Large Accounts in Profitable 117 Climate and ESG Risks Board’s F I H M S  Markets, Prioritized Sectors 121 Key Financial and Market Risks Report Report Sourcing, Shaping and Winning Large Deals F I H M S  Statutory Reports and Financial Statements Differentiating with Wipro Intelligence™ F I H M S 122 Board’s Report    158 Corporate Governance Report Building Talent at Scale F I H M S 188 Standalone Financials under Ind AS Five Pillars of Client Centricity: F I  300 Consolidated Financials under Ind AS 122 • Delivery innovation 416 Consolidated Financials under IFRS • Driving delivery excellence M S N 514 Business Responsibility and Sustainability • Delivery-led growth • Demand fulfillment Contents Report 2025-26 • Delivery operations


LOGO

02 Empowering enterprises to lead in an AI-first world. - 26 2025 REPORT ANNUAL INTEGRATED WIPRO    03 Artificial intelligence has moved from aspiration to agenda. For enterprises worldwide, it is no longer a question of whether to adopt AI but how to do so in ways that deliver real, responsible, and lasting value. FY26 marked this inflection, as organizations grappled with accelerating change, rising expectations, and the need for outcomes that endure beyond experimentation. At Wipro, this moment reinforces a path we have been building toward, one defined by clarity of intent and execution rigor. Our focus is anchored in five enduring strengths that shape how we engage, build, and deliver for clients. We remain consulting-led, starting with deep contextual understanding before technology decisions are made. We are AI-powered, embedding intelligence into the core of enterprise transformation. We are industry-focused, bringing domain depth to the problems that matter most. We are client-centric, aligning every engagement to measurable business outcomes. And we are purpose-driven, ensuring progress, in business and society, is responsible, inclusive, and sustainable. These strengths come together through Wipro Intelligence™, our unified suite of AI-powered platforms and solutions, guided by a simple but defining principle: proof over promise. In a landscape marked by heightened expectations and rapid innovation, intent alone is insufficient. What distinguishes leadership is the ability to translate ambition into outcomes and to do so with rigor, governance, and responsibility. For over 80 years, Wipro has reinvented itself across industries, technology waves, and business models. That ability to navigate change is built on deep problem-solving, unshakeable values, and the discipline to drive strategy into execution, even as the scale and complexity of transformation continue to rise. As we reflect on FY26 and move into FY27, our conviction remains clear. The enterprises that will succeed are those that leverage AI with purpose, move decisively from strategy to scale, and deliver durable impact. Wipro remains committed to enabling that end-to-end journey. Consulting-led AI-powered Industry-focused Client-centric Purpose-driven


LOGO

04 CORPORATE OVERVIEW Wipro Limited is a leading AI-powered technology services and consulting company focused on building innovative solutions that address clients’ most complex digital transformation needs. Leveraging our consulting-led approach and the Wipro Intelligence™ unified suite of AI-powered platforms, solutions, and transformative offerings, we help clients realize their boldest ambitions to build intelligent and sustainable businesses. The Wipro Innovation Network–part of the Wipro Intelligence™ suite–underpins our commitment to client-centric co-innovation and co-creation by bringing together capabilities from the innovation labs and partner labs, academia, and global tech communities. With over 240,000 employees and business partners across 65 countries, we deliver on the promise of helping our customers, colleagues, and communities thrive in an ever-changing world. SPOTLIGHT - 26 Wipro $10.5 bn 240K+ 2025 IT Services Revenue Employees REPORT (FY26) 66% 65 ANNUAL Economic interest vested Countries in philanthropy INTEGRATED 80 years About Of driving progress & purpose WIPRO 05 Spirit of Wipro Five Habits These values are our bedrock. They define and make us. When our behaviors and ways of working consistently Our character and destinies are energized by our values. reflect our values, we see the Five Habits in action. Be about passionate clients’ Being Respectful success Being Responsive Treat each Unyielding integrity in person with Always Communicating respect everything we do Demonstrating Stewardship Be responsible global and Building Trust Our vision is to be a trusted partner to our clients, guiding their transformation through a consulting-led, AI-powered approach and empowering them to lead in their industries. Our Five Strengths Consulting-led AI-powered Industry-focused Client-centric Purpose-driven Watch our Corporate Video


LOGO

06 CORPORATE OVERVIEW Consulting-led We start with deep contextual understanding before technology decisions are made. - 26 2025 REPORT ANNUAL INTEGRATED WIPRO    07 In an AI-first world, transformation cannot begin with This approach is anchored in deep industry expertise across technology alone. It must begin with context: a clear our priority sectors and industries–Banking, Financial Services understanding of a client’s business model, industry and Insurance; Consumer; Health; Energy; Manufacturing dynamics, operating realities, and growth ambitions. and Resources; Technology and Communications–and No two enterprises are the same. Their transformation strengthened by functional depth across AI advisory and journeys should not be either. This is why Wipro leads technology strategy; supply chain and operations; finance with consulting, bringing business judgment, industry transformation; people and change; sales, marketing insight, and execution discipline to the forefront of every and customer experience; and sustainability. It reflects a engagement, ensuring technology is applied with intent fundamental shift in client demand, from siloed services to and relevance. integrated transformation with clear, end-to-end accountability. Being consulting-led, for Wipro, means starting at the true At its core are Wipro’s four Global Business Lines (GBLs)–point of enterprise change: defining the problem, clarifying Consulting, Technology Services, Engineering, and Business complexity, and aligning transformation to measurable Process Services–and two business units: our AI-Native outcomes. It means listening deeply, diagnosing precisely, Business & Platforms Unit and Capco. making clear calls, and staying engaged until change Strategic Market Units bring market proximity and client is realized. relevance, while the Global Business Lines and business units provide depth, specialization, and execution scale. Operating Model Industry Sectors Organized by Regions Americas 1 Americas 2 Europe APMEA The four Strategic Market Units (SMUs) are the primary axis for our go-to-market. Horizontals Organized by Capabilities The four Global Business Lines (GBLs) focus on solutions, capabilities, and delivery. Consulting Technology Services Engineering Business Process Services AI-Native Business & Platforms Unit Capco


LOGO

08 CORPORATE OVERVIEW Wipro Consulting Wipro Domain and Consulting Domain and Consulting brings our deep industry focus Wipro Consulting partners with clients to help them and product/platform expertise to provide end-to-end imagine, design, and realize their future. We work business transformation acceleration–from insights to to deliver strategic and transformation services by results–and helps shape next-generation operating engaging deeply with the full C-suite, connecting models. We are a preferred transformation partner strategy to execution to drive measurable business of Forbes Global 2000 companies across industries. outcomes. Our end-to-end capabilities are designed to address our clients’ most pressing priorities, Capco enable cross-functional transformation, and ensure Capco, one of Wipro’s two business units, is a technology outcomes are aligned to enterprise objectives. and management consultancy specializing in driving We help clients tackle their most complex digital transformation initiatives by combining innovative challenges by combining deep industry insight, thinking with unrivaled industry knowledge to deliver functional expertise, and the power of technology. end-to-end data-driven solutions and fast-track digital Our consulting-led, AI-powered approach leverages initiatives for banking and payments, capital markets, Wipro’s platforms and solutions to drive intelligent wealth and asset management, insurance, and the transformation. Supported by a strong ecosystem energy sector. It offers a range of consulting services, of technology partners, we help clients unlock including strategy, risk, regulatory and compliance, efficiency, build competitive advantage, and and change management. navigate disruption with confidence. Aggne Aggne is a leading consulting and managed services company serving the insurance and Insurtech industries. Its unique capabilities significantly strengthen our value proposition in a fast-growing part of the insurance sector. We serve clients across BFSI; Consumer; Health; EMR; and Technology and Communications bringing deep functional expertise across Supply Chain and Operations, Finance, People and Change, Sales, Marketing and Customer Experience (CX), AI Advisory and Technology Strategy, and Sustainability. Industry Expertise - 26 Banking, Financial Services, and Insurance 2025 Strengthen risk and compliance, accelerate digital banking and wealth innovation, and enhance customer REPORT experience to build financial resilience. ANNUAL Consumer Elevate omnichannel experiences, drive pricing intelligence, and optimize demand forecasting to INTEGRATED fuel growth and loyalty. WIPRO 09 Health Enable predictive healthcare, accelerate R&D, improve SPOTLIGHT operational efficiency, and advance patient centric models. Energy, Manufacturing, and Resources Telecommunications Company Modernize grids, advance Industry 4.0, optimize asset Delivered significant reduction in O2C cost and performance, and enable sustainable operations across the unlocked substantial annual working capital value chain. through end-to-end digital transformation Technology and Communications Accelerate 5G adoption, modernize digital infrastructure, and Petrochemical Company transform network operations–powered by AI for the next Achieved substantial operating margin era of connectivity. improvement over three years through AI driven S&OP transformation Beyond industry expertise, our deep functional Global Telco Startup capabilities help ensure transformation delivers lasting impact to both the top and bottom line. Enabled a global satellite-powered connectivity ecosystem through digital product strategy and service design AI Advisory and Technology Strategy Shape AI-first, future-ready technology roadmaps aligned to business strategy. U.S. Auto Finance Captive Supply Chain and Operations Transformed loan originations with a modern Build resilient, agile supply chains and intelligent platform, improving automation, CX, and procurement capabilities end-to-end. speed to market Finance Transformation Increase transparency, strengthen performance analytics, and enable sustainable profitability. People and Change Wipro has launched a Consulting-led, AI-powered Enable workforce adaptability, future skills, leadership operating model bringing end-to-end accountability development, and culture transformation for a across four functional areas: future-ready organization. • People & Change Sales, Marketing, and Customer Experience • Supply Chain & Operations Redefine pricing, elevate customer engagement, and • Finance Transformation and Sales accelerate revenue growth. • Marketing & Customer Experience (CX) Sustainability Know more Embed ESG into core business strategy to drive long-term resilience and stakeholder value.


LOGO

10 CORPORATE OVERVIEW Services This GBL strengthens the sales-to-delivery continuum Technology through an integrated service line go-to-market and Our Technology Services GBL delivers delivery model, enabling clients to harness the full cutting-edge cloud-enabled and industry-specific potential of technology and accelerate transformation technology solutions to our clients. We offer at scale. It includes: clients forward-looking, AI-powered solutions for large-scale enterprise transformation by bringing • Cloud, Infrastructure, and Security Services (CISS) together intelligence insights, enterprise data • Industry Cloud & Digital (IC&D) and applications platforms, digital operations, • Enterprise Applications (EA) cybersecurity, and design and experience services. • Data, Analytics, and Artificial Intelligence (DAAI) • Designit Cloud, Infrastructure, and Security Services (CISS) As a security-first digital transformation, Wipro CISS brings together integrated Cloud, Infrastructure, Network, Digital Workplace, and Cybersecurity capabilities, through our consulting-led AI-powered approach powered by Wipro Intelligence™ to deliver secure growth, resilience, and superior experiences. We enable organizations to design, build, and operate resilient, digital foundations anchored in AI transformation, trust, and safety. Organizations partner with us to deliver security-first, AI-powered digital transformations at scale–that enable resilient, future-ready enterprises. SPOTLIGHT U.S. Medicare Advantage Insurer Reduction in prior authorization processing time from days to minutes through Wipro’s Agentic AI powered solution. - 26 2025 REPORT Energy Services Company ANNUAL 90% Reduction in contract processing time, powered INTEGRATED by AI, leading to significant cost savings WIPRO 11 Industry Cloud & Digital (IC&D) Data, Analytics, and Artificial Intelligence (DAAI) IC&D partners with organizations to integrate strategy, DAAI helps clients in their business transformation and design, and technology, providing digital transformation generates higher value by infusing data and AI across services. IC&D offers a range of services, including the value chain. We work with clients to get their data enterprise transformation, application modernization, quality and process ready for the future by formulating the data engineering, testing, and cloud-native platform services to decisions strategy and using business analytics and using AI and industry expertise to assist clients throughout data economics. their cloud journey. Together with our extensive partner These benefits are accelerated by industry and persona-and hyperscaler ecosystem, we can simplify, orchestrate centric ready-to-deploy solutions that are powered by and accelerate the cloud journey for our clients to help responsible AI. them thrive. Designit Enterprise Applications (EA) Designit provides end-to-end experience transformation Our EA team guides enterprises on their journey towards solutions that better connect brands, organizations, and application modernization and experience transformation businesses to their end users through a global team of by providing innovative AI, cloud solutions, and architecture designers, strategists, marketers, and creatives. strategies, and executing these strategies through the expertise of our enterprise partners, such as SAP, Oracle, We partner with clients across four key lenses of Salesforce, ServiceNow, and MS Dynamics. experience–product, customer, employee, and marketing–to design unified, human-centered solutions that drive lasting impact. Global Leader in Electrification and Automation 50% Cost reduction through a cloud-based workplace transformation for 105K+ employees Non-profit CSR Organization of a Pharmaceutical Company 24.5% Reduction in stroke-related hospitalizations through an AI-powered cardio health simulator


LOGO

12 CORPORATE OVERVIEW Engineering Our engineering approach emphasizes measurable Wipro outcomes and deployed solutions, combining Wipro Engineering aims to empower clients to consulting-led problem definition with AI-powered innovate at scale, build differentiated products and execution to deliver tangible results to clients. platforms, and deliver value across the full product This ecosystem spans a wide portfolio that includes and platform lifecycle through our consulting- a strategic product design capability, a global led and AI-powered engineering approach. Our semiconductor and systems engineering organization, capabilities span foundational technologies shaping and world-class testing and validation laboratories. global industries today, including AI, connectivity Our sector-focused consultants, engineers, and and 5G, semiconductor and system engineering, product designers work collaboratively across multiple cloud platforms, and intelligent manufacturing. stages of the product lifecycle—from strategy and architecture through design, development, validation, deployment, and lifecycle management. Wipro Engineering operates through the following practices: VLSI and System Design Designs and engineers custom silicon and hardware systems for advanced computing and digitally connected products. Capabilities include application-specific integrated circuits, system-on-chip design, pre- and post-silicon validation, embedded software, and advanced interconnect technologies, supporting semiconductor companies and product manufacturers across automotive, industrial, communications, and emerging technology segments. Mobility Engineering & Product Testing Enables development and validation of intelligent, connected, and mobile products. This practice provides embedded and platform software engineering, AI-driven mobile solutions, and comprehensive product testing, certification, and compliance services, supporting faster time to market and regulatory readiness across devices and platforms. - 26 2025 Connectivity REPORT Enables innovations across wireless, 5G, and enterprise connectivity ecosystems. This practice delivers consulting-led engineering services for 5G ANNUAL infrastructure, open radio access network integration, network disaggregation, edge and Telco cloud platforms, network automation, software integration, and device INTEGRATED and network certification and testing. WIPRO 13 Cloud Products and Platforms Enables customers to design, build, and modernize SPOTLIGHT cloud-native software products and platforms. Capabilities include product and platform engineering, cloud modernization, reliability and DevOps engineering, data engineering, and security, supporting scalable, 30,000 multi-tenant, and high-performance SaaS and platform Engineers solutions across hybrid and multi-cloud environments. Industry 4.0 Enables digital transformation of industrial products and operations through smart manufacturing solutions. 6,000+ This practice focuses on industrial IoT, robotics and Products engineered physical automation, digital twins, predictive maintenance, sustainability, and integrated operational platforms, combining domain consulting with deep engineering execution across discrete and process industries. Automotive Engineering 35+ Years of experience Supports automotive manufacturers and suppliers in the transition to next-generation mobility. This practice provides consulting-led engineering services across software-defined vehicles, electrification, connected vehicles, advanced driver assistance systems, infotainment platforms, and Driving Engineering autonomous functions, leveraging AI-enabled platforms Innovation Chip-to-Cloud and partner ecosystems to accelerate innovation and product deployment. Connected Services During fiscal year 2026, Wipro expanded its digital ER&D capabilities through the acquisition of DTS, now operating as Connected Services within Wipro Engineering. The acquisition deepens Wipro Engineering’s AI-powered engineering, digital transformation, and research and development excellence, strengthening its ability to deliver end-to-end engineering services that connect the physical and digital worlds.


LOGO

14 CORPORATE OVERVIEW Business Process Customer Experience Wipro’s customer experience services support customer Services engagement, service, sales, and marketing operations. Wipro’s Business Process Services support global These services integrate front office operations with organizations in operating, transforming, and AI-enabled capabilities to improve speed, accuracy, and continuously improving core enterprise functions. consistency across customer interactions, supporting Business Process Services are delivered as part customer experience and loyalty across channels. of Wipro’s consulting-led, AI-powered operating model, which combines advisory capabilities, Supply Chain Management AI-enabled solutions, and execution services Wipro supports procurement and supply chain operations to provide end-to-end accountability across through supplier optimization, analytics, and operational enterprise functions. execution. These services focus on improving efficiency, visibility, and cost management across end-to-end Business Process Services leverage Wipro procurement and supply chain processes. Intelligence™ to embed AI systematically across business processes. This approach supports intelligent automation, predictive insights, and Talent Processes continuous improvement aligned to defined Wipro’s human resources services support talent business outcomes. acquisition, workforce management, employee development, and people engagement. These offerings enable clients to manage HR operations with agility, compliance, and operational consistency across the employee lifecycle. Finance and Accounting Wipro supports finance and accounting operations through services covering financial planning, reporting, risk management, and compliance. These offerings leverage automation and data-driven insights to improve financial transparency, operational efficiency, and decision-making. - 26 2025 REPORT ANNUAL INTEGRATED WIPRO   15 Trust and Safety Wipro’s trust and safety services support organizations in maintaining platform integrity and managing digital risk. Services include content moderation, compliance review, policy advisory, fraud and payment risk management, and investigations. Industry Offerings Wipro provides industry-specific process services to sectors including banking and financial services, insurance, healthcare, manufacturing, consumer and media, energy, communications, and technology. These offerings are tailored to address industry-specific operational requirements and regulatory considerations. SPOTLIGHT European Telecom Equipment Company Leading U.S. Telecom Provider €231 mn $127 mn Working capital optimized through Early revenue realization and 38% cycle time AI-led automation transformation reduction through process re-engineering and automation U.S. Healthcare Payer Consumer Health Company $40 mn 1.5x Annual cost reduction Faster processing and 70% touchless operations 70% through agentic AI-led invoice automation Efficiency improvement through AI-driven provider data digitization


LOGO

16 CORPORATE OVERVIEW 17 AI-Native Business & How the unit drives scale & impact: 1. Strengthens Wipro’s ability to deliver measurable Platforms Unit value and drive stronger business outcomes for our clients. We have launched a dedicated AI-Native Business 2. It enables us to build and scale AI led platforms & Platforms Unit in April 2026. This unit positions us faster than ever before, focusing on new growth Expert-led. to build and scale AI-led platforms and incubate new opportunities and unlocking new avenues AI-led businesses, enabling Wipro to deliver tangible for innovation. value to clients and drive stronger business outcomes. 3. By deepening our expertise across data, workflows, With this, Wipro is among the first to establish a decision engines, and infrastructure, we are poised AI-infused. dedicated AI-Native unit. to lead in the era of intelligent transformation. 1. The Unit will build and scale AI-Native Businesses 4. Supported by forward deployed engineering teams, & Platforms: the unit helps clients realize value rapidly turning Impact-focused. a. Modernize & scale existing platforms. intelligence into impact at scale. b. Create new AI-Native businesses in The AI-Native Business & Platforms Unit will Build Capco, a Wipro company, is a global management and technology high-potential, high-confidence areas. to create impact, Invest to lead, Partner to expand, consultancy specializing in the financial services and energy industries. 2. Scale enterprise-grade agentic AI and strengthen and Leverage to multiply. For nearly three decades, clients have trusted Capco to lead complex, outcome-based value delivery for clients. 1. Build 3. Own product management, engineering, and a. Build and modernize Wipro’s organic platform end-to-end transformation in some of the world’s most regulated and forward deployed engineering (FDE) capabilities portfolio and services offerings. scrutinized sectors. for AI-Native platforms. Capco was built on a clear vision: to do something different by Our Expertise b. Develop Small Language Models (SLMs) for combining deep industry expertise, strong consulting fundamentals, 4. Enable greater non-linearity in revenue growth, vertical industries and horizontal platforms across areas such as Security and Cloud. real innovation and a relentless focus on client impact. positioning Wipro for differentiated and sustained growth. Banking and Payments 2. Invest Expert-led. The unit will prioritize near-term opportunities where a. Inorganic plays, such as bolt-ons We lead with industry depth and sharp judgment, Wipro can leverage existing assets and deep domain to organic platforms, to enable a helping clients navigate the moments that matter most expertise to enable faster monetization and establish services-as-software model. with confidence. Capital Markets market credibility: b. Invest early through the Wipro AI-infused. 1. Industry platform areas: Banking & Capital Ventures ecosystem. We embed process, technology, data and AI into how Markets (Mortgage), Healthcare (Medicare, 3. Partner we shape, build and deliver value. AI is not an add-on–it Medicaid), Aviation (Cargo management, a. Startups (Wipro Ventures), Academia, is a core part of how we work and how we help clients flight & crew operations), and Telecom Energy Research Organizations move faster. (network ops & assurance). b. Customer R&D labs and units, Co-innovation Impact-focused. - 26 2. An Agentic Operating System powered by WINGS with Technology partners We relentlessly focus on measurable outcomes and 2025 (Run & Operate) and WEGA (Build / Agentic SDLC), lasting value, delivering impact for our clients when the Agentic Marketplaces, Agentic Commerce. 4. Leverage Wipro Group’s ecosystem advantage Insurance REPORT 3. Functional & process platforms e.g., Horizontal stakes are highest. platforms across shared services (Employee experience), Responsible AI & Legal Tech. Consulting is being redefined. Wealth and Asset ANNUAL We don’t just adapt to change–we shape it. Management INTEGRATED This is The Expert Advantage. Together, the four GBLs and two business units enable Wipro to operate as an integrated and trusted WIPRO enterprise transformation partner to our global clients, empowering them to lead in their industries.


LOGO

18 CORPORATE OVERVIEW 19 AI-powered AI platforms AI platforms provide the underlying foundation. They are designed to embed intelligence, reshape how work is executed, and reimagine operating models to be both human-centric and AI-powered. These include industry platforms built around specific sectors including mortgage, aviation, and We embed intelligence into the core healthcare–bringing domain depth to address industry-specific challenges. of enterprise transformation. Healthcare Aviation Mortgage (ACA, Medicare, (TOPS, (NetOxygen) Medicaid) CROAMIS) Our consulting-led approach begins with understanding The gap is not in access to AI. It is in applying it with the client’s challenges, constraints, choices, and clarity, integrating it into existing systems and processes, Alongside these are our delivery platforms: priorities. From there, transformation is shaped with and scaling it with the right controls. Many initiatives intent and clarity on where value will be created. remain fragmented. Value is often uneven. WINGS WEGA AI becomes most effective in that setting. Not as Governance, data readiness, and workforce alignment AI-powered delivery platform AI-powered delivery platform to a starting point, but as a force that strengthens continue to lag behind ambition. This is where our for operations. build solutions at scale. enterprise transformation. approach is deliberate. We ground AI in the realities of business execution. We focus on where it delivers Across industries, AI has increasingly become central measurable outcomes. to how enterprises operate. It is changing how decisions are taken, how processes are run, and how At Wipro, that discipline is captured in a simple principle: value is delivered. Yet the outcomes remain uneven. proof over promise. Most organizations have moved beyond pilots. Far fewer have embedded AI in a way that consistently AI solutions improves performance. AI solutions, powered by Wipro Intelligence™, address highly specific industry challenges and are tailored to each client’s unique requirements. Industry solutions address sector-specific priorities across financial services, healthcare, energy, manufacturing, and communications. AI platforms AI solutions Banking, Financial Services & Insurance: WealthAI Health: PayerAI, Life Sciences Services Wipro Intelligence™ is our unified suite of AI-powered platforms, solutions, and transformative Energy, Manufacturing & Resources: AutoCortex, Industrial AssetsAI, Energy UpstreamAI 26—offerings, designed to help enterprises scale with confidence and lead in an AI-first world. Tech & Communications: Telco Autonomous Network Operations, Telco Enterprise AI, Turnkey ASIC 2025 Cross-industry solutions support enterprise-wide needs such as modernization, security, and operating Wipro’s journey in AI reflects the way the market scaling it with clarity–aligning it to business priorities, model transformation. REPORT itself has evolved. We began with Wipro HOLMES™ integrating it into core systems and processes, and Modernize AI in 2015, at a time when enterprises were exploring governing it with discipline. Secure AI: Cybershield, CyberTransform ANNUAL how AI, machine learning, and automation could Launched in October 2025, Wipro Intelligence™ is Fusion GCC improve efficiency and decision-making. As adoption Functional solutions apply AI within core business functions, including finance, human resources, legal, built for the AI era. and compliance. expanded, we introduced Wipro ai360 in 2023, bringing together our capabilities and partner It brings together our AI capabilities into a Legal & Compliance AI: Review & Risk INTEGRATED ecosystem to embed AI more broadly across the unified suite focused on delivering measurable Human Resources AI: WiNow enterprise. Today, the market has moved further. business outcomes. Finance AI: ForecastAI WIPRO The focus is no longer on embedding AI but on


LOGO

20 CORPORATE OVERVIEW 21 As of May 2026, our labs cover 10 locations across key global markets including the United States, the United Kingdom, Australia, the The Wipro Innovation Network, part of the Wipro Intelligence™ suite, is our global United Arab Emirates ecosystem of labs, partners, startups, academia, and deep tech talent to identify, (UAE), South Korea, incubate and co create. and India. With a strategic focus on five frontier technology themes, i.e. Fully autonomous agentic AI, Distributed ledger technology, Embodied AI, Quantum computing and Space tech, this collaborative network accelerates client-centric innovation to unlock business value and drive sustainable growth. AI Ecosystem Innovation Labs Immersive, collaborative spaces designed to enable client-centric co-innovation to solve real-world business challenges using frontier technologies. These state-of-the-art labs Deep-tier integrations Established an NVIDIA- Global collaborative Launched an Applied provide hands-on, experience-led engagement through structured, immersive workshops. with Google Cloud via powered AI-DC (Artificial agreement with Harness AI Center of Excellence Clients engage with our experts to explore cutting-edge industry solutions and identify and co-create high-impact, high-priority use cases. Gemini Enterprise models Intelligence Data Center) for an AI-Native Software (CoE) for Claude models, and targeted Gemini solution for high-density, Delivery Platform. powered by Anthropic, To Know more: wipro.com/innovation Experience Zones. enterprise-scale to accelerate enterprise AI processing. AI impact. Partner Labs A state-of-the-art joint innovation and customer experience ecosystem co-invested by Wipro and its strategic partners across hyperscalers, AI-native partners, infrastructure, enterprise Wipro has been Global collaborative Expanded strategic alliance Strengthened collaboration applications, data, and engineering. The initiative marks a pivotal shift in Wipro’s ecosystems recognized as an agreement with Factory. with ServiceNow to embed with OpenAI to accelerate and partnerships strategy—moving decisively toward consulting-led, AI-powered collaboration organization that is ai for agent-native autonomous agentic AI AI-led transformation that brings together partners’ technology strengths with Wipro’s market reach and domain expertise to build and scale world-class industry and cross-industry solutions. redesigning work around development, with an aim workflows across key and deliver scalable human-agent teams to move engineering teams business functions, with AI solutions for—26 through large-scale from experimental setups integration frameworks financial services and Partner Labs Ecosystem 2025 deployment and to production-scale AI with and operational footprints energy sectors. leverage of Microsoft Autonomous Software spanning IT services, REPORT Copilot Studio. Engineering Agents. HR, procurement, and ANNUAL cybersecurity operations. ..and more. INTEGRATED Our AI ecosystem continues to grow including partnership with: WIPRO For the full list of partners and for more information: wipro.com/partner-ecosystem


LOGO

22 CORPORATE OVERVIEW 23 The corporate investment arm of Wipro that invests in early-to-mid-stage enterprise software startups Topcoder is an open innovation and talent platform outcome-based crowdsourcing model enable clients that are aligned to Wipro’s strategic priorities and at the forefront of technological innovation, allowing with a global community of over two million developers to access specialized global talent across AI, data us to deliver differentiated value to clients. These investments are focused on GenAI/AI, Cybersecurity and technologists worldwide, accelerating innovation science, software development, UX design, and quality and Data Security, App Modernization, Data Analytics, DevOps and Test Automation, and Vertical through crowdsourced exponential engineers to assurance. Through Topcoder, we leverage the wisdom SaaS. Wipro Ventures bolsters the Wipro Innovation Network with a portfolio of dynamic startups that build digital solutions—improving time to market, of the crowd to rapidly solve complex problems, help deliver value to our clients through co-innovation. ensuring quality, and driving scale and efficiency. validate ideas, and deliver differentiated solutions. From ideation through the entire development lifecycle, Topcoder’s deep technical expertise and $500 mn 40+ 25+ Funds to invest through Total investments Companies in active portfolio Wipro Ventures Deep Tech Talent 750+ 280+ 16 Our deep tech talent applies frontier technologies to talent driving deep tech innovation and enterprise solve complex challenges and unlock next-generation transformation. The Wipro Innovation Network Startup solutions Global clients in 10 years Successful portfolio exits opportunities for clients and partners. This includes continues to invest in building ‘Exponential Engineers’ Distinguished Members of Technical Staff (DMTS)– to leverage AI for accelerating software development Wipro’s flagship community of top technology cycles and enabling faster, scalable innovation. Investments in AI Investments in Cybersecurity Academia and Research We deepen our innovation ecosystem through Science (IISc) in Bengaluru, Massachusetts Institute of research collaborations with leading global universities Technology (MIT) in Boston, and the Indian Institute 26—and research institutions to accelerate frontier of Technology (IIT) in Delhi, advancing joint research 2025 technology innovation. Wipro currently collaborates and co-creating high-impact solutions for enterprise-REPORT For the full list and to know more visit: wipro.com/ventures with institutions such as the Indian Institute of ready outcomes. ANNUAL INTEGRATED IISc IIT Delhi MIT WIPRO


LOGO

24 CORPORATE OVERVIEW 25 Key Industries Industry-focused • Banking and Financial Services 270+ • Securities and Capital Markets Customers • Insurance Including 9 of the Top 10 We bring domain depth to the Banking, Financial Services and Insurance (BFSI) problems that matter most. Key Industries • Retail and Consumer Products & 250+ Goods (CPG) Customers • Professional Services Technology on its own does not solve for regulatory work, moving our role upstream from execution alone • Travel, Transportation and Hospitality Including complexity, margin pressure, operating risk, supply chain to shaping larger transformation agendas with clients • Media and Entertainment 9 of the Top 10 volatility, or changing customer expectations. Those and partners. Consumer issues play out differently in every sector. A bank, a Our consulting-led approach ensures that transformation healthcare enterprise, and a manufacturer may all invest begins with the right business problem, framed in the in modernization, but the business questions are not the context of the industry. Key Industries same. The answer cannot be the same either. That is why Wipro is industry-focused by design. Our AI-powered capabilities ensure solutions can be • Healthcare (Payers, Providers, 190+ Health Tech) Customers applied at scale, with speed and discipline. Together, We concentrate on five sectors where we have depth, • Lifesciences (Pharma, BioTech) they allow us to deliver outcomes that are grounded in • Medical Devices relevance, and the ability to lead at scale: Banking, how each industry actually operates. Including Financial Services and Insurance; Consumer; Health; 9 of the Top 10 Energy, Manufacturing and Resources; and Technology This is how we build relevance over time, not by applying Health and Communications. a common model across industries, but by understanding where each industry is changing, what that change This focused approach empowers us to build stronger demands, and how to execute with clarity. It reflects positions across clientele, expand at a greater scale, and Key Industries how we choose to grow, where we choose to invest, direct investment to areas where capability and demand • Energy and Utilities 300+ and how we create differentiated value for clients across are most aligned. It also strengthens how we originate • Manufacturing (Automotive, Customers industries that shape the world. Industrial, Process) • Natural Resources • Engineering, Construction Including and Operations 8 of the Top 10 26 Energy, Manufacturing and - 2025 Presence across Sectors Resources (EMR) Key Industries REPORT Banking, Financial Services and Insurance (BFSI) Consumer Health • Semiconductor and Computing; 150+ Storage and Peripherals Customers ANNUAL • Software Products and Consumer Electronics • Network and Edge Providers Including Energy, Manufacturing Technology and • Communication Service Providers 9 of the Top 10 and Resources (EMR) Communications INTEGRATED Technology and Communications WIPRO Note: Top 10 is as per Forbes G2000 list for the respective sectors based on core markets we operate in.


LOGO

26 CORPORATE OVERVIEW 27 Client-centric Client Stories We align every engagement to Wipro Enters Into a Wipro Partners with Faber Deal with TruStage® to Group to Drive measurable business outcomes. Transform its Retirement AI-led Transformation and Services Business Build Unified Digital Core Wipro entered a multi-year contract for business and Faber Group, a leading Europe-based family-technology modernization for TruStage’s retirement owned business in circular load-carrier solutions services business. As part of this engagement, and services, selected Wipro as its strategic Wipro’s operating model is built around the client. Wipro will transform TruStage’s core retirement partner for a multi-year IT outsourcing and digital Our operating model runs through four Strategic services operations and technology stack through transformation program aimed at reimagining its Market Units–Americas 1, Americas 2, Europe, and an integrated approach that delivers seamless operations and technology landscape. Drawing on APMEA–each responsible for client relationships, sector digital experiences, business agility, and increased Wipro’s consulting-led expertise in operating model relevance, and growth within their markets. efficiencies. Led by Wipro’s Consulting team, Wipro design, process standardization, and technology will build a long-term strategic innovation roadmap modernization, the engagement is enabling a This is the primary axis of how we operate. to enable a future-forward retirement services structured transition to a unified, future-ready digital business. Leveraging Wipro Intelligence™ and deep core. Through the integration of operations, data Consulting domain expertise, Wipro will deliver an integrated modernization, and end-to-end IT outsourcing, the Technology Services transformation program and establish a global program will enhance business agility, improve Engineering operating model to manage TruStage’s broader decision intelligence, and drive sustainable and vendor ecosystem. efficient operations. Business Process Services “Retirement planning is crucial to the middle market “Our partnership with Wipro is an important step consumers we serve. Many individuals and families in Faber’s journey to become a more sustainable, The AI-Native Business & Platforms Unit, and in the middle market face unique challenges when agile, and digitally enabled organization. Wipro’s 26 Capco are all organized to serve the clients it comes to preparing for their financial futures, and consulting-led expertise in data and AI and—2025 through this structure. it’s our mission to ensure everyone has access to integrated IT services is helping us modernize the tools and services they need to achieve long- operations, build a unified digital core, and The depth of our client relationships reflects how term financial security. Our work with Wipro marks strengthen efficiency, decision-making, and REPORT We start with the client’s business reality. We stay a significant step forward in that mission, as we long-term growth.” this works in practice. Across our priority sectors, we through delivery. We measure ourselves by what modernize our retirement business, streamline our ANNUAL serve many of the world’s largest enterprises with changes in the client’s business. operations, and enhance the customer experience Ingrid Faber engagements that have expanded over years, across for those who have traditionally been underserved CEO, Faber Group functions, geographies, and business lines. That Read our client success stories on page 27 by the industry.” INTEGRATED expansion is earned through disciplined execution. Chris Copeland Chief Business Officer, TruStage WIPRO


LOGO

28 CORPORATE OVERVIEW 29 Wipro to Drive AI-led Wipro Powers Wipro Collaborates with ABB Signs Multi-year Transformation for Odido’s AI-enabled IT PGP Glass to Strengthen Deal with Wipro for FullBeauty Brands Modernization to Enhance Manufacturing Operations Agentic AI-powered Customer Experience and Through Digital Workplace Services Operational Efficiency Transformation ABB Group, a global leader in electrification and Wipro has signed a multi-year strategic Wipro was selected by Odido Netherlands to lead a Wipro was chosen by PGP Glass to transform its IT automation, has signed a multi-year renewal to engagement with FullBeauty Brands (FBB), multi-year, AI-enabled modernization of its digital and landscape and support uninterrupted production modernize its digital workplace and accelerate its shift a U.S.-based specialty fashion retailer, to enterprise IT landscape. The engagement focuses on across geographies. By implementing an integrated to an AI-led service model. Wipro will deliver Agentic support the modernization of key business simplifying and automating IT operations, improving approach spanning infrastructure, cloud, and AI-powered workplace services across service desk, and IT operations and help drive operational service reliability, and elevating customer experience application services, Wipro enabled near 100% employee services, and supply chain operations. The efficiencies. As a strategic technology and across Odido’s consumer and enterprise businesses. production uptime while optimizing costs and program will introduce an AI-first, self-resolving service operations partner, Wipro will leverage its Powered by Wipro Intelligence™ platforms, including improving operational efficiency. The engagement desk featuring smart causal analysis, multilingual voice capabilities, including Wipro Intelligence™, its WEGA and WINGS, and supported by a design-led helped stabilize critical systems, enhance governance and chat translation, and forecasting for proactive suite of AI-enabled platforms and solutions, delivery model, the transformation will enable Odido through real-time monitoring, and establish a device management. These capabilities will streamline where appropriate, to support FBB’s to accelerate time to market, improve productivity, scalable, future-ready IT backbone. This collaboration and elevate user experience. They will also drive applications, infrastructure, cybersecurity, and continuously reinvest efficiency gains into new strengthened operational resilience and positioned measurable productivity improvements and support and selected business processes. The digital initiatives, building a scalable, future-ready PGP Glass for sustained scalable growth. the client’s sustainability goals through efficient and engagement is focused on enhancing IT ecosystem. responsible device management. operational effectiveness, improving service delivery, and supporting a seamless “ABB continues to simplify and modernize its IT experience for customers and employees landscape to support its business and sustainability across channels. objectives. Wipro’s deep domain expertise, global delivery footprint, and focus on innovation make “The engagement with Wipro is a key step “At Odido, our goal is to make technology “Wipro has been instrumental in strengthening our them a key partner in enabling a consistent and in our transformation journey and will lay more human. Everything we do is driven by a global IT operations, enabling stability, efficiency, high-quality digital workplace experience for our the foundation for a more agile, AI-infused human-centric approach. This applies not only to our and cost control through structured delivery and employees worldwide.” enterprise. Wipro’s AI-led approach and network services and product innovations, but also technical expertise. We value their consistent, clear 26 approach to IT operations and look forward to Alec Jounnau—deep domain expertise will help us drive to our processes, operations, and IT infrastructure. 2025 operational agility, accelerate innovation, Our collaboration with Wipro supports this building on this momentum.” CIO, ABB and unlock new growth opportunities.” ambition and enables us to take the customer REPORT experience to the next level.” Ravindra Pratapsingh Rawat “As ABB operates globally with a highly diverse Nicole Dombrowski Global Head – IT Infra & Cybersecurity, PGP Glass workforce, the reliability, security, and user SVP & Chief Human Resources Officer, Robert Purdy experience of our digital workplace are critical. ANNUAL FullBeauty Brands Chief IT Officer, Odido Netherlands Wipro’s ability to deliver standardized services while remaining responsive to local needs will help us drive higher productivity, improve employee INTEGRATED satisfaction, and support our long-term digital and sustainability ambitions.” WIPRO Ana Jauregui Head of Consumer Experience, ABB


LOGO

30 CORPORATE OVERVIEW 31 Growth Decline $10.5 bn L11 344 Purpose-driven CC: Constant Currency IT Services Revenue Dividend Per Share Registered trademarks * Women employee % includes (-)1.6% YoY CC employees of Harman DTS acquisition closed, effective 1 December, 2025 87.8% 2,537 17.2% Payout as a % of Persons with Disabilities IT Services Net Income for 3-year (based on voluntary We ensure that progress in business and society self-declaration) Operating Margin block ending FY26 is responsible, inclusive, and sustainable. 0.2% YoY 242,156 600+ Wipro Cares bn Total employees volunteering activities L132.0 Net income Wipro was founded on a belief that business and operations, the standards around its use become 0.5% YoY 37.6% 42,000+ society advance together. For over eighty years, inseparable from the value it creates. Governance, ethics, Women employees* Employees made this belief has guided how we operate, shaping integrity, transparency, and accountability are built into how monetary contributions our role as a global consulting-led and AI-powered we deliver through Wipro Intelligence™. Progress in business 112.6% technology partner. must be progress that can be trusted. 175 Operating Cash Flow by 180+ It applies equally to our people. Our culture, rooted in the Net Income Nationalities in the Spirit of Wipro and the Five Habits, holds integrity and ethics workforce Partners engaged in to the highest standard. Continuous investment in skills, community initiatives 66% inclusion, and leadership development ensures that as the $7.8 bn enterprise grows, its people grow with it. of our economic interest is pledged towards AAA Large deal TCV 186,653 tCO e philanthropy through the Azim Premji Foundation. And it extends to how we manage our operations. 94% of 2 45.4% YoY CC Rating by ICRA our energy comes from renewable sources. We treat all our Total GHG emissions wastewater, and treated and reused wastewater forms 34% In addition, Wipro Foundation, Wipro’s Corporate of our total water consumption across owned facilities. 98% Social Responsibility arm, works with partners across of waste is recycled. Progress in business must be progress $16.4 bn L4,499 mn 80.64 India through long-term engagements in education, the environment can sustain. R&D expenses Energy Performance Total bookings TCV ecology, healthcare, disaster response, community Index (kWh units per development, and urban systems. 14.0% YoY CC 26 Review sqm per annum) - L2,274 mn 2025 Through Wipro Cares, the employee engagement platform of Wipro Foundation, and initiatives CSR spend 92% such as the Spirit of Wipro Run, our employees L12.6 REPORT This is what purpose means at Wipro. Business in engage with communities across more than performance and societal responsibility reinforce Earnings Per Share Reduction in Scope 1 twenty countries, contributing time and effort while 0.3% YoY and Scope 2 emissions each other. How we build and govern technology, 1,233 ANNUAL strengthening a culture of responsible citizenship and (from FY17 baseline) social engagement. nurture people, work with communities, and Active customers manage our footprint are all expressions of the This commitment to responsibility and accountability same commitment. 187. L 64 0.78 INTEGRATED extends to how we build and deploy technology. Per Share Price 1,907 Tons CO e emitted As AI becomes more embedded in enterprise 2 WIPRO Year (-)28.5% YoY Patents granted to date per person


LOGO

32 CORPORATE OVERVIEW 33 Founder Chairman, Wipro ranked among Wipro mentioned as Wipro was positioned as a Mr. Azim H. Premji, the top 10 Global AI Consulting firms by AI Magazine in 2025 Horizon 3 – Market Leader in the HFS A Leader in the 2025 Gartner®* named to the 2025 TIME100 Horizons: Magic Quadrant™ for Philanthropy list, honoring the 1 world’s 100 most influential leaders • Agentic Services, 2026 report • Outsourced Digital Workplace Services shaping the future of giving • Energy and Utilities Service Providers, 2025 • Service Integration and • Life Sciences Service Providers, 2025 report Management Services2 • Next-gen IT Infrastructure Services, • Data Center Outsourcing Services3 2026 report • Finance and Accounting Business Process Outsourcing4 Ranked 1st in Sustainability among • Public Cloud IT Transformation Services5 Placed in the Next Leader India headquartered firms, in Category in the Indian Corporate TIME’s 2025 list of World’s Most Governance assessment by IiAS Wipro was positioned as a Wipro was positioned as a Sustainable Companies Leader in ISG Provider Lens™ Leader in Avasant’s • Supply Chain Services 2025, Global • Digital Talent Capability 2025 (all quadrants) RadarView™ • Healthcare Digital Services 2025, US • Banking Digital Services 2025 Won Gold award in Recognized as a Top (all quadrants) RadarView™ • Digital Sustainability 2025, Global • Telecom Digital Services 2025 The Stevie® Awards Global Employer (all quadrants) RadarView™ for Great Employers 2025 in the with Silver Status in the Stonewall • Oil & Gas Industry Services and Solutions Diversity & Inclusion category Global Workplace Equality Index 2025 2025, North America (all quadrants) Wipro was positioned as a Wipro was recognized as a Recognitions EcoVadis Silver Medal Wipro won ASQ (American Leader in Everest Group’s in Leader in IDC MarketScape • Software Product Engineering Services • Worldwide Managed SASE Services for sustainability performance Society for Quality) award PEAK Matrix® Assessment 2026, Global 2025 Vendor Assessment (top 15% globally) for Innovation Excellence • Everest Group’s Global Capability Center (Doc# US53011425, Oct 2025) Transformation Capabilities in India – • Worldwide Manufacturing Intelligence PEAK Matrix® Assessment 2025 Transformation Strategic Consulting 2025 Vendor Assessment and Recognitions (Doc# US52988325, Nov 2025) Recognized as “Top 10 Best DI-verse Disability Inclusion - 26 1 Gartner, “Magic Quadrant for Outsourced Digital Workplace Services”, Karl Rosander, et al, 10 November 2025. Companies for Women in India” Certification (AIF) 2025 2025 2 Gartner, “Magic Quadrant for Data Center Outsourcing Services”, Biswajit Maity, et al, 3 November 2025. by Avtar & Seramount in the Best Recognized at Rashtrapati Bhavan 3 Gartner, “Magic Quadrant for Service Integration and Management Services”, Andrea Lanzavecchia, et al, 29 October 2025. 4 Gartner, “Magic Quadrant for Finance and Accounting Business Process Outsourcing”, Jan Ambergen, et al, 14 April 2025. Companies for Women in India for leadership in workplace 5 Gartner, “Magic Quadrant for Public Cloud IT Transformation Services”, Tobi Bet, et al, 4 August 2025. REPORT (BCWI) study accessibility and inclusion *Gartner, “Magic Quadrant for Finance and Accounting Business Process Outsourcing”, Jan Ambergen, et al, 14 April 2025. *Gartner, “Magic Quadrant for Public Cloud IT Transformation Services”, Tobi Bet, et al, 4 August 2025. *Gartner, “Magic Quadrant for Service Integration and Management Services”, Andrea Lanzavecchia, et al, 29 October 2025. *Gartner, “Magic Quadrant for Data Center Outsourcing Services”, ANNUAL Biswajit Maity, et al, 3 November 2025. *Gartner, “Magic Quadrant for Outsourced Digital Workplace Services”, Karl Rosander, et al, 10 November 2025. GARTNER and MAGIC QUADRANT are trademarks of Gartner, Inc. and its affiliates. Gartner does not endorse any vendor, product, or service depicted in its research publications, and does not advise technology users to select only those vendors with the highest ratings or Corporate Equality Index (CEI) Recognized as a Gold Employee other designation. Gartner’s research publications consist of the opinions of Gartner’s research organization and should not be construed INTEGRATED as statements of fact. Gartner disclaims all warranties, expressed or implied, with respect to this research, including any warranties of Recognized as one of the “Best India Workplace Equality Index merchantability or fitness for a particular purpose. Places to Work for LGBTQ+ Equality” (IWEI) from 2021-2025 The Gartner content described herein (the “Gartner Content”) represents research opinion or viewpoints published, as part of a syndicated subscription service, by Gartner, Inc. (“Gartner”), and is not a representation of fact. Gartner Content speaks as of its original publication WIPRO Awards since 2020 Analyst date (and not as of the date of this press release, and the opinions expressed in the Gartner Content are subject to change without notice.


LOGO

34 CORPORATE OVERVIEW 35 Board Demographics* Board Age Profile Board Gender Diversity Board Nationality 4 2 6 8 1 7 22% 35-55 years 22% Female 56% Foreign Nationals 3 5 56% 56-70 years 78% Male 44% Indian 22% > 70 years Board Composition One Two Six Non-Executive, Executive Directors Independent Directors Non-Independent Director *The metrics are based on Board members till March 31, 2026. Governance Framework Wipro’s Corporate Governance philosophy is put into practice through four functional layers. Governance 1. Päivi Rekonen 2. Tulsi Naidu 3. Azim H. Premji 4. Srinivas Pallia Directors Independent Director Independent Director Founder Chairman Chief Executive Officer & Managing Director By By Board By Committees of By Management M M C M Shareholders of Directors Board of Directors Process - 26 2025 of 5 Independent . Laura Miller Director 6 Executive . Rishad A. Premji Independent 7. N. S. Kannan Director 8 Lead . Deepak Independent M. Satwalekar Director • Audit, Risk and • Risk Management Chairman Compliance Committee, • Spirit of Wipro which also acts as Risk M M C C M REPORT Management Committee • Code of Business Conduct • Nomination and Remuneration Committee, • Compliance ANNUAL which also acts as Framework C Chairman M Member CSR Committee • The Ombuds • Administrative, Process Administrative and Shareholders/Investors Grievance Ms. Laura Miller was appointed as an Independent Director Shareholders’/Investors’ Committee (Stakeholders Relationship Committee) with effect from April 1, 2026. INTEGRATED Grievance Committee Nomination and Remuneration Committee (Stakeholders’ Dr. Patrick J. Ennis and Mr. Patrick Dupuis ceased to (also acts as CSR Committee) be Independent Directors upon the completion of their Relationship Committee) WIPRO Board Audit, Risk and Compliance Committee tenure, effective March 31, 2026.


LOGO

36 LEADERSHIP INSIGHTS AND OUTLOOK 37 at scale — reinforcing the need for trusted partners and Investing in People a phased path to adoption. The economics of delivery are also evolving. Growth in Technology transitions are shaped by people. The ability to technology services has historically tracked workforce build talent at scale and adapt operating models remains a expansion. AI is shifting that model toward platform-driven key differentiator. Our more than 240,000 employees average around 80 hours of learning annually. We have trained scaling, intelligent automation, and systems that compress our workforce on foundational AI capabilities, and 76% of timelines–with new commercial models emerging. employees have completed advanced AI training through more We see this in client engagements. For a large US bank, we than 90 role-based pathways aligned to Wipro Intelligence™. deployed generative AI to modernize legacy applications, AI will augment many roles and reshape others. It will reducing migration effort and accelerating prototyping. also create new categories of work across engineering, At a global healthcare company, our AI agents processed governance, operations, and design. We are investing in large invoice volumes, achieved high levels of touchless AI architects, prompt engineers, AI safety specialists, and processing, and improved turnaround times through a gain forward-deployed engineers. share model. Through partnerships with 73 universities globally, we build an AI-ready pipeline. We have committed to imparting digital and AI skills to one million students by 2030. Since 2017, more than 360,000 individuals have participated in Dear Stakeholders, over the block of trailing three years. At the start of FY27, we established a dedicated these programs. In addition, in April, the Board approved AI Native Business and Platforms unit to This year, Wipro turns 80. a  150 billion share buyback–our largest accelerate enterprise-grade agentic AI solutions.” Acting with Responsibility Few companies remain relevant across ever–reflecting our commitment to multiple eras of technological change. returning substantial operating cash flows The unit pairs product management and platform As technology becomes embedded in business and society, Wipro’s journey–from a company founded to shareholders. engineering with forward-deployed teams that work trust becomes more important. We build responsible AI into in 1945 to a global technology business directly in client environments. We pursue this through our systems from the outset — ensuring that innovation is We continued to invest in AI capabilities, a build-invest-partner approach. matched by accountability, transparency, and governance. serving clients across industries and platforms, and talent to shape the next The same discipline shapes our approach to sustainability. continents–has been defined by one phase, while maintaining focus on margins Renewable energy now accounts for 94% of our operations, enduring ability: to evolve with the world and cash generation. How We Are Positioning around it. putting us on track to reach 100% by 2030. We reduced Our approach is consulting-led and AI-powered, shaped absolute freshwater consumption by 4.6%, despite higher I feel fortunate to be part of this journey A Broader Shift around each client’s context — bringing together domain Letter return-to-office levels, and recycled 98% of waste. Nearly and grateful for the trust and support you expertise, engineering, data, and AI, anchored in Wipro 31,000 employees contributed more than 35,000 hours of There is considerable debate about what have placed in us. Intelligence™. volunteering through our Be the Change platform. Since AI means for technology services. Much of it frames AI as a threat to traditional We start by helping clients run their technology FY21, our community initiatives have reached nearly six The Year in Review delivery models dependent on human environments differently — embedding AI into operations million people across 20+ countries. The industry remained cautious effort and linear scaling. We see the across infrastructure, applications, cybersecurity, and throughout the year. Clients prioritized shift differently. business processes, enabled through WINGS, our AI-first Looking Ahead 26 efficiency, consolidation, and cost operations platform. At the same time, we help clients build - AI is not simply redistributing enterprise differently, using our WEGA platform to accelerate both As Wipro enters its ninth decade, the world is changing 2025 optimization as conversations shifted technology spend; it is expanding it. rapidly once again. We have remained relevant by adapting toward AI and modernization. In this Enterprises are investing heavily in data, software and AI engineering. early while staying anchored in a consistent set of values. REPORT environment, we maintained discipline. cloud, cybersecurity, governance, and Beyond this, we partner with clients to reimagine how their The opportunities ahead are real, and the investments we Revenue declined 1.6% in constant modernization, while new categories of businesses operate — redesigning processes and building are making position us well. The people of Wipro remain our currency to $10.5 billion. IT Services demand are emerging, from AI advisory new AI-native models that unlock new sources of value. greatest source of confidence. ANNUAL operating margin improved 0.2% YoY and model engineering to AI safety and This allows us to support clients across the full lifecycle agentic systems. To our shareholders, clients, partners, and employees: thank to 17.2%. Adjusted for labor code — from modernizing technology foundations to deploying you for your continued trust and support. changes, net income increased 2.2% Enterprise environments, however, enterprise-scale AI systems and transforming operations INTEGRATED to $1.43 billion, and earnings per share remain complex and fragmented. Scaling at scale. rose 2.1% to  12.8 ($0.14). For FY26, AI will therefore be a journey, requiring As part of this shift, we are investing in industry and WIPRO we declared dividend of  11/share and reimagined processes, continuous cross-industry platforms, including NetOxygen and our Chairman’s with this, our payout ratio was 87.8% refinement, and change management Medicare and Medicaid platforms, while continuing to Rishad Premji scale solutions and new AI services. Chairman


LOGO

38 LEADERSHIP INSIGHTS AND OUTLOOK 39 technology for retail banking; driving internal automation by technology, and operations, reinforcing our role as a long-term deploying Gemini to 15,000 users and integrating it into systems partner across the enterprise value stream. like SAP, ServiceNow, and Salesforce. Investing in Talent at Scale Performance Reflects Transition Technology transitions are, fundamentally, talent transitions. Despite a tough macro environment, our investments focus on We continue to build an AI-ready workforce, with over 212,000 building for the future. employees enabled through structured learning and a growing base of advanced skills and certifications. Skilling is now Our IT services revenue was $10.5 billion, a 1.6% decline in embedded into delivery, driving productivity and better constant currency. Our total bookings grew 14% to $16.4 client outcomes. billion, and large-deal bookings grew 45.4% YoY to $7.8 billion, including four deals with TCV over $500 million. Overall, we Our approach is to build targeted, role-based capabilities secured 64 large deals, demonstrating strong client confidence. across the full spectrum of AI, from advisory to deep tech, In a competitive market, we also retained and expanded key so our people are ready for what comes next. strategic engagements, including major accounts through vendor consolidation. Culture at the Core We also expanded our operating margin to 17.2%, driven by Our values continue to anchor us through change. operational discipline, while we executed focused strategic bets. This year marked 20 years of the Spirit of Wipro Run, bringing We continued to invest in our future, strengthening the Wipro together employees, clients, and partners from around the Dear Stakeholders, At the core of this transformation is Innovation Network with 10 innovation labs globally, advancing world. Over 62,000 people across 60+ cities came together for Wipro Intelligence™, our unified suite of This year marked two defining milestones our AI and consulting capabilities, and building differentiated one of the largest employee-led charity initiatives. It embodies AI-powered platforms, solutions, and for Wipro: 80 years since our founding and talent at scale. a sense of community that has remained constant even as our 25 years since becoming the first Indian IT transformative offerings. Through WINGS and business evolves. services company listed on the NYSE. These WEGA, our AI-powered delivery platforms, Executing for today and building for tomorrow remains central to we are embedding AI across operations our approach. Sustaining relevance over eight decades requires continuous are not just markers of legacy but reminders and software development. This reflects reinvention. What remains unchanged is our commitment to of our ability to adapt and stay relevant a broader shift from automating processes Strategic Bets Shaping our Future acting responsibly and building with purpose. through successive waves of change. to redesigning them around intelligence. Through industry and cross-industry Our journey is built on long-standing Looking Ahead platforms and solutions, and new AI services, relationships, trust, and evolving alongside The role of IT services is expanding and evolving. Clients are we are addressing business and functional We are building capabilities aligned with where our clients. As AI adoption accelerates, we seeking partners who bring technology, industry expertise, and spend pools, enabling new growth streams. client demand is heading, not only where it are stepping forward with clear intent. ownership for outcomes. This creates a significant opportunity We are co-innovating with clients and has been. for us. Seminal Technology Shift academia through our Wipro Innovation Our focus and strategy remain on: AI is no longer a technology trend; it Network. Our investments in Autonomous AI, Establishing AI-native Growth Drivers is reshaping how enterprises operate, Embodied AI, Quantum Computing, Digital Our new AI-Native Business and Platforms unit marks a pivot • leading with our consulting-led, AI-powered approach compete, and grow. The pace of change Ledger Technologies, and Quantum-Safe towards a platform-plus-services operating model. Our goal is to • strengthening client relationships is accelerating, and expectations have Cybersecurity are foundational for the next create differentiated industry offerings with AI-based platforms • converting opportunities into measurable business impact progressed from experimentation to wave of transformation. These investments and the breadth of our service capabilities. This allows us to • investing in differentiated capabilities that help us lead in an measurable results. The focus is on scaling are being translated into scalable, industry- create scalable, repeatable solutions and participate in new AI-first world 26—aligned solutions with strong governance, value pools. It will also help us pivot from people-centric to Letter what works and delivering sustained impact. security, and ethical safeguards. As I complete two years as CEO, we have sharpened our 2025 AI-centric monetization models. strategy, strengthened our capabilities, and stayed anchored in The differentiator is not access to technology, but the ability to deploy it with discipline and We continue to leverage advanced LLMs the values that define us. The early results are encouraging, and REPORT with partners who can navigate complexities. from frontier labs such as Anthropic, Scaling Engineering Capabilities our focus is on disciplined execution to scale our impact. Our focus is aligned to this shift: helping OpenAI, and Google to deliver flexible, The acquisition of HARMAN’s Digital Transformation Solutions On behalf of the leadership team, I thank our clients, partners, responsible, and enterprise-ready solutions. business strengthens our engineering portfolio across device clients turn AI ambition into real, durable We are deeply integrating these into client shareholders, and employees for their continued trust ANNUAL engineering, AI, and Software-Defined technologies. It enables and support. outcomes. offerings and internal workflows. Key end-to-end, AI-powered engineering, supports larger, complex initiatives include launching an Applied AI transformation programs, and opens new growth markets. Evolving for an AI-first World Center of Excellence for Claude models, INTEGRATED powered by Anthropic, and training Deep, Transformation-led Engagements We are leading our customers’ 10,000 front-line AI engineers; creating transformation journey with our Partnerships such as Olam Group reflect the growing scale enterprise-grade AI for highly regulated WIPRO CEO’s consulting-led, AI-powered approach. sectors, demonstrated by Capco’s and scope of client demand. These multi-year, end-to-end Srinivas Pallia award-winning solutions and digital twin transformation programs require the integration of strategy, Chief Executive Officer & Managing Director


LOGO

40 LEADERSHIP INSIGHTS AND OUTLOOK 41 enterprise AI and data modernization, scaling AI adoption, While the outlook favors vendors that can combine cost optimization, vendor consolidation, cyber resilience, cost-efficient modernization with scaled AI delivery process re-engineering, customer experience, innovation in with measurable outcomes, near-term caution may products, services and talent strategies for an AI-first world. persist due to an uncertain geopolitical environment impacting discretionary spending. This may be further According to the NASSCOM Report, revenue for Indian amplified by pricing pressure arising from competitive IT services sector is expected to grow 4.1% YoY in fiscal intensity and AI-driven productivity expectations, along year 2026. Growth is being driven by enterprise-wide AI with heightened execution and accountability risks and adoption, data center investments and the expansion of capability bottlenecks in skilled AI talent. GCCs. Enterprises are embedding AI across operations, increasing datacenter capacity demand, and pivoting to AI industrialization with domain-centric platforms. Future IT Products growth will hinge on AI readiness, deep domain expertise, According to the NASSCOM Report, the revenue for the and access to niche skills rather than volume-based hiring. Indian IT hardware segment is expected to reach $21 billion in fiscal year 2026, with the market estimated to grow by The NASSCOM Report estimates Engineering and R&D ~11% compared to fiscal year 2025, driven by localized (“ER&D”) services to grow by 7.7% YoY in FY26. This growth innovation, government-led design as well as manufacturing is driven by modernization of the ER&D stack through initiatives, alongside expanding digital infrastructure. platform-driven, software-enabled models, along with Further momentum from electrification, clean tech programs, Industry Overview increased investments in semiconductors and advanced coupled with a deep tech ecosystem creating new technologies. ER&D services expanded across the full IT Services engineering-led opportunities. phygital product lifecycle with co-creation of physical IP According to the Strategic Review 2026 published by the via digital twins, internet of things (‘IoT’) and generative AI National Association of Software and Service Companies (‘GenAI’) to drive design-to-manufacturing transformation. Business Overview (‘NASSCOM’ and such publication, the ‘NASSCOM Report’), Building on this, the focus is likely to shift from scale toward Celebrating more than 80 years of innovation, Wipro is a global IT services spending grew year-over-year by 4.6% deeper engineering expertise and IP ownership, with purpose-driven global technology services and consulting Discussion in calendar year 2025 despite macroeconomic uncertainty growth powered by domain-specific centers of excellence, firm with over 240,000 experts across 65 countries and six and muted enterprise budgets. Growth was driven by the pod-based delivery, and reusable accelerators aimed at continents, helping customers, colleagues, and communities industrialization of AI, continued digital and cloud transformation, reducing time-to-market. thrive in an ever-changing world. and sustained demand for cybersecurity and data services, Looking ahead, global IT services spending is expected to with AI reshaping operating models and talent requirements accelerate to 4.2% YoY in calendar year 2026, according rather than driving broad displacement. Sustainability initiatives to the NASSCOM Report. Rising AI investments focused remained largely compliance-driven. on scalable deployments and easing tariff and trade Heightened regulatory focus across economies has reshaped pressures are likely to be the key contributors to this our service models and data practices, positioning data and growth. As enterprises move beyond AI pilots toward technology governance and controls as critical to market phased GenAI and agentic scaling anchored in measurable access and differentiation. Global Capability Centers expanded outcomes, growth will remain sector-specific, driven by—26 depth of industry expertise, advanced AI capabilities and alongside service providers, while the convergence of IT 2025 and business process management enabled more intelligent the ability to attract AI-native talent. Furthermore, industry and value-driven operations. Services increasingly moved strategies are likely to consolidate around core strengths REPORT toward more intellectual property (‘IP’) led, productized while differentiating through platform-led offerings, Analysis and outcome-linked models. services-to-solutions models, AI-led delivery models with agentic capabilities, outcome-based pricing, micro ANNUAL Global IT service providers are equipped to support enterprises across industries with a wide range of AI-powered technology verticalization, and selective M&A. Hiring will also shift from volume toward skills, with greater emphasis on AI fluency, and business process services across advisory, application domain expertise, and productivity-based workforce models. INTEGRATED development, customer-centric design, cybersecurity, cloud infrastructure, data and analytics, engineering, and research and development (‘R&D’). We expect the IT services industry WIPRO Managementand to continue supporting enterprises across key areas such as


LOGO

42 LEADERSHIP INSIGHTS AND OUTLOOK 43 We are recognized globally for our strong commitment Our IT Services segment provides a broad range of Sourcing, Shaping and Winning Large Deals with a Wipro Intelligence™ focuses on delivering proof over promise, to improve the communities we live and work in. AI-powered IT and IT-enabled services, including AI Consulting-led, AI-powered Approach empowering enterprises to run, build, and reimagine with The economic interest of two-thirds of Wipro shares advisory, industry and functional consulting, AI-native AI for sustained competitive advantage. Through close We are focused on accelerating our growth by securing large is earmarked for philanthropy through the Azim development, customer-centric design, modernization, collaboration with partners, ventures, and leading research deals by leveraging our strong relationships with advisors, Premji Foundation working towards developing a just, custom application development, infrastructure institutions, Wipro Intelligence™ is designed to enable clients partners, and other ecosystem stakeholders. We continue to equitable, humane, and sustainable society. We are services, cybersecurity, data and analytics, business to experiment, adapt, and scale rapidly, while embedding drive rigor and focus by investing in dedicated pursuit teams globally appreciated for our unwavering commitment to process services, research and development, and productivity gains, assuring outcomes, and establishing in our units, enabling them with differentiated solutions, sustainability. As a founding member of ‘Transform to hardware and software design. responsible AI guardrails. Our suite of platforms, solutions propositions, and commercial constructs. Net Zero’, Wipro aims to achieve the goal of zero-carbon and offerings include: Our IT Products segment offers a range of third-emissions worldwide by 2040. We are driving strategic programs with our partners to create party IT products including computing platforms and • Run AI, powered by WINGS, our AI-powered large transformational opportunities and accelerate demand Our vision is to be a trusted partner for our clients, storage, networking solutions, enterprise information delivery platform, designed to transform IT and in prioritized sectors. We continue to co-invest, co-innovate, guiding them through their transformation journey security, and software products such as databases business operations; and co-create with our partners to deliver leading-edge leveraging a consulting-led and AI-powered approach, and operating systems. These offerings allow us to solutions and business value across technologies like AI • Build AI, powered by WEGA, our agentic platform for all thereby empowering them to become leaders in offer comprehensive IT system integration services and GenAI, Machine Learning industry and context-specific build and transform needs; and their industries. as a complement to our IT services offerings. Our digital solutions, industry cloud, cloud-led transformation and focus continues to be on consulting-led and digital • Reimagine AI, comprised of: We bring together deep industry expertise, technology cloud-native architectures. Our AI and cloud transformative engagements, while taking a more selective approach capabilities, best-of-breed partners and start-ups, and innovation is being done collaboratively at our global to bidding for system integration engagements. hyperscaler ecosystems to solve the most complex innovation studios and centers. Our top strategic partners problems for our clients.—Our Industry Platforms that are targeted at specific include hyperscalers, industry-leading platforms, and AI-Our Business Strategy industry needs, such as NetOxygen (AI-powered native companies like Amazon Web Services, Microsoft, At Wipro, we believe AI is a transformative force that lending platform), aviation platforms CROAMIS Our strategy is defined in the context of our five Google, IBM, SAP, ServiceNow and NVIDIA. we believe augments human expertise, enabling new (integrated cargo operations) and TOPS (flight and strategic priorities. AI-first business models, improving productivity, and We are also bringing cutting-edge capabilities from the crew operations). enhancing operational efficiency. Our goal is to be an Building Large Accounts in Profitable ecosystem to our clients through our Wipro Ventures ‘AI-first’ and ‘AI-in-everything’ organization, transforming—Our AI solutions are targeted at solving a specific investments in early to mid-stage start-ups. We continue to both our own operations and those of our clients. Markets and Prioritized Sectors client business challenge across and within specific invest in Enterprise Software startups that are aligned with We drive growth in our core markets across the industries. These include AutoCortex, designed to Wipro’s strategic priorities. Our investments in AI enable Americas, Europe and APMEA. In each market, we have accelerate transformation towards software-defined clients to adopt agentic workflows, enhance cyber resilience, prioritized specific sectors such as ‘Banking, Financial and autonomous vehicles, WealthAI, enabling clients and advance modern software engineering practices. Services and Insurance’ (‘BFSI’), ‘Consumer’, ‘Health’, to reimagine the wealth value chain across the front, ‘Energy, Manufacturing and Resources’ (‘EMR’), and As of March 31, 2026, Wipro Ventures manages 26 active middle and back office, and Telco Autonomous ‘Technology and Communications’ to drive market investments. In addition to direct equity investments in Network Operations, enabling Level 4 or 5 network leadership with our consulting-led approach. Our emerging startups, it also invested in 12 enterprise-focused autonomy for telecommunication companies. choice of sectors and industries in a market is driven venture funds, including B Capital, Boldstart Ventures, by both market attractiveness and our competitive Glilot Capital Partners, GTM Fund, Nexus Venture Partners, positioning and strengths. Pi Ventures, Redglass Ventures, Sapphire Ventures, Our AI initiatives are supported by the Wipro Innovation 26—Sorenson Ventures, SYN Ventures, TLV Partners, and We remain committed to investing and scaling our Network—our global ecosystem of labs, partners, start-ups, 2025 Work-Bench Ventures. large accounts by driving greater value, increasing academia, and deep tech talent focused on identifying, wallet share and positioning ourselves as strategic Differentiating with Wipro Intelligence™ incubating, and co-creating high-impact, high-priority REPORT partners across client priority areas. In addition, we are use cases. focusing on untapped clients presenting new business We take a consulting-led, AI-powered approach to deliver holistic solutions for our clients through Wipro Intelligence™ With our consulting-led approach, we combine industry ANNUAL opportunities within our prioritized sectors to drive—our unified suite of platforms, solutions, and transformative domain knowledge with AI-first transformation principles account growth while strengthening relationships, offerings—empowering enterprises to scale with confidence to support strategic priorities of our clients. Wipro’s increasing profitability, and fostering long-term growth. and lead in an AI-first world. consulting arm integrates expertise from in-house domain INTEGRATED experts and strategic acquisitions, enhanced by our local delivery capabilities. WIPRO


LOGO

44 LEADERSHIP INSIGHTS AND OUTLOOK 45 Building Talent at Scale responsible AI capabilities. Together, these efforts Five Pillars of Client Centricity We are committed to nurturing a diverse and global strengthen our ability to improve productivity, accelerate We are deeply committed to solving business problems for our clients. The client-first mindset is core to our strategy that is talent pool specializing in industry domain, consulting, innovation, and deliver differentiated, AI-enabled driven by five key pillars: design, market development, and technology. Our outcomes for clients. senior leadership team across markets, global business We are actively building an AI-ready workforce covering lines, and functions reflects this diversity, with a over 240,000 employees by fostering an AI-first mindset balanced mix of lateral hires and internally promoted and equipping them with essential AI skillsets and Delivery innovation through infusion of AI, GenAI Driving delivery excellence through early risk high-performing leaders. toolsets. More than 180 AI learning pathways have and our delivery platforms; WINGS embeds AI detection (alerts), proactive mitigation, and strong Leadership development is strengthened through been created across proficiency levels for business and into operations across application management, governance to ensure client satisfaction. our Wipro Leadership Institute, which helps leaders technical teams. We aspire to excel in AI technologies infrastructure support, and business process in reinventing themselves, transforming their teams and drive AI-innovation, service delivery transformation operations. WEGA extends AI capabilities across the and efficiency. Across our delivery teams, we have Delivery operations promoting an employee-led and organizations by building knowledge, skills, and development lifecycle, from vibe coding to model over 60,000 associates leveraging AI developer tools, rotation culture, optimizing bench and mobility, and behaviors required to achieve bold ambitions. Through tuning and data pipelines. boosting our overall productivity. accelerating intake and deployment. accelerated learning journeys and tailored programs such as PRISM and GAP, we foster a unified Wipro In addition, we have dedicated mentoring programs to Delivery-led growth through delivery teams engaged mindset centered on client success. support succession planning and continue to practice in opportunities to cross-sell and up-sell within existing We continue to invest in building capabilities aligned function rotation for better business understanding. client engagements, including proactive proposals, to business solutions across consulting, strategy, We have also enabled an AI-driven career planning, change requests, etc. architecture, and domain and leading technologies learning and mentoring platform, iAspire, that provides such as AI, GenAI, data science, cybersecurity, and recommendations on learning journeys based on employees’ skills, experience, and career aspirations. Demand fulfilment by forecasting requirements for engineering. To grow our talent, we are upskilling and high-growth areas, ensuring talent availability through reskilling them in client-relevant areas through practices, We continue to drive a culture of performance, ambition tailored account and practice academies, resulting in account academies, and digital learning platforms. We and business growth, guided by the Spirit of Wipro, the efficient utilization and volume growth. are also working with our partner ecosystem to enable Five Habits, and the Wipro Leader Success Profile. Our skilling through certifications and hands-on learning on Five Habits reflect our values in action and help create a their platforms. more inclusive and cohesive work environment, building We are also scaling AI capabilities through an trust, camaraderie, and a growth mindset. Our strong Our Growth Will Be Supported by our enterprise-wide skilling framework designed to embed commitment to integrity and a culture of ethics enable Focus on AI and M&A AI literacy across roles while developing advanced us to fulfil our commitment and build trust with our expertise. Our AI Master’s program builds a focused clients and investors. Through ‘AI-powered Wipro’, we aim to build AI-first cadre of specialists with deep technical, domain, and leadership mindsets, enhance employee AI skillsets, and empower teams with advanced AI technologies and tools while being custodians of responsible AI usage. Through M&A, we aim to capture high-potential market—26 opportunities aligned with our priority areas. We believe our 2025 strategic acquisitions in the U.S., Europe, and APMEA have strengthened our presence, enhanced our capabilities, and REPORT improved our market positioning. ANNUAL INTEGRATED WIPRO


LOGO

46 LEADERSHIP INSIGHTS AND OUTLOOK 47 Financial Position Revenue: Our revenue increased by 4.17% for fiscal year 2026 compared to fiscal year 2025. (Figures in  million except otherwise stated) Particulars FY26 FY25 FY24 Our IT Services segment revenue increased by 3.71% for fiscal year 2026 compared to fiscal year 2025. This growth Share Capital 20,977 20,944 10,450 was driven primarily by the depreciation of the Indian Net Worth 887,877 830,447 751,223 Rupee against major foreign currencies, including the Euro, Gross Cash (A) 551,809 542,458 409,519 Pound Sterling, U.S. Dollar, Australian Dollar, and Canadian Total Debt (B) 167,874 161,817 141,466 Dollar, revenue from acquisitions completed during the year Net Cash (A-B) 383,935 380,641 268,053 ended March 31, 2026 and the ramp-up of new deal wins, Property, Plant and Equipment (C) 81,787 80,684 81,608 especially large contracts. The growth was impacted by Intangible Assets (D) 29,176 27,450 32,748 reduction in discretionary spending by our clients arising out Property, Plant and Equipment and Intangible 110,963 108,134 114,356 of macroeconomic challenges and geopolitical dynamics. Assets (C+D) During fiscal year 2026, the revenue from Americas 1, Goodwill 387,399 325,014 316,002 Europe and APMEA grew, while revenue from Americas Net Current Assets 423,122 491,522 398,204 2 declined. Capital Employed1 1,055,751 992,264 892,689 Shareholding Related Revenue of the IT Products segment increased by 157.8%. Number of Shareholders2 2,603,140 2,431,180 2,397,648 This growth was driven by revenue from acquisitions Market Price Per Share ( )3 187.6 262.3 240.1 completed during the year and higher revenue from a few select customers in India. 1 Capital Employed is computed as the addition of Net Worth and Total Debts. 2 Number of shareholders (as at March 31 of respective years) represents holders of equity shares and does not include holders of ADRs. Cost of Revenues: Cost of revenues increased by 6.21% 3 Market price of shares is based on the closing price in NSE as on March 31 of respective years and has been adjusted for the bonus issue in 2024. in absolute terms. This rise was primarily due to higher employee compensation, subcontracting and technical Financial Performance fees, software licenses, expenses for internal use, and the ( in million) cost of hardware and software. Employee compensation in our total employee compensation costs as a result of increased primarily on account of acquisitions completed lower average headcount and a reduction in per-employee Particulars FY26 FY25 YoY Change during the year ended March 31, 2026, salary increases, cost in fiscal year 2026 as compared to fiscal year 2025 and Revenue 928,093 890,916 4.17% including promotions, depreciation of the Indian Rupee were partially offset by the impact of salary increases and Cost of Revenue -656,192 -617,802 6.21% against major foreign currencies, including the Euro, Pound promotions, and a one-time employee restructuring expense Gross Profit 271,901 273,114 -0.44% Sterling, U.S. Dollar, Australian Dollar, and Canadian Dollar of  1,083 million in fiscal year 2026. Selling and Marketing Expenses -59,216 -64,378 -8.02% and employee restructuring costs incurred in fiscal year General and Administrative Expenses: Our general and General and Administrative Expenses -61,434 -57,465 6.91% 2026. Sub-contracting and technical fees increased primarily administrative expenses as a percentage of total revenue on account of costs incurred to fill vacant positions. Higher Operating Income 151,251 151,271 -0.01% increased from 6.45% for the year ended March 31, 2025, software expenses for internal use are primarily due to new Profit Attributable to Equity Holders 131,974 131,354 0.47% to 6.62% for the year ended March 31, 2026. In absolute technology investments made during the year. Increased Selling & Marketing (% of Revenue) 6.38% 7.23% -85bps terms, general and administrative expenses increased by costs of hardware and software are due to higher product 26 G&A (% of Revenue) 6.62% 6.45% 17bps 6.91%. This was primarily on account of the impact of the—sales. This increase in cost of revenue was partially offset by Gross Margin 29.30% 30.66% -136bps implementation of a new labor code in India ( 2,599 million 2025 a decrease in the depreciation charge for our property, plant Operating Margin 16.30% 16.98% -68bps included in employee compensation), an increase in lifetime and equipment and right-of-use assets. REPORT EPS Basic 12.60 12.56 0.32% expected credit loss provisions in fiscal year 2026, and EPS Diluted 12.56 12.52 0.32% Selling and Marketing Expenses: Our selling and marketing receipt of a one-time insurance claim of  1,805 million in expenses as a percentage of total revenue decreased from fiscal year 2025. This increase in expenses was partially ANNUAL For segment reporting, we have included the impact of exchange rate fluctuations on revenue. Excluding the 7.23% for the year ended March 31, 2025 to 6.38% for the offset by a reduction in staff recruitment expenses and a impact of exchange rate fluctuations, revenue, as reported in our statement of income, is  890,884 million and year ended March 31, 2026. In absolute terms, selling and reduction in average headcount during the fiscal year 2026  926,240 million for the years ended March 31, 2025 and 2026, respectively. Please see Note 33 of the Notes to the marketing expenses decreased by 8.02% due to decrease arising out of cost optimization initiatives. INTEGRATED Consolidated Financial Statements under IFRS for additional details. For key financial ratios refer to Investor Returns section. WIPRO


LOGO

48 LEADERSHIP INSIGHTS AND OUTLOOK 49 Operating Income: As a result of the foregoing factors, Income Taxes: Our income taxes decreased by  2,010 IT Services Results of Operations for the March 31, 2026. In absolute terms, these expenses fell by our operating income marginally decreased from million from  42,777 million for the year ended March Years Ended March 31, 2026  6,317 million. Employee compensation costs decreased  151,271 million for the year ended March 31, 2025, to 31, 2025, to  40,767 million for the year ended March by  5,900 million due to lower average headcount and  151,251 million for the year ended March 31, 2026, and 31, 2026, and our effective tax rate decreased from and 2025 a reduction in per-employee cost in fiscal year 2026 as our results from operating activities as a percentage of 24.45% for the year ended March 31, 2025 to 23.51% for compared to fiscal year 2025 and was partially offset by revenue (operating margin) decreased by 68 bps from the year ended March 31, 2026. Please refer to Note 21 Our gross profit as a percentage of revenue from our IT the impact of salary increases and promotions. 16.98% to 16.30%. of the Notes to the Consolidated Financial Statements Services segment decreased by 92 bps. This decline was primarily driven by an increase in employee compensation General and administrative expenses as a percentage of under IFRS for further information. Finance Expenses: Our finance expenses decreased by  23,552 million due to the impact of salary increases, revenue from our IT Services segment decreased from from  14,770 million for the year ended March 31, 2025, Profit Attributable to Non-Controlling Interest: Our including promotions, and an increase in average headcount, 6.48% for the year ended March 31, 2025, to 6.35% for the to  14,577 million for the year ended March 31, 2026. profit attributable to non-controlling interest decreased including through acquisitions completed in fiscal year 2026 year ended March 31, 2026. In absolute terms, general and The decrease is primarily due to lower loans and from  826 million for the year ended March 31, 2025, as compared to fiscal year 2025. Additionally, incremental administrative expenses increased by  969 million. This was borrowings and a gain on remeasurement of written to  681 million for the year ended March 31, 2026. sub-contracting costs of  7,559 million were incurred to fill primarily due to an increase in lifetime expected credit loss put options, which was offset by an increase in interest vacant positions and software license expenses increased of  2,401 million and receipt of a one-time insurance claim of Profit Attributable to Equity Holders: As a result of on lease and tax liability during the year ended by  2,529 million for internal use due to the implementation  1,805 million in fiscal year 2025. This was partially offset by the foregoing factors, our profit attributable to equity March 31, 2026. of new technology. Further, the expenses increased on a reduction in total employee compensation costs of  3,101 holders increased by  620 million or 0.47%, from account of depreciation of the Indian Rupee against major million arising from cost optimization initiatives in fiscal Finance and Other Income: Our finance and other  131,354 million for the year ended March 31, 2025, to foreign currencies, including the Euro, Pound Sterling, year 2026 compared to fiscal year 2025. Staff recruitment income decreased from  38,202 million for the year  131,974 million for the year ended March 31, 2026. U.S. Dollar, Australian Dollar, and Canadian Dollar. This is expenses decreased by  1,244 million during the year ended ended March 31, 2025, to  36,491 million for the year partially offset by decrease in the depreciation charge for March 31, 2026. ended March 31, 2026. The decrease is primarily due to a decrease in dividend income of  2,296 million during our property, plant and equipment and right-of-use assets of As a result of the above, segment results as a percentage of the year ended March 31, 2026, compared to the year  1,504 million. our revenue from our IT Services segment increased by 15 ended March 31, 2025. Selling and marketing expenses as a percentage of revenue bps, from 17.07% to 17.22%. In absolute terms, the segment from our IT Services segment declined from 7.2% for the results of our IT Services segment increased by 4.62%. year ended March 31, 2025, to 6.30% for the year ended Our segment results by SMUs within the IT Services segment, expressed in terms of percentages, are provided below: Analysis of Revenue and Results by Segment FY26 FY26 FY25 FY25 Operating Results of the IT Services Segment are as Follows: Strategic Market Units Percentage Percentage of Percentage of Percentage of of $ Revenue Segment Results $ Revenue Segment Results ( in million) Americas 1 33.2% 38.4% 31.7% 39.7% Americas 2 29.2% 40.4% 30.6% 33.5% Particulars FY26 FY25 YoY Change Europe 26.5% 19.4% 27.1% 19.6% Revenue 921,153 888,224 3.71% APMEA 11.1% 8.5% 10.6% 9.4% Cost of Revenue (646,024) (614,754) 5.09% Unallocated NA -6.7% NA -2.2% Gross Profit 275,129 273,470 0.61% Our IT Services segment revenue by sectors, expressed in terms of percentages, is provided below: Selling and Marketing Expenses (57,988) (64,305) -9.82% - 26 General and Administrative Expenses (58,495) (57,526) 1.68% Sector FY26 FY25 2025 Banking, Financial Services and Insurance 34.1% 34.3% Segment Results 158,646 151,639 4.62% Consumer 18.4% 19.1% REPORT As a Percentage of Revenue: Health 14.5% 14.1% Selling and Marketing Expenses 6.30% 7.24% -94 bps Energy, Manufacturing and Resources1 17.0% 17.2% General and Administrative Expenses 6.35% 6.48% -13 bps Technology and Communications1 16.0% 15.3% ANNUAL Gross Margins 29.87% 30.79% -92 bps 1 Effective July 1, 2024, the Company reorganized its sectors by merging ‘Technology’ and ‘Communications’ into ‘Technology and Communications’ sector, Segment Results 17.22% 17.07% 15 bps and ‘Energy, Natural Resources and Utilities’ and ‘Manufacturing’ sectors were merged effective October 1, 2024, into ‘Energy, Manufacturing and Resources’ sector. Comparative period revenue by sectors information has been restated to give effect to this change. INTEGRATED For the purpose of segment reporting, we have included the impact of exchange rate fluctuations, gains/(losses), net amounting to H32 million and H1,853 million for the years ended March 31, 2025 and 2026, respectively, in revenue. WIPRO


LOGO

50 LEADERSHIP INSIGHTS AND OUTLOOK 51 IT Services Clients Operating Results of the IT Products Segment are as Follows: We service clients from a broad array of industry sectors. Several of our clients engage our services across multiple ( in million) service offerings. We seek to increase business with our existing clients by expanding the type and range of services we can provide to them. The table below sets forth the number of our clients as measured by revenues. Particulars FY26 FY25 YoY Change Revenue 6,940 2,692 157.80% Client Revenue Bucket ($) FY26 FY25 FY24 1-3 million 324 318 332 Cost of Revenue (6,128) (2,833) 116.31% 3-5 million 102 109 108 Gross Profit 812 (141) 675.89% 5-50 million 244 245 256 Selling and Marketing Expenses (175) (59) 196.61% 50-100 million 29 27 23 General and Administrative Expenses (78) 27 -388.89% >100 million 16 17 22 Segment Results 559 (173) 423.12% Total >1 million 715 716 741 As a Percentage of Revenue: Selling and Marketing Expenses 2.52% 2.19% 33bps General and Administrative Expenses 1.12% -1.00% 212bps The largest client of our IT Services business accounted for 3.0%, 4.3% and 4.6% of revenues from the IT Services Gross Margins 11.70% -5.24% 1694bps business as a whole for the years ended March 31, 2024, 2025 and 2026, respectively. The five largest clients of our IT Services business accounted for 13.0%, 14.0% and 14.3% of our total IT Services revenues for the years ended Segment Results 8.05% -6.43% 1448bps March 31, 2024, 2025, and 2026, respectively. IT Products Results of Operations for the As a result of the above, segment results as a percentage Guided Outlook Versus Actuals Years Ended March 31, 2026 and 2025 of our revenue from our IT Products segment increased by 1,448 bps, from (6.43)% to 8.05%. In absolute terms, the Performance against Guidance segment profit of our IT Products segment increased by Our revenue from the IT Products segment increased by Historically, we have followed a practice of providing constant currency revenue guidance for our largest business  732 million. 157.80% for the year ended March 31, 2026, compared segment, namely, IT Services, in dollar terms. This guidance is provided at the release of every quarterly earnings, to our revenue for the year ended March 31, 2025. This when the revenue outlook for the succeeding quarter is shared. The following table presents the performance of IT growth was primarily driven by revenue from acquisitions Reconciling Items Services Revenue against the outlook previously communicated for the past eight quarters. Our revenue performance completed during the year and higher revenue from a few “Reconciling Items” for the year ended March 31, 2026, was has been within the guidance range in 7 out of 8 quarters of fiscal year 2025 and 2026 and exceeded the guidance select customers in India. Our gross profit as a percentage  7,954 million, which includes restructuring costs of  5,139 range once in Q3 FY25. of our IT Products segment revenue increased by 1,694 million and a  2,756 million impact from past service cost % of over/(under) bps for the year ended March 31, 2026, compared to the on gratuity, remeasurement of leave encashment due to the Revenue—Revenue— Achievement against year ended March 31, 2025. In absolute terms, gross profit Quarter Guidance ($ mn) Reported Currency Guided Currency implementation of the new labor code [in India] and certain Lower/Upper End of ($ mn) ($ mn) increased by  953 million primarily due to incremental profit Guidance other corporate costs. For the year ended March 31, 2025, Q4 FY26 (Jan—Mar 2026) 2,635-2,688 2,651.0 2,641.4 0.2%/(1.8%) from acquisition and profitable contracts executed during “Reconciling Items” includes  202 million towards certain the year. corporate costs. Q3 FY26 (Oct—Dec 2025) 2,591-2,644 2,635.4 2,641.8 1.9%/(0.1%) Q2 FY26 (July—Sep 2025) 2,560-2,612 2,604.3 2,594.2 1.3%/(0.7%) Selling and marketing expenses as a percentage of revenue Q1 FY26 (Apr—June 2025) 2,505-2,557 2,587.4 2,543.3 1.5%/(0.5%) from our IT Products segment increased from 2.19% for the—26 Q4 FY25 (Jan—Mar 2025) 2,602-2,655 2,596.5 2,607.9 0.2%/(1.8%) year ended March 31, 2025, to 2.52% for the year ended March 31, 2026. In absolute terms, selling and marketing 2025 Q3 FY25 (Oct—Dec 2024) 2,607-2,660 2,629.1 2,661.4 2.1%/(0.1%) expenses increased by  116 million. Q2 FY25 (July—Sep 2024) 2,600-2,652 2,660.1 2,642.0 1.6%/(0.4%) REPORT Q1 FY25 (Apr—Jun 2024) 2,617-2,670 2,625.9 2,631.4 0.6%/(1.4%) General and administrative expenses/(credit) as a percentage of revenue from our IT Products segment increased from ANNUAL (1.00)% for the year ended March 31, 2025, to 1.12% for the year ended March 31, 2026. In absolute terms, general and administrative expenses increased by  105 million primarily due to an increase in lifetime expected credit loss on trade INTEGRATED receivables during the year ended March 31, 2026, as compared to a write-back in lifetime expected credit loss on WIPRO trade receivables during the year ended March 31, 2025.


LOGO

52 LEADERSHIP INSIGHTS AND OUTLOOK 53 Liquidity and Capital Resources Cash used in financing activities for the year ended Our liquidity and capital requirements are affected by many March 31, 2025, was  63,963 million. This is primarily on factors, some of which are based on the normal ongoing The Company’s cash flow from its operating, investing and financing activities, as reflected in the Consolidated account of outflow for payment of dividends amounting to operations of our businesses and some of which arise from Statement of Cash Flows, is summarized in the table below:  62,750 million, payment of lease liabilities including interest uncertainties related to global economies and the markets ( in million) of  10,474 million and payment of interest and finance that we target for our services. We cannot be certain that Particulars FY26 FY25 YoY Change expenses of  8,689 million. These were partially offset by an additional financing, if needed, will be available on favorable Net Cash Generated from/(Used in): inflow of  17,923 million from loans and borrowings during terms, if at all. Operating Activities 149,316 169,426 (20,110) the year ended March 31, 2025. Investing Activities (33,423) (80,730) 47,307 As of March 31, 2025 and 2026, our cash and cash Financing Activities (141,260) (63,963) (77,297) We maintain a borrowing level that we have established equivalents were primarily held in U.S. Dollars, Canadian Net Change in Cash and Cash Equivalents (25,367) 24,733 (50,100) through consideration of several factors, including cash flow Dollars, Euros, Pound Sterling, Indian Rupees, Australian expectations, cash required for operations and investment Dollars, Chinese Yuan, and Swiss Franc. Please refer to Effect of Exchange Rate Changes on Cash and Cash Equivalents 8,948 290 8,658 plans. We continually monitor our funding requirements, “Financial risk management” under Note 19 of our Notes to and strategies are executed to maintain sufficient the Consolidated Financial Statements under IFRS for more As of March 31, 2026, we had cash and cash equivalents Cash used in investing activities for the year ended flexibility to access global funding sources, as needed. details on our treasury activities. and short-term investments of  543,235 million. Cash March 31, 2026, was  33,423 million. Cash is primarily Please refer to Note 14 of our Notes to the Consolidated and cash equivalents and short-term investments, net of used towards purchases of investments (net of sale) Financial Statements under IFRS for additional details on loans and borrowings, were  375,361 million. amounting to  21,074 million and purchases of property, our borrowings. plant and equipment amounting to  15,603 million, As of March 31, 2026, we had contractual commitments of In addition, we have unutilized credit lines in various which was primarily driven by the growth strategy of the  9,416 million ($100 million) related to capital expenditures currencies aggregating to  41,108 million as of March Company. Further, there was a cash outflow of  26,033 on the construction or expansion of software development 31, 2026. To utilize these lines of credit, we require million towards the business acquisition consummated facilities and  52,214 million ($556 million) related to other the consent of the lender and compliance with certain during the year ended March 31, 2026. These were purchase obligations. Plans to construct or expand our financial covenants. We have historically financed our partially offset by an inflow of  28,881 million from software development facilities are determined by our working capital and capital expenditures through our interest and dividends received and an inflow of H758 business requirements. operating cash flows and through bank debt, as required. million from the sale of property, plant and equipment Cash generated from operating activities for the year during the year ended March 31, 2026. As discussed above, cash generated from operations is our ended March 31, 2026, decreased by  20,110 million, Cash used in investing activities for the year ended primary source of liquidity. We believe that our cash and cash while profit for the year increased by  475 million during March 31, 2025, was  80,730 million. Cash is primarily equivalents, along with cash generated from operations, the same period. The decrease in cash generated from used towards purchases of investments (net of sale) will be sufficient to meet our working capital requirements operating activities is primarily due to increased working amounting to  95,062 million and purchases of property, as well as repayment obligations with respect to debt and capital requirements, contributed by net increases in plant and equipment amounting to  14,737 million, borrowings for the next 12 months. Our choices of sources trade receivables, unbilled receivables, contract assets, which was primarily driven by the growth strategy of funding will be driven by the objective of maintaining an and other assets. The decrease was partially offset by of the Company. Further, there was a cash outflow optimal capital structure. net increases in trade payables, accrued expenses, We will rely on funds generated from operations and external of  964 million towards the business acquisition other financial liabilities, other liabilities, provisions and debt to fund potential acquisitions. We expect that our cash consummated during the year ended March 31, 2025. contract liabilities. and cash equivalents, investments in short-term mutual 26—These were partially offset by an inflow of  28,511 million 2025 Cash generated from operating activities for the year from interest and dividends received and an inflow funds, and the cash flows expected to be generated from our ended March 31, 2025, decreased by  6,790 million, of  1,822 million from the sale of property, plant and operations in the future will generally be sufficient to fund REPORT while profit for the year increased by  21,059 million equipment during the year ended March 31, 2025. our growth aspirations, as applicable. during the same period. The decrease in cash generated Cash used in financing activities for the year ended In the normal course of business, we transfer certain trade from operating activities is primarily due to increased receivables, unbilled receivables, and net investments in March 31, 2026, was  141,260 million. This is primarily on ANNUAL working capital requirements, contributed by net finance leases (financial assets) to banks on a non-recourse increases in trade receivables, unbilled receivables, account of outflow for payment of dividends amounting contract assets, and other assets. Further, income taxes to  115,206 million, payment of lease liabilities including basis. The incremental impact of such transactions on our paid, net of refund, increased by  10,815 million during interest of  11,561 million, payment of interest and cash flow and liquidity for the years ended March 31, 2025 INTEGRATED finance expenses of  6,336 million and repayment of and 2026 is not material. Please refer to Note 19 of our the year ended March 31, 2025. loans and borrowings of  6,752 million from loans and Notes to Consolidated Financial Statements under IFRS. WIPRO borrowings during the year ended March 31, 2026.


LOGO

54 SUSTAINABILITY AT WIPRO 55 Value Creation Model Inputs How we Deliver Value Outputs Stakeholder-centric Outcomes Stakeholders SDGs Financial Capital Investors F F Financial Capital Investors Net Worth:  888 bn Delivering long-term value through consistent 87.8%—Total Payout as percentage of Net Income over Debt:  167.9 bn $10,478 mn—IT Services Revenue and disciplined a block of trailing 3 years. $1414.0 mn—Profit After Tax Capital linkages: N H I S M performance Our sound governance, financial management and risk 15.4%—Return on Net Worth governance provide our investors the assurance of $0.13—Earnings Per Share long-term stability. following: Global leadership member in of investor S&P Global -led frameworks Sustainability like Yearbook; the N Natural Capital N Natural Capital Ecovadis- Silver rating and CDP (Climate Change A-, Water A-). Total Green Energy Procurement: 174 mn KwH Suppliers Planet & Well-being Investment in water management: ˜  295 mn Building resilient, Driving our environmental 94%—Of our electricity is powered by Green Procurement: EPEAT implemented for collaborative, and commitment since 2007, renewable sources Planet (Environment & Human Well-being) sustainability-aligned using Natural Capital 34%—Of our total water consumption is Our environmental stewardship activities help reduce . over 8 years partnerships with Valuation to connect treated and reused wastewater the negative externalities and burden on the natural . Capital linkages: F H I M suppliers environmental impact 98%—Waste recycled environment. While our contribution may be modest with human well-being $510 mn—Natural Capital Impact is relative far greater to the . We scale will of continue the challenge, to strengthen the cost our of inaction efforts in 123,539 tons CO2e emissions avoided this space. 2,637 tons CO2e avoided through EPEAT spirit support Beyond our underserved operations, urban our urban communities ecology through initiatives access  H Human Capital Stakeholders character to clean water and sanitation, solid waste management, Total Number of Employees: 242,156 H Human Capital and resilience to urban heat. our Hours of training & development: 19.23 mn Hours Communities Our Employees Investments in employee well-being: 1.60% of Governance-led Building a people- 212,663—Employees covered through AI-ready our total revenue engagement focused on centric, future-ready workforce initiatives Employees education, healthcare, workforce focused on 86%—satisfaction in Employee Engagement Survey the Spirit of Wipro values and Five Capital linkages: F N I S M and vulnerable safety, wellbeing, and With Habits, a culture we are rooted constantly in raising the bar for a workplace that up communities continuous upskilling is of inclusive, belonging diverse, . fair, safe and that fosters a strong sense I Intellectual Capital Economic Our efforts Forum have resulted for Diversity, in being Equity recognized and Inclusion by the (DEI) World  I Intellectual Capital R&D Investments:  4,499 mn Deployment Sovereign AI of (secure multi- domain data applications), AI solutions Inspect Lighthouse, and sustained 2025 impact for demonstrating in advancing inclusion measurable, and belonging, scalable, Customers makes AI Aware employees/associates acquired AI (visual intelligence) and Agentic AI (process among other distinctions. encapsulate Delivering AI-enabled, Advanced AI skills: 85,219 automation) including 750+ venture solutions innovation-led outcomes 40+ companies invested in through through four Global Business 1,907: Total number of patents Wipro Ventures Lines. Technology Services, EIQ (Enterprise Intelligent Quotient) Customers and Fund to invest through Wipro Ventures: $500 mn Business Process Services, framework for structured AI adoption Scalable enterprise-wide AI implementation capabilities. Capital linkages: F N H M Consulting, and Engineering Strengthened client transformation outcomes through values AI-led innovation. Co-creation of AI-powered solutions for different S Social & Relationship Capital industry segments. Our Our Strategic Priorities 97.3% of total revenue: Revenue from existing NPS continues in the top quartile of industry. defines S Social & Relationship Capital customers (IT Services segment) It  2,274 mn: CSR Expenditure—Building Large Accounts in Profitable 1,233: Total Number of Clients 16.84%: Supplier diversity spends Communities 26—Markets and Prioritized Sectors 188+: Community partners 8.63%: MSME spend Wipro’s engagement with communities is rooted in a 5.9 mn: Number of Beneficiaries (communities) spirit of partnership and focuses on deep long-term - Sourcing, Shaping and Winning Large 216: Number of new customers 2025 Capital linkages: F N H I concerns and formed on the bedrock of good Deals with a Consulting-led, NPS continues in the top quartile of industry. governance and the Spirit of Wipro values. AI-powered Approach Healthcare, Engagement and on critical Urban Ecology issues in with Education, deliberative Primary focus  REPORT—Differentiating with Wipro Intelligence™ —Building Talent at Scale on vulnerable urban communities. An overarching objective is to strengthen organizational Manufactured Capital Manufactured Capital capacity of our partners. M—Client Centricity M ANNUAL National Offices: 52 International Offices: 165 Global service delivery network Investment in green Buildings:  105 mn Five Habits spanning 224+ locations. Suppliers GECC platform integrates 90% of our total India As a result of GECC, we had an annual Our suppliers are critical stakeholders in our business office space through BMS electricity saving of 5.22 mn units and success. Our suppliers are chosen for alignment with Being respectful  Being responsive net energy savings of  41.887 mn per INTEGRATED Wipro values of integrity and ethical conduct. Capital linkages: F N H Always communicating     Demonstrating stewardship annum (across offices located in India). Our investment in capacity building, especially with our MSME suppliers through programs such as WISE, help Building trust WIPRO build ESG principles responsible . and resilient supply chains aligned with Wipro’s efforts in creating meaningful outcomes have been recognized globally; for further details, please refer to our Awards and Recognition on page 32.


LOGO

56 SUSTAINABILITY AT WIPRO Impact valuation measures a company’s positive and negative externalities on society and the environment. Although the methodologies continue to evolve, it provides a useful way to identify where value is created or diminished across the value chain. Its purpose is to assess both the intended and unintended impacts of business activities across products and services, operations, and the supply chain. By systematically accounting for these externalities, businesses can make more informed decisions that create value for all stakeholders, not just shareholders. Since 2016, we have measured our Environmental Profit & Loss (EP&L), also known as Natural Capital Valuation. This helps us assign a monetary value to natural capital and express different environmental impacts in a common unit. Over the past three years, we have also conducted Human Capital Valuation to assess the financial value of our impacts on employees, and Produced Capital Valuation to evaluate the value created Report for different stakeholders. Factors Considered for Impact Accounting Environmental Parameters Includes GHG emissions, air pollution, water consumption, waste generation, water and land pollution and land use change. This exercise was conducted for our Company (direct operations) as well as our value chain (Purchased Goods and Services, Fuel & Energy-related activities, business travel, employee commute and upstream leased assets). Social Parameters Includes labor practices, community engagement, human rights and health and safety. Economic Parameters Includes financial performance, economic impacts and value chain analysis. - 26 Valuation Wipro’s Natural Capital Valuation Program 2025 Assessment of natural capital impacts involves methodologies that help companies REPORT discover their hitherto hidden impacts (both positive and negative) on nature and natural capital. Discovering hidden impacts helps companies make informed decisions and identify future risks and opportunities. It is a rigorous framework that ANNUAL assesses and quantifies impacts across the six Key Performance Indicators (KPIs) that are part of Environmental factors. The methodology uses a value for the social cost of carbon that varies by country and sector. Typically, it uses a higher discount rate for INTEGRATED developing countries as compared to developed countries, as the former need more ‘ecological space’ and ‘time’ to fulfil their developmental imperatives. WIPRO Impact


LOGO

57 Methodology operations and upstream were quantified at $510 million ($270 million in FY25), of which operational and To calculate the impacts of air pollution, only human health upstream impacts contribute 1% ($3.6 million) and impacts were considered, as they contribute to 95% of the 99% ($506.4 million) respectively. total impact. Land use valuation is based on the net change in Our operational impacts saw a significant decline primarily economic value due to the loss of ecosystem services. In our due to an increase in the renewable share of electricity case, it is calculated for the electricity procured from the grid and a decrease in Scope 1 and Scope 2 emissions, hence mix and fuel consumed, because, for direct operations, land reducing the proportion of operational impact to the total use change is not considered material. For calculating the impact. This year, we also saw an increase in upstream impact of water consumption, the impacts on human health, valuation, particularly from our Purchased Goods & Services. including the incidence of infectious diseases, and the energy This has resulted primarily from (i) increased procurement consumption from water provisioning were considered. spend this year; and (ii) the upstream impacts of this spend on Tier II and Tier III suppliers, particularly those Our NCV for FY26 attributable to air pollution. The overall impacts can be broken down into two For greater clarity, we have presented below the natural components–operational impacts and upstream capital valuation from our Operations and Upstream impacts. In FY26, total environmental costs of Wipro’s separately. A negative value indicates a positive impact on the environment. Valuation Intensity by EBIT for Operational Impacts Intensity ($ per million $ EBIT) GHG Emissions Water and Land Pollution FY26 Impact 690 FY26 Impact 650 FY25 Impact 1,500 FY25 Impact 550 FY24 Impact 2,493 FY24 Impact 694 Air Pollution Waste Generation FY26 Impact 180 FY26 Impact -170 FY25 Impact 370 FY25 Impact -11 FY24 Impact 606 FY24 Impact -29 Water Consumption Land Use Change FY26 Impact 460 FY26 Impact 0 FY25 Impact 620 FY25 Impact 0 FY24 Impact 850 FY24 Impact 0 There are no impacts on land use change as a result of operations


LOGO

58 SUSTAINABILITY AT WIPRO Valuation Intensity by EBIT for Upstream Activities Intensity ($ per mn $ EBIT) GHG Emissions Air Pollution 0% 10% 20% 30% 40% 50% 60% 70% 80% 90% 100% 0% 10% 20% 30% 40% 50% 60% 70% 80% 90% 100% FY26 27,310 FY26 2,09,820 FY25 25,500 FY25 79,630 FY24 28,500 FY24 110,000 Water Consumption Water & Land Pollution 0% 10% 20% 30% 40% 50% 60% 70% 80% 90% 100% 0% 10% 20% 30% 40% 50% 60% 70% 80% 90% 100% FY26 12,540 FY26 650 FY25 7,980 FY25 550 FY24 11,150 FY24 710 Waste Generation Land Use Change 0% 10% 20% 30% 40% 50% 60% 70% 80% 90% 100% 0% 10% 20% 30% 40% 50% 60% 70% 80% 90% 100% FY26 1770 FY26 3,500 FY25 1711 FY25 4,600 FY24 429 FY24 8,900 The length of the bars is not representative of the values. Purchased Goods and Services  Fuel- and Energy Related Activities Business Travel Employee Commuting Upstream Leased Assets Within Wipro’s upstream supply chain, Purchased Goods and Services across all tiers of suppliers (94%; $480 million) and upstream leased assets 26—(3%; $14 million) are the top impact categories. 2025 The increased granularity in reporting upstream leased assets has resulted in a slight increase in REPORT impacts from this category. In terms of the sources of impact, air pollution ANNUAL (81%; $420 million) and GHG emissions (11%; $56 million) are the top two contributors. The primary source of air pollution in our impact reporting comes from secondary and tertiary INTEGRATED suppliers. A note on the methodology to measure air pollution impacts is highlighted in the box. WIPRO Refer to page 59


LOGO

59 Air Pollution Impacts – EEI Methodology In the spend-based estimation using the EEIO (Environmentally Extended Input-Output) model, the impacts are captured across secondary and tertiary suppliers throughout the full supply chain, creating a multiplier effect. In the case of air pollution, the coefficients include toxic pollutants such as heavy metals, which accumulate across multiple supplier tiers and supporting industries. Although service-sector vendors typically have low direct emissions, they depend on complex supply chains that rely on electricity, digital infrastructure, transport, business services, and other intermediate inputs. When these dependencies are captured through the Leontief inverse framework, environmental burdens from emission-intensive sectors can accumulate, leading to relatively high upstream impacts. Since these businesses often generate high economic output with limited physical flows, a larger share of upstream environmental burdens may be assigned per unit of spend. We constantly try and address previous years’ gaps through intensity of heavy metals) but not of services line items even improved accuracy of input metrics. Till last year, we had not after factoring in all upstream tiers, as indicated in the box included a sizable category of procurement of services–such above. We will continue to fine-tune our metrics and will as membership fees, health & safety related services– report any material re-statements of this particular valuation because they were made without a purchase order and in our dashboard. we were unable to assign material-categories accurately in Another indicator of this possible over-estimation is the the system. Since material categories play a critical role in fact that the picture gets flipped if we do an apple-to-apple determining impact valuation, wrong assignment can lead to comparison after removing this new category. We see that erroneous results. This year however, we decided to adopt the total impact valuation drops by 22% to $210 million from a conservative approach and include this entire category $270 million. Possible reasons for this decrease include: (amounting to around 50% of our total purchased value), despite being unable to bifurcate the spend by material • Complete phase-out of R-22 from all our sites, and a group or user (Wipro or our customer). We recognize the decrease in fuel consumption likelihood of over-estimation of impact—one indicator of • Increased percentage of RE (94%), resulting in a this is the very high attribution of air-pollution (81%) to the decrease in operational valuation as well as a decrease overall value. High air pollution values are typical of material in upstream fuel and energy valuation categories like construction materials, electronics (high


LOGO

60 SUSTAINABILITY AT WIPRO At Wipro, our stakeholders—employees, investors, customers, suppliers, and communities—are central to our value creation journey. We anchor our engagement in trust and stewardship, enabling us to navigate complex social, environmental, and economic priorities while delivering shared value. This approach strengthens our understanding of stakeholder expectations and enhances decision-making efficiency. Our strategy is closely aligned with delivering stakeholder value across six capitals: Natural, Financial, Human, Social & Relationship, Engagement Manufactured, and Intellectual. Capitals Stakeholder Groups - 26 2025 N F Natural Financial Customers Employees REPORT I H ANNUAL Intellectual Human Suppliers Communities S M Social & Relationship Manufactured Investors Planet (and Human INTEGRATED Well-being) WIPRO Stakeholder Impact of capitals on stakeholders Impact of stakeholders on the capitals


LOGO

61 Employees Customers shape Skills, engagement, workforce capability wellbeing and and productivity attrition directly . Complex and evolving client needs drive continuous capability building workforce . upskilling and Employees patents and drive innovation creation through of IP, AI R&D use and -cases, the Wipro Client co-innovation and solution Innovation Network. delivery contribute to industry IP and AI Workforce practices influence utilization of offices, capability development. smart campuses and digital workplaces. Delivery requirements influence security, location emissions, Commuting, energy travel and and resource employee consumption behavior impact . and resilience of delivery infrastructure. Customer expectations on sustainability drive Ethical volunteering conduct, through Five Habits Wipro Cares culture build and trust with adoption of Green IT and low-carbon solutions. communities and clients. Expectations on cybersecurity, data privacy and Employees are our primary source of revenue. transparency shape trust-based relationships. Investment in learning, well-being, inclusion and Customer satisfaction directly impacts revenues, leadership development enhances employability margins and litigation exposure. and engagement. Employee surveys and employee grievance mechanisms are ways to get feedback. Skilled teams enable high-quality, timely delivery Exposure to AI platforms, innovation labs and aligned can impact to business CSAT. goals. Quality of human capital emerging technologies enables continuous skill growth and reduces attrition. Culture of intellectual development (R&D, Patents, etc.) can provide innovative solutions Safe, support inclusive, collaboration, digitally well enabled -being workplaces and productivity . for customers. Climate-friendly campuses and sustainability Reliable global delivery centers ensure continuity initiatives support employee health and and scalability of services. increase awareness. Low-carbon delivery and sustainability solutions Inclusive belonging culture and retention and strong . values strengthen support customers’ ESG objectives. Strong governance and transparency enhance Employee—are a significant costs— component salaries, well but -being, its impacts rewards on long-term customer confidence. profitability in productivity are . more than offset by increases Financial stability enables sustained investments in customer-focused solutions. Modes and Frequency of Engagement Modes and Frequency of Engagement • Blogs – daily • Strategic and operational reviews • 360-degree feedback – annually • Customer meets • Formal customer feedback and surveys Topics of Engagement Topics of Engagement • Continuous learning • Quality and timeliness of delivery • Work-life balance • Impact on customers’ business goals • Compensation and benefits • Health and safety • Diversity


LOGO

62 SUSTAINABILITY AT WIPRO Suppliers & Partners Communities rights Supplier expectation labor practices is driven and by adherence TPRM and to abiding human Our embedded community in social work sector creates practices intangible . Also, knowledge some of to SCOC. our funding is for innovation incubators. tools, Partner platforms collaborations and solutions support . co-development of availability Local environmental and biodiversity conditions outcomes affect .water and Reliable delivery sourcing infrastructure ensures continuity . of IT, facilities from Governance external and bodies transparency as well as expectations laws help shape  our policies and processes that, in turn, shape emissions Supplier operations and environmental contribute footprint to Scope . 3 relationship of trust. Building partnerships with NGOs a deep, and meaningful grassroot manner organizations to a more to contribute equitable, in We build strong relationships with our suppliers and partners. Adherence to Supplier Code of humane and sustainable society. Conduct shapes trust. Wipro’s CSR spend on social and community Strong supplier relationships ensure secure initiatives is a P&L item. sourcing of critical inputs to our operations Wipro employees engage actively by volunteering which are important for the stability of our with communities through Wipro Cares. business continuity. We provide upskilling through our Talent Next Capability-driven engagement supports effective program to enhance employability. collaboration and compliance. Climate-friendly buildings reduce pressure on Environmental standards and WISE engagement shared resources. Additionally, we extend our good guide supplier sustainability practices. practices to communities around our campuses. Fair procurement and long-term partnerships Our boundaryless approach to Natural capital strengthen mutual trust. Suppliers can raise extends to our communities, which benefit from grievances ensuring fairness through . Wipro’s Ombuds program initiatives such as micro-watershed management, local groundwater community management, practices and etc .ecosystems (ii) Sometimes influence conservation infrastructure by communities design enhances e.g. better availability water for companies. development Sustained CSR programs funding .supports community Modes and Frequency of Engagement Modes and Frequency of Engagement • Regular operational reviews • Periodic meetings with partners - 26 • Supplier meets • Open meets with the community 2025 • Vendor surveys • Partner newsletters REPORT Topics of Engagement Topics of Engagement ANNUAL • payment Ease of doing life cycle business with Wipro across the order-to- • Primary healthcare for rural communities • Ethical business conduct and social practices • Environmental communities issues that affect disadvantaged • Education for disadvantaged children INTEGRATED • Long-term rehabilitation for disaster-affected areas WIPRO


LOGO

63 Investors Planet and Human Well-being depth Expectations influence on people talent productivity strategy. and leadership Climate risks affect employee safety and wellbeing. Innovations in Green technologies (Shifting from Venture investments and acquisitions can Data centers to Cloud, energy efficient software, strengthen and augment our IC. AI-driven solutions) ESG expectations influence climate targets and Environmental constraints drive resilient disclosures. Potential payoffs from more favorable infrastructure design, such as initiatives around terms in debt-instruments aligned with ESG targets. energy, water, waste and IAQ. Developing and maintaining trust and transparency Reducing our environmental and climate footprint is a key cornerstone of our investor relations. through GHG emissions various reduced initiatives our in water, dependency waste and on Investors influence capital availability, market valuation and financial stability. Natural Capital. Strong human capital performance supports Environmental and planetary health are closely correlated with the well-being of communities sustainable returns and has a direct correlation with shareholder and investor return. and society. Investments in leading edge technology—e.g., AI Measuring our Natural Capital Valuation to understand the financial impact on our—can help enhance profitability and deliver better investor returns. natural resources. Efficient assets protect margins and returns. Employee awareness programs promote sustainable behavior. Performance in the ESG disclosures related to Stable environments protect infrastructure and climate action drive investor confidence. extent asset life. Investor frameworks—e.g. S&P DJSI—could Conservation and restoration initiatives potentially help strengthen our governance protect ecosystems. practices and our investor relationships. Community collaboration drives collective Proven and direct correlation between company’s climate action. financial performance and investor returns. Capex and Opex Investment in initiatives that help reduce our impact on the planet. Modes and Frequency of Engagement Modes and Frequency of Engagement • Annual General Meeting • Employee awareness programs • Annual Report • Supplier engagement Topics of Engagement Topics of Engagement • Corporate governance • Planetary waste, biodiversity Health: Climate change, water, • Financial performance • Human Resilience: Health and well-being, climate literacy, • Labor and human rights ecological restoration, inclusive infrastructure • Attrition • Sustainability Education: Employee awareness programs, • Compliance education in schools and colleges, collaborations with universities


LOGO

64 SUSTAINABILITY AT WIPRO Strategic stakeholder engagement helps us identify and prioritize the issues that matter most to our stakeholders. This materiality assessment process enables us to focus on topics most relevant to both our organization and the stakeholders we engage with. Grouped under Environmental, Social, and Governance (ESG), these topics guide the alignment of our goals and targets with organizational strategy. They also help us manage risks, identify opportunities, and strengthen stakeholder trust. Our Approach to Assessing Material Topics Our approach to assessing material topics is structured to ensure a systematic evaluation of ESG priorities. This approach follows a three-stage framework for defining stakeholders, identifying issues, and prioritizing them. These are then implemented through four key steps: Identify, Design, Collect, and Analyze. Identify Design Relevant ESG topics are identified A stakeholder engagement based on inputs from internal methodology is developed, stakeholders, peer reviews and including the identification of a benchmarking, sector scans, representative set of internal and media reports, and material external stakeholders and the creation Assessment topics outlined by frameworks of customized questionnaires to such as SASB, MSCI, EcoVadis, capture their responses. S&P Global’s CSA, BRSR, GRI, and ISSB. Materiality Assessment - 26 2025 REPORT Collect Analyze Data is collected from internal and Stakeholder responses are external stakeholders through analyzed, weights are determined surveys, along with FGDs for for stakeholder groups, themes ANNUAL selecting stakeholders. are categorized into sub-topics. These are then synthesized into INTEGRATED a materiality matrix. Materiality WIPRO


LOGO

65 Double Materiality Assessment Our Approach for Double Materiality During the year, we conducted a comprehensive double materiality assessment to identify ESG matters significant to Map and define the value chain Wipro, considering their potential and actual Impacts, Risks, and Opportunities (IROs). The assessment reflects both financial Identify key ESG matters and impact materiality, evaluating the influence of ESG factors Assess potential impacts, risks, and opportunities on financial performance and the Company’s impact on the Conduct stakeholder engagement environment and society. Aligned with the European Sustainability Reporting Standards Evaluate impact and financial materiality (ESRS), this approach ensures consistency, transparency, and Finalize material topics and reporting requirements comparability in sustainability disclosures, while supporting informed decision-making and responsible business practices. The difference in how we approach Double Materiality is in evaluating the impacts, risks and opportunities for each material topic. Whereas in single materiality, we are only looking through the impact lens on how our organization impacts environment and society, the double materiality lens also looks at the risks and opportunities from the environment and climate on our business. Outcomes of our last Materiality Exercise Environmental Stewardship across the Value Chain Our previous materiality exercise was done in 2023. The first step was to prioritize material topics through engagement Goal #1: Contribute effectively to actions across the value with internal and external stakeholders, enabling us to capture chain on the climate change challenge their perspectives on a shortlisted set of ESG topics spanning Goal #2: Responsible management of scarce Environmental, Social, and Governance issues. In addition, water resources survey responses were interpreted within a broader context by considering insights from secondary research and the reflections captured during Focus Group Discussions (FGDs) Social – Building a Future-ready Workplace and Strengthening our Community Work with Wipro’s senior leadership. An initial list of 50 material topics was considered in our Goal #3: Build and promote a culture of inclusion by materiality exercise, derived from multiple ESG frameworks, nurturing diversity and shaping behaviors customer expectations and standards. This list was Goal #4: Empower employees through continuous subsequently refined to 25 topics and organized into eight main learning opportunities themes. Stakeholder-specific questionnaires were developed, Goal #5: Prioritize employee health, well-being and safety and responses were sought from all stakeholders–employees, at all times customers, investors and suppliers. In total, approximately 530 Goal #6: Contribute in a deep, meaningful manner to a stakeholder responses were recorded, along with two in-depth more equitable, humane and sustainable society FGDs with Wipro’s leadership team. The responses were mapped against business relevance and stakeholder relevance. Topics positioned closer to the Governance – Aligning Purpose, Transparency and Trust 45-degree line indicate an alignment between both views in Goal #7: Maintain the highest standards of governance terms of relevance, importance and potential impact. These based on the bedrock of Wipro values and ethical insights were consolidated into eight broad themes, reflecting business conduct issues that are intricately linked to the way we do business. This materiality exercise led to the formulation of seven key ESG goals as shown.


LOGO

66 SUSTAINABILITY AT WIPRO Materiality Linkages with Corporate Strategy Ethical Governance and Transparency Material Topics Progress in FY26 • Corporate Governance and Business Ethics • Placed in the Next Leader Category in the Indian Corporate Governance • Risk Management, including business continuity and assessment by IiAS. contingency planning • Aligned reporting with global frameworks (ISSB, GRI, SASB, TCFD, BRSR) • Stakeholder relationships and engagement • Integrated enterprise risk management with ESG and climate • Transparency in disclosures risk oversight • 89% employees trained in the Code of Business Conduct (COBC) Relevance to Wipro Ethical rigor, integrity, and transparency are fundamental to how we long-term value. Wipro’s corporate governance framework has evolved conduct business. We believe these principles are essential to building over time, drawing on globally recognized principles and grounded in the lasting relationships with clients and suppliers, which in turn creates values of the ‘Spirit of Wipro’. Cybersecurity and Data Protection Material Topics Progress in FY26 • Compliance with Cybersecurity Regulations • Expanded coverage of ISO 27001 certification • Implemented Third Party Risk Management Framework for suppliers • 90% of employees completed cybersecurity awareness training Relevance to Wipro Cybersecurity risk management is a core part of our enterprise risk cybersecurity services that help customers build resilience through management program. We have established a layered cybersecurity advisory-led solutions that balance AI adoption with risk, security, and framework supported by policies, standards, and procedures enabling governance considerations. All employees are required to complete threat detection, continuous monitoring, and incident response. We annual cybersecurity training, and detailed vendor risk assessments are apply rigorous data privacy controls to protect the Personal Identity conducted to safeguard Wipro’s data. Information (PII) of employees, customers, and suppliers and provide Customer Centricity Material Topics Progress in FY26 • Customer satisfaction and engagement • Maintained customers (IT strong services) client relationships with 97.3% revenue from existing • Wipro NPS continues to be in the top quartile of the industry Relevance to Wipro Acquiring and retaining high-value customers is central to our business reviews, CSAT, and Net Promoter Score (NPS), and continuously use this strategy. Customer-centricity is central to us in many ways. We capture feedback to strengthen our customer strategy. the voice of the customer through multiple channels, including regular - 26 2025 Innovation and Emerging Technology REPORT Material Topics Progress in FY26 • R&D and innovation • Invested  4,499 million in R&D and leveraged Wipro Innovation Network ANNUAL • Protecting intellectual property rights for technology development • Strengthened registered trademarks, IP portfolio supported with 1,907+ by robust patents cybersecurity and 344 and IP protection frameworks Relevance to Wipro INTEGRATED Innovation is essential to staying competitive in emerging areas. We our $500 million venture capital arm, invests in early- and mid-stage advance technology solutions through the Wipro Innovation Network, enterprise software startups aligned with our technology priorities. WIPRO where ideas are developed and tested. In addition, Wipro Ventures,


LOGO
67 Future-ready Workforce Material Topics Progress in FY26 • Talent attraction and retention through Learning and • Trained 85,219 employees in advanced AI skills; 93,994 employees acquired Development (L&D) Master AI skills • Fair labor practices and human rights, including fair • The gender pay parity ratio is 0.98 (average female salary/average male salary) compensation and remuneration • Recognized for global DEI leadership and inclusion by World Economic Forum, • Inclusion and diversity CII, Avtar & Seramount and other prestigious organizations. Please refer to our Awards and Recognition on page 32. Relevance to Wipro A skilled and motivated workforce is the backbone of the organization. We platforms such as wiLearn and WiAspire, with a focus on next-generation build future-ready capabilities through continuous learning and upskilling technologies, including GenAI. Responsible Supply Chain Material Topics Progress in FY26 • Responsible supply chain management • Strengthened audits, and sustainability ESG-aligned programs procurement (WISE, through TPRM) Supplier Code of Conduct, • Supplier diversity and resilience • Achieved mentorship 16 and .84% risk diverse management supplier programs spend and 8.4% MSME spend, supported by Relevance to Wipro Building a supplier base grounded in ethics and sustainability strengthens supply chain resilience. Suppliers with strong governance practices are more reliable and uphold higher quality standards, thereby reducing reputational risk. Community Impact Material Topics Progress in FY26 • Social impact and community engagement • Impacted 5.9 million beneficiaries, including 2.89 million children, including 148,467 children with disabilities. • Strengthened healthcare access for ~1 million women and ~1.7 million children • Invested  2,274 million in CSR initiatives and partnered with ~188 organizations to drive inclusive and equitable community development Relevance to Wipro Wipro’s community engagement across education, healthcare, and ecology operate must extend beyond legal compliance and be earned through the serves two objectives: primarily addressing critical human well-being needs trust of the communities we engage with. Our deep community engagement, and secondarily building long-term goodwill. We believe our license to therefore, strengthens our societal license to operate. Environmental Stewardship and Climate Action Material Topics Progress in FY26 • Climate action (mitigation) and GHG emissions • Achieved 92% reduction in Scope 1 and Scope 2 emissions and 94% renewable • centers Environmental and campuses sustainability management Green data energy usage • Climate risks and resilience (physical and transition) • Achieved 98% waste diversion from landfill • Treated and reused water formed 34% of our total water consumption • Strong focus on energy-efficient infrastructure and green buildings, including centralized monitoring of ~90% building space for energy and IAQ • S&P Global Sustainability ranking: #6 in IT sector globally Relevance to Wipro Wipro has a global footprint, with around 21 owned and operationally For example, investments in building energy efficiency offer strong financial controlled offices and about 196 leased spaces. Reducing the environmental returns. In addition, addressing climate risk and ensuring business continuity impact of our operations and services is central to our sustainability is becoming increasingly important as climate related weather event become commitments. Our climate and environmental actions reflect our more frequent. responsibility to society while also delivering business value.


LOGO

68 SUSTAINABILITY AT WIPRO At Wipro, our ESG and Sustainability approach is deeply rooted in our core values and guided by global industry benchmarks, materiality assessments, and continuous stakeholder engagement. Anchored in the Spirit of Wipro, our governance framework integrates ethical conduct and sustainable practices across operations, enabling long-term value creation and responsible growth. We recognize sustainability as a shared responsibility embedded across the organization. This commitment spans all levels, functions, and business units, with multiple teams playing a critical role in driving outcomes. Our Global Operations Team, Global People Function, Investor Relations Team, Global Procurement Team, and Legal Team are central to anchoring, shaping, and executing our ESG priorities. Oversight of sustainability initiatives is exercised at the corporate level under the guidance of the Chairman, the Board of Directors, and the Wipro Executive Board. In addition, Board-level committees comprising Independent Directors actively contribute to sustainability governance, providing strategic direction, oversight, and accountability to ensure alignment with and long-term value creation and responsible business practices. Governance The overarching responsibility for the Company’s ESG charter rests with the Chief Executive Officer (CEO). This includes Climate Change as a key element. The Global Head of Sustainability and Social Initiatives (the Chief Sustainability Officer) oversees the overall sustainability charter. The Global Head reports to the Chief Human Resources Officer, who is part of the Wipro Executive Board, the organization’s senior-most executive body, comprising a core group of corporate leaders. 26 ESG Governance at Board Level: Our Board’s governance of sustainability—2025 falls under the Nomination and Remuneration Committee (that also serves as the Corporate Social Responsibility Committee) and is led by an Independent Director. This apex body oversees Wipro’s sustainability REPORT Strategy policy and programs. Composed entirely of Independent Directors, the Committee also reviews the Company’s policies on Corporate Social ANNUAL Responsibility, including public issues of significance to the Company and its stakeholders. At Wipro, all sustainability programs adhere to the organization’s regular INTEGRATED planning and budgeting cycles. These programs are reviewed quarterly at multiple levels, by the Board, the Group Executive Council and the Chairman. The progress of ESG goals is monitored by the Board during WIPRO ESGGovernance quarterly meetings.


LOGO

69 Organization Structure At Wipro, we operate multiple sustainability initiatives based on the principle of building a coalition or network of partners, both internal and external. The Global Head of Sustainability oversees the operation of sustainability programs and reporting. This includes the responsibility of formally reviewing and approving sustainability disclosures and seeking assurance for reports. Our ESG Governance Framework Board Oversight Sustainability Reporting Chain Board of Directors The overarching responsibility Chief Executive for the Officer Company’s (CEO) ESG charter rests Founder Chairman Independent Executive & Chairman Directors Director with the Chief Executive Officer (CEO) Board Committees Chief Human Resources Officer (CHRO) Committees of the Board Global(Chief Head Sustainability – Sustainability Officer & Social (CSO)) Initiatives & Audit, Compliance Risk & Remuneration Nomination & Administrative Stakeholders Committee Committee Committee Also oversees Also serves as the Also oversees Corporate Sustainability Team including risk management, evaluation CSR and Committee, Sustainability relationships stakeholder and of climate and ESG providing oversight manages shareholder Functional Working Groups strategic risks and alignment their . scrutiny and independent of related grievance and investor redressal . Facilities Human Risk Procurement Independent activities. Led Director, by an Management Resources Management Sustainable and Environmental Social aspects, Risk diverse supply it receives updates from periodical the compliance, DEI policy, identification & chains, supplier water, training & Enterprise Risk screening Sustainability Team. energy, RE & digital skilling Management and compliance. EV transition. programs. System mitigation . Ensures . Responsibility Matrix All key organizational stakeholders have vested responsibilities related to planning, execution, evangelization, review, and advocacy of the sustainability agenda of the Company. The roles and responsibilities are represented below: Roles and Responsibilities of our Stakeholders Stakeholder Planning & Review Execution Internal Evangelizing External Advocacy Board of Directors Executive Board Business Leadership Facilities Management Group Infrastructure Creation Group Ecoeye – Sustainability Office Employee Chapters Human Resources Finance Corporate Affairs, Brand & Communication Risk Office Legal and Compliance


LOGO
70 VALUE CREATION FOR STAKEHOLDERS We have always strived to enhance shareholder value for our investors through regular, stable and consistent distribution of returns. Effective from FY26, the capital allocation policy was revised, under which the Company expects to return 70% or more of the net income cumulatively over a three-year period through a combination of dividends, special dividends and/ or share buybacks, subject to applicable laws, and requisite approvals, if any. Key Linkages Strategy Capitals UN SDGs Enhancing shareholder value through stable and Financial consistent returns. H Human Risks Intellectual • Compliance Social & Relationship • Performance Natural Shareholder Returns Cash Dividends: The cash dividend paid a buyback proposal, subject to the for the year ended March 31, 2025, was approval of our shareholders through  6 per equity share. The cash dividend postal ballot, for purchase by the Returns paid during the year ended March 31, Company of up to 600,000,000 equity 2026, was an interim dividend of  11 per shares of  2 ($0.02) each (being 5.7% equity share. The Board recommended of total paid-up equity share capital)—26 the adoption of the interim dividend of from the shareholders of the Company 2025  11 per equity share as the final dividend on a proportionate basis by way of a for the year ended March 31, 2026. tender offer at a price of  250 ($2.71) per equity share, for an aggregate REPORT Issue of Bonus Equity Shares: Issue of amount not exceeding  150,000 million bonus shares in FY25 to shareholders ($1,599 million), in accordance with ANNUAL (including stock dividend to ADS holders) the provisions contained in the SEBI in the ratio of 1:1 (1 equity share for (Buy-back of Securities) Regulations, every 1 equity share held). 2018 and the Companies Act, 2013 INTEGRATED Buyback of Equity Shares: In the and rules made thereunder. Transaction recently concluded Board meeting on costs due on the buyback of equity WIPRO Investor April 16, 2026, the Board approved shares will be paid separately.


LOGO

71 Key Ratios Particulars FY26 FY25 FY24 YoY Change Favorable/Adverse Revenue (in  million) 928,093 890,916 897,943 4.2% IT Services Operating Margin 17.2% 17.1% 16.1% 0.2% Net Income Margin 14.2% 14.7% 12.3% -0.5% Earnings Per Share (in  ) 12.60 12.56 10.44 0.3% Price Earnings Ratio (times)1 14.89 20.88 22.98 -28.7% Return on Net Worth2 15.4% 16.7% 14.5% -1.3% Current Ratio (times)3 2.05 2.72 2.58 -24.6% Debtors Turnover (times)4 6.81 7.55 7.51 -9.7% Free Cash Flow as % of Net Income5 101.4% 118.4% 152.7% -17.0% Debt-equity (times) 0.19 0.19 0.19 -3.0% Interest Coverage Ratio (times) 0.38 10.24 10.84 1.3% Adverse Favorable Note: Key Ratios are calculated as per Consolidated Financial Statements under IFRS. Reasons for Significant Changes 3. Debtors Turnover Ratio is computed as turnover divided 1. Price-Earnings Ratio is computed as the market share price by trade receivables. Trade receivables went up by 15.4%, as on 31 March of the respective years divided by Earnings whereas turnover increased by 4%, resulting in a reduction in Per Share (EPS). The share price decreased by 28.5%, the debtors turnover ratio. resulting in a decrease in the Price-Earnings ratio. 4. Return on Net Worth % is computed as Net Income divided 2. Current Ratio is computed as current assets divided by by Average Net Worth. It declined as Net Income increased current liabilities. Current liabilities have risen on account of by 0.4%, while Net Worth rose 6.9%. the upcoming maturity of $750 million in unsecured notes 5. Free Cash Flow as % of net income is computed as operating issued by Wipro IT Services LLC. These notes, mature on cash flow adjusted for cash inflows/outflows on account June 23, 2026, and have therefore been reclassified from of proceeds from the sale/purchase of property, plant and long-term to short-term borrowings in the current period. equipment. The reduction in the free cash flow to Net Income ratio is due to an increase in trade and unbilled receivables. Financial Performance IT Services Revenue ($ mn) IT Services Operating Margin1 (%) Large Deal Bookings2 ($ mn) FY26 10,478 FY26 17.2 FY26 7,829 FY25 10,512 FY25 17.1 FY25 5,368 FY24 10,805 FY24 16.1 FY24 4,573 Number of $100 mn+ Customers Net Utilization (Excluding Trainees) (%) Voluntary Attrition (excluding DOP) (%) FY26 16 FY26 84.5 FY26 13.8 FY25 17 FY25 85.6 FY25 15.0 FY24 22 FY24 84.8 FY24 14.2 Operating Cash Flow to Net Income3 (%) Earnings Per Share (H) Payout Ratio4 (%) FY26 112.6 FY26 12.6 FY26 87.8 FY25 128.2 FY25 12.6 FY25 61.5 FY24 158.6 FY24 10.4 FY24 54.5 1 2 Large IT Services Deal Bookings Operating constitute Margin refers deals to greater the segment than or results equal total to $30 as million reflected in total in IFRS contract financials value . terms. 3 4 Payout Operating Ratio Cash has Flow been to computed Net Income by is dividing computed the payout as operating (comprising cash flow interim divided and by final Net dividend Income declared . for the respective financial year and buyback, if any, considered based on the date of the Board’s approval) to shareholders divided by Net Income on a trailing three-year basis.


LOGO

72 VALUE CREATION FOR STAKEHOLDERS We operate in a time when economic progress and environmental stewardship must reinforce each other. For decades, we have embedded environmental responsibility in our values and extend it across our operations. For more Sustainability than two decades, our commitment to sustainability has moved beyond policy frameworks and standard operating procedures into tangible action and measurable progress, aligned with broader societal and community needs. Key Linkages - 26 Strategy Capitals UN SDGs 2025 Commitment to climate action and a boundary-less Financial approach to addressing H Human REPORT environmental issues. Intellectual Risks ANNUAL Social and Relationship • Physical risks from climate Natural change (drought, flooding, urban heat) Manufactured INTEGRATED • Unethical practices by Wipro’s social sector partners WIPRO Environmental


LOGO

73 We have been early adopters of formal environmental innovation, we are making an effort to reduce our targets, backed by dedicated investments and resourcing. environmental footprint on this planet. While the numbers Our climate commitments are aligned with the Science we report on energy, emissions, water, and waste reflect Based Targets initiative (SBTi), grounded in the latest measurable progress, they represent only part of a larger climate science and the Paris 2050 Net Zero targets. These journey; it’s about understanding our integral role in the targets aim to limit global warming to well below 2°C above larger world we all share. pre-industrial levels, while pursuing efforts to restrict it to Our environmental strategy is built upon five key pillars: 1.5°C. This approach is operationalized through science-based targets that are periodically strengthened in line with • Optimizing energy usage evolving national and global climate ambition, including • Minimizing GHG and air emissions countries’ Nationally Determined Contributions (NDCs). In FY26, we further intensified our efforts to reduce our • Water conservation and recycling • Waste reduction and circularity carbon footprint, improve resource efficiency, and deepen environmental stewardship across the organization. Through • Biodiversity preservation strategic investments in renewable energy, advanced water and waste management systems, and collaborative Energy Water Powering the Digital Future, Responsibly From Conservation to Restoration As an IT Services company, ensuring responsible energy use In a water-stressed world, our responsibility extends beyond across the facilities that support our digital transformation our campuses into the communities we operate in. We treat work we do for clients is a foremost priority. Our energy water as a shared community resource, driving efficiency strategy focuses on improving efficiency while steadily through extensive reuse supported by smart metering and transitioning toward renewable sources. Through platforms rigorous measurement. We continue to upgrade our water such as our Global Energy Command Centre (GECC), and wastewater infrastructure, while also augmenting our we leverage data analytics to monitor and optimize supply through rainwater harvesting and the procurement consumption in real time. We continue to invest in renewable of treated municipal water to reduce our dependency energy through multiple routes, including group captive on freshwater. arrangements, to strengthen our renewable energy footprint. GHG Emissions Waste Decarbonizing our Digital Footprint Designing for Circularity We remain committed to achieving Net Zero across our GHG Our integrated approach to waste management is rooted emissions by 2040. Having made significant progress on our in circularity, with a focus on reducing waste at source Scope 1 and Scope 2 targets, our focus extends beyond our and enabling reuse and recycling through structured own operational boundaries. We recognize that our most systems and a network of responsible partners. We have significant impact lies in our value chain, and our strategy also implemented targeted solutions for challenging focuses on collaborative partnerships with our suppliers waste streams, including partnerships such as PadCare backed by data intelligence to drive decarbonization to upcycle menstrual waste, the Billion Carbon initiative across the supplier ecosystem. Our flagship program, at our Pune campus for organic waste management, Wipro Initiative for Supplier Engagement (WISE), seeks to and collaborating with a third-party vendor for recycling drive supply chain decarbonization by building supplier C&D waste. We explore options to enhance our waste capabilities and embedding sustainability awareness across management and recycling initiatives to further reduce our the value chain, while reimagining sustainable travel policies downstream footprint. for our global workforce and championing the transition to electric mobility.


LOGO

74 VALUE CREATION FOR STAKEHOLDERS The Sustainability Dashboard Renewable Energy (%) Energy Performance Index (Energy Intensity by Area) FY26 94 FY26 80.6 FY25 84 FY25 88.3 FY24 76 FY24 84 FY23 60 FY23* 181 *EPI for FY23 considered 50% effective area coverage. Scope 1 & 2 Emissions Scope 3 Emissions 68,760 38,928 271,793 31,462 188,224 15,724 172,188 170,928 6.1 24.4 17.9 16.3 3.6 15.9 2.9 1.5 FY23 FY24 FY25 FY26 FY23 FY24 FY25 FY26 Emission (Tons of CO2e) Emission (Tons of CO2e) Emission Intensity by Revenue (Tons of CO2e/mn $) Emission Intensity by Revenue (Tons of CO2e/mn $) Water Waste Recycled (Excluding C&D) 37% 5,726 35% 3,673 4,653 31% 34% 2,939 98% 97% 94% 149 85% 119 75 62 FY23 FY24 FY25 FY26 FY23 FY24 FY25 FY26 Percentage of Reused Water in the Total Water Consumed Total Waste Generated (metric tons) Water Intensity by Occupancy (Lit/pax/day) Waste Recycled - 26 2025 Other Relevant Metrics Total Floor Area (FAR) in m2 2,419,797 REPORT Total Revenue in $ 10,478 Seat Count* 124,504 ANNUAL Occupancy 54,963 *India operational controlled sites. INTEGRATED Our commitment to environmental stewardship is guided by a comprehensive Environment Policy and robust Environmental Management System, aligned with ISO 14001 standards. On a global scale, 89% of the sites (17 out of 19 sites) under Wipro’s operational control have received ISO 14001 and ISO 45001 certification. Further details on our ISO certifications are available under ISO Certificates. WIPRO For more details on our environmental metrics, refer to ESG Dashboard FY26.


LOGO

75 Energy Management They are also designed with features such as an integrated Underfloor Air Distribution (UFAD) system, terracotta Our energy management is guided by a comprehensive façades, and upgraded Chiller and Air Handling Units Energy Policy that is reviewed and updated annually, clearly (AHUs). The current EPI is 65 units/sqm. defining its scope, approach, expected outcomes, and intended impacts. Operational energy demand primarily We also conduct internal audits and assessments at arises from air conditioning, lighting, and allied electrical regular intervals to uphold best practices in environmental systems. Energy efficiency and conservation are central to management and health and safety across all our campuses. our strategy. At the core of our operational efficiency is the Global Energy Command Centre (GECC). This platform enables Efficiency is driven by architectural design and the adoption monitoring of energy use across 17.33 million sq ft of our of energy-efficient equipment and technologies, while Indian campuses. conservation is enabled through operational practices such as conditioning only occupied areas of our buildings. By using IoT and data analytics, we achieved cumulative We continuously work to reduce energy intensity across annual savings of 5.2 million units of electricity and both our physical and digital infrastructure. H41.8 million, supporting continuous system optimization. The platform integrates Building Management System (BMS) inputs to strengthen operational control and improve energy  Targets and Performance efficiency. Any deviations are tracked and addressed through in-house or OEM support, and key Annual Maintenance Target Contracts (AMCs) are linked to energy efficiency and system availability outcomes. 100% RE by 2030 Key Metrics Performance Our Current Energy Mix: Total energy consumption under 94% our operational control amounted to 195 million kWh, as Of our electricity comes from renewable sources compared to 209.4 million kWh in the previous year, of which 174 million kWh is renewable energy. Program Highlights Our Current Energy Mix (mn kWh) Our approach is rooted in internationally recognized standards and intelligent technology. Our Environmental Management System (EMS) is guided by the ISO 14001 standard, a commitment extended to ISO 50001 certification for energy management across 35% of our operational office space. We ensure that all new campuses achieve IGBC 174 Renewable Energy certification, while older campuses are retrofitted to improve 11 Grid Power efficiency. As early adopters of Green Building Design, 31 of 10 Backup Power (DG) our buildings are IGBC certified. Our newest facilities in Bengaluru and Hyderabad are designed to achieve an Energy Performance Index (EPI) of below 80 units/sqm per annum. These campuses incorporate energy-efficient systems such as rotary UPS systems, which eliminate the environmental impact associated with Total Power traditional battery manufacturing and disposal. 195 mn kWh


LOGO

76 VALUE CREATION FOR STAKEHOLDERS Energy Transition: Our energy transition journey started in 2018. Currently, 94% of our purchased electricity is sourced from renewable sources. Our CAPEX investment into Group Captive has been primarily responsible for advancing our share of renewable energy, supported by open access Power Purchase Agreements (PPAs) as well as Virtual PPAs. Energy Intensity: We track energy intensity based on revenue, floor area and occupancy. Floor area is the most relevant metric for energy intensity calculations as it provides a consistent and comparable basis for normalizing energy use and as it directly reflects the scale of built space consuming energy. Energy Intensity by FY26 FY25 FY24 FY23  Targets and Performance FAR—Area (kWh/sqm) 80.6 88.3 84 181 Revenue (MWh/mn $) 18.6 19.9 18.8 16.9 Occupancy (kWh/pax/day) 9.8 12.1 23.5 26.7 Target Net Zero to be Achieved on Scope 1, Scope 2 and Scope 3 by 2040 Performance 70% Reduction from the set in baseline total emissions across all Scopes targeted (Scope 1 and 2: 2017 baseline; Scope 3: 2020 baseline) Target 59% reduction to be achieved in Scope 1 and Scope 2 Emissions by 2030 from 2017 baseline Performance 92% 26—Reduction of Scope 1 and Scope 2 from 2017 baseline 2025 GHG Emissions Management REPORT Target Our approach is guided by our Net Zero roadmap, established as one of the first seven companies 55% reduction to be achieved in Scope 3 Emissions ANNUAL worldwide with targets approved by the Science-Based by 2030 from 2020 baseline Targets initiative (SBTi). We utilize the GHG Protocol Performance methodology to calculate and monitor our emissions. With improved methods for measuring the Scope 3 65% INTEGRATED baseline, we are also establishing robust processes to Reduction of Scope 3 from 2020 baseline WIPRO mitigate these value chain emissions. Note: SBTi approved top 3 categories


LOGO

77 Program Highlights In FY26, our focused efforts on decarbonization led to significant progress. Our primary reliance on renewable energy and energy efficiency upgrades has yielded measurable results. Scope 1 and 2 – Direct Operations and Purchased Energy Emissions (tons CO2e) FY26 FY25 SCOPE 1 Fuel 2,453 2,882 Refrigerant 5,196 5,164 Total 7,649 8,046 SCOPE 2 Electricity 8,075 23,416 Employee Commute Scope 3 – Value Chain Emissions GHG emissions pertaining to employee commute are the largest contributor to our Scope 3, especially driven by the Category FY26 FY25 fact of a visible increase in return-to-office numbers. We are building systems and processes to encourage and enable Purchased Goods and Services 29,770 32,866 Capital Goods 9,954 —* employees to switch to low-emission options for commuting. Upstream Fuel and Energy 2,911 16,349 One initiative to encourage the shift toward public Waste Emissions 31 58** transportation is to work with the Bangalore Metropolitan Business Travel 29,420 30,315 Transport Corporation (BMTC) and provide dedicated space Employee Commute 66,253 72,858 for BMTC buses to operate from our Kodathi office as a Work from Home Emissions 11,027 12,310** starting point, enabling better access. Upstream Leased Assets 20,034 20,183 Downstream Leased Assets 1,528 3,285** For private vehicles, electric mobility is gaining ground. Total Emissions (tons CO e) 170,928 188,224 Our efforts toward the EV transition follow a two- 2 pronged approach: *In FY25, Category 1 & 2 data were not bifurcated, and the entire emissions were combined and included in Category 1. Fleet Electrification: As a member of the EV100 initiative, **FY25 figures have been restated for accuracy. we are electrifying our leased vehicle fleet used to ferry employees in 24/7 DOP services. We are committed to GHG Emissions Intensity transitioning our entire global fleet to EVs by 2035 (the deadline has moved due to market challenges across Our systematic efforts to increase the share of renewable geographies). Our Kochi campus has already achieved energy in our overall energy mix have resulted in a significant 100% EV deployment. We are exploring investments YoY decline in emission intensity across various metrics, in charging infrastructure and incentives to promote including occupancy, floor area and revenue. Emission sustainable transport. intensities have been depicted in the Sustainability dashboard above. Collaborative Mobility: As we encourage employees to transition to EVs, we are simultaneously evaluating our EV For more details related to Environment-related KPIs, please infrastructure for increased adoption. One of our recent refer to Wipro’s ESG Dashboard. awareness campaigns is in collaboration with the Bangalore Municipality, called the “Hejje-Gala Campaign”, which is a city-wide active mobility challenge that encourages Scope 3—Policies and Plans in Action corporate organizations to promote walking and cycling as Scope 3 emissions represent 92% of our total GHG footprint. primary commute modes. Through app-based tracking and We are continuously refining our measurement processes measuring walking and cycling distances, the campaign aims and implementing tailored strategies for our four most to create awareness of climate change and encourage users significant emission categories. to adopt alternate modes of transport.


LOGO

78 VALUE CREATION FOR STAKEHOLDERS Purchased Goods & Services Water As our second largest source of Scope 3 emissions, our supply chain presents a significant opportunity for Water Management improving impacts. Our suppliers are diverse, ranging Our water management program is guided by our from large multinational corporations to MSME-certified Water Policy, reflecting our commitment to the businesses across hardware, software, services, and responsible use of water resources. Our strategy is logistics sectors. built on three pillars—Reduce, Reuse, and Recharge. We adopt a segmented, TPRM (Third Party Risk We have implemented robust systems across our Management)-aligned supplier engagement approach campuses to minimize freshwater intake, maximize based on supplier criticality, spend, and emissions water recycling and reuse, and replenish groundwater footprint to drive targeted risk management and through rainwater harvesting with a target to achieve decarbonization outcomes. Our commitment to and maintain Net Zero liquid discharge. Complementing sustainable procurement is reflected in our recognition this is our programmatic commitment to deepening our with the EPEAT award for seven consecutive years and understanding of the systemic challenges of urban water our achievement of a 5-star rating for the third time. management in major Indian cities where we operate, Additionally, our Wipro Initiative for Supplier Engagement and supporting actionable projects in this area. (WISE) program helps measure and set targets for For more information, refer to the Advocacy section on page 83. emissions reduction.  Targets and Performance For details, refer to the Supplier Synergy section on page 98. Target To reduce the absolute consumption of freshwater Business Travel YoY by 3% in all operationally controlled facilities. Business travel constitutes the third-largest category of our Scope 3 emissions, accounting for approximately Performance 17%. We have developed data and evidence-led granular 4.6% insights into our travel patterns, enabling us to take Reduction in freshwater consumption targeted actions. Creating employee awareness is an integral pillar of our policy, ensuring that our teams understand the impact of their choices. We have also Target baselined emissions across our top 25 delivery accounts • To continue to treat 100% of wastewater generated and are committed to driving year-on-year reductions, as per safe standards working closely with these accounts to champion • To increase the utilization of treated water to voluntary low-carbon travel choices. constitute 45% of total water-use by 2030 - 26 Upstream Fuel & Energy Performance 2025 These emissions arise from the extraction, production, • We treat all our water as per standards and transportation of the fuels and energy we purchase • 34% of our total water use comes from REPORT and are a direct result of our energy consumption. Our reused treated wastewater most effective strategy to minimize these upstream emissions is to reduce the demand at the source. By ANNUAL Target accelerating our transition to renewable energy for our direct operations (Scope 2), we create a positive Zero discharge of untreated wastewater ripple effect, cutting emissions all the way up the value Performance INTEGRATED chain, and have successfully achieved a 96% reduction from baseline. Maintained ZLD in all our facilities, except one due WIPRO to STP renovation


LOGO

79 Program Highlights Key Metrics We recognize water as a finite and critical shared resource, Water Withdrawal and Discharge drawn from local groundwater aquifers, municipal supplies, and private tankers. Our comprehensive water stewardship Total Water Withdrawn (kL) program is designed to manage consumption responsibly Groundwater 13,519 while also addressing the risks of water scarcity driven by Other Sources 1,247,704 climate uncertainty and increasing operational needs. This (municipality, third-party purchase and rainwater) strategy is integral to our vision of creating shared value, Total Water Discharge* 37,452 enhancing natural capital, strengthening our operational Total Water Consumed 1,223,771 resilience (Manufactured Capital), and promoting human well-being. *Water is discharged from two locations. Due to STP renovation in one of the campus (SJP-2), untreated water was discharged which was sent to local We use a centralized digital system to track water data from municipality for treatment. source to consumption across key areas such as cafeterias, HVAC cooling systems, sanitation, and landscaping. This Our commitment to water stewardship is a continuous is complemented by quarterly internal audits to assess journey. Our forward-looking plan includes: our water-related impacts and ensure the effectiveness of Efficient Sewage Treatment: We maintain the highest our strategies. We have also enhanced metering across operational standards across our treatment plants. At the all campuses to enable more granular data collection. All SJP2 campus, two STPs with capacities of 250 kLD and consumption and discharge points are metered, and new 195 kLD were previously operational. However, one aging facilities are equipped with digital metering systems. In plant was identified as less efficient last year. As a result, addition, we conduct water audits across multiple facilities to we decided to commission a single upgraded STP with a strengthen and improve our water management initiatives. capacity of 515 kLD. The installation is currently in progress With increasing occupancy and climate uncertainties and is expected to significantly improve both the volume impacting monsoons, we are consistently working to prevent and quality of our treated water. and mitigate water scarcity at our campuses and to reduce Promoting Treated Water Usage: In addition to reusing our water footprint. Through partnerships with various the wastewater treated at our campus, we have partnered organizations, we are procuring treated water for use in our with organizations such as the Bengaluru Water Supply and facilities. Along with rainwater harvesting, this is expected to Sewerage Board (BWSSB) to purchase 27,430 kL of treated reduce our freshwater consumption. water. This has helped supplement freshwater consumption and reduce our dependence on freshwater sources.


LOGO

80 VALUE CREATION FOR STAKEHOLDERS Integrating Rainwater Harvesting: All our campuses Waste Management are equipped with rainwater harvesting systems that The effectiveness of our program begins at the source. store treated rainwater for reuse in facilities or support We have implemented a detailed segregation process groundwater recharge through recharge wells. At our across all our facilities, where waste is classified Chennai campus, the system contributes around into eight broad categories and 44 sub-categories. 2% of our total water consumption. During FY26, we This ensures that each waste stream is directed to the commissioned a 17,000 kL rainwater harvesting pond most appropriate and highest-value processing method, at Kodathi, which captures rainwater from 24 acres of including recycling, composting, or repurposing. open and landscaped areas. With sufficient rainfall, the Waste generated from our facilities is tracked and on-site pond is expected to contribute up to 40% of the monitored through a centralized digital platform. campus’s total water requirement. We plan to replicate We also conduct quarterly internal audits, inspections, this model across other campuses, starting with and consultations to document and review the Gopanpally, Hyderabad. entire waste journey. Water Intensity: We track water intensity based In addition, we ensure that all partners in our value on Floor-Area and Revenue; however, we believe chain adhere to our quality and sustainability standards. Occupancy is the most relevant metric. Since Our vendor selection process is robust and includes consumption in our facilities is primarily driven by the assessment of compliance history, certifications, number of people present, occupancy provides the and demonstrated commitment to sustainable most accurate benchmark for our conservation efforts. waste management. Water Intensity Based on: FY26 FY25 FY24 FY23 Occupancy (Lts/pax/day) 62 75 119 149 Revenue (kL/mn $) 117 124 96 79 Seat Count (Lts/pax/day) 33 33 24 20 - 26 2025 REPORT ANNUAL Waste Our integrated waste management strategy is built on INTEGRATED closed-loop circular systems that ensure accountability and continuous improvement across all stages, from generation to final disposal. Our goal is to minimize WIPRO waste generation and maximize resource recovery.


LOGO

81 vendors. Prior to recycling, all assets undergo a mandatory Targets and Performance data sanitization and destruction process to ensure information security. Target To compost 100% organic waste generating from Hazardous Waste business operation Managed in strict compliance with the Hazardous Waste Management Rules 2016, this waste is treated and disposed Performance of safely through specialized, authorized vendors. 100% Of organic waste was composted Inorganic, Packaging & Plastic Waste Generated mainly from procurement and maintenance activities (including paper, cardboard, and waste bins), Target this waste is carefully segregated and sent to appropriate To recycle 98% of its waste (Excluding C&D) recycling partners for repurposing. Performance Other Waste 98% This category, largely consisting of construction and Of waste was recycled through suitable treatment methods demolition debris and other wet and dry scrap, has been significantly reduced YoY through conscious project planning and execution. At our Chennai site (CDC-5), we are working Target with a network of vendors to divert C&D waste from landfills To dispose of less than 2% of waste (Excluding C&D) and repurpose it for secondary applications such as road to landfills by 2030 sub-base, backfilling, etc. Performance Biomedical Waste 0.22% Although minimal due to the nature of our operations, any Of waste going to landfill biomedical waste is segregated at source in color-coded bags and disposed of in compliance with healthcare Program Highlights regulations through authorized vendor. We actively discourage the use of single-use plastics across Key Metrics our campuses, promote digital-first operations to reduce (in tons) paper consumption, and adopt energy-efficient technologies Waste Category Waste Generated to minimize waste from obsolete equipment. All our waste management practices comply with the Solid Waste E-waste 360 Management Rules and CPCB guidelines, ensuring full Biomedical Waste 3 regulatory compliance and environmental responsibility. Hazardous Waste 136 Organic Waste Organic Waste 3,054 Generated primarily from cafeterias and garden waste, this Inorganic Waste 224 is our largest waste stream and is responsibly managed through both on-site and off-site composting. Packaging Waste 300 Plastic Waste 95 E-waste Other Waste 3,760 Being critical to our IT operations, all e-waste is securely managed and recycled through specialized, authorized Total 7,932


LOGO

82 VALUE CREATION FOR STAKEHOLDERS Waste Disposal Methods* Method of Disposal Amount (in tons) % Ecological stewardship is embedded in campus design and management. Key interventions include native Incineration 89 1.61 and endemic plantations, creation of wetlands and Landfill 12 0.22 rainwater harvesting systems, and vermicomposting and waste-to-manure processes. We continue to strengthen Recycle 5,443 98.08 campus ecosystems to enhance local ecological Other Methods for 5 0.09 functions and support species diversity. Recovery Across our campuses in India, we have developed *Excluding C&D campus-level biodiversity zones tailored to local ecological contexts, including butterfly and wetland parks in Bengaluru, multispecies biodiversity parks in Pune, and large-scale restoration at Gopanpally, Hyderabad. Our campus Bioblitz initiative, launched in 2024, has enabled employee-led biodiversity documentation programs across six campuses. To date, 216 employees and their family members have recorded over 1,170 observations across 400+ species using the iNaturalist platform. At Gopanpally, nearly 1,500 native and endemic saplings planted on previously degraded land are already contributing to the restoration of urban biodiversity and supporting a growing diversity of urban wildlife, demonstrating the long-term impact of place-based ecological restoration. Biodiversity Natural Capital Valuation At Wipro, we recognize biodiversity as integral to For over a decade now, Wipro has used Natural Capital ecological stability, climate resilience, and long-term Valuation (NCV) to assess the positive and negative human well-being. With a significant presence in urban impacts of its operations and value chain on natural environments, we acknowledge that our operations capital by assigning a monetary value to environmental both depend on and influence natural systems. externalities. The assessment covers six key Our approach to campus biodiversity, therefore, goes environmental KPIs and is based on location-specific beyond aesthetic and reflects a commitment to protect, social cost factors. 26 restore, and coexist with local ecosystems. - NCV insights help identify environmental risks and 2025 Our urban biodiversity program is guided by two hotspots, support informed decision-making, integrate primary objectives: environmental considerations into strategy, and REPORT strengthen nature- and climate-related disclosures. • transforming our campuses into resilient biodiversity ANNUAL zones, and • using these living systems as platforms for learning, For more information, please refer to page 56. awareness, and advocacy. INTEGRATED These efforts contribute to groundwater conservation, microclimate regulation, pollution mitigation, and deeper WIPRO employee engagement with nature.


LOGO

83 Advocacy As a long-standing member of the GRI South Asia • In the Gurugram and Vasai-Virar regions, community-Advisory Group, Wipro actively participates in key advisory led water conservation initiatives supported the revival consultations. Wipro also holds a leadership position at and mapping of traditional open wells and Bavkhal the CII-Green Business Centre (CII-GBC Greenco) forum, systems across villages. These efforts engaged over chairing the Bangalore chapter. Additionally, we engage 10,000 people in freshwater conservation efforts and with the Indian Business and Biodiversity Initiative (IBBI), strengthened local groundwater stewardship. World Economic Forum (WEF), and Business for Nature (BfN), • In FY26, solid waste management audits in Bengaluru contributing to collective action and policy dialogues that communities strengthened community-led waste advance responsible and sustainable business practices. governance through improved waste segregation, collection, and resource recovery practices, advancing Wipro’s Boundary-less Approach to a more decentralized waste management systems. Sustainable Society • Our climate resilience initiatives in informal settlements Our efforts focus on delivering meaningful environmental improved living conditions for underserved communities and social impact across our operations and communities. by reducing indoor heat stress. A parallel youth engagement program built a network of community • We work in vulnerable communities and municipal climate champions driving local environmental action. corporations across Bengaluru, Pune, Hyderabad, In Kochi, these initiatives also strengthened women-led Delhi-NCR and Mumbai on water body restoration participation in climate action, enabling women to play a (lakes, ponds, open wells), groundwater conservation, central role in building climate-resilient communities. shallow aquifer management, wastewater management, improved sanitation access, and climate adaptation to While we disclose most of the relevant ESG metrics in this water-related hazards such as flooding. Annual Report, readers may refer to our Sustainability Report for more detailed disclosures across Environmental, Social, • In FY26, we supported the construction of an and Governance parameters. interception and diversion structure at Shikaripalya Lake, which has fully stopped sewage inflow and increased Link: Sustainability Report stormwater flow into the lake.


LOGO

84 VALUE CREATION FOR STAKEHOLDERS At Wipro, we believe it is critical to engage with the social and ecological challenges facing humanity through deep, meaningful, and long-term efforts. Guided by the ‘Spirit of Wipro’, our social programs are rooted in unyielding integrity, treating people everywhere fairly and with respect at the workplace and in communities outside, and reflecting ecological sensitivity in thought and action. Through Wipro Foundation and our broader CSR initiatives, we work across education, healthcare, ecology, disaster response, and public Initiatives spaces to strengthen institutions, support communities, and enable more inclusive societies. We collaborate with Civil Society Organizations, public institutions, and local communities, recognizing that lasting change is built through partnership, participation, and continuous engagement. Key Linkages - 26 Strategy Capitals UN SDGs 2025 To engage with critical issues in education, primary healthcare, and Financial urban ecology through a sustained, H Human REPORT programmatic focus on vulnerable urban communities while Intellectual contributing to more inclusive, Social & Relationship ANNUAL equitable cities and public spaces. Natural Risks • Ineffective utilization of CSR INTEGRATED funds by Wipro’s partners • Unethical practices by WIPRO Community Wipro’s social sector partners


LOGO

85 Our Reach across Diverse Contexts and Pathways ~5.95 mn People reached cumulatively since FY21 ~188 Partner organizations supported in FY26 26 States and 4 UTs Geographic footprint Where we Work Our social and community initiatives are, by design, predominantly urban-centric and operate in the cities of our operations. This work takes place through locally rooted Civil Society Organization (CSO) partners, enabling contextual responses while also contributing to national-level outcomes. Employee participation through Wipro Cares is enabled through 26 location chapters, supporting 160+ community projects across multiple countries. Outside India, we support STEM programs in the US and the UK. What we Support We pursue our community initiatives across multiple domains, with a focus on strengthening institutions, enabling access and inclusion, and supporting long-term social and ecological well-being through sustained engagements and partnerships. Our Focus Areas - Education and Digital Skilling—Ecology—Healthcare - Employee Participation—Disaster Response—Cities and Public Spaces


LOGO

86 VALUE CREATION FOR STAKEHOLDERS Education Wipro’s education work focuses on helping children access quality education, supporting teachers, and strengthening government schools so they work better over time. Our education work is spread across 26 states and four (4) UTs. Positive Outcomes for Children FY26 Goal 2.9 (in mn) FY27 Goal—3.1 FY26 Reach 2.8 Positive Outcomes for Children with FY26 Goal 150,000 Disabilities (CwD) FY26 Reach 148,467 FY27 Goal—170,000 Digital Skilling Our digital skilling initiatives focus on employability, faculty capability, and institutional readiness for future skills. Faculty development initiatives have reached 4,635 educators across engineering and science colleges in India. Students Baseline: FY17 Covered by Digital Skilling FY26 Goal 341,114 FY27 Goal—437,058 FY26 Reach 367,058 - 26 Employee Participation 2025 Employee engagement through volunteering and giving is enabled through Wipro Cares, providing employees a meaningful pathway to participate in Wipro Foundation’s CSR initiatives. All monetary REPORT contributions made by employees are matched by Wipro 1:1. ANNUAL No. of Volunteers FY26 Goal 25,000 FY27 Goal—32,000 INTEGRATED FY26 Reach 31,000+ WIPRO


LOGO

87 Healthcare Wipro Foundation’s healthcare programs focus on strengthening primary healthcare systems to improve access, continuity, and quality of care for vulnerable communities. The programs span primary healthcare, maternal and child health, disability support, and preventive care, working closely with local health systems to reinforce access, continuity, and quality of care. Anchored through 21 partner organizations across 22 projects spanning multiple states, improving children’s health outcomes remains a key focus area of this work. Healthcare for Women in the Reproductive Age (in mn) FY26 Goal 1 FY26 Reach 1 FY27 Goal—1.2 Healthcare for Children and (in mn) Nutrition Support FY26 Goal 1.7 FY26 Reach 1.7 FY27 Goal—2.15 Healthcare for Children with Disabilities FY26 Goal 7,500 FY27 Goal—10,100 FY26 Reach 7,600 Disaster Response Ecology and Environment Following the Wayanad landslides of 2024, relief and Our programs in this domain strengthen urban ecological recovery efforts reached over 4,255 people through systems, such as aquifers, waste systems, and climate community work, with support delivered through local response, through sustained, locally grounded engagements partners to restore access to essential services and with communities and city-level institutions. Our ecology and livelihoods. As disasters often create prolonged disruptions environment initiatives are implemented across 12 cities. to income, health systems, and education, interventions The work spans urban water and watershed systems, waste continued beyond immediate relief into FY26 to support management, informal sector livelihoods, climate adaptation, longer-term recovery and community stability. biodiversity, and community ecology. Cities and Public Spaces A key pillar of Wipro’s societal initiatives (CSR) is the support for ‘Public Urban Spaces’—public-spirited institutions that provide an inclusive space for art, culture and intellectual conversations rooted in our constitutional values. We believe supporting such institutions is a critical part of contributing to making our cities more vibrant and citizen-centric.


LOGO

88 VALUE CREATION FOR STAKEHOLDERS Strengthening Systems for Long-term Social and Ecological Well-being Wipro Foundation’s work is guided by a systems perspective. This approach recognizes that meaningful social change is cumulative, relational, and anchored in strong institutions. How Change Is Understood We prioritize long-term engagements that work with and strengthen existing systems, rather than creating parallel mechanisms. This includes supporting civil society organizations (CSOs) that collaborate with public institutions; investing in organizational and leadership capacity; enabling learning and adaptation over time; and recognizing that outcomes may emerge unevenly across contexts. The Partner Ecosystem: Breadth and Continuity Wipro Foundation works through a diverse ecosystem of partner organizations spanning grassroots nonprofits, research institutions, public systems, and domain experts. These partners are engaged as collaborators with deep contextual knowledge and long-term presence. Partnerships are typically multi-year, reflecting a shared commitment to learning, adaptation, and continuity. Mode of Implementation Wipro’s CSR work is institutionally led by Wipro Foundation and implemented through multiple 26—channels, including select initiatives by Wipro Limited 2025 and its functions and groups. REPORT Wipro Foundation is the CSR entity of Wipro Limited ANNUAL and the institutional owner of Wipro’s CSR strategy, partnerships, and long-term outcomes. Employee participation in this work is enabled through the Wipro Wipro’s CSR initiatives include the domains of Education, Cares initiative. Ecology, Primary Healthcare, Disaster Response, and Cities and Public Spaces. Learn more about our CSR policy, projects, INTEGRATED and impact assessment here. WIPRO


LOGO

89 Education: Strengthening Systems for Inclusive Learning Wipro Foundation’s work in education is oriented toward strengthening education systems, including schools, educators, curricula, and supporting institutions, so that they can respond to diverse learner needs over time. A significant part of our work in education is with the government school system and is undertaken in collaboration with CSO partners and states’ education systems. Since FY21, education initiatives have worked with approximately 2.89 million children across 26 States and four (4) Union Territories, including 148,467 Children with Disabilities supported through inclusive education pathways. The nature of our work includes: • supporting access to education for underserved communities; The Urban Schools Initiative has contributed to • systemic education reforms and teacher development; improvements in enrollment, with attendance reaching up • sustainability education and advocacy; to 92% in some schools, and stronger teacher engagement. • and fellowships and scholarships that strengthen Importantly, the work has also informed wider government sector capacity. action, with the model being taken up for replication across multiple Bengaluru public schools. Education partnerships in FY26 reflected an ecosystem approach, spanning early-stage organizations to mature Our digital skilling initiatives have engaged over 367,058 institutions. Capacity building remained central to this work, learners from FY17 to FY26. These efforts have also trained reaching 1,700+ participants through courses, mentorship, 4,635 professors and engaged 742 engineering and and peer-learning platforms. science institutions, along with 90 academic leaders. Our capacity-building efforts in this space focus on strengthening Engagement with public systems has continued through employability, faculty capability, and institutional readiness. initiatives such as the Urban Government Schools Initiative, a collaborative effort with the Government of Karnataka and Education for children with disabilities remains a strong the Azim Premji Foundation to develop model government ongoing focus. Our partners work toward strengthening schools. The initiative now spans 21 schools and 181 inclusive pedagogy, assistive approaches, and system anganwadis in Bengaluru, with anganwadi engagements responsiveness, recognizing that equitable education building on learnings from the Urban Schools Initiative. requires deliberate design and sustained engagement. 367,058 4,635 181 Learners engaged through Professors trained through Anganwadis covered under digital skilling initiatives digital skilling initiatives the Urban Government (FY17–FY26) Schools Initiative


LOGO

90 VALUE CREATION FOR STAKEHOLDERS Wipro Earthian: Integrating Sustainability into Education For over 15 years, Wipro earthian has worked at the intersection of education and ecology. The program’s objective is to make sustainability integral to how young people learn and think. In FY26, Wipro earthian anchored sustainability in school education through inquiry-led learning. The program received over 2,000 submissions from schools across the country. Projects reflected locally grounded engagements with water, biodiversity, and waste, combining field-based inquiry with critical reflection. Wipro earthian also expanded into higher education through the ‘Ideas to Impact’ initiative, implemented in collaboration with IIT Madras. It supports college students in developing and validating eco-innovative ideas into viable prototypes, with participation from over 1,300 institutions and 2,700+ entries since inception. Wipro earthian’s cumulative reach now spans over 1,300+ 210,000+ 51,000 schools, 210,000 students, and 41,000 teachers Institutions Students reached across India. participated cumulatively Wipro Education Fellowship Program: Wipro STEM Program, the USA and the UK Ten Years of Investing in People and Their In FY26, the Wipro Science Education Fellowship Capacities (SEF) in the United States continued its work across 35 school districts in seven states, supporting Launched in 2015, the fellowship focuses on building improvements in STEM teaching practices. institutional capability and leadership to enable sustainable, system-level change. Since its inception, Wipro’s STEM program builds long-term partnerships the program has engaged with 156 fellows and with universities and school systems in the US and supported the seeding of 85 early-stage organizations the UK, focusing on professional development, peer across 60 districts in 24 states and three (3) Union learning, and equity. It has supported over 1,500 Territories. The fellowship has supported 11 cohorts, educators and improved learning experiences for - 26 2025 covering 11 thematic areas, including foundational more than 800,000 students. learning, early childhood education, inclusion, teacher REPORT support, and community engagement. Supported ANNUAL 1,500+ educators Presence across 60 districts through Wipro’s STEM program in 24 states and 3 Union Territories INTEGRATED Improved learning experiences for 156 800,000+ students WIPRO Fellows engaged


LOGO

91 Healthcare: Working with Community-anchored Public Health Systems Wipro Foundation’s healthcare work is grounded in the understanding that health outcomes are shaped by the strength of public health systems, community capacity, and trust in frontline services. It approaches healthcare as an interconnected system, addressing prevention, care delivery, and institutional capacity together. This is reflected across contexts. In Mumbai, frontline workers have worked with communities to support the recovery of malnourished children through home visits and follow-ups. In Kolkata, a digital addressing system has helped track over 2,000 pregnant women. And in eastern Nagaland, community engagement has improved the uptake of antenatal care and engagement across nutrition and non-communicable diseases (NCDs). These engagements illustrate how consistent community involvement contributes to more responsive primary healthcare systems. Cumulatively, these efforts have ~1 mn reached around 1 million women in the reproductive Women in the reproductive age group reached (along age group, along with infants, children, and children with with infants, children, and children with disabilities) disabilities, through partnerships with 21 healthcare organizations across multiple states, spanning maternal and child health, nutrition, mental health, NCDs, and frontline 2,000+ workers’ capacity building. Pregnant women supported in Kolkata Wipro Healthcare Partners’ Forum The 5th edition of the Wipro Healthcare Partners’ Forum was held during February 16–18, 2026, at Azim Premji University, Bengaluru. Partner organizations, healthcare practitioners, and public health experts came together to reflect on persistent challenges in primary healthcare and share practice-led insights from diverse field contexts.


LOGO

92 VALUE CREATION FOR STAKEHOLDERS Urban Ecology and Institutional Spaces: Protecting the Commons and Supporting Communities Wipro Foundation’s work on urban ecology and institutional spaces addresses ecological challenges. Our work spans urban water systems and watershed management; solid waste management and livelihoods in the informal waste sector; climate adaptation and community ecology; and biodiversity and regenerative practices such as agroforestry. Through the Urban Waters Initiative, projects such as the Bavkhal revival in Vasai and open-well restoration in Gurugram are deepening our understanding of shallow aquifers while demonstrating on-ground approaches to resource protection. These efforts also inform policy and strengthen At MAP, outreach programs reached 5,000+ students citizen engagement. and enabled participation from marginalized groups and Persons with Disabilities through accessible formats and Across 12 cities, the program supports community-inclusive programming. In parallel, institutions like the Pune led responses to climate challenges. In Kochi, International Centre (PIC) enabled open, evidence-based partners work on community-led climate adaptation, public conversations on national priorities. As part of circular economy, and disaster preparedness. this, an annual lecture series on ‘Science, Technology In Vyasarpadi, Chennai, local youth groups are and Society’ is convened with eminent speakers through restoring hydrological knowledge and strengthening Wipro’s partnership with PIC. The series examines the flood response systems. In Chennai and Mysuru, multidimensional relationship between technology low-cost, climate-responsive cooling solutions are and society. being developed for informal settlements. These efforts illustrate how ecological well-being is built through sustained, locally grounded engagements. Disaster Response: From Relief to Recovery Cities and Public Spaces: Culture as Public Infrastructure Wipro Foundation’s disaster response work extends beyond immediate relief. It supports recovery by working with Public and cultural institutions supported by Wipro communities and focuses on rebuilding livelihoods. It also Foundation, such as MAP (The Museum of Art & strengthens community capabilities and enables people to 26 Photography), BIC (Bangalore International Center), - 2025 and PIC (Pune International Center), continue return to stable, dignified lives. to function as critical civic spaces that enable Following the Wayanad landslides in 2024 in Kerala, this dialogue, inclusion, and democratic engagement. approach shaped efforts across FY26, evolving from relief REPORT Our engagements during the year reflected a ANNUAL strong emphasis on inclusion and access. INTEGRATED 5,000+ students 4,255+ people Reached through MAP’ outreach programs Reached through recovery interventions after WIPRO the Wayanad landslide


LOGO

93 to longer-term recovery. Interventions included support for Employee Participation Overseas small businesses, access to medical care, and continuity in Employee volunteering across the Americas, Europe, and children’s education, reaching over 4,255 people. APMEA (Asia Pacific, Middle East, and Africa) is undertaken Beyond India, employee-led initiatives complement this through locally anchored, employee-led initiatives. The work. In the Philippines, volunteers supported post-disaster program is organized around four thematic priorities: Digital, efforts through sorting, packing, and distributing essential Inclusion, Environment, and Wipro Next Door. In FY26, supplies, strengthening local response capacity and 3,575 employees outside India contributed close to 10,000 enabling timely assistance. volunteering hours across 138 events, reflecting steady growth in participation and geographic reach. Employee Volunteering as a Pathway to Responsible Citizenship Employee participation in CSR initiatives is enabled through Wipro Cares, which functions as the employee engagement pathway within Wipro Foundation’s CSR portfolio. Activities include blood donation, assistive device distribution, 3,575 waste clean-ups, tree planting, and access to solar lighting. Employees outside India participated in Employees also contribute through mentoring and preparing volunteering activities essential kits for women and children, strengthening local community support systems. 138 In FY26, 42,000 employees contributed through Wipro Volunteering events were conducted, contributing Cares, with all donations matched 1:1 by Wipro. to ~10,000 volunteering hours Emerging Learnings from Long-term Engagement Across domains, several common learnings are emerging from Wipro Foundation’s long-term engagement with communities and partners. Systemic Change is Cumulative and Institutional Structural challenges require patient engagement rather than short project cycles. Durable outcomes are closely linked to the strength of local institutions. 600+ Volunteering events across 20+ countries Capacity Building Multiplies Effects and Outcomes Investing in organizational and leadership capacity 60,000+ enables partners to influence systems beyond immediate interventions. People reached Trust Enables Scale 35,000 hours Long-standing relationships allow experimentation, learning, Dedicated to volunteering and adaptation.


LOGO

94 VALUE CREATION FOR STAKEHOLDERS As enterprises accelerate digital transformation in an increasingly complex and technology-driven landscape, the focus is shifting from standalone solutions to integrated, outcome-based transformation. Wipro addresses this shift by delivering end-to-end capabilities that combine strategy, execution, and continuous value realization across client engagements. Leveraging deep domain expertise and a consulting-led, AI-powered operating model, we help clients navigate complexity, improve operational resilience, and drive sustainable Stewardship business outcomes. Key Linkages - 26 2025 Strategy Capitals UN SDGs AI, Cloud, Consulting, Sustainability, REPORT Innovation Ecosystem (WIN), Intellectual Responsible AI H Human ANNUAL Risks Social & Relationship • Technology & Innovation Risk • Talent & Culture Risk • Strategy & Market Risk INTEGRATED • Business Resiliency Risk • ABAC Risk Customer • AI & Data Governance Risk WIPRO


LOGO

95 Our approach is guided by the core principles of innovation, Our Integrated Sustainability Services Practice collaboration, sustainability and customer-centricity, Focuses on Helping Customers Transform Digitally ensuring that value creation remains consistent and aligned with evolving stakeholder expectations. In doing so, we and Sustainably operate across four Strategic Market Units and deliver our Leveraging our sustained leadership and commitment to capabilities through four Global Business Lines spanning being a sustainability leader, we are focused on helping our Consulting, Technology Services, Business Process Services, customers transform digitally and sustainably to become and Engineering. market leaders and global changemakers. A few selected examples of engagements this year include: Consulting Sustainability Strategy and Roadmap Partners with clients to support the imagination, design, and Assess and manage sustainability risks/opportunities, and realization of their future. define governance, strategy, goals/targets, and roadmap (including Impact Health Check, Climate Transition Action Technology Services Planning, Impact Innovation Lab, Impact Management Office). Aims to deliver cutting-edge cloud-enabled and industry- Impact Intelligence specific technology solutions to our clients. Digitize and account for sustainability footprint using Business Process Services industry-standard metrics, and build sustainability data and reporting ecosystems to support regulatory disclosure, Support global organizations in operating, transforming, and transparency, and value realization (including platform continuously improving core enterprise functions. selection, regulatory reporting such as CSRD, impact accounting and management ecosystem, and analytics). Engineering Aims to empower clients to innovate at scale, build Sustainable Technology Digitize systems across the technology stack with differentiated products and platforms, and deliver value considered design/services to reduce footprint and costs, across the full product and platform lifecycle through our including assessment, strategy, roadmap and intelligence, consulting-led and AI-powered engineering approach. Sustainable IT and DevOps, sustainable infrastructure, and asset lifecycle management. Sustainability, Climate Change and Technology Environmental Health & Safety (EH&S) We have significant market recognition in EH&S across the Wipro’s Sustainability Practice provides an end-to-globe and are leading programs at many large multinational end technology and sustainability ecosystem, helping companies with partners such as Enablon, Sphera, SAP, enterprises embed and scale sustainability across their EarthSoft, and Cority. technology and digital transformation. Our work spans strategy and consulting, apps and data, engineering and R&D, infrastructure services, and monitoring and operations, Lifecycle Assessment and PLM integration underpinned by enterprise sustainability. We are working with customers to understand the carbon impact of specific products across their lifecycle. Sustainability has shifted from periodic reporting to always-on performance management, with increasing emphasis on data traceability, auditability, and finance-grade disclosures, Sustainability AI Solutions alongside growing regulatory pressure (e.g., CSRD, Our AI Factory is a comprehensive framework that enables SEC, ISSB, ESRS) and accelerating AI-enabled reporting cost-effective scaling of AI deployment across the full and monitoring. lifecycle, including data ingestion, vectorization, model.


LOGO

96 VALUE CREATION FOR STAKEHOLDERS Responsible Delivery timely acknowledgement of concerns, regular progress We recognize that helping customers reduce their updates, and closure with customer validation. Governance impact on natural and social capital goes beyond is strengthened through adherence to ISO 9001:2015 how we design and deliver services. We support and CMMI standards, supported by periodic audits and customers in lowering their Scope emissions through continuous monitoring. These practices enable consistent solutions such as the Responsible Delivery Impact service quality, reinforce accountability, and drive calculator, which measures the footprint of our continuous improvement in customer experience and services. We have also committed to strengthening relationship management. customer stewardship by 2030 by reducing the Employee Skilling delivery footprint of our top 25 accounts by 50% across Scope 1, Scope 2 and Scope 3 GHG We focus on building future-ready talent with deep domain, emissions. Customer demand for emissions-related consulting, design, and technology expertise, supported by data associated with our services is increasing, with digital learning platforms that enable ‘anytime, anywhere’ RFIs and RFPs increasingly seeking information upskilling and reskilling. In FY26, AI capability building has on our carbon reduction efforts and broader been institutionalized through an AI-first approach, with sustainability plans. 212,663 employees covered through AI-ready workforce initiatives and 93,994 associates completing Master Industry Recognition and Collaboration AI certification, thereby strengthening delivery capabilities Our sustainability consulting practice leadership and client value creation. is recognized globally and comprises renowned Cross-functional collaboration further embeds privacy and analysts and advisors. We actively participate in responsible practices across operations, with dedicated the World Economic Forum in Davos, where Wipro professionals driving integration into business processes. is also a member of the Alliance of CEO Climate Leaders. In the UK, Wipro is a member of the Innovation through Wipro Intelligence™ Government Digital Sustainability Alliance (GDSA), Wipro Intelligence™ is our unified suite of AI-powered where members collaborate to develop ideas and platforms, solutions, and transformative offerings that solutions to navigate digital sustainability challenges. focus on delivering proof over promise, empowering Wipro also actively participates in forums such as enterprises to run, build, and reimagine with AI for Business for Nature, the World Economic Forum, sustained competitive advantage. the Confederation of Indian Industries and other advocacy forums. Participation in these forums Our AI initiatives are supported by Wipro Innovation enhances visibility, expands networks, and increases Network — our global ecosystem of labs, partners, start-ups, exposure to innovative solutions. academia, and deep-tech talent to identify, incubate and Organizational Systems and co-create high-impact, high-priority use cases. For further details on Wipro Intelligence™ offerings, including Processes to Deliver Value Run AI, Build AI and Reimagine AI, please refer to the Customer Centricity Management Discussion and Analysis section on page 40. Wipro’s IT Services segment delivers a broad Responsible Technology Governance 26 portfolio of IT and IT-enabled services supported At Wipro, responsible technology governance is enabled—2025 by a Client Value Framework across metal through a robust framework that integrates data privacy and accounts to drive outcomes beyond contractual AI governance practices across operations in more than 65 commitments. Customer feedback is captured countries. The approach combines centralized oversight REPORT through ACSAT (CXO-level) and PCSAT (mid-level) with cross-functional accountability to support consistent surveys, supported by ongoing GAE engagement, implementation of risk-based controls aligned with evolving with satisfaction tracked through CSAT and NPS. regulatory requirements, while embedding transparency, ANNUAL In FY26, we remained in the top quartile of the security, and human-centric principles across the technology industry for both metrics, reflecting strong delivery lifecycle. Structured use-case risk assessments, continuous and execution. monitoring, and quality assurance mechanisms strengthen INTEGRATED Customer feedback is translated into action oversight, while enterprise-wide capability building, and through a structured Customer Centricity and investments in privacy-enhancing technologies reinforce WIPRO escalation management framework, ensuring compliance, operational resilience, and stakeholder trust.


LOGO

97 Data Privacy collaborates with cross-functional units to ensure that Wipro maintains a comprehensive data privacy and AI all technology solutions and third-party services adhere governance program across more than 65 countries, to stringent security standards, thereby securing our integrating centralized oversight with decentralized intellectual property against evolving cyber threats. accountability to ensure consistent and compliant implementation. The framework is supported by structured Responsible AI policies, governance mechanisms, and enabling tools Wipro has established a comprehensive AI governance that strengthen risk oversight, while alignment with global framework to ensure responsible, ethical, and compliant standards such as ISO/IEC 27701 and ISO/IEC 27018 development and deployment of AI systems. Governance is reinforces its credibility. A systematic, risk-based approach strengthened through a three-line defense model, including guides the identification, assessment, and management of a Responsible AI Taskforce and independent oversight, privacy risks across operations. ensuring accountability and effective risk management We continue to build organizational capability through across the AI lifecycle. training and awareness initiatives, covering over 230,000 The approach emphasizes privacy-preserving technologies, employees annually. Strong internal controls support bias mitigation, and alignment with evolving global secure personal data, complemented by incident regulations, while embedding sustainability considerations management processes for timely response, recovery, into AI deployment. Continuous enhancement of governance and transparent reporting. practices and risk controls enables the delivery of secure, A structured AI governance framework, including risk- reliable, and human-centric AI solutions that support based classification and a three-line defense model, stakeholder trust and long-term value creation. ensures responsible deployment of emerging technologies, Wipro’s Responsible AI framework is further anchored while the integration of Generative AI with privacy in four key dimensions — individual, societal, technical, frameworks enhances adaptive risk management and and environmental — guiding the ethical, secure, and accountable innovation. sustainable use of AI. In addition, privacy is embedded into business processes This integrated approach reflects the organization’s through a ‘privacy by design and by default’ approach, commitment to aligning innovation with regulatory ensuring data protection is integrated from the outset. expectations, societal impact, and environmental Practices such as Privacy Impact Assessments (PIAs), responsibility. Our Responsible AI Policy outlines the usage, enterprise-wide data mapping, and third-party due diligence deployment and development of AI tools and technology. support proactive risk mitigation, effective monitoring, controlled data flows, and regulatory compliance across the Ethical Governance and Transparency value chain. We also maintain transparency in our practices by reporting government and law enforcement requests for Ethical governance at Wipro is anchored in the “Spirit customer data. No such requests were recorded during the of Wipro,” which emphasizes integrity, fairness, and reporting period, reinforcing trust and accountability. accountability as core principles guiding business conduct. These values are operationalized through a comprehensive Code of Business Conduct, supported by structured policies, Cybersecurity and Intellectual Capital Protection ethical guidelines, and compliance frameworks applicable To safeguard our intellectual capital, including innovations across employees, leadership, and extended partners. and customer solutions, we implement robust cybersecurity The framework promotes responsible decision-making, systems and processes. Our multi-layered security adherence to legal requirements, and consistent ethical framework includes advanced encryption, real-time threat behavior across global operations. detection, and continuous monitoring to protect sensitive data. We employ industry best practices and frameworks The governance structure is supported by strong Board such as ISO and NIST to ensure comprehensive risk oversight, clear roles and responsibilities, and robust internal management. Regular vulnerability assessments and controls and audits. Disclosure policies, risk management penetration testing are conducted to identify and mitigate systems, and transparent reporting strengthen accountability potential threats. Additionally, our cybersecurity team and stakeholder confidence.


LOGO

98 VALUE CREATION FOR STAKEHOLDERS Executive Overview Supply chains are central to business operations and value creation, while also being a major source of ESG risks and opportunities. Increasing regulatory scrutiny, stakeholder expectations, and exposure to disruptions — driven by climate change, geopolitics, human rights issues, and evolving mandates — intensify these challenges. As a significant share of an organization’s environmental and social impact originates in its supply chain, integrating ESG into supplier risk management is essential for informed decision-making, long-term performance, resilience, and reputation. At Wipro, we view our suppliers as strategic partners in both Synergies our business journey and our transition toward a Net Zero future, recognizing that sustainability performance is closely—26 interconnected with the maturity of our supply chain. 2025 REPORT Key Linkages Strategy Capitals UN SDGs ANNUAL • Partnering to enhance compliance H Human • Human rights Social & Relationship • Diversity and sustainability INTEGRATED Natural Risks Financial • Human rights WIPRO Supplier • Compliance


LOGO

99 Governance Architecture: The governance architecture comprises three integrated Three-layered Framework layers designed to ensure strategic oversight, enterprise-wide consistency, and effective execution across the Governance of procurement activities at Wipro supplier ecosystem. operates through a distributed model spanning multiple At the strategic layer, Board and Executive leadership functions, with Global Procurement, Facilities, and provide direction, policy, oversight, and accountability Financial Shared Services providing primary oversight. for supply chain ESG priorities, including climate action, The Global Procurement organization is accountable human rights commitments, and ethical sourcing standards. for sourcing high-quality products and services aligned The enterprise layer centers on the TPRM framework, which with organizational objectives, ethical standards, and serves as the central governance backbone, integrating compliance requirements, with specialized buyer groups ESG risk assessment, policies, and controls into supplier managing distinct procurement categories. due diligence, risk categorization, approval workflows, Strategic collaboration between the Procurement function and monitoring processes under the oversight of a and the Enterprise Risk Management team enables the cross-functional TPRM Steering Committee. systematic identification, assessment, and proactive At the execution layer, we employ an integrated yet management of supply chain risks, ensuring alignment maturity-based supplier engagement approach based on between procurement operations, risk oversight, and supplier size, risk profile, and ESG maturity, with large and enterprise governance priorities. higher-risk suppliers subject to deeper ESG profiling and enhanced engagement expectations. Governance Layer Key Responsibilities Focus Areas Strategic Layer Board and Executive Supply chain ESG priorities, climate action, human Leadership rights and ethical sourcing. Enterprise Layer TPRM Framework ESG risk assessment integration, policies and (Cross-functional Steering controls, supplier due diligence, risk categorization, Committee) approval workflows, and monitoring processes. Execution Layer Maturity-based Supplier Risk-based engagement, enhanced engagement Engagement expectations based on supplier size, risk profile, and ESG maturity.


LOGO

100 VALUE CREATION FOR STAKEHOLDERS Wipro’s ESG in Supply Chain Governance Strategic Oversight Board/Executive Chief Procurement Officer Oversight and Global Head of Sustainability Enterprise Third-party Risk Management (TPRM) TPRM Steering Committee ESG Risk Assessment and Policies Policies and Standards Applicable to All Suppliers - 26 2025 Supplier Code Sustainable Global ESG in Compliance of Conduct Procurement Policy Procurement Policy Contractual in Vendor REPORT (External) (External) (Internal) Clauses Onboarding ANNUAL Execution Large Suppliers MSME Suppliers – WISE Program ESG Risk Profiling Sustainability ESG Capability Building INTEGRATED Assessments Contribution to Strengthening Supplier Maturity Wipro’s Decarbonization WIPRO Simplified ESG Data Collection


LOGO

101 Strategic Layer: Foundational Governance Board Oversight and Accountability The Global Procurement Policy Wipro’s supply chain ESG governance is overseen at the This policy defines overarching principles governing Wipro’s Board level, ensuring strategic focus and accountability. procurement operations, ensuring alignment with business The Board receives quarterly updates on Supplier Code of objectives, ethical standards, and operational discipline, Conduct signoff rates, helping monitor supplier compliance while reinforcing commitments to supplier diversity and with key ethical, labor, and sustainability standards and inclusive procurement. address gaps where needed. The cross-functional TPRM Steering Committee provides The Vendor Risk Assessment (VRA) Policy enterprise-wide oversight of third-party risks, including ESG Managed by the VRA team, this policy aligns security assessment and mitigation. This oversight also supports assessments of critical suppliers with applicable policies, Wipro’s climate commitments by engaging suppliers on procedures, standards, and baselines, utilizing security emissions reduction in line with its Net Zero pathway. questionnaires based on ISO 27001 and NIST 800-53 frameworks. Assessment reports, approved by relevant Board oversight reflects Wipro’s recognition that supplier stakeholders, identify non-conformances and observations, performance is material to risk, compliance, stakeholder which are tracked and addressed to achieve closure. expectations, and long-term value creation. This governance Comprehensive audits are also conducted to assess model aligns supply chain operations with corporate labor practices, including working hours, child labor, strategy and supports continuous improvement across the and workplace safety. supplier portfolio. These integrated policies establish a comprehensive Policy Framework governance architecture that addresses ESG considerations, security requirements, ethical standards, and operational Wipro’s supply chain governance policies and frameworks excellence across the supplier lifecycle. that establish standards, expectations, and operational discipline across the supplier ecosystem. The Supplier Code of Conduct (SCOC) The SCOC articulates fundamental principles expected of all suppliers, encompassing labor practices, integrity, ethical conduct, sustainability commitments, and intellectual property protection. All vendors are required to provide formal signoff on the SCOC, with compliance rates tracked and reported to the Board of Directors on a quarterly basis, ensuring executive-level visibility and accountability. The Sustainable Procurement Policy Under this policy, Environmental, Social and Governance (ESG) considerations are integrated into procurement decision-making across sourcing, contracting, and supplier lifecycle management stages, emphasizing responsible sourcing practices, resource efficiency, and reduced material consumption. It forms the basis of our supplier sustainability programs and supports long-term supply chain resilience.


LOGO

102 VALUE CREATION FOR STAKEHOLDERS Enterprise Layer: Third-party Risk onboarding processes, enhanced due diligence for Management Framework (TPRM) higher-risk partners, and integration into a centralized internal procurement platform. Wipro has implemented an enterprise-wide Third -party Risk Management (TPRM) framework to further Execution Layer: Supplier strengthen supply chain governance. The framework Development Programs aims to enable the systematic integration of ESG risks alongside other third-party risk dimensions. Wipro operates multiple supplier development programs designed to build capacity, enhance sustainability It is being progressively embedded across all third-party performance, and promote inclusive procurement across relationships, including suppliers, vendors, contractors, the supply chain ecosystem. The WISE program focuses consultants, service providers, and business partners, on supply chain decarbonization, supporting suppliers and covers the entire third-party lifecycle. in measuring and managing greenhouse gas emissions. The framework is designed to establish clear The program is designed to be inclusive by removing governance, defined roles, and strong accountability. cost barriers to participation, representing a strategic It enables a consistent and risk-based approach to due shift from compliance-driven assessments toward diligence, risk identification, risk assessment, and risk collaborative partnerships focused on mutual learning, management. ESG risks are assessed on par with other capability building, and continuous improvement. enterprise risks and are overseen by a cross-functional Recent program enhancements include the expansion of TPRM Steering Committee. hands-on training modules, improved supplier maturity As we further strengthen the TPRM framework, ESG risk assessment frameworks, and deeper alignment with outcomes are increasingly informing supplier approval enterprise-level emissions data requirements to support decisions, risk categorization, escalation pathways, and Scope 3 reporting. These improvements strengthen monitoring intensity. This is supported by structured the program’s effectiveness in driving measurable sustainability outcomes across the supplier network. Pillars of Supplier Sustainability Program Equitable Ethical • Equal opportunity employer practices • COBC and SCOC compliance as core • Universal design principles in sourcing ethical standards and procurement • System-driven vendor database checks and • Accessibility standards aligned with HG 2016 labor compliance tracking for physical infrastructure and WCAG 2.1 AA for • Vendor-specific credit assessment methods 26—ICT products • Annual anti-corruption and 2025 • Supplier diversity initiatives enabling anti-bribery training engagement with certified diverse suppliers • Social compliance protocols for • MSME inclusion in global supplier spend REPORT manpower service providers ANNUAL Ecological • Integration of ecological sustainability into supplier operations • Compliance with established environmental norms • Promotion of environment-friendly practices across operations INTEGRATED • Sustainable procurement across services (e.g., cleaning services, cooling systems acquisition) WIPRO • Greenhouse management and mitigation measures


LOGO

103 Supplier Diversity and Inclusive Procurement: Wipro inclusion, and capability building into our core procurement Inclusive Supplier Development and Mentorship — strategy. This multi-dimensional approach creates shared value across the supply chain while advancing broader WISDOM ESG objectives. The Supplier Diversity Program, WISDOM, achieved significant scale in FY26, with 16.84% of global procurement Environmental Performance: EPEAT Leadership spend directed to certified diverse suppliers and 8.6% to We have maintained EPEAT Purchaser Award recognition MSME suppliers, demonstrating a commitment to inclusive for eight consecutive years, demonstrating our sustained supply chain development. This reflects a substantial commitment to environmentally responsible electronics investment in building a more diverse and resilient procurement. Since 2022, we have achieved and maintained supplier ecosystem. the 5-STAR EPEAT rating from the Global Electronics Council, The WISDOM program provides management and technical the highest recognition tier available. The 5-STAR rating support to diverse suppliers to enable sustainable and spans six product categories: Computers, Displays, Imaging scalable business operations, with senior leadership Equipment, Televisions, Mobile Phones, and Servers, conducting program presentations and individual meetings reflecting enterprise-wide adoption of sustainability criteria to identify barriers and enablers to supplier growth. This in technology procurement decisions. hands-on approach ensures diverse suppliers receive the EPEAT-registered products meet rigorous environmental targeted support needed to scale their operations and performance criteria addressing climate impact, energy compete effectively. efficiency, reduction of environmentally sensitive materials, recycled content, design for longevity and recyclability, and responsible end-of-life management. The 2024 projected environmental impact (data is always received for the prior year) from our EPEAT procurement includes a reduction 16.84% of 2,637 metric tons of CO2 equivalent emissions, energy Global spend with Certified Diverse Suppliers savings of 1,006 megawatt-hours, and water conservation of 14.97 million liters across product lifecycles. 8.6% Global spend with MSME suppliers 2024 EPEAT Procurement Environmental Impact Environmental Metric 2024 Projected Impact Women Entrepreneurship with Wipro CO Equivalent 2,637 metric tons 2 (WEW) Initiative Emissions Reduction The Women Entrepreneurship with Wipro (WEW) initiative Energy Savings 1,006 megawatt-hours received the UN Women country-level recognition in FY25 for Gender Responsive Procurement practices, the Water Conservation 14.97 million liters highest award in this category. The program aims to identify women-owned business enterprises among existing These measurable outcomes demonstrate how strategic suppliers and encourage third-party certification, with procurement decisions directly contribute to enterprise eligible enterprises receiving structured mentorship from sustainability objectives and Net Zero commitments. The Wipro leadership to accelerate business development and eight-year consecutive recognition positions us among operational excellence. global leaders in sustainable electronics procurement, with 2024 EPEAT award winners collectively achieving Through these interconnected programs, we demonstrate greenhouse gas reductions equivalent to removing 121,000 a comprehensive approach to supplier development that passenger vehicles from roads annually. The assessment integrates environmental sustainability, diversity and report for 2025 will be received in July 2026.


LOGO

104 VALUE CREATION FOR STAKEHOLDERS Wipro Initiative for Supplier From Compliance to Strategic Collaboration Engagement (WISE) WISE represents a clear shift from compliance driven A core focus of the WISE program is supply chain supplier assessments to a strategic collaboration decarbonization, supporting suppliers in measuring and model focused on two way learning, capability building, managing their emissions through hands on guidance, and continuous improvement. Supplier engagements data documentation, and transparent sharing of results generate insights that inform Wipro’s broader supply to drive improvement actions. The program is designed chain strategy, while equipping suppliers with the to be inclusive by removing cost barriers to participation, knowledge and tools to strengthen their sustainability enabling broad supplier engagement and scaling performance. This collaborative approach is further sustainability impact across the supply chain rather than supported through initiatives such as the WISE Supplier limiting progress to large or resource rich suppliers. Sustainability Summits, which facilitate dialogue on The purpose of the program is two-fold: enable small emerging ESG and regulatory expectations, promote and medium suppliers to measure, monitor and report knowledge sharing, and recognize positive supplier emissions to Wipro; and to build capacity on the larger performance to reinforce long term engagement. sustainability goals spanning across ESG parameters. WISE Wipro Initiativefor SupplierEngagement Environment Governance - 26 2025 Social REPORT ANNUAL Decarbonization Empower &Engage Summit& Recognition EnablingMSMEs to track ESG Driving awareness, behavior change, Supplier Sustainability Summit and emissions and ESG policies. and positive reinforcement through leadership awards for top-performing capability building. suppliers to incentivize and create INTEGRATED awareness. WIPRO


LOGO

105 Human Rights Due Diligence These mechanisms enable due diligence, risk based in Supply Chain assessments, and audits at onboarding and during periodic renewals to ensure alignment with Wipro’s Supplier Code of Aligned with the UN Guiding Principles on Business and Conduct and human rights expectations. Human Rights and the OECD Due Diligence framework, This systematic approach positions us to meet emerging Wipro’s Human Rights Due Diligence (HRDD) approach regulatory requirements, including the EU Corporate is designed to identify, prevent, mitigate, and account for Sustainability Due Diligence Directive and similar mandatory adverse human rights impacts across its supply chain. HRDD legislation being implemented globally. As part of this approach, we are conducting a structured HRDD survey across all tiers of suppliers, administered Strategic Outlook and Continuous by an independent third party through a supplier self assessment questionnaire, to assess how human rights risks Improvement are managed in practice and to evaluate the effectiveness of As regulatory demands and expectations for supply chain existing policies, processes, and controls. transparency grow, our integrated governance and ESG Administered by an independent third party through a approach provides a strong foundation for continued comprehensive supplier self-assessment questionnaire, leadership. The maturing TPRM framework will strengthen the key human rights risk areas assessed include forced risk identification, assessment, and mitigation across the and child labor, freedom of association, wages and working supplier ecosystem. Continued enhancement of WISE will hours, occupational health and safety, non-discrimination, build supplier capacity for emissions measurement and ethical conduct, and worker well-being, with particular focus reduction, supporting Scope 3 decarbonization. Expanding on labor intensive and higher risk categories. human rights due diligence will help identify and address adverse impacts in line with emerging HRDD requirements. In parallel, we conduct internal social audits of suppliers as Ongoing focus on supplier diversity and inclusive part of our ongoing supply chain oversight. In the reporting procurement will create opportunities for MSMEs and year, we conducted 4,200 social audits for our vendors and women-owned businesses while strengthening resilience. contractors, strengthening the oversight of labor and social Sustaining EPEAT leadership and improving environmental compliance practices. performance will deliver measurable climate and operational HRDD processes are also embedded within Wipro’s benefits. Together, Wipro’s three-layered governance supplier onboarding and lifecycle management processes model, policy framework, and Board oversight provide through the TPRM framework and contractual requirements, the structure needed to meet evolving ESG requirements including Master Service Agreements (MSAs). Information while maintaining operational excellence. As we advance collected through the HRDD survey enables identification of toward our Net Zero goals, strategic supplier partnerships higher-risk suppliers and priority risk areas requiring targeted will remain central to creating shared value across our intervention, supporting a risk-based approach to human supply chain. rights protection.


LOGO

106 VALUE CREATION FOR STAKEHOLDERS Key Linkages Strategy Capitals UN SDGs • Employee training • Well-being I Intellectual • Inclusion and Belonging (I&B) H Human Risks S Social and Relationship N Natural • Talent and culture risk • ABAC risk F Financial • Retention M Manufactured • Human rights Culture and Values When our behaviors and ways of working consistently reflect our values, we truly Our 80-year milestone celebrates a put them into action. We have scaled legacy of resilience, uncompromising Five Habits engagement globally by ethics and integrity. Built by generations delivering crowdsourced, scenario-of Wiproites, these core values serve based learning to more than 140,000 as our moral compass and remain associates and conducting high-impact deeply embedded in the DNA of our refresh sessions across accounts for over organization. This legacy is also rooted 230,000 associates so far. in the belief that purpose drives business The Five Habits remind us that and business drives purpose. We proudly change begins with each one of us contribute 66% of our economic activity and encourage us all to be reflective, to a global philanthropy that supports collaborative and demonstrate the Five some of the most disadvantaged Habits every day. More than 500 Habit communities around the world. Champions and Culture Ambassadors Wipro’s Founder-Chairman, Azim Premji, have partnered and contributed to our has played an instrumental role in culture transformation journey. Over building this foundation and ensuring 40,000 leaders from around the world that our values, the Spirit of Wipro, guide have participated in 140+ immersive us to do the right thing. These values sessions on the Five Habits led by are our bedrock. They define who we our Chairman. - 26 are, guide how we work and shape our As the next step in this journey, we 2025 future. They have further strengthened introduced the Wipro Leader Success our commitment to creating a more Profile, an enterprise-wide definition inclusive workplace for our associates, REPORT of what leadership at Wipro looks like, clients and diverse stakeholders, feels like, and delivers. It defines a set of while contributing to a more equitable, Leadership Capabilities that leaders are ANNUAL humane, and sustainable society. expected to demonstrate. Our culture In early 2020, as part of our culture framework brings together key pillars, transformation journey, our Chairman, including purpose, mindset, learning, INTEGRATED Rishad Premji, introduced the Five recognition, belonging and well-being. Habits, which bring our values to life and WIPRO People encourage a growth mindset.


LOGO

107 Our culture continues to evolve with our organization, while our values remain a constant anchor and the Five Habits guide how we show up every day. We bring this to life by embedding culture in ways that create a consistent and meaningful experience for our associates globally. Our governance ensures this is sustained with clarity, intent, and scale. For detailed references, see pages 04, 32, 37, 38, 44, 54, 62, 63, 68, 83-93, 100, 101, 107-112, 128, 136, and 159 of the Annual Report for specific references. 140,000+ Associates engaged through Five Habits learning 500+ Habit Champions and Culture Ambassadors Women partnered and contributed to our culture Wipro is committed to fostering a supportive environment transformation journey for women associates. Our mission is to build an inclusive ecosystem where women can thrive, innovate, and lead. Over the years, we have strengthened an equitable culture through progressive policies, leadership development Inclusion and Belonging (I&B) programs, and structured mentorship and sponsorship opportunities. We also extend our efforts to engage and At Wipro, we believe that everyone belongs. By nurturing support women in communities at large. a workplace where individuals can be their authentic selves Key programs include Enrich, Begin Again, WoW Mom, HerCode, and experience a strong sense of belonging, we cultivate structured leadership development initiatives, leadership an environment where people can thrive in a merit-driven, connects with the CEO and Executive Leadership, and the high-performance culture. We do not engage in or support HerStory series, which showcases experiences and role models discrimination based on characteristics protected by law, from within Wipro and beyond. including ethnicity, race, caste, religion, disability, age, gender, marital status, gender identity, sexual orientation, political affiliation, or protected veteran status. Our I&B philosophy helps ensure that Wipro reflects the societies in which we operate and celebrates the diversity of voices across our global workforce. 37.6% 40% Our mandatory learning module on Unconscious Bias helps Women* Of our hires were women associates recognize and mitigate bias through realistic scenarios and practical actions. More than 2,05,000 associates have completed this training. Disability Inclusion We strive to create an inclusive and accessible workplace for colleagues with disabilities, acquired disabilities/chronic medical conditions, and primary caregivers of dependents 205,000+ with disabilities. We implement initiatives in alignment with our CREATE framework (Career, Recruit, Engage, Accessibility, Associates completed Unconscious Bias training Train and Enable) and focus on digital accessibility across all processes. * Women employee % includes employees of Harman DTS acquisition closed, effective December 1, 2025.


LOGO

108 VALUE CREATION FOR STAKEHOLDERS The Global Disability Alliance Network (Global DAN) brings together employees with disabilities from diverse intersectionalities, caregivers and allies. We have systems in place for self-identification and for requests 40% related to reasonable accommodation and adjustments, Generation Z supported by appropriate interventions. In addition, disability awareness and sensitization sessions, our Disability Inclusion Hub page, and the Disability Inclusion Handbook provide awareness and details on Race and Ethnicity inclusive practices to empower associates. The Black Alliance ERG promotes an inclusive environment for African American associates by LGBTQIA+ Inclusion observing Martin Luther King Jr. Day, recognizing Juneteenth, and celebrating Black History Month. Our priority is to create a safe, inclusive, and welcoming In addition, we support regional and country-specific workplace for LGBTQIA+ associates through awareness affinity groups for Hispanic and Latin/o/a/x communities, building, allyship, and inclusive policy frameworks. Asian and Pacific Islander associates, and other cultural Wipro Pride, our Employee Resource Group (ERG), groups, fostering inclusion and representation across our facilitates community building, information sharing, and global workforce. conversations among LGBTQIA+ colleagues and allies. Our Global Prevention of LGBTQIA+ Discrimination People Processes: Key Highlights Policy safeguards associates against discrimination based on gender identity or sexual orientation. of FY26 Wipro’s insurance policy includes coverage for gender- Hiring and Onboarding affirming surgeries and related medical procedures in several countries. Additionally, inclusive gender-neutral Our associates are our greatest strength, and we aim restrooms are available across most office locations. to build exceptional teams from diverse backgrounds Our initiatives include a dedicated LGBTQIA+ Inclusion to drive innovation and set high standards. Our culture Handbook, an e-learning module on Championing and values provide a strong foundation for an industry-LGBTQIA+ Inclusion, sensitization sessions, monthly leading Talent Attraction Model, which we leverage to newsletters, and allyship campaigns. These efforts help attract, identify, and hire diverse talent at all levels. Early create safe spaces for dialogue and strengthen a sense career hires find a sustainable platform to grow into the of community and belonging. technology leaders of tomorrow, while our Employer Value Proposition (EVP) articulates our brand promise and helps attract top talent for open roles. Increase in self-declaration with This year, we took a significant step forward in the associate experience by implementing SuccessFactors 2,537 1,660+ Onboarding. This integrated, system-led approach Associates with Associates from the is grounded in human-centered design, AI-enabled 26 Disabilities LGBTQIA+ community workflows, and simplified, automated processes,—bringing new hires into Wipro with greater clarity and 2025 speed from day one. Multi-generational Inclusion Enhancing the candidate experience remains a top REPORT priority, and our investments are reflected externally. At Wipro, we embrace a multi-generational workforce and Our Glassdoor metrics show sustained momentum, design our policies and programs to support associates with 68% of reviewers recommending Wipro to a friend, ANNUAL at different life stages. Our initiatives enable employees and 65% have a positive outlook on the Company. to balance professional and personal commitments CEO approval has remained consistent at around 80% while accessing development opportunities throughout through FY26, placing us ahead of several immediate their careers. competitors, while inclusion and belonging continue to INTEGRATED We promote cross-generational collaboration through be our highest-rated attributes. Technology, automation, and an AI-first mindset, combined with AI tools across mentoring, reverse mentoring, peer learning, and WIPRO 360-degree feedback mechanisms, enabling knowledge our hiring practices, have enabled faster, more data-sharing and mutual growth. driven decision-making and helped us meet our talent goals efficiently.


LOGO

109 Performance and Talent Management Learning and Development Technology shifts and rising client expectations are reshaping In FY26, we invested 19.23 million learning hours in skilling our business, accelerating workforce transformation through and professional development of associates across Wipro AI. Our talent ecosystem integrates continuous skilling, Academy and Wipro Leadership Institute. leadership development, performance management, and career mobility to enable associates to deliver sustained Wipro Academy impact at pace and scale. We have designed our performance At Wipro Academy, the MySkill-Z Competency Framework management approach as a continuous, fair, and outcome- enables our early-career associates to acquire high-demand driven process that supports long-term growth. Through clear skill(s) for project-career opportunities. goals and objectives, transparent bi-annual appraisal and feedback processes, such as 360-degree surveys and feed- iAspire, our AI-powered career-management platform, forward mechanisms, our performance management system empowers associates to explore career paths and aligns individual contribution with business priorities and professional growth opportunities based on their current Wipro’s values-led culture. roles, skillsets, professional aspirations, and business and We integrate performance with career development through client needs. clear rating definitions, role and skill-based frameworks, Our partnerships with Microsoft, Google, AWS and and role rotations. Associates can set goals, track progress, other leading enterprises provide access to the latest and access actionable performance insights through learning resources in Cloud and AI Technologies. In myCareer on SuccessFactors, and explore career and talent addition, our collaboration with the Indian Institute of development opportunities. Rewards and career progression Science offers access to their M. Tech. programs in AI and are linked to sustained high performance, reinforcing Data Science & Business Analytics to our associates. a meritocratic, high-performance culture that drives Our commitment to continuous learning and cross-skilling engagement, purpose, and results at scale. This approach continued with additional rigor during the year. We are reinforces continued performance, growth, and actively building an AI-ready workforce, with 212,663 development opportunities. Associates already equipped with an AI-first mindset and Our talent ecosystem is powered by AI-enabled talent essential AI skillset and toolset. We have enabled more practices that connect skills, performance, careers, and than 180 AI learning pathways tailored to varied proficiency opportunity. Platforms such as iAspire, an AI-powered levels for our business and technical associates. Through career management system, and WiNow, a conversational these efforts, we aspire to excel in AI-technologies and drive talent bot, provide real-time visibility into skills and AI-innovation, service delivery transformation, and efficiency. aspirations, encourage faster deployment of best-fit talent and application of learned skills to real-world problems. Our integrated Human Capital Management System (HCM) on SuccessFactors further connects skilling, performance, and career mobility into a single, insight-driven experience. 19.23 mn learning hours Through responsible AI practices, targeted learning, and Invested in skilling and professional development clear career pathways, we advance our consulting-led, of associates across Wipro Academy and Wipro AI-powered transformation, helping associates build the Leadership Institute capabilities that matter most, power sustained business value, and truly deliver with impact. 212,663 Employees covered through AI-ready workforce initiatives 65% ~80% Positive outlook CEO approval rating We advanced our position as a consulting-led and AI-powered enterprise leveraging Wipro Intelligence, which on the Company through FY26 integrates AI into delivery through platforms, such as WINGS and WEGA. Our AI Academy launched an enterprise-wide initiative to train and certify associates to drive AI adoption.


LOGO

110 VALUE CREATION FOR STAKEHOLDERS Leadership Development and Talent Management The Wipro Leadership Institute (WLI) curates learning and development interventions aligned with our strategic priorities and emerging business needs. Operationalizing the tenets outlined in the Wipro Leaders Success Profile, WLI offers a comprehensive 66,092 34,208 suite of programs designed to enhance knowledge, WINGS Basic WEGA Advanced strengthen skills, and shape mindsets. WLI’s leadership development programs enabled more than 1,500 high-performing and high-potential 70,443 27,670 individuals to enhance personal growth and strategic WEGA Basic WEGA Master awareness, helping them excel in their existing roles while preparing for future enterprise leadership mandates. Notable initiatives under WLI include executive programs focused on transformation leadership, customized development interventions for go-to-market and delivery talent, a sponsorship program for women leaders, personal development through 93,994 sponsorship and coaching, academic immersions at leading global institutes, and structured manager Associates certified as AI Masters effectiveness programs. We have built an active skilling ecosystem with learning Employee Well-being partners such as Udemy, Mettl, Codility, Nuvepro, Associate well-being is a fundamental aspect of HackerRank, TopCoder, and Intuition. Additionally, our our culture. We champion the holistic well-being of in-house wiLearn platform empowers associates to our people by emphasizing the interconnectedness explore relevant skilling avenues based on their learning of three important aspects of life: Mind, Body and needs. Through these initiatives, we foster a culture of Community. Our data-driven approach to healthcare continuous learning at Wipro, recording 79.1 skilling ensures sustainable and scalable outcomes. hours per associate for FY26. Leadership involvement is crucial, with a dedicated leader sponsor fostering well-being conversations and advocating interventions that support a healthier, happier workforce. Recorded Part-time Working Options 79.1 skilling hours We offer Indian associates a half-day, half-pay working model for periods ranging from one month to one 26 per associate for FY26 year, providing flexibility for personal commitments. - Reasons include post-maternity leave, childcare, illness, 2025 dependent care or other personal reasons. In addition, During the year, 139 customized Account Academies temporary remote work is available for up to 12 days REPORT across various Global Business Lines and Service annually to support health and caregiving needs. Lines offered continuous and connected learning opportunities for 85,616 associates. Cloud and AI ANNUAL Practice Academies, along with the School of Data Engineers, help build emerging skills required for INTEGRATED future roles. WIPRO


LOGO

111 Focus on Capability Building Employee Experience Survey (EES) and Employee Strengthening well-being-related skills in the organization at Insights an individual and managerial level. The Employee Engagement Survey (EES) is Wipro’s • Our e-learning modules for mental resilience, psychological enterprise-wide active listening mechanism designed to first aid, and workforce well-being equip learners and capture employee sentiment and engagement across the employee lifecycle. It provides insights into key engagement managers with essential skills to manage stress, recognize drivers such as career development, work-life balance, distress, and foster a thriving work environment. psychological safety and organizational purpose. • The capability-building catalogue serves as a single repository for all well-being learning resources. Key Highlights of EES Overall Engagement: With 86% engagement and a 72% • Managers who prioritize well-being foster resilient and participation rate, we have shown an improvement in engaged teams. The well-being module in the Wipro engagement. The engagement score is a composite of job People Managers Program (WPM), along with DIY toolkits, satisfaction (82%), sense of purpose (90%), and willingness to supports stress management and team collaboration. recommend (85%). We continue to outperform benchmarks across Fortune 500 and IT/Professional Services sectors. • Our 24/7 digital well-being platforms offer articles, Engagement Drivers: High scores across training and videos, courses, and curated learning pathways for all associates. resources (90%), authority and empowerment (88%), innovation (88%), inclusion and belonging (86%), role fit (85%), customer focus (85%), well-being (83%), Peer Support for Mental Health psychological safety (82%), work-life balance (81%), The Mitr–Mental Wellbeing Ally Network (India) is a transparent communication (80%), strategic alignment (83%), peer-led initiative that builds a supportive workplace by collaboration (82%), recognition (80%), trust in manager (83%) enabling trained employee volunteers to act as the first and leadership (82%). line of support for colleagues facing stress or emotional Respect and Impact: At Wipro, 89% of associates feel challenges. Mitr allies provide empathetic listening, promote respected at work, and 88% believe the Company is making early help-seeking, and guide employees to professional a positive impact on the world. resources such as the Employee Assistance Program (EAP), while maintaining confidentiality. Action on Feedback: The ‘Action Taken’ score rose to 71% in Aug’25, up from 70% in Feb’25 and 68% in Aug’24, reflecting Financial Well-being Platforms: Launched globally with increased confidence in Wipro’s responsiveness to employee comprehensive offerings and will continue to be expanded. feedback. Our ‘Action Taken’ score remained ahead of Caregiver Benefits: Launched in India and the US, offering Fortune 500, IT, and global benchmarks, with leadership resources for child/elder care, women’s well-being and engagement rising on the back of structured programs parenting support. for leaders, AI-powered sales enablement, and sustained investment in collaboration, managing change, well-being, Technological Integrations: Provide seamless access and psychological safety. to well-being resources, including the Stretch & Pause ergonomics app and the WiNow chatbot. Focused Communication: Campaigns and a dedicated site enhance visibility of well-being offerings across all employee lifecycle stages. 86% We conduct an annual well-being survey to determine the EES (Employee Engagement Score) organization’s well-being quotient and evaluate awareness of our well-being offerings.


LOGO

112 OUR APPROACH TO MANAGING RISK Our Enterprise Risk Management (ERM) framework is based on globally recognized standards and industry best practices. In line with the organization’s strategic objectives, it provides 360-degree coverage. Its primary objective is to avoid surprises by proactively managing organizational risks, including emerging risks and concerns. It also focuses on risk mitigation to keep residual risks within defined thresholds and supports continuous risk awareness programs, while taking into account the requirements of clients and employees as key stakeholders. The framework is designed to be driven approach that enables Wipro to agile, enabling proactive navigation anticipate risks, respond proactively, and of uncertainties and the ability to sustain stakeholder confidence. capitalize on opportunities in a Gartner, an independent analyst firm, dynamic business environment. It has in its vendor rating report of August been digitized to enable faster, more 2024, stated that Wipro has a strong informed, and effective risk-based focus on risk management, driven by decision-making, thereby fostering a the Chief Risk Officer. Wipro views this risk-resilient culture. The ERM framework as a business differentiator, focused is administered by the Audit, Risk and on four key pillars: enhanced reliability, Compliance Committee of the Board resilience, agility, and security of and is supported by a multi-layered business solutions. Wipro also won risk governance structure that enables the ‘Masters of Risk–IT & ITES’ (Large effective oversight, timely escalation Cap category) at the CNBC TV18 India and coordinated risk response across Risk Management Awards 2025. In the organization. a benchmarking study conducted by Augmented by AI-enabled insights and PricewaterhouseCoopers (PwC) in late automation to enhance risk visibility 2023, it was noted that, compared to and responsiveness, the Company peers, Wipro has achieved an advanced strengthens preparedness for evolving level of maturity in its ERM practices and 26—risks through simulation-driven exercises, is well-positioned to leverage these as a 2025 role-based training, and centralized risk market differentiator. At Wipro, we have intelligence. This reflects a preventive, continued to build on and strengthen REPORT technology-enabled, and resilience- these practices during the year. Management ANNUAL INTEGRATED WIPRO Risk


LOGO

113 Guiding Pillars Strategic Oversight Strategic Objectives and Priorities Board of Vision and Company Accelerate Strengthen Lead with Built Talent Simplified Directors Mission Values Growth Client and Business at Scale Operating Partnerships Solutions Model Ecosystems Key Risk Domains Risk Management Framework Risk Governance • Clients • Legal, Regulatory • Risk Identification – • Audit, Risk • Business and Compliance Existing/Emerging and Compliance • Functions • Information • Risk Assessment Committee of • Partners and Cybersecurity • Appetite and Tolerance the Board • Environmental • Data Privacy • Risk Treatment • Risk and Social • Generative AI • Risk Monitoring and Governance • Financial Committee • Risk Reporting • Compliance • Talent and Culture • Audit Committee • Employee Health • Risk Councils and Safety at Business, • Service Delivery and Functions, Obligation Management Geography, • Strategic & Market Location Theme level and Risk • Technology & Innovation • Mergers and Acquisitions Integration • Geopolitical • Third Party/Supplier Business Resilience • Fraud and Anti-Bribery and Anti-Corruption • Environmental, Social and Governance • Emerging Risk Risk Program Risk Description Risk Mitigation Our reliance on information technology Our risk-based approach continuously monitors and responds to cyber risks through is increasing with the adoption of a layered cybersecurity management process. emerging technologies, cloud, artificial This Includes: intelligence, and remote workforce • Well-defined information security policies, procedures, risk and control models. This expands the complexity frameworks aligned with industry standards, including ISO 27001, of our digital ecosystem and heightens Information and NIST 800-53, NIST CSF, and ISO 27005. exposure to cybersecurity threats, Cybersecurity vulnerabilities, deepfakes, phishing • Continuous risk assessments for proactive identification, mitigation and Risk attacks, and incidents. These risks governance of emerging cyber and AI-related risks. may result in business disruptions, • A well-structured threat intelligence, security monitoring, and incident reputational damage, unauthorized response process to detect and respond to cyber threats and incidents. disclosure of sensitive information, financial losses, and the spread of • Ongoing employee engagement initiatives to foster a strong security culture disinformation. and promote responsible and ethical behavior across the organization. The cybersecurity team checks preparedness through phishing and deepfake attack simulations that impersonate senior leaders. • Comprehensive data protection techniques, along with strong backup and recovery protocols, form a key foundation for our cyber resilience strategy. • A robust governance process with Executive and Board-level oversight to review cybersecurity risks and evaluate the investments required to mitigate and respond to them.


LOGO

114 OUR APPROACH TO MANAGING RISK Risk Program Risk Description Risk Mitigation Risk arising from non-compliance with • A program on statutory compliance is in place to track all applicable federal, state, local and foreign applicable regulations and obligations, commensurate laws governing business operations, with the size and operations of the organization and which may lead to financial exposure and corresponding to actions for enabling compliance. reputational risk to the organization. • Compliance Posture is regularly monitored by the Legal, Regulatory Compliance Committee, Compliance Officer of the Company and Compliance and reported to the Audit, Risk and Compliance Committee Risk of the Board. Potential risks associated with non- Aligned with ISO/IEC 27701:2019 certification, a dedicated Data compliance with Data Privacy regulations Privacy team monitors regulatory changes on an ongoing basis include substantial financial penalties, and enables periodic privacy assessments and audits to identify legal action, loss of customer trust, and vulnerabilities and maintain compliance with evolving DP laws. reputational damage. Furthermore, We leverage technology to manage our operations efficiently. the organization may face operational Data Privacy Data security measures such as encryption, firewalls, and intrusion disruptions and increased scrutiny from (DP) Risk detection systems protect sensitive information from unauthorized regulatory bodies. access and breaches. Data Privacy training is conducted to upskill teams and equip them with capabilities for handling complexities around data transfer, use of personal data in AI systems, new Data Privacy regulations, their compliance requirements and emerging threats Data Privacy manuals are created for the enterprise functions, including the creation of a strong network of data privacy champions. These risks remain elevated and are • Our Country Risk Framework addresses country-specific expected to persist in the foreseeable future. risks, enabling proactive risk identification and treatment They may impact employee safety, security, prior to onboarding new or incremental business. and employee mobility and may also lead to • Agreements with multiple reputed international risk disruptions in business operations. consulting firms provide us with real-time information, Geopolitical and security analysis, risk assessments, advice and forecasts Macroeconomic for the timely detection of geopolitical risks and global Volatility Risk security events. • Our strategy of hiring local talent in critical geographies and strategic locations, along with a dedicated team that manages mobility, ensures minimal impact on operations resulting from any protectionist policies by a country. • Business Continuity and Cybersecurity programs are periodically reviewed and tested to ensure resilience to any regional conflicts. These include risks relating to taxation, Covered on page 121. wage pressure, credit, foreign currency,—26 interest rate, counterparty and liquidity 2025 arising from the normal course of business. Finance and REPORT Market Risk ANNUAL INTEGRATED WIPRO


LOGO

115 Risk Program Risk Description Risk Mitigation Highly motivated and skilled See the ‘People Practices Learning and Development’ section on page 109. resources are the backbone of any organization. Effective and efficient people management helps businesses gain a People Operations competitive advantage. This risk (Talent and Culture) could arise if organizations fail Risk to hire and manage resources appropriately. Providing a healthy and safe See ‘People Practices Employee Well-being’ section on page 110. working environment will improve employee productivity, retention and avoid any reputation impact. It also helps the business gain a competitive advantage. Employee Health and Safety Risk Delivery and operational • Our Deal Resilience Evaluation Framework (DREF) ensures proactive risk excellence are the foundation management of large deals right from the deal pursuit stage. of any customer engagement • Unified Risk Framework and Alert management process enable timely risk process. The absence of secure, management and governance throughout the lifecycle of the engagement. compliant and resilient business These proactive methodologies enhance resilience and ensure a high Service Delivery solutions can lead to customer standard of operational excellence. and Contractual dissatisfaction and have financial Obligation implications. • Contractual obligations are self-assessed by the teams and audited by ERM and the Quality team to ensure strong governance on service delivery and Management contractual obligation management. (Including Large Deal • Wipro’s Enterprise Level SSAE 18 compliance program has gone live and Governance) Risk is designed to meet regulatory and security compliance requirements across locations. If AI is not used responsibly, • AI Council and task force oversee the responsible use of AI in service delivery, it exposes the organization to covering both new implementations and existing ones, including all high-risk significant risks of data breaches, AI projects. Furthermore, the AI task force conducts AI impact assessments bias and fairness issues, for privacy-enhancing technical solutions to safeguard client IP and data and regulatory violations, contractual ensure regulatory compliance. non-compliance and financial AI in Service • AI audit framework assesses compliance of AI usage against contractual exposure. Delivery Risk terms and Wipro’s AI frameworks and standards, including periodic review of deployed AI solutions. • Delivery teams mandatorily perform AI risk classification to determine the risk exposure and ensure necessary steps are taken to reduce liability risk. • Responsible AI training courses are imparted for privacy, fairness, and legal protection by design and AI risks. • Contractual Safeguards for AI have been configured through MSAs and SOWs. The risk that arises if the Our Business Continuity Management System (BCMS) framework is aligned to organization is unable to recover ISO 22301:2019. We have dedicated and certified BCM professionals working to and maintain business operations enhance our resilience posture. in the event of a disruption due • Business continuity plans are prepared and tested across delivery centers, to internal, third-party, physical, data centers, functions and accounts to ensure preparedness. or natural circumstances, etc. Business Resilience This can lead to loss of customer • A crisis management structure exists globally that proactively manages and and IT Disaster confidence, financial and supports during crises, and a threat management program is underway to do Recovery Risk reputational loss. a risk profiling of each location. • BCMS is digitized to drive quick and accurate decision-making during crises, with enhancements including real-time alert and action mechanisms through tools such as WIRES (Wipro Resilience for Account Service Delivery) and Crisis24 for employee engagement, enabling faster and more accurate decisions, timely notifications during crisis or disaster situations, and effective mass communication.


LOGO

116 OUR APPROACH TO MANAGING RISK Risk Program Risk Description Risk Mitigation M&A is a key enabler for • Wipro’s Post Merger Integration team constitutes M&A integration Wipro’s inorganic growth leaders, program managers, organizational change management strategy. The seamless experts and dedicated functional integration leaders who drive all and successful integration aspects of integration, including the eventual brand retirement and of acquired entity people, entity dispositioning. Mergers & processes and systems is • Wipro’s M&A Value Creation team drives business collaboration and joint Acquisitions necessary to preserve value go-to-market, standalone and synergy business success with acquired (M&A) Integration and achieve the acquisition’s entities to ensure value preservation and value creation. Risk strategic objectives. • We focus on reducing the ‘Time to Integration’, and have customized integration approaches that address the entity’s nuances, thus ensuring maximum value realization and seamless integration experiences. • During integration, there is a strong focus on aligning SOX, regulatory, security and Wipro compliance requirements with complete alignment to Group Risk Appetite. • Our M&A integration platform enables tracking of milestones from Legal Close until the entity is fully integrated into Wipro’s standard processes and systems. The inability of our Suppliers • Wipro’s comprehensive Third-Party Risk Management Framework, to deliver services or products Supplier Code of Conduct (SCOC), Supplier Ethics program, ongoing on time, as per agreed supplier meets and business reviews govern the Supplier life cycle, quality or non-adherence to supported by a centralized platform enabling end-to-end third-party risk regulatory requirements can management lifecycle, including onboarding, continuous monitoring and offboarding. Third Party Risk lead to disruption of services Management to our customers. This could • Onboarding checks involve technical and financial assessments and result in reputational damage, enhanced due diligence and supplier risk assessments based on the risk contractual non-compliance, profile of the Supplier. All vendors are required to comply with our SCOC, and financial risks. including subcontractors/Nth parties. • Our Third-Party risk management framework evaluates the risks associated with third parties, including supplier concentration, category-wise spends, contractual status, documentation, and integrated multi-domain risks such as cyber security, data protection, ESG, business continuity and AI. • There is an ongoing focus on cost optimization and risk reduction that includes supplier consolidation supported by continuous monitoring and oversight through dedicated risk towers. Maintaining integrity is • Wipro’s Code of Business Conduct (COBC), Zero Tolerance Policy on paramount for safeguarding integrity violations, Anti-Bribery & Anti-Corruption (ABAC) program, Anti-Money Laundering (AML) monitoring, Fraud Management, Financial Risk market confidence and building Management, Vendor Risk Management, Ombuds channels, and ERM-led trust with clients. Instances of stress testing collectively establish a robust governance framework Fraud, Anti- bribery and corruption, money for prevention, detection, and response. This is further strengthened laundering or fraud can expose through analytics-driven monitoring, proactive risk intelligence, and Bribery Anti- the organization to reputational AI-enabled investigations, enabling a predictive, risk-led approach to - 26 and financial risks. Corruption ethical governance. 2025 (ABAC), Anti- • ABAC Council, chaired by the General Counsel, provides strategic Money Laundering oversight and ensures proactive risk management for high-risk functions, (AML) Risk with structured investigations and regular reporting to senior leadership REPORT and the Board. • Mandatory training for high-risk functions, along with annual COBC certification by all employees, reinforces a strong culture of integrity, ANNUAL supported by effective whistleblower mechanisms. INTEGRATED WIPRO


LOGO

117 Risk Program Risk Description Risk Mitigation Any delay in identifying and aligning our • Our approach is to be agile and adaptive in strategizing and executing strategy to the dynamic market conditions our key priorities. Our broader vision and strategic priorities form the D and nuances can impact our growth, market basis for driving sustained performance share and profitability. Additionally, any • We have prioritized markets, sectors, and clients that drive our focus escalations in tariffs and trade policies of and investments. Differentiated capabilities, talent, operational Strategy and certain countries with large economies, excellence, and a robust governance structure form the basis of Market Risk where our clients or we operate, may execution excellence directly or indirectly hamper our growth. • Our approach is Consulting-led and AI-powered. We are continuously making investments in AI and executing across three dimensions, i.e., ‘Operate better’, ‘Deliver better’, and ‘Change the game’. These enable us to be relevant and stay ahead in the context of dynamic market conditions • We continue to build strong relationships with our clients. This enables us to work on their most critical strategic priorities, including mitigating macro headwinds arising from tariffs, trade policies, etc., through our strong capabilities (e.g., cost/operational excellence, transformation, etc.) and global delivery footprint Technological evolution, particularly rapid We continue investing in R&D to adopt frontier technologies and develop advancements in AI, is driving clients to industry solutions like AI. We partner with global technology leaders, review their technology strategies and their academic research teams, and startups to remain ahead of the curve on technology evolution. Our global team of experts in Responsible AI, Data IT operating models, leading to a shift in the Governance, and Data Privacy aids accelerated responsible AI Adoption. Technology and services they need. Failure to adapt to these The global Wipro Innovation Network creates collaborative environments changes could result in loss of business. where clients can engage with our experts through immersive workshops Innovation Risk to identify and co-create high-impact, high-priority use cases and accelerate their adoption of innovations. Climate-related risks can adversely affect Climate risks our assets, operations, and financial ESG risks – The identified 7 ESG goals are monitored on a quarterly basis performance through both physical impacts from extreme weather and transition risks by the Board. Details are available in the Materiality Assessment section arising from regulatory change. on page 64. Climate and Environmental, ESG serves as a key indicator of organizational responsibility for investors Social & and clients evaluating long-term Governance partnerships. A failure to address climate (ESG) Risk risks and strengthen ESG governance can constrain business growth and result in financial and reputational damage. Climate and ESG Risks As a global technology services leader, we view the management of ESG and climate-related risks as fundamental to our long-term resilience and value creation. At Wipro, we navigate an evolving climate landscape by addressing risks and capitalizing on opportunities to support the low-carbon transition. Climate change influences our operations, value chains, and financial performance, driving us to embed these considerations into our governance, strategy, and risk management processes. This section reflects our commitment to the IFRS S2 Climate-related Disclosures framework and provides a clear view of our approach.


LOGO

118 OUR APPROACH TO MANAGING RISK Risk Governance A single integrated data model connects these risks to risk owners, reporting lines, controls, testing processes, Our Board oversees Sustainability and ESG Risks compliance requirements, and strategic objectives. through its Board Committees. The Audit, Risk and Compliance Committee evaluates Climate and This integrated approach helps us manage ESG challenges ESG risks along with risk adaptation and business and capture opportunities in the low-carbon transition. continuity. The Nomination and Remuneration Committee oversees sustainability and CSR activities, Climate-related Risks aligning with risk mitigation. Please refer to page 68 Climate-related risks are risks associated with a changing on ESG Strategy and Governance to understand climate that have the potential to negatively impact an more on our Risk Governance. organization’s assets, operations, and financial performance, requiring strategic adjustments toward a lower-carbon Strategy and Risk Framework economy. These risks are further categorized into physical Our strategy embeds ESG and climate factors and transition risks. into business planning across short-term (2030), Our most recent climate risk assessment, aligned with TCFD medium-term (2040), and long-term (2050) horizons, recommendations and IFRS S2 Climate-related Disclosures, reflecting their critical role in our operations and was conducted in 2025-26 to identify key climate-related stakeholder expectations. risks, opportunities, and their operational impacts. A detailed Our risk framework embeds ESG and climate risks report can be found here. into Enterprise Risk Management (ERM), aligned with the COSO ERM Framework, to strengthen resilience Physical Risk and transparency across operations. Physical risks refer to the impact of climate events on a We assess ESG and climate risk across People safety, company’s infrastructure and its upstream and downstream Infrastructure and Customer Delivery. value chain. For physical climate risks, we adopted the Intergovernmental Panel on Climate Change (IPCC) Sixth Our Climate and ESG risks are captured in the ERM Assessment Report (AR6) climate scenarios, based on Risk Register of all relevant functions. Embedding Shared Socioeconomic Pathways (SSPs). Financial impacts them in existing registers elevates ESG in senior and losses were estimated for floods, wind, and wildfires, management discussions and shows how these risks extreme heat and water stress. interact with other enterprise risks. Cross-functional mapping across Facilities Management, HR, Data Privacy, and Business Resilience helps ensure A sustainability-led pathway with SSP1 2.6 appropriate investments and mitigation controls. low emissions, resulting in around (Optimistic) 2°C warming. ESG-related Risks 26—Risks related to our material topics are integrated into A pathway based on historical the Enterprise Risk Management (ERM) framework SSP2 4.5 2025 trends with uneven development, by design. These risks are usually identified (Business- resulting in moderate challenges using both qualitative and quantitative methods, as-Usual) REPORT and 4.5 W/m² radiative forcing. including megatrend analysis, SWOT studies, materiality assessments, stress testing, and what-if ANNUAL scenario analysis and can be viewed in the above A high-emission, fossil fuel–driven section. Some examples are risks related to People SSP5 8.5 pathway with significant challenges, Operations, Data Privacy, Cybersecurity, Technology (Pessimistic) resulting in 8.5 W/m² radiative forcing. INTEGRATED & Innovation, and third-party (Suppliers). Environment & Climate risks are addressed under ESG risks. WIPRO


LOGO

119 Physical Acute Risk Chronic Risk Risk Climate Risk Extreme weather events Extreme heat Water stress Exposure by Region and Type* Globally, across India and the Asia Extreme heat is the predominant Water stress is the predominant Pacific, sites face elevated acute chronic risk, with higher exposure in chronic risk for international exposure to floods and wind/cyclones . the Americas and the southern states and domestic sites, with higher of India. exposure in southern India. Potential Increasing frequency and intensity Extreme heat could increase operating Water stress could lower the Impact of extreme weather events such as costs by augmenting our cooling needs efficiency of some of our processes, urban floods, heatwaves, cyclones, and increasing energy consumption impact our operations, and increase and wildfires may lead to business to ensure processes and equipment our water procurement costs. interruptions, service delivery delays, operate efficiently. and infrastructural damage. Mitigation/ • created Enhanced flood stormwater -resilient drainage, landscaping, We have prioritized energy-efficient Implemented wastewater Adaptation building designs that incorporate recycling, low flow fixtures, and reinforced structures to passive cooling techniques, reflective and rainwater harvesting to Efforts mitigate floods and cyclones. roofing, and optimized insulation. enhance water conservation and • Elevated critical infrastructure groundwater recharge. (server rooms) with added Additionally, we have deployed waterproofing and backup smart heating, ventilation, and Conduct seasonal water audits power systems. air conditioning (HVAC) systems and risk assessments to anticipate to dynamically regulate indoor supply variability and optimize • through Reduced smart heatwave building exposure design and temperatures while minimizing energy water usage. consumption across our facilities. energy-efficient cooling measures. *Note: The scope covers 55 locations globally, including 25 in India and 30 international. An in-depth climate risk assessment was conducted for 21 critical locations. These 21 locations are deemed critical based on total asset value and employee strength) across India, the United Kingdom, and the Philippines. A consolidated report of the outcomes of physical climate risk assessment specific to the long-term (2050) period under the SSP1-2.6 (low emissions) and SSP5-8.5 (very high emissions) scenarios can be found here. Risk Mapping – Severity Level : Lowest  Low  Medium High  Highest Transition Risk Transition risks are related to economic, social, regulatory, or even geopolitical risks emerging from the transition towards a low-carbon economy and a more sustainable business. For transition risks and opportunities, we have adopted the Network for Greening the Financial System (NGFS) climate scenarios across Orderly, Disorderly, and Hot House World Climate scenarios, represented by Net Zero by 2050, delayed transition, and current policies across short-term, medium-term, and long-term horizons, which provide standardized pathways built on varying assumptions regarding policy ambition, timing, coordination, and technology progress.


LOGO

120 OUR APPROACH TO MANAGING RISK The material risks related to transition climate-related risks span across the subcategories illustrated below: Transition Risk Risk Type (Risk Level) and Potential Impact Mitigation/Adaptation Efforts Carbon pricing 94% targeting renewable 100% by energy 2030 reduces to eliminate carbon fossil cost fuel exposure; Own operations: Electricity costs directly drive OPEX price risks. and margins. Manage rising vendor energy costs through supplier Value chain: Carbon pricing raises vendor costs, increasing visibility engagement, of vendor sustainable emissions procurement, and efficiency and . improved service delivery costs and margin pressure. and Policy Legal  Risks Multi-jurisdictional climate disclosures We and expect integrated a strong reporting alignment to reduce with ISSB, our incremental TCFD, BRSR, Mandatory multi jurisdiction climate disclosures increase reporting complexity due to varying frameworks and standards. compliance duplication over effort, time and due anticipate to increased a reduction global in Global compliance (EU, U.S., India) drives higher compliance costs, ESG system investments, and operating expenses with convergence in sustainability standards and metrics. limited direct revenue impact. Rising AI-led energy demand We in our are energy increasing mix and the are share continuously of renewable enhancing energy Technology AI/ML operating workloads costs and are climate driving exposure higher energy . demand, increasing our energy efficiency measures, which are expected Risks to consumption reduce emissions . Green related coding to principles increased will energy enhance While direct exposure is moderate, rising energy use may pressure margins unless offset by efficiency gains. efficiency and reduce energy consumption. Transition in customer demand toward sustainable solutions regulatory Growing preference pressure and for low ESG carbon commitments solutions, . driven by We are developing strong capabilities in sustainability Market consulting, solutions, and green positioning IT, and carbon ourselves measurement to benefit from Risks High exposure to shifting customer demand, as sustainability is increasingly embedded in vendor selection and increasing digital transformation demand as sustainability becomes core to delivery expectations. competitiveness Drives both risk and if addressed, opportunity but supporting risking revenue revenue loss growth if not. and Failure to meet ESG and net zero commitments We are committed to making sustained and strong progress on significant greenhouse gas (GHG) emission Reputational reductions and higher adoption of renewable energy. Risks SBTi may lead aligned to revenue net zero loss, commitment fewer deal by wins, 2040; and failure adverse to deliver impacts Continued alignment with our science-based targets enhances our credibility and reduces exposure to on investor confidence and ESG ratings. long-term transition risk. - 26 2025 Risk Mapping – Severity Level : Lowest Low Medium High Highest REPORT Business Continuity and Resilience Planning In addition, we also have metrics and targets to track our goals Our ISO 22301-aligned Business Continuity Management are against articulated the Social on page and Governance 66. parameters. These details ANNUAL System (BCMS) ensures operational resilience. Initiatives like rainwater harvesting, stormwater management and climate-friendly climate risks buildings while to furthering combat heat our progress stress help toward us combat Net Zero . Future Outlook As the results of our climate risk assessment emerge, these INTEGRATED For details on the performance of Wipro’s assured ESG risks will be cascaded across functions to acknowledge the and climate-related parameters, refer to the Environment risk and build resilience. Our commitment to IFRS S2 will drive Sustainability section on page 72 of this Report. enhanced disclosures, ensuring transparency as we pursue WIPRO sustainable value creation and a resilient future.


LOGO

121 Key Financial and Market Risks Report Taxation Risks Our profits for the period earned from services delivered at client services provided in the United States and other regions, as well as premises outside India may be subject to taxation in the country purchases from overseas suppliers in various foreign currencies. where such services are performed. Most of our taxes paid in The exchange rate risk primarily arises from foreign exchange countries other than India can be applied as credits against our revenue, receivables, cash balances, forecasted cash flows, Indian tax liability, to the extent the same income is subject to payables and foreign currency loans and borrowings. A significant taxation in India. portion of our revenue is in U.S. Dollars, Pound Sterling, Euros, Currently, we benefit from certain tax incentives under Indian tax Australian Dollars and Canadian Dollars, while a substantial portion laws, including a tax holiday from payment of Indian corporate of our costs is incurred in Indian Rupees. income taxes for our businesses operating from designated SEZs. The exchange rates between the Indian Rupee and these currencies Wage Pressure have fluctuated significantly in recent years and may continue to fluctuate in the future. Any appreciation of the Indian Rupee against Our wage costs in India have historically been significantly lower these currencies could adversely affect our results of operations. than wage costs in the U.S. and Europe for comparably skilled Interest Rate Risk professionals, and this has been one of our competitive advantages. However, wage increases in India could erode this advantage and Interest rate risk primarily arises from floating-rate investments and adversely impact our profit margins. borrowings, including various revolving and other lines of credit. We have historically experienced significant competition for talent As our investments are predominantly short-term in nature, they are from multinational corporations with offshore operations in India, not exposed to significant interest rate risk. From time to time, we as well as from domestic organizations. As a result, we may need manage our net exposure to interest rate risk relating to borrowings to increase the levels of our employee compensation more rapidly by entering into interest rate swap agreements, which allows it than in the past to retain talent. In addition, once the effective date to exchange periodic payments based on a notional amount and is notified by the Government of India, we may also experience agreed-upon fixed and floating interest rates. increased costs in future years for employment and post-employment benefits in India as a result of the issuance of The Code Counterparty Risk on Social Security, 2020. Unless we continue to improve workforce Counterparty risk encompasses issuer risk on marketable securities, productivity and efficiency over the long term, wage increases may settlement risk on derivative and money market contracts and reduce our profit margins. Our profits could also be impacted by any credit risk on cash and time deposits. Issuer risk is minimized by inability to increase the proportion of less-experienced employees only buying securities in India that are at least AA-rated by Indian or to access talent from other cost-effective locations such as rating agencies. Settlement and credit risk are reduced by the Eastern Europe, China, and Southeast Asia. policy of entering into transactions with counterparties that are usually banks or financial institutions with acceptable credit ratings. Credit Risk Exposure to these risks is closely monitored and maintained within Credit risk arises from the possibility that customers may be predetermined parameters. There are limits on credit exposure unable to meet their obligations as agreed. To manage this risk, to any financial institution. The limits are regularly assessed and we periodically assess the credit rating and financial reliability of determined based on credit analysis, including financial statements customers, considering the financial condition, current economic and capital adequacy ratio reviews. trends, forward-looking macroeconomic information, analysis of historical bad debts and ageing of accounts receivable. No single Liquidity Risk customer accounted for more than 10% of the accounts receivable Liquidity risk is defined as the risk that we will not be able to as of March 31, 2026, or revenues for the year ended March 31, settle or meet our obligations on time or at a reasonable price. 2026. There is no significant concentration of credit risk. Our corporate treasury department is responsible for liquidity and funding as well as settlement management. In addition, Foreign Currency Risk processes and policies related to such risks are overseen by senior We operate globally, and a significant portion of our business is management. Management monitors the Company’s net liquidity transacted in several currencies. Consequently, we are exposed position through rolling forecasts based on expected cash flows. to foreign exchange risk through payments received for sales and As of March 31, 2026, our cash and cash equivalents are held with major banks and financial institutions.


LOGO

122 STATUTORY REPORTS AND FINANCIAL STATEMENTS BOARD’S REPORT Dear Members, It gives me immense pleasure to present the 80th Board’s Report of Wipro Limited (the “Company”), on behalf of the Board of Directors (the “Board”), along with the Balance Sheet, Profit and Loss account and Cash Flow statements, for the financial year ended March 31, 2026. I. Financial Performance On a consolidated basis, your Company’s sales increased to H 926,240 Million for the current year as against H 890,884 Million in the previous year, recording an increase of 3.97%. Your Company’s net profit increased to H 132,655 Million for the current year as against H 132,180 Million in the previous year, recording an increase of 0.36%. On a standalone basis, your Company’s sales increased to H 713,451 Million for the current year as against H 685,750 Million in the previous year, recording an increase of 4.04%. Your Company’s net profit increased to H 121,296 Million in the current year as against H 109,131 Million in the previous year, recording an increase of 11.15%. Key highlights of the financial performance of your Company for the financial year 2025-26 are provided below: (C in Millions) Particulars Standalone Consolidated 2025-26 2024-25 2025-26 2024-25 Sales 713,451 685,750 926,240 890,884 Other Income 47,491 39,477 38,737 38,840 Operating Expenses (601,890) (579,102) (791,812) (755,021) Share of net profit/(loss) of associates — 257 254 accounted for using the equity method Profit before Tax 159,052 146,125 173,422 174,957 Provision for Tax (37,756) (36,994) (40,767) (42,777) Net profit for the year 121,296 109,131 132,655 132,180 Other comprehensive (loss)/income (8,665) 557 35,522 4,148 for the year Total comprehensive income for the 112,631 109,688 168,177 136,328 year Total comprehensive income for the 26 period attributable to: - 2025 Non-controlling interests — 927 848 Equity holders 112,631 109,688 167,250 135,480 Appropriations REPORT Dividend 115,206 62,750 115,206 62,750 Report Equity Share Capital 20,977 20,944 20,977 20,944 ANNUAL Earnings per equity share —Basic 11.59 10.44 12.60 12.56 - Diluted 11.55 10.40 12.56 12.52 Note: The standalone and consolidated financial statements of the Company for the financial year INTEGRATED ended March 31, 2026, have been prepared in accordance with the Indian Accounting Standards (Ind AS) as notified by the Ministry of Corporate Affairs and as amended from time to time. The comparative standalone figures for the previous year have been restated, as detailed in the note WIPRO Board’s under the section ‘Transfer to Reserves’.


LOGO

123 Transfer to Reserves During the financial year under review, there was an increase in the paid-up equity share capital of the Appropriation to Reserves for the financial year ended Company. Details are provided below: March 31, 2026, as per standalone and consolidated financial statements are as follows: Particulars No. of Shares Amount in H (H in Millions) Paid up equity share capital 10,472,136,049 20,944,272,098 as on April 1, 2025 Particulars Standalone* Consolidated** Equity Shares allotted 16,276,409 32,552,818 Net profit for the year 121,296 132,655 pursuant to exercise of stock Balance of Reserves at the 613,930 802,697 options* beginning of the year Paid up equity share capital 10,488,412,458 20,976,824,916 Balance of Reserves at the 615,820 859,206 as on March 31, 2026 end of the year *The equity shares allotted ranked pari-passu with the existing equity *Pursuant to the Order dated June 6, 2025 of the Hon’ble National shares of the Company. Company Law Tribunal, Bengaluru Bench, the scheme of amalgamation for the merger of the wholly owned subsidiaries, namely Wipro HR Subsidiaries, Associate and Joint venture Services India Private Limited, Wipro Overseas IT Services Private Limited, Wipro Technology Product Services Private Limited, Wipro Trademarks Holding Limited and Wipro VLSI Design Services India As on March 31, 2026, your Company had 148 subsidiaries, Private Limited, with and into Wipro Limited, was approved. Under the 1 associate and 1 joint venture. In accordance with scheme, the appointed date is April 1, 2025. The Scheme has been Section 129(3) of the Companies Act, 2013, a statement accounted for under the Pooling of Interests Method prescribed under Appendix C to Ind AS 103, Business Combinations. Accordingly, prior containing salient features of the financial statements of period figures have been restated to give effect to the merger as if it the subsidiary companies in Form AOC-1 is provided at had occurred from the beginning of the preceding financial period, i.e., page 409 to 415 of this Annual Report. The statement also April 1, 2024. Consequently, the carrying values of the assets, liabilities and reserves provides subsidiaries incorporated during the financial year, details of performance and financial position of each of these entities, as appearing in the consolidated financial statements of Wipro Limited, have been recognized in the standalone financial of the subsidiaries, associate and joint venture. There has statements of Wipro Limited with effect from April 1, 2024. been no material change in the nature of the business of **Excluding non-controlling interest. the subsidiaries. The details pertaining to restructuring activities during the financial year are provided on For complete details on movement in Reserves and Surplus page 127 to 128 of this Annual Report. during the financial year ended March 31, 2026, please refer to the Statement of Changes in Equity included in Audited financial statements together with related the Standalone and Consolidated financial statements information and other reports of each of the subsidiary on page 206 to 208 and 312 to 315 respectively of this companies are available on the website of the Company Annual Report. at https://www.wipro.com/investors/annual-reports/. Share Capital Your Company, in the ordinary course of business and based on funding requirements, provides financial support As on March 31, 2026, your Company’s paid-up equity to its subsidiaries through equity, loans, guarantees share capital stood at H 20,977 Million consisting of and/or other appropriate means to meet their working 10,488,412,458 equity shares of H 2 each. capital requirements.


LOGO

124 STATUTORY REPORTS AND FINANCIAL STATEMENTS BOARD’S REPORT In terms of the Company’s Policy on determining We believe AI is a transformative force that will material subsidiary, during the financial year ended augment human capabilities and pave the way March 31, 2026, Wipro, LLC was determined as a towards new AI-first business models, improve material subsidiary whose net worth exceeds 10% business productivity and enhance operational of the consolidated net worth of the Company in the efficiency. Your Company’s goal is to be an “AI-first” immediately preceding financial year. and “AI in everything” Company helping transform Further details on the subsidiary monitoring framework ourselves and our clients. have been provided as part of the Corporate Our IT Services segment provides a range of Governance report. AI-powered IT and IT-enabled services including AI advisory, industry & functional consulting, AI native Particulars of Loans, Guarantees and development, customer centric design, modernization, Investments custom application development, infrastructure Pursuant to Section 186 of the Companies Act, 2013 services, cybersecurity services, data and analytics and Schedule V of the Securities and Exchange services, business process services, research and Board of India (Listing Obligations and Disclosure development, hardware and software design. Requirements) Regulations, 2015, as amended Our IT Products segment provides a range of third-from time to time (“Listing Regulations”), disclosure party IT products including computing platforms and on particulars relating to Loans, Guarantees storage, networking solutions, enterprise information and Investments are provided as part of the security, and software products such as databases financial statements. and operating systems. These products allow us to offer comprehensive IT system integration services as a complement to our IT services offerings. Our II. Business and Operations focus continues to be on consulting and digital Celebrating 80 years of innovation, your Company engagements while taking a more selective approach is a purpose-driven, global technology services and to bidding for system integration engagements. consulting firm employing over 240,000 experts in 65 countries across six continents, helping customers, Business Strategy colleagues, and communities thrive in an ever- Our vision is to be a trusted partner for our clients, changing world. guiding them through their transformation journey We are recognized globally for our strong commitment with a consulting-led and AI-powered approach, to improving the communities we live and work in. The and empowering them to become leaders in economic interest of two-thirds of the Company’s their industries. shares is earmarked for philanthropy through the Azim We have defined five strategic priorities to accelerate Premji Foundation working towards developing a just, growth in the IT Services segment: 26 equitable, humane, and sustainable society. We are—globally appreciated for our unwavering commitment 1. building large accounts in profitable markets, 2025 prioritized sectors; to sustainability. As a founding member of ‘Transform to Net Zero’, the Company aims to achieve the goal of 2. sourcing, shaping and winning large deals with a REPORT zero-carbon emissions worldwide by 2040. consulting-led, AI-Powered approach; 3. differentiating with Wipro Intelligence™; ANNUAL As part of our solutions, we bring together our deep 4. building talent at scale; and industry knowledge, technology expertise, best-of-breed partners and start-ups, and hyper-scaler 5. the five pillars of client centricity. Our growth will capabilities to solve the most complex problems for be supported by our focus on AI and Mergers INTEGRATED our clients. and Acquisitions (“M&A”). WIPRO


LOGO

125 Further information on your Company’s IT services and AI industrialization with domain-centric platforms. Future products offerings, industry and business overview are growth will hinge on AI readiness, deep domain expertise, presented as part of the Management Discussion and and access to niche skills rather than volume-based hiring. Analysis Report (“MD & A Report”) from page 40 onwards The NASSCOM Report estimates Engineering and of this Annual Report. R&D (“ER&D”) services to grow by 7.7% year-over-year in financial year 2025-26. This growth is driven by Material Changes and Commitments the modernization of ER&D stack through platform-affecting the Business Operations and driven, software-enabled models, alongside increased Financial Position of the Company investment in semiconductors and advanced technologies. ER&D services expanded across the full phygital product The business environment demonstrated resilience lifecycle with co-creation of physical IP via digital twins, in the financial year 2025-26, as economic growth Internet of Things (“IoT”) and Generative AI (“GenAI”) to moderated amid declining inflation and evolving trade drive design-to-manufacturing transformation. The focus and geopolitical dynamics. While inflation eased across will shift from scale to deeper engineering expertise and most economies, services inflation remained sticky in IP ownership, with growth powered by domain-specific certain markets, resulting in a gradual and uneven pace centers of excellence, pod-based delivery, and reusable of monetary policy normalization. Growth in advanced accelerators for faster time-to-market. economies remained modest, while emerging economies continued to outperform supported by capital flows, local Global IT services’ spending will accelerate to 4.2% policies and domestic demand. Supply chains remained year-over-year, driven by rising AI investments focused under strain due to ongoing geopolitical fragmentation, on scalable deployments and ease in tariff and trade trade and tariff frictions. pressures. Enterprises are moving beyond AI pilots towards phased GenAI and agentic scaling, anchored Enterprises adopted a cautious approach to discretionary in measurable outcomes. Growth will be sector-specific spending, prioritizing cost discipline, productivity driven by depth of industry expertise, advanced AI improvement, and risk management. Clients increasingly focused on cost takeout initiatives, vendor consolidation, capabilities and ability to attract AI native talent. Industry AI-led transformation, which impacted decision cycles and strategies are likely to consolidate around core strengths deal structures. Demand for technology-led transformation while differentiating through platform led offerings, remained resilient where investments were linked to services-to-solutions models, AI-led delivery models operational efficiency, regulatory compliance, resilience, with agentic abilities, outcome based pricing, micro and customer experience, prioritizing investments in verticalization, and selective M&A. Hiring will shift from digital, cloud, and AI technologies. volume to skills, emphasizing AI fluency, domain expertise, Additional information regarding your Company’s and productivity-based workforce models. business operations and financial position are provided Global IT service providers are equipped to support as part of the MD & A Report from page 40 onwards of this enterprises across industries with a wide range of Annual Report. technology and business process services powered by AI across advisory, application development, customer Outlook centric design, cybersecurity, cloud infrastructure, data and analytics, engineering and research and According to the NASSCOM Report, revenue for Indian development (“R&D”). We expect the IT services industry IT services sector is expected to grow 4.1% year-over- to continue supporting enterprises across key areas year in financial year 2025-26. Growth is being driven such as enterprise AI and data modernization, scaling AI by enterprise-wide AI adoption, data center investments adoption, cost optimization, vendor consolidation, cyber and the expansion of Global Capability Centers (“GCCs”). resilience, process re-engineering, customer experience, Enterprises are embedding AI across operations, innovation in products, services and talent strategies for increasing data center capacity demand, and pivoting to an AI-first world.


LOGO

126 STATUTORY REPORTS AND FINANCIAL STATEMENTS BOARD’S REPORT Management Discussion and Analysis and Dividend Distribution policy is available on the Report Company’s website at https://www.wipro.com/content/ dam/nexus/en/investor/corporate-governance/ In terms of Regulation 34(2)(e) of the Listing Regulations, policies-and-guidelines/ethical-guidelines/capital-your Company’s MD & A report, capturing your allocation-and-dividend-distribution-policy.pdf. Company’s performance, industry trends and other Pursuant to the approval of the Board on July 17, material changes with respect to your Company and its 2025, your Company declared an interim dividend subsidiaries, wherever applicable, are presented from of H 5 per equity share of face value of H 2 each, to page 40 onwards of this Annual Report. The MD&A shareholders whose names were appearing in the report incorporates the salient features of Integrated register of members as on July 28, 2025, being the Reporting prescribed by the International Integrated record date fixed for this purpose, after deduction Reporting Council (“IIRC”) . of applicable taxes. The dividend was paid on The MD & A Report provides a consolidated perspective August 8, 2025 and the total net cash outflow was of economic, social and environmental aspects material 52,413.9 Million, resulting in a H dividend payout of to your Company’s strategy and its ability to create 43.2% of the standalone profits of the Company. and sustain value to its key stakeholders and includes Further, your Company, on January 16, 2026, declared aspects of reporting. an interim dividend of H 6 per equity share of face Business Responsibility and Sustainability value of H 2 each, to shareholders whose names were Report appearing in the register of members as on January 27, 2026, being the record date fixed for this purpose, Pursuant to Regulation 34(2)(f) of the Listing after deduction of applicable taxes. The dividend was Regulations and relevant circulars issued from time paid on February 9, 2026 and the total net cash outflow to time, your Company provides the prescribed was H 62,923.2 Million, resulting in a dividend payout disclosures in new reporting requirements on of 51.9% of the standalone profits of the Company. Environmental, Social and Governance (“ESG”) The aggregate interim dividend of H 11 per equity parameters through the Business Responsibility share (H 5 declared in July 2025 and H 6 declared and Sustainability Report (“BRSR”) which includes in January 2026) shall be the final dividend for the performance against the nine principles of the National financial year 2025-26. Guidelines on Responsible Business Conduct which are divided into essential and leadership indicators. Your Company is in compliance with its Capital The BRSR is provided from page 514 onwards of this Allocation and Dividend Distribution Policy as Annual Report. approved by the Board. The Company has undertaken an independent Buyback assurance of the BRSR for financial year 2025-26. The BRSR along with the assurance statement provided Pursuant to the approval of the Board at its—26 by M/s. Deloitte Haskins & Sells LLP (Assurance meeting held on April 16, 2026 and approval of the 2025 Provider) confirming reasonable assurance of shareholders by way of a special resolution dated Core attributes of the Business Responsibility and May 21, 2026, passed through postal ballot by REPORT Sustainability Report of the Company for financial year e-voting, your Company proposed to buyback up 2025-26 forms part of this Annual Report. to 60,00,00,000 (Sixty Crore) fully paid-up equity ANNUAL shares of H 2 each of the Company being 5.72% of III. Material Events during the Year the total paid-up equity share capital of the Company at a price of H 250 (Rupees Two Hundred and Fifty Dividend only) per Equity Share, for an aggregate amount INTEGRATED not exceeding H 1,50,00,00,00,000 (Rupees Fifteen Pursuant to Regulation 43A of the Listing Regulations, Thousand Crore only). The buyback is proposed to be the Board has approved and adopted a Dividend made from all existing shareholders of the Company WIPRO Distribution Policy. The Company’s Capital Allocation as on June 5, 2026, being the record date for the


LOGO

127 buyback, on a proportionate basis under the tender offer b) In September 2025, Grove Holdings 2 S.à r.l. route in accordance with the provisions of the Securities (Luxembourg) transferred 100% shareholding in and Exchange Board of India (Buy-back of the Securities) Capco Consulting Middle East FZE (UAE) to Wipro IT Regulations, 2018, the Companies Act, 2013 and rules Services UK Societas (UK). made thereunder. c) In December 2025, Wipro Digital Inc. (USA) merged Acquisitions, Divestments, Investments with Wipro Connected Services, Inc. (Formerly and Mergers known as Harman Connected Services, Inc.) (USA). d) In December 2025, Wipro Limited transferred its Mergers and acquisitions are an integral part of your entire holding in Drivestream India Private Limited Company’s business strategy because acquisitions help (India) to Drivestream Inc. (USA). it leapfrog in strategic areas and capture high-demand e) In March 2026, Rizing Consulting USA, LLC (USA) high-potential market opportunities. merged with Rizing LLC (USA). Your Company’s goal is to fast-track capability building in f) In March 2026, Capco RISC Consulting LLC (USA) emerging areas and accelerate its access and footprint in merged with The Capital Markets Company, LLC identified markets. In the last few years, your Company (USA). had concluded several acquisitions in the US, Europe and APMEA. These acquisitions have strengthened your g) In March 2026, Cardinal US Holdings, Inc. (USA) Company’s local presence, enhanced its capabilities, merged with Wipro IT Services, LLC (USA). and significantly improved its positioning in key markets h) In March 2026, Cardinal US Holdings, Inc. (USA) and segments. transferred its entire shareholding in Capco Consulting Details of the transactions completed by your Company Services LLC (USA) to The Capital Markets Company, during the financial year ended March 31, 2026 are LLC (USA). listed below: 3. Incorporation: 1. Acquisitions: a) In May 2025, Wipro (Tianjin) Limited (China) was In December 2025, the Company (through its incorporated as a step-down subsidiary. subsidiaries) acquired 100% shareholding of Wipro Connected Services, Inc. (Formerly known as b) In August 2025, Wipro Digital Inc. (USA) was Harman Connected Services, Inc.) (USA) along with incorporated as a wholly-owned subsidiary. its subsidiaries and certain other assets. c) In January 2026, Wipro Business Services LLC (USA) 2. Restructuring and Scheme of Arrangement: was incorporated as a step-down subsidiary. a) In June 2025, the following wholly-owned 4. De-registration/Liquidation: subsidiaries merged with and into Wipro Limited: a) In July 2025, Wipro Holdings Hungary Korlátolt i. Wipro HR Services India Private Limited Felelõsségû Társaság (Hungary), step-down subsidiary ii. Wipro Overseas IT Services Private Limited of the Company has been voluntarily liquidated. iii. Wipro Technology Product Services Private b) In October 2025, Aasonn Philippines Inc. (Philippines), Limited step-down subsidiary of the Company has been iv. Wipro Trademarks Holding Limited voluntarily dissolved. v. Wipro VLSI Design Services India Private Limited


LOGO

128 STATUTORY REPORTS AND FINANCIAL STATEMENTS BOARD’S REPORT 5. Strategic Investments: the Board is comprised of two Executive Directors, six Non-Executive Independent Directors and one Wipro Ventures, the strategic investment arm of Non-Executive, Non-Independent Director. the Company, has continued to invest in early to mid stage enterprise software companies. The definition of Independence of Directors is derived These include startups that help enterprises from Regulation 16 of the Listing Regulations, the scale their AI adoption as well as improve their New York Stock Exchange (“NYSE”) Listed Company cybersecurity posture. Manual and Section 149(6) of the Companies Act, 2013. As of March 31, 2026, Wipro Ventures has The Company has received necessary declarations invested in 42 companies, out of which it under Section 149(7) of the Companies Act, 2013 has exited 16 companies through successful and Regulation 25(8) of the Listing Regulations, M&A transactions. In addition to direct equity from all the Independent Directors stating that they investments, Wipro Ventures has invested in meet the prescribed criteria for independence. 11 enterprise-focused venture funds in India, After undertaking the requisite assessment and the US, and Israel including Sapphire Ventures, upon examination of the relationships disclosed, B Capital, BoldStart Ventures, Glilot Capital the following Non-Executive Directors continued as Partners, GTM Fund, Nexus Venture Partners, Independent Directors: Pi Ventures, Sorenson Ventures, SYN Ventures, 1. Mr. Deepak M. Satwalekar (DIN: 00009627) TLV Partners and Work-Bench Ventures. 2. Dr. Patrick J. Ennis (DIN: 07463299)* IV. Governance and Ethics 3. Mr. Patrick Dupuis (DIN: 07480046)* Corporate Governance 4. Ms. Tulsi Naidu (DIN: 03017471) Your Company believes in adopting best practices 5. Ms. Päivi Rekonen (DIN: 09669696) of corporate governance. Corporate governance 6. Mr. N. S. Kannan (DIN: 00066009) principles are enshrined in the Spirit of Wipro, *Dr. Patrick J. Ennis and Mr. Patrick Dupuis, completed their tenure which form the core values of Wipro. These guiding as Independent Directors of the Company with effect from close of principles are also articulated through the Company’s business hours on March 31, 2026. Code of Business Conduct, Corporate Governance During the year under review, the Non-Executive Guidelines, Charter of various sub-committees and Directors of the Company had no pecuniary relationship Disclosure policy. or transactions with the Company, other than sitting fees, As per Regulation 34 of the Listing Regulations, commission and reimbursement of expenses, if any. a separate section on corporate governance In the opinion of the Board, all our Directors possess practices followed by your Company, together with requisite qualifications, experience, expertise and a certificate from M/s. V. Sreedharan & Associates, hold high standards of integrity. List of key skills, 26 Practicing Company Secretaries, on compliance - with corporate governance norms under the Listing expertise, and core competencies of the Board is 2025 provided at page 162 of this Annual Report. Regulations, is provided from page 158 onwards of this Annual Report. REPORT Meetings of the Board ANNUAL Board of Directors The Board met six times during the financial year 2025-26 on April 15-16, 2025, May 22, 2025, July 16- Board’s Composition and Independence 17, 2025, October 15-16, 2025, January 15-16, 2026 and Your Company’s Board consists of global leaders March 16, 2026. The necessary quorum was present for INTEGRATED and visionaries who provide strategic direction and all the meetings. The maximum interval between any guidance to the organization. As on March 31, 2026, two meetings did not exceed 120 days. WIPRO


LOGO

129 Directors and Key Managerial Personnel Committees of the Board Your Company’s Board has the following committees: Completion of Tenure 1. Audit, Risk and Compliance Committee is also the Dr. Patrick J. Ennis and Mr. Patrick Dupuis completed their tenure as Independent Directors of the Company with Risk Management Committee effect from close of business hours as on March 31, 2026. 2. Nomination and Remuneration Committee, which also Appointment/Re-appointment acts as Corporate Social Responsibility Committee Pursuant to the recommendation of the Nomination and 3. Administrative and Shareholders/Investors Remuneration Committee, the Board of Directors on Grievance Committee (Stakeholders Relationship March 5, 2026, approved the appointment of Ms. Laura Committee) Marie Miller (DIN: 11546063) as an Additional Director in Details of terms of reference of the Committees, the capacity of Independent Director of the Company for Committee membership changes, and attendance of a period of 5 years with effect from April 1, 2026 to March Directors at meetings of the Committees are provided in 31, 2031, subject to the approval of shareholders. The the Corporate Governance report from page 167 to 171 said appointment was approved by the Members of the of this Annual Report. Company by way of a special resolution dated May 21, 2026, passed through postal ballot by e-voting. Board Evaluation Pursuant to the recommendation of the Nomination and In accordance with the requirements under the Companies Remuneration Committee, the Board of Directors, at Act 2013, Listing Regulations, SEBI Guidance Note on its meeting held over April 15-16, 2026, approved the Board Evaluation, and Company’s Corporate Governance re-appointment of Ms. Tulsi Naidu as an Independent Director of the Company for a second term of 5 years Guidelines, an annual performance evaluation of the with effect from July 1, 2026 to June 30, 2031, subject to Board, its Committees, and individual Directors was the approval of shareholders. The said appointment was undertaken for financial year 2025-26. The process was approved by the Members of the Company by way of a led by the Chair of the Nomination and Remuneration special resolution dated May 21, 2026, passed through Committee and the Lead Independent Director. postal ballot by e-voting. Retirement by Rotation Criteria for evaluation The process comprised a comprehensive evaluation Pursuant to the provisions of Section 152(6) of the through a structured framework focusing on key Companies Act, 2013 and the Articles of Association of aspects of governance and effectiveness. It covered the the Company, Mr. Azim H. Premji will retire by rotation adequacy of Board composition, including diversity, at the 80th Annual General Meeting (“AGM”) and being independence and alignment of skills, as well as the eligible, has offered himself for re-appointment. effectiveness of leadership and Committee structures. The evaluation also reviewed the functioning of the Key Managerial Personnel Board, including the quality of meetings, effectiveness Pursuant to the provisions of Sections 2(51) and 203 of deliberations and decision-making, and the adequacy of the Companies Act, 2013, Mr. Srinivas Pallia, Chief and timeliness of information flow, along with Board Executive Officer and Managing Director (“CEO & MD”), dynamics such as communication, relationships and Ms. Aparna Iyer, Chief Financial Officer (“CFO”) and engagement with Management, and assessed the Mr. M. Sanaulla Khan, Company Secretary continue to be Board’s oversight of strategy, risk management, business the Key Managerial Personnel (“KMP”) of the Company performance, as well as its role in talent management and as on March 31, 2026. succession planning.


LOGO

130 STATUTORY REPORTS AND FINANCIAL STATEMENTS BOARD’S REPORT In addition, the process included an assessment Policy on Director’s Appointment of the effectiveness of Board Committees, their and Remuneration contribution to Board deliberations, and the functioning of individual Committees, together with The Board, on the recommendation of the Nomination peer evaluation on Directors’ participation, expertise and Remuneration Committee, has framed the policy and overall contribution. for selection and appointment of Directors including determining qualifications and independence of a Director, KMP, Senior Management Personnel Outcome of evaluation (“SMP”) and their remuneration as part of its charter The Nomination and Remuneration Committee and other matters provided under Section 178(3) of and the Board reviewed the evaluation outcome in the Companies Act, 2013. April 2026. The key highlights of the evaluation are Pursuant to Section 134(3) of the Companies Act, listed below: 2013, the Nomination and Remuneration policy of the a. The review highlighted strong confidence Company which lays down the criteria for determining in the Board’s integrity, independence and qualifications, competencies, positive attributes collaborative culture, and expressed appreciation and independence for appointment of Directors for the Chair’s decisive and inclusive leadership, and relating to remuneration of Directors, KMP and while reaffirming strong overall performance with other employees is available on the Company’s consistently high ratings across key parameters, website at https://www.wipro.com/content/dam/ including governance and financial oversight, nexus/en/investor/corporate-governance/policies-Board culture and openness of discussions, and-guidelines/ethical-guidelines/wipro-limited-effectiveness of Committees, and the quality of remuneration-policy.pdf. Board processes such as meetings, information There has been no change in the policy during flow, preparedness and follow-up on prior the year. year feedback. We affirm that the remuneration paid to Directors, b. The evaluation identified areas where further KMPs, SMPs and other employees is in accordance strengthening would be beneficial. These with the remuneration policy of the Company. included deepening strategic dialogue on long-term business models, enhancing risk discussions Policy on Board Diversity at the Board level, and encouraging a greater emphasis on active discussion and engagement The Board, on the recommendation of the Nomination during meetings alongside the presentations. and Remuneration Committee, has framed a policy for Board Diversity which lays down the criteria c. The Board has outlined a set of actions to build for appointment of Directors on the Board of your on these findings. Structured strategy sessions Company and guides the organization’s approach to are planned to sharpen focus on long term 26 Board Diversity. - priorities, while executive sessions and informal 2025 interactions will remain an important way to Your Company believes that Board diversity basis strengthen alignment with Management. The the gender, race and age will help build diversity REPORT Board also intends to place greater emphasis of thought and will set the tone at the top. A mix of on fostering richer dialogue during meetings, individuals representing different geographies, ANNUAL ensuring that discussions are both forward cultures, industry experience, qualification and skill INTEGRATED looking and constructive. sets will bring in different perspectives and help the WIPRO


LOGO

131 organization grow. The Board of Directors is responsible and the status of the risk treatment plans are reviewed by for reviewing the policy from time to time. Policy on Board Management on a periodic basis. Diversity has been placed on the Company’s website at Your Company assesses and governs the cybersecurity https://www.wipro.com/content/dam/nexus/en/investor/ program using select industry best practices and corporate-governance/policies-and-guidelines/ethical-frameworks including but not limited to, those from the guidelines/policy-on-appointment-of-directors-and-International Organization for Standardization (“ISO”) board-diversity.pdf. and the National Institute of Standards and Technology (“NIST”). Risk Management In view of increased cyberattack scenarios, your Your Company has implemented an Enterprise Risk Company’s cybersecurity maturity is reviewed periodically Management (“ERM”) framework based on globally and the processes, technology controls are enhanced in recognized standards and industry best practices. The line with the threat landscape. Your Company’s technology ERM framework is administered by the Audit, Risk and environment is enabled with real time security monitoring Compliance Committee. The ERM framework enables and layered security controls across end user machines, business to ensure strong business performance by network, applications and data. promoting a risk resilient culture, proactive management Cybersecurity is a key aspect of your Company’s risk of emerging risks and is supported by technology. management processes and an area of focus for your The framework governs all categories of risks, the Company’s Board of Directors and Management. The effectiveness of controls that have been implemented to Audit, Risk and Compliance Committee regularly reviews prevent risks and continuous improvement of systems and and discusses the Company’s cybersecurity framework processes to proactively identify and mitigate such risks. and programs, the status of projects, results from third-Gartner, an independent analyst firm, has stated that: party assessments, and any material cybersecurity “Wipro has a strong focus on risk management, driven by incidents, to strengthen your Company’s cybersecurity its office of the Chief Risk & Assurance Officer. They have posture with its Chief Information Security Officer, Chief a comprehensive risk assessment model that provides Information Officer, Chief Operating Officer, and Chief a 360-degree view of risks”. Your Company was also Risk & Assurance Officer. The Audit, Risk and Compliance recognized as the Masters of Risk in IT/ITES Sector by the Committee also reviews the implementation and CNBC – ICICI Lombard India Risk management awards. effectiveness of the Company’s controls to monitor and For more details on the Company’s Risk management mitigate cybersecurity risks. In addition, your Company’s framework, please refer to page 112 to 117 of this Board of Directors receives periodic updates, regarding Annual Report. cybersecurity programs, as appropriate. Cybersecurity Compliance Management Framework Cybersecurity risk management is an integral part of your The Board has approved a Global Statutory Compliance Company’s overall enterprise risk management program. Policy providing guidance on broad categories of Your Company’s cybersecurity risk management program applicable laws and process for monitoring compliance. is managed by its Chief Information Security Office In furtherance to this, your Company has instituted function. Your Company’s cybersecurity risk management an online compliance management system within the framework is defined and implemented to identify, assess, organization to monitor compliances and provide updates evaluate, treat, monitor, and report cyber risks across to the senior management and Board on a periodic basis. your IT infrastructure, applications, platforms, intellectual The Audit, Risk and Compliance Committee and the property, critical processes, technology solutions and Board periodically monitor status of compliances with third-party services. Cybersecurity risk assessment results applicable laws.


LOGO

132 STATUTORY REPORTS AND FINANCIAL STATEMENTS BOARD’S REPORT Code for Prevention of Insider Trading Company against the errant employees. Mechanism followed under the Ombuds process has been Your Company has adopted a Code of Conduct to displayed on the Company’s intranet and website regulate, monitor and report trading by designated at https://www.wipro.com/investors/corporate-persons and their immediate relatives as per the governance/policies-and-guidelines/. requirements under the Securities and Exchange Board of India (Prohibition of Insider Trading) Regulations, All complaints received through Ombuds process 2015 (“PIT Regulations”). This Code, inter alia, lays and investigative findings are reviewed and approved down the procedures to be followed by designated by the Chief Ethics Officer. All employees and persons while trading/dealing in Company’s shares stakeholders can also register their concerns either and sharing Unpublished Price Sensitive Information by post/courier to the Company’s registered office or (“UPSI”). The Code covers the Company’s obligation by sending an email to ombuds.person@wipro.com to maintain a structured digital database, mechanism or through web-based portal at www.wiproombuds. for prevention of insider trading and handling of UPSI, com. Following an investigation of the concerns and the process to familiarize with the sensitivity of received, a decision is made by the appropriate UPSI. Further, it also includes Code for practices and authority on the action to be taken basis the findings procedures for fair disclosure of UPSI which has been of such investigation. In case the complainant is non-made available on the Company’s website at https:// responsive or fails to provide requisite data necessary www.wipro.com/content/dam/nexus/en/investor/ to initiate the investigation for more than 15 days, the corporate-governance/policies-and-guidelines/ concern may be closed without further action. ethical-guidelines/12765-code-of-practices-and-procedures-for-fair-disclosure-of-upsi.pdf. The table below provides details of complaints received/disposed during the financial year Vigil Mechanism 2025-26: Your Company has adopted an Ombuds process as a channel for receiving and redressing complaints from No. of complaints pending at the beginning of 92 employees, Directors and other individuals associated financial year with the Company, as per the provisions of Section No. of complaints filed during the financial year 1129 177(9) and (10) of the Companies Act, 2013, Regulation No. of complaints disposed during the financial 1070 22 of the Listing Regulations and Regulation 9A of the year PIT Regulations. No. of complaints pending at the end of the 151 Under this policy, your Company encourages its financial year employees to report any incidence of fraudulent All cases were investigated, and actions taken as financial or other information to the stakeholders, deemed appropriate. Based on self-disclosure data, reporting of instance(s) of leak or suspected leak 25% of these cases were reported anonymously. - 26 of UPSI, and any conduct that results in violation of The top categories of complaints were relating to 2025 the Company’s code of business conduct, to the Management (on an anonymous basis, if employees inconsistent workplace conduct at 36%, followed by internal policy non-adherence at 32% and other so desire). Further, your Company has prohibited REPORT impropriety at 15%. Commensurate actions as per discrimination, retaliation, or harassment of any kind the disciplinary code of the Company were initiated against any employee who reports under the Vigil against such employees while in other cases it was ANNUAL Mechanism or participates in the investigation. resolved through engagement of other internal Awareness of policies is created by, inter alia, sending functions or mediation or closed without any action INTEGRATED group mailers highlighting actions taken by the since they were unsubstantiated. WIPRO


LOGO

133 The Audit, Risk and Compliance Committee periodically Credit Rating reviews the functioning of this mechanism. No personnel of the Company were denied access to the Audit, Risk and Credit Rating details are available under the heading Compliance Committee. “Other Disclosures” in the Corporate Governance Report on page 182 of this Annual Report. Information Required under The Sexual Harassment of Women at Workplace Related Party Transactions (Prevention, Prohibition and Redressal) Your Company has historically adopted the practice of Act, 2013 undertaking related party transactions only in the ordinary and normal course of business and at arm’s length as Your Company is committed to providing a safe, non- part of its philosophy of adhering to highest ethical discriminatory and non-hostile work environment that is standards, transparency, and accountability. In line with free from any form of intimidation or harassment that is the provisions of the Companies Act, 2013 and the Listing sexual in nature. This is to maintain a workplace where Regulations, the Board has approved a policy on related all the employees are considered equal and where the party transactions, a copy of which has been placed on the dignity of each employee is respected and protected. Company’s website at https://www.wipro.com/content/ Your Company has constituted an Internal Complaints dam/nexus/en/investor/corporate-governance/policies-Committee under the Sexual Harassment of Women at and-guidelines/ethical-guidelines/Policy-for-related-Workplace (Prevention, Prohibition and Redressal) Act, party-transactions.pdf. Prior approval of the Audit, Risk 2013 and has a policy and framework for employees and Compliance Committee and the Board is obtained to report sexual harassment cases at workplace. Your for all related party transactions. The details of all existing Company’s process ensures complete anonymity and related party transactions are placed on a quarterly basis confidentiality of information. Adequate workshops and before the Audit, Risk and Compliance Committee and the awareness programmes against sexual harassment are Board for review. conducted across the organization. All contracts, arrangements and transactions entered by the Company with related parties during financial year The table below provides details of complaints 2025-26 were in the ordinary course of business and on received/disposed during the financial year an arm’s length basis. There were no material contracts, 2025-26: arrangements or transactions entered during financial year 2025-26 that fall under the scope of Section 188(1) No. of complaints at the beginning of financial year 36 of the Companies Act, 2013. Accordingly, the prescribed No. of complaints filed during the financial year 205 Form AOC-2 is not applicable to the Company for the financial year 2025-26 and hence does not form part of No. of complaints disposed during the financial year 217 this report. No. of complaints pending at the end of financial year 24 No. of cases pending for more than ninety days 0 Details of transaction(s) of your Company with entity(ies) Note: The figures in the table represent consolidated group level data belonging to the promoter/promoter group which hold(s) more than 10% shareholding in the Company as required covering all gender categories and global workplace locations for the financial year. under Para A Schedule V of the Listing Regulations are provided as part of the financial statements. The policy on prevention of sexual harassment has been placed on the Company’s website at https://www. There were no material transactions entered into with wipro.com/content/dam/nexus/en/investor/corporate- related parties during the period under review, which may governance/policies-and-guidelines/ethical-guidelines/ have had any potential conflict with the interests of the global-policy-on-prevention-of-sexual-harassment.pdf. Company at large.


LOGO

134 STATUTORY REPORTS AND FINANCIAL STATEMENTS BOARD’S REPORT Pursuant to Regulation 23(9) of the Listing Regulations, Wipro Employee Stock Option Plans/ your Company has filed the reports on related party Restricted Stock Unit Plans transactions with the Stock Exchanges. Your Company has instituted various Employee Stock Directors’ Responsibility Statement Option Plans (“ESOPs”)/Restricted Stock Unit (“RSU”) Plans, including the ADS Restricted Stock Unit Plan Your Directors hereby confirm that: 2004 (“ADS Plan 2004”), Wipro Employee Restricted a. in the preparation of the annual accounts, the Stock Unit Plan 2005 (“RSU Plan 2005”), Wipro applicable accounting standards have been Employee Restricted Stock Unit Plan 2007 (“RSU Plan followed along with proper explanation relating 2007”) and Wipro Limited Employee Stock Options, to material departures. Performance Stock Unit and Restricted Stock Unit Scheme 2024 (the “2024 Scheme”) approved by the b. the Directors have selected such accounting Members of the Company on June 11, 2004, July 21, policies and applied them consistently and made 2005, July 18, 2007 and July 18, 2024 respectively, to judgments and estimates that are reasonable attract, retain and motivate the best available talents and prudent so as to give a true and fair view of and to reward the employees for their performance. the state of affairs of the Company at the end of The Nomination and Remuneration Committee the financial year and of the profit and loss of the administers these plans. The stock option plans are in Company for that period. compliance with the Securities and Exchange Board c. the Directors have taken proper and sufficient of India (Share Based Employee Benefits and Sweat care for the maintenance of adequate accounting Equity) Regulations, 2021, as amended from time to records in accordance with the provisions of time (“Employee Benefits Regulations”), and there the Companies Act, 2013 for safeguarding the have been no material changes to these plans during assets of the Company and for preventing and the financial year. In case of any corporate action(s) detecting fraud and other irregularities. such as rights issues, bonus issues, split/consolidation of shares, change in capital structure, merger/ d. the Directors have prepared the annual accounts demerger, the outstanding employee stock options, on a going concern basis. performance stock units and/or restricted stock units, e. the Directors have laid down internal financial granted/to be granted, shall be suitably adjusted. controls to be followed by the Company and that Disclosures on various plans, details of options granted, such internal financial controls are adequate and shares allotted upon exercise, etc. as required under operating effectively. the Employee Benefits Regulations are available on the Company’s website at https://www.wipro.com/ f. adequate systems and processes, commensurate investors/annual-reports/. No employee was issued with the size of the Company and the nature of its stock options during the year equal to or exceeding 1% business, have been put in place by the Company,—26 of the issued capital of the Company at the time of grant. 2025 to ensure compliance with the provisions of all applicable laws as per the Company’s Global Your Company has received a certificate from the Statutory Compliance Policy and that such Secretarial Auditors confirming implementation of REPORT systems and processes are operating effectively. the plans in accordance with the Employee Benefits ANNUAL INTEGRATED WIPRO


LOGO

135 Regulations. ESOP Plans of the Company are available M/s. Deloitte Haskins & Sells LLP, Statutory Auditors, have on the Company’s website at https://www.wipro.com/ issued an unmodified opinion on the financial statements investors/esop-plans/. of the Company. There are no qualifications, reservations or adverse remarks made by the Statutory Auditors, in Particulars of Employees their report for the financial year ended March 31, 2026. Information required pursuant to Section 197(12) of the Pursuant to provisions of Section 143(12) of the Companies Act, 2013 read with Rule 5(1) of the Companies Companies Act, 2013, neither the Statutory Auditors nor (Appointment and Remuneration of Managerial Personnel) the Secretarial Auditors have reported any incident of Rules, 2014 is provided as Annexure I to this report. fraud to the Audit, Risk and Compliance Committee during the year under review. A statement containing, inter alia, the names of top ten employees in terms of remuneration drawn and every employee employed throughout the financial year and Secretarial Audit in receipt of remuneration of H 102 lakhs or more and, At the 79th AGM held on July 16, 2025, M/s. V. Sreedharan employees employed for part of the year and in receipt & Associates, Practicing Company Secretaries of remuneration of H 8.50 lakhs or more per month, (Firm Registration Number: P1985KR14800) were pursuant to Rule 5(2) of the Companies (Appointment appointed as Secretarial Auditors of the Company for and Remuneration of Managerial Personnel) Rules, 2014 a term of five consecutive years from the financial year is provided as Annexure II to this report. 2025-26 onwards. V. Internal Financial Controls and Audit The Secretarial Audit Report in Form MR-3 for the financial year ended March 31, 2026, is enclosed as Annexure III Internal Financial Controls and their adequacy to this Report. There are no qualifications, reservations or adverse remarks made by the Secretarial Auditors in The Board of your Company has laid down internal financial the report. controls to be followed by the Company and such internal financial controls are adequate and operating effectively. VI. Key Awards and Recognitions Your Company has adopted policies and procedures for ensuring the orderly and efficient conduct of its business, Your Company is one of the most admired and recognized including adherence to the Company’s policies, the companies in the IT industry. Your Company has won safeguarding of its assets, the prevention and detection several awards and accolades, details of which are of frauds and errors, the accuracy and completeness of the provided at page 32 to 33 of this Annual Report. accounting records, and the timely preparation of reliable financial disclosures. VII. Social Responsibility and Sustainability Statutory Audit Corporate Social Responsibility (“CSR”) At the 76th Annual General Meeting (“AGM”) held on July Our vision of being a responsible corporation is based 19, 2022, M/s. Deloitte Haskins & Sells LLP, Chartered on a bedrock of values and ethical principles backed by Accountants (Registration No. 117366W/W-100018) were rigorous good governance practices. Your Company’s re-appointed as Statutory Auditors of the Company for a values of integrity and respect as manifested in Spirit of second term of five consecutive years from the financial Wipro combined with the mindset of joint stewardship year 2022-23 onwards. with our customers, employees, investors, suppliers, and communities have been at the heart of our progress.


LOGO

136 STATUTORY REPORTS AND FINANCIAL STATEMENTS BOARD’S REPORT Your Company chooses to work on societal concerns c. Your Company’s commitment to Inclusion that are foundational enablers of a life of dignity for and Well-being spans the entire spectrum underserved communities in the cities we operate from the workplace to its supply chain and to from. Some of the key highlights for the financial year communities. A salient example is the support 2025-26 are articulated below: through gender and maternal care during the year for 300,000 women of reproductive age, a. Your Company’s environmental stewardship taking the cumulative total to 1 Million women covers climate action, water efficiency, solid supported since FY21. waste management and campus biodiversity all of which have shown significant progress. d. Your Company supports important work that tries Your Company is well-positioned on its climate to improve the livability of our cities for the urban targets and net zero goals with a nearly 90% poor. Our network of 23 partners manages 27 renewable energy footprint in its operations and projects across 12 cities, working on issues of a corresponding reduction in its greenhouse urban water, climate adaptation, biodiversity, and gas footprint. Your Company continues to waste management. strengthen its water conservation practices e. Based on the core idea of integrating well-and achieved a 4.3% reduction in absolute being, personal purpose and social impact, ‘Be consumption of freshwater on a year-to-year the Change’, the volunteering program we had basis even as returnto- office numbers ramped launched in 2024 has significantly expanded up. More than 97% of the generated solid waste is recycled safely as per regulatory and in scale and scope. During the year, nearly industry norms. Your Company’s community 600 volunteering activities were organized initiatives are spread across 20 countries. wherein 31,238 employees across India and During the year, your Company supported the other geographies collectively contributed work of nearly 188 partners in the domains of ~35,300 hours of volunteering in activities Education, Primary Healthcare, Digital Skilling such as assembling science kits for schools, and Urban Ecology creating positive outcomes assembling menstrual kits and blood donation. for nearly 5.95 Million* people, a significant In addition, over 42,000 employees contributed proportion of whom are children and women monetarily to our community programs, which from underserved communities. your Company matches on a 1:1 basis. b. Your Company’s work in education spans a wide As per the provisions of the Companies Act, 2013, range from early child-care to digital skilling for your Company has spent H 2,274 Million towards its college cohorts with a sharp focus on quality, CSR activities during the financial year 2025-26. Your inclusion and equity. Some of the thematic areas Company’s report on CSR activities for the financial your Company supports are on Foundational year ended March 31, 2026 is set out in Annexure IV of Literacy and Numeracy, Science, Technology, this report in the format prescribed in the Companies - 26 2025 Engineering, Math learning in schools, Digital (Corporate Social Responsibility Policy) Rules, 2014. skilling in colleges and Sustainability Education. We affirm that the implementation and monitoring of Your Company’s geographic presence in India CSR activities is in compliance with the Company’s REPORT spans 26 States and 4 UTs where the work of CSR objectives and policy. our local partners touches 2.89 Million* students, *Note: The KPIs are on a cumulative basis for the decade ANNUAL including 148,467 children with disabilities. starting from FY21. INTEGRATED WIPRO


LOGO

137 Particulars regarding Conservation of going concern status of the Company and its Energy and Research and Development future operations. and Technology Absorption f) Details of unclaimed dividends and equity shares transferred to the Investor Education and Protection Details of steps taken by your Company to conserve Fund Authority have been provided as part of the energy through its Sustainability initiatives, Research and Corporate Governance report. Development and Technology Absorption have been g) To the best of our knowledge and belief, there are no disclosed as part of the MD & A Report. proceedings initiated/pending against the Company under the Insolvency and Bankruptcy Code, 2016 VIII. Disclosures which can have a material impact on the business of Foreign Exchange Earnings and Outgoings the Company. During the financial year 2025-26, your Company’s foreign h) There were no instances where your Company 688,950 Million and foreign required the valuation for one time settlement in exchange earnings were H outgoings 305,824 Million as against connection with availment of loan from the Banks exchange were H or Financial institutions. H 640,665 Million of foreign exchange earnings and H 298,829 Million of foreign exchange outgoings for the i) There was no failure to implement any Corporate financial year 2024-25. Action during the year. Annual Return j) There have been no material changes and commitments affecting the financial position of the Pursuant to Section 92(3) and Section 134(3)(a) of the Company that have occurred between the end of the Companies Act, 2013, the Company has placed a copy of financial year to which the financial statements relate the Annual Return as of March 31, 2026, on its website at and the date of this report. https://www.wipro.com/investors/annual-reports/. k) All Board Members, KMPs and SMPs have affirmed Other Disclosures compliance with the Code of Business Conduct as on March 31, 2026. a) Your Company has not accepted any deposits from the l) The securities of the Company were not suspended public and as such, no amount on account of principal from trading anytime during the year. or interest on public deposits was outstanding as on the date of the balance sheet. m) During the financial year 2025-26, there has been no b) Your Company has not issued shares with differential change in the nature of business of the Company. voting rights and sweat equity shares during the year under review. n) The CEO & CFO of the Company have issued the necessary certificate pursuant to the provisions of c) Your Company has complied with the applicable Regulation 17(8) of the Listing Regulations, for the Secretarial Standards relating to ‘Meetings of the financial year 2025-26. Board of Directors’ and ‘General Meetings’ during the year. o) The Board affirms that the Company remains fully committed to upholding its Maternity Policy in d) Maintenance of cost records and requirement of cost strict compliance with applicable laws, including audit as prescribed under the provisions of Section the Maternity Benefit Act, 1961, and in alignment 148(1) of the Companies Act, 2013 are not applicable with internal human resource protocols. The policy to the business activities carried out by the Company. is designed to support the health, well-being, and e) There are no significant material orders passed work-life balance of women employees during and by any Regulator/Court which would impact the after pregnancy.


LOGO

138 STATUTORY REPORTS AND FINANCIAL STATEMENTS BOARD’S REPORT Acknowledgements and Appreciation Your Directors take this opportunity to thank the Company’s customers, shareholders, suppliers, bankers, business partners/associates, financial institutions, Central and State Governments, the concerned Regulators and other Statutory Authorities for their consistent support and encouragement to the Company. The Directors also place on record their sincere appreciation for the dedication, commitment and hard work of all employees of the Company, its subsidiaries and associates. Their dedication and competence have ensured that the Company continues to be a significant and leading player in the IT Services industry. For and on behalf of the Board of Directors, Rishad A. Premji Bengaluru Chairman June 2, 2026 (DIN: 02983899) - 26 2025 REPORT ANNUAL INTEGRATED WIPRO 


LOGO

139 ANNEXURE I Statement of Disclosure of Remuneration under Section 197 of the Companies Act, 2013 and Rule 5(1) of the Companies (Appointment and Remuneration of Managerial Personnel) Rules, 2014 Remuneration paid to Whole-Time Directors (“WTDs”) % increase/decrease Ratio of % increase/decrease Ratio of of remuneration in remuneration to of remuneration in Name of Director Designation remuneration to 2026 as compared to MRE (excluding 2026 as compared to MRE* 2025 (excluding value value of stock 2025* of stock incentives)* incentives)* Rishad A. Premji(1) Chairman (47) 76.58 (47) 76.58 Srinivas Pallia(2) Chief Executive Officer and (7) 523.96 (11) 278.36 Managing Director MRE- Median Remuneration of employees *Figures in the above table are subject to rounding-off adjustments. (1)Mr. Rishad A. Premji is entitled to a commission at the rate of 0.35% on the incremental consolidated net profits of the Company over the previous financial year. However, the incremental consolidated net profits for financial year 2025-26, reflected a comparatively moderate increase as against the previous year. Accordingly, while commission was determined in line with the approved framework, the overall impact on his remuneration represents a decline compared to the financial year 2024-25. (2)Mr. Srinivas Pallia’s remuneration includes variable pay and Performance Stock Units (PSUs) linked to the achievement of the Company’s performance parameters, including revenue and profitability. Based on the performance outcomes for the year, the overall impact on his remuneration reflects a decline when compared to the remuneration for financial year 2024-25. Remuneration paid to other Directors % increase/decrease of Ratio of remuneration Name of Director Designation remuneration in 2026 as to MRE* compared to 2025* Azim H. Premji Non-Executive, Non-Independent Director (0.93) 11.19 Patrick J. Ennis(3) Independent Director 3.83 26.63 Patrick Dupuis(4) Independent Director (4.92) 27.51 Deepak M. Satwalekar Independent Director 8.26 20.79 Tulsi Naidu(3)(4) Independent Director 19.36 27.18 Päivi Rekonen(3)(4) Independent Director 14.17 21.18 N. S. Kannan Independent Director 9.19 14.68 *Figures in the above table are subject to rounding-off adjustments. (3)The increase of remuneration in 2026 as compared to 2025 is due to exchange rate fluctuation. (4)The change in remuneration in 2026 as compared to 2025 is due to changes in Committee Chairpersonship/Membership as detailed below: • With effect from July 1, 2025, Ms. Tulsi Naidu was appointed as Chairperson of the Nomination and Remuneration Committee in place of Mr. Patrick Dupuis. Mr. Dupuis continued to serve as Member of the Nomination and Remuneration Committee. • With effect from October 1, 2025, Ms. Päivi Rekonen was appointed as a Member of the Nomination and Remuneration Committee. The remuneration paid is as per the remuneration policy approved by the Nomination and Remuneration Committee of the Company. The aggregate remuneration, including commission, paid to the Directors other than the Managing Director and Whole-Time Director in a financial year is not exceeding 1% of the net profits of the Company, in terms of Section 197 of the Companies Act, 2013 and computed in the manner referred to in Section 198 of the Companies Act, 2013.


LOGO

140 STATUTORY REPORTS AND FINANCIAL STATEMENTS BOARD’S REPORT Remuneration paid to other Key Managerial Personnel (“KMP”) % increase/ % increase/decrease Ratio of decrease of Ratio of of remuneration in remuneration to Name of KMPs Designation remuneration in remuneration 2026 as compared to MRE (excluding 2026 as compared to MRE* 2025 (excluding value value of stock to 2025* of stock incentives)* incentives)* Aparna Iyer(5) Chief Financial Officer (7) 71.08 (2) 35.07 M. Sanaulla Khan(6) Company Secretary (17) 26.43 (12) 21.32 *Figures in the above table are subject to rounding-off adjustments. (5)The computation of remuneration to Ms. Aparna Iyer is on an accrual basis and includes the amortization of Restricted Stock Units (RSUs) granted to her, which will vest over a period of time. This also includes PSUs that will vest based on performance parameters of the Company. (6)Remuneration includes perquisite value of RSUs exercised during the respective years. Notes: 1. The MRE excluding WTDs was H 947,425 and H 978,516 in financial year 2025-26 and 2024-25 respectively. The decrease in MRE excluding the WTDs in financial year 2025-26 as compared to financial year 2024-25 is 3.18%. 2. The MRE including WTDs was H 947,425 and H 978,516 in financial year 2025-26 and 2024-25 respectively. The decrease in MRE including the WTDs in financial year 2025-26 as compared to financial year 2024-25 is 3.18%. 3. The number of permanent employees on the rolls of the Company as of March 31, 2026, and March 31, 2025, was 242,156 and 233,346 respectively. 4. The aggregate remuneration of employees excluding WTD increased by 0.7% over the previous financial year, attributed to an increase in headcount. 5. The Company affirms that the remuneration is paid as per the remuneration policy of the Company. Variable Pay Compensation The variable pay of executive officers, including the Chief Executive Officer and Managing Director, is based on clearly laid out criteria and measures, which are linked to the desired performance and business objectives of the organization. The criteria for variable pay, which is paid out quarterly/annually, includes financial parameters like revenue, profit achievement, operating margin achievement and other strategic goals as decided by the Board, from time to time. Apart from the variable pay component, long term (typically greater than one year) incentives granted to executive officers, including the Chief Executive Officer and Managing Director, includes both time-based stock units (RSUs) and performance-based stock units (PSUs). - 26 The vesting of PSUs is based on performance parameters of the Company over a defined performance period and is 2025 linked to predefined financial goals. Time-based stock units typically vest over a defined period. The vesting pattern and REPORT schedule for both these types of stock units are as determined by the Nomination and Remuneration Committee. Variable compensation for the CEO comprises of short-term and long-term incentives linked to business and financial outcomes. The Short-term Incentive is determined annually based on achievement of metrics such as revenue, profit and ANNUAL 0.35% of incremental PAT, and is paid at year-end subject to performance. Long-term incentives are delivered through PSUs, which vest over three years based on cumulative financial performance across revenue, EBIT and free cash flow, with defined weightages. INTEGRATED The total rewards for the Chairman is designed to ensure the pay is reflective of market while taking into consideration performance against goals. The pay consists of a mix of fixed salary and commission. The Chairman is entitled to a WIPRO commission at the rate of 0.35% on the incremental consolidated net profits of the Company over the previous financial year.


LOGO

ANNEXURE II Information as per Rule 5(2) of the Companies (Appointment and Remuneration of Managerial Personnel) Rules, 2014 A) Top 10 employees in terms of Remuneration drawn during the financial year 2025-26 Sl. Date of joining Gross Experience Name of the Employee Qualification Age Last Employment Designation No. (DD-MM-YYYY) Remuneration (H) (yrs) 1 Srinivas Pallia# ^ 1/2/1992 496,414,037 B.Tech., M.Tech. 59 34 First Employment CEO and Managing Director 2 Rishad A. Premji 20/7/2007 72,550,535 B.A., MBA 49 27 Bain & Company Chairman 3 Harish Dwarkanhalli 10/12/2019 57,959,868 BE 51 29 Cognizant President—Applications and Technologies Data 4 Saurabh Govil 11/5/2009 55,856,255 B.Sc., PGDM -PM 58 37 GE India President and CHRO & IR 5 Jasjit Singh Kang 1/9/2018 55,106,898 MBA 57 33 WNS Managing Partner and Global Head Business Process Services 6 Aparna Iyer^ 21/4/2003 67,346,460 CA 45 23 First Employment Senior Vice President and CFO 7 Tejal Patil 22/8/2022 47,287,181 B.A. LL.B. Solicitor 57 34 GE South Asia Senior Vice President and General (GE India Industrial Counsel Pvt. Ltd.) 8 Sanjeev Kumar Jain 4/4/2023 46,156,610 Masters in 56 32 IBM Chief Operating Officer Industrial Engineering 9 Devender Malhotra 23/8/2002 31,673,443 BE, PGD 54 31 Satyam GE Senior Vice President & Chief Software Operating Officer – Technology Services GBL 10 Nanda Kishore N 1/8/1994 29,296,814 BE, PG Diploma 54 32 Hypermedia Info Chief of Delivery and Operational Systems Excellence Notes: 1. Remuneration comprises salary, allowances, commission, performance based payments, perquisites and Company’s contribution to provident fund and super-annuation as per definition given in Section 2(78) of the Companies Act, 2013, paid during the year. It also includes perquisites value of Restricted Stock Units (RSUs) exercised, if any, by employees. 2. The nature of employment is contractual in all the above cases. 3. In terms of proviso to Rule 5 of the Companies (Appointment and Remuneration of Managerial Personnel) Rules, 2014, particulars of employees posted and working in a country outside India, not being Directors or their relatives, have not been included in the above statement. 4. Mr. Rishad A. Premji, who is in the employment of the Company, is the son of Mr. Azim H. Premji, Non-Executive, Non-Independent Director of the Company. #Figures mentioned in H are equivalent of amounts paid in foreign currency, as may be applicable. ^The remuneration is computed on an accrual basis. It includes the amortization of RSUs granted to them, which vest over a period of time and PSUs that will vest based on performance parameters of the Company. 141


LOGO

WIPRO INTEGRATED ANNUAL REPORT 2025-26 142 B) Employees drawing Remuneration of K 102 lakhs or above per annum and posted in India Date of joining Gross Experience Name of the Employee Qualification Age Last Employment Designation (DD-MM-YYYY) Remuneration (H) (yrs) STATUTORY Aaradhya Yeluri 5/2/2024 10,258,901 B.Tech, PGDM 43 19 Tech Mahindra Ltd. General Manager Aathir Ahad 20/1/2003 14,386,095 BE 52 30 Bangalore Labs Vice President and Chief Information Security Officer Abbas Zaki 18/11/2024 11,577,549 B.Com 51 26 Accenture Services General Manager & Practice REPORTS (P) Ltd. Delivery Head Abhishek Jain 8/5/2008 13,294,339 CA 44 22 HSBC Bank Corporate Treasurer and HeadAND Investor Relations Ajay Bhaskar 1/4/2003 20,764,457 BE, MBA 53 31 Hindustan Lever Ltd. Chief Strategy and Transformation Officer Amit Gautam 1/9/2018 15,629,353 MCA 48 24 WFX Vice President -BFSI & HRO FINANCIAL Amit Kumar Bajaj 13/5/2021 10,305,277 ACA Accounts 40 17 Tagos Design General Manager Innovations Pvt. Ltd. Animesh Sengupta 12/9/2006 10,280,397 B.Com 55 35 GE Capital General Manager and Global Head—Technology STATEMENTS Anindito De 6/6/2005 11,725,881 M. Tech, BME 51 26 Infosys Vice President Anirban Banerjee 1/1/2024 11,658,287 BE 50 26 Avanade Inc. Vice President Anurag Shrivastava 15/7/2011 11,053,370 BE 57 35 Reliance General Manager and Practice Communications Ltd. Head Arti Gupta 1/9/2023 10,659,999 B.Com (Hons), 41 19 GE Healthcare Head Strategy and M&A MBA (Finance & BOARD’S Marketing) Ashish Agrawal 1/9/2018 10,874,362 PGDBM 54 31 Alight HR Services General Manager India Private Ltd. REPORT Ashok Kumar Mittal 25/9/2006 19,500,983 CA 43 19 First Employment Vice President & Chief Financial Officer- Americas 2 Ateet Khosa 2/5/2007 12,280,806 B.E (E&TC), M.A 44 19 First Employment Vice President (PM&IR) Balasubramani H 27/4/2023 11,811,378 M.S 47 26 Cognizant General Manager & Practice Technology Services Head Bhakti Sagar Pande 21/9/1998 11,822,960 BE (Electronics) 50 29 CMC Ltd. Vice President and Delivery Head Bishakha Bhattacharya 20/1/2025 11,278,455 Masters Degree- 55 26 Amazon Web General Manager Materials Science Services Byomokesh Tripathy 7/7/2014 20,152,044 MBA 50 26 GE Appliances and Chief Operating Officer—Wipro Lighting Europe Deepak Kumar Ladha 20/2/2020 10,999,771 BE, PGDBM 48 26 Aricent General Manager


LOGO

Date of joining Gross Experience Name of the Employee Qualification Age Last Employment Designation (DD-MM-YYYY) Remuneration (H) (yrs) Dinesh Joshi 2/9/2024 11,045,566 MA in English, 49 27 HP India General Manager PG in Mass Communications Dinesh Wadehra 1/6/2021 27,629,649 BE, MBA, MS 57 36 Jones Lang Lasalle Vice President Gurpreet Singh Arora 1/9/2018 12,987,573 BE Mechanical 50 13 AonHewitt General Manager and Senior Practice Director Guruprasad Bhat 6/2/2017 13,969,322 MMS (Finance) 51 28 DXC (Xchanging) Vice President Harish Kumar Balivada 4/8/2008 17,608,180 BE (Computer 54 30 Tata Consultancy Vice President and Country Science) Services Delivery Head Harish Singh 30/9/2021 13,747,200 PGDBA 47 25 Yes Bank Vice President & Head—Business Infrastructure Technology Mgmt, Chief Operating Officer Harsh Nagpal 1/9/2018 11,618,391 B.Com 45 24 Spectra Mind General Manager Jagmohan Singh Babra 4/4/2022 20,997,801 BE, MBA 55 31 Mercer Consulting Vice President—Enterprise & Business India Pvt. Ltd. Process Services Kanchan Ganorkar 30/9/2021 10,878,947 PG in Computer 48 26 ICICI Home Finance General Manager Science & Company Applications Kenny Kesar 1/6/2023 20,768,373 BE 57 35 SAP Global Chief Information Officer Krishnan Venkatesh 12/8/2021 13,185,539 B.S., PGDBA 49 30 Atos Vice President and Chief Quality Officer Kumara Guru Shanmugam 16/10/2000 11,793,614 Diploma 48 28 Infocare Systems General Manager Kumaralingam M C 27/3/2023 24,718,430 BE 52 30 Kyndryl India Pvt. Ltd. Global Procurement Officer Kuntaraju Vijaya Varma 13/2/2024 20,095,217 Diploma in EC 44 25 Aggne Entity Executive Kusum P 24/11/2022 11,382,677 Graduate of 57 31 Genpact General Manager & Practice Commerce Delivery Head Madhu Menon 27/1/2025 10,665,975 PG -Human 50 22 Deloitte Vice President and Global Head Resource Management Manish Grover 1/2/2023 10,389,906 BE, CFA 55 30 Skan.ai General Manager and Delivery Head Manoj Madhusudhanan 7/7/2003 14,607,771 BE 53 31 Skanda Software Global Head—Business Operations Intelligence & DMTS Fellow Mayank Jha 28/2/2024 12,079,988 Post Graduation 52 28 Highradius Senior Director Engineering in Management of Technologies Global Strategies Meenal Gupta 28/11/2005 11,145,277 PGDBM (HR) 50 26 Grow Talent Company Vice President and HR Head— Wipro Engineering Edge Meeta Bedi 1/9/2018 14,033,323 B.Com 46 25 Alight HR Services Vice President India Private Ltd. Mohan Ram Rajan 19/5/2022 13,278,159 BE 52 19 Attune Consulting Project Governance Director— India Pvt. Ltd. Rizing 143


LOGO

WIPRO INTEGRATED ANNUAL REPORT 2025-26 144 Date of joining Gross Experience Name of the Employee Qualification Age Last Employment Designation (DD-MM-YYYY) Remuneration (H) (yrs) Mohit Sharma 4/9/2019 10,890,977 B.Tech (Electrical 49 27 Maersk General Manager Engineering) STATUTORY Murali Parthasarathy 1/8/2012 17,445,346 BE 57 34 Allgreen Ecotech Chief Operating Officer—Americas 2 Solutions Pvt. Ltd. Murlidhar Reddy Samala 18/11/2024 21,582,075 B.Tech., ECE 56 34 Altos Senior Vice President Namita Singhai 13/11/2024 23,467,441 Master Degree in 56 31 Kyndryl Vice President & Global DeliveryREPORTS Management Head AND Namrata Singh 27/2/2025 15,240,845 PGDMM 44 22 IBM India Pvt. Ltd. Vice President—Sector Head BFSI Narayan P S 12/6/1995 10,660,059 MBA 60 34 Asian Paints India Vice President Ltd. Naveen Surapaneni 9/12/2019 13,034,934 PGPM, B.Tech 52 28 Reliance Sales Enablement Head FINANCIAL Communications Ltd. Navin Gadia 12/7/2006 21,189,175 CA 44 21 Atlas Shipping Senior Vice President Neelakantha Biradar 5/3/2001 12,661,145 M.Tech 58 32 ISRO COO—WEE GBL Pavan N Rao 3/10/2013 10,705,895 CA 42 19 GE International Inc. Vice President and Head of Internal Audit STATEMENTS Pawan Chaudhary 1/9/2018 13,010,025 B.Com 45 23 Alight Solutions General Manager and Senior Practice Director Phanikumar Penukonda 2/5/2016 10,559,283 M.Sc. General 54 30 Accenture Vice President and Global Science Delivery Head Philip Kuruvilla 19/5/2022 10,548,149 BE Textiles 53 31 Attune Consulting Senior Business Development BOARD’S India Pvt. Ltd. Director Fashion—Rizing Prasad Gantasai 1/2/2006 28,614,792 BA, MSW 52 31 Isoft India Senior Vice President and CHRO—Technology Services REPORT Pratibha Batchu 29/1/2024 13,215,661 BE 52 29 Bosch Global Vice President & Head Software Technologies Ltd. Preetam Bagi 26/9/2011 11,043,887 BE (Industrial 50 26 Aditya Birla Minacs General Manager Engineering) Pushpa Ramachandran M 5/7/1999 13,316,089 Master of 49 26 First Employment Vice President and Global Head AI Computer Applications Raghuraman Ranganathan 21/2/2007 19,080,837 ACA, MIRM (UK) 45 25 KPMG Vice President and Chief Risk & Assurance Officer Rahul Agarwal 15/4/1996 13,988,345 PGDM 53 30 Pentafour Software Vice President & SDOE—Healthcare & UHG, Americas 1 Ralph Jude Devadoss 12/9/2017 11,478,673 MA 49 27 HCL Technologies General Manager and Head— DOP Communications


LOGO

Date of joining Gross Experience Name of the Employee Qualification Age Last Employment Designation (DD-MM-YYYY) Remuneration (H) (yrs) Ramakrishnan V 26/10/2015 14,307,182 PGDM 48 24 Genpact Vice President & Head, Sales Management Strategy & Transformation Ramesh G Pai 9/10/2000 17,699,576 MS (Software 46 25 First Employment Vice President and Global Head Engineering) Ravi Kumar 5/4/2024 11,292,662 BE 56 29 Kyndryl India Ltd. General Manager & Account Executive Reshma Shetty 1/8/2022 10,828,070 B Sc., PGD- 55 32 Yes Bank Entities—CIO Computer Applications Reshmi Shankar 17/6/2019 18,316,775 Diploma (Hotel 49 25 Honeywell Vice President and Head FMG Management) and CMF Ritesh Hasmukh Shah 5/1/2023 25,176,208 CA 51 27 Capgemini Chief Financial Officer—APMEA Ritesh Sabharwal 27/9/2023 11,639,518 MBA 41 17 Ernst & Young LLP Head—Function Saamir Gupta 17/3/2025 14,653,270 B.Tech 37 16 Dow Jones Managing Partner Sachin Bora 7/7/2022 10,383,810 PGDBA (Marketing 49 28 Reliance Commercial Head – Business Operations Management), BE Finance Ltd. APMEA (Industrial Engineering) Samir Gadgil 9/10/2004 11,402,583 BE, MPM 50 27 Cedar Consulting Vice President Sanaulla Khan Mohammed 12/5/2015 25,864,828 M.Com, FCS 55 32 ICICI Prudential Life Senior Vice President and Insurance Co. Ltd. Company Secretary Sandhya Arun 21/3/2016 12,659,342 MBA 58 32 Deloitte Digital Chief Technology Officer Sangeeta Kar 17/1/2000 11,301,213 BE 54 32 TCS Vice President and Global Delivery Head Sarita Venkatesh 18/7/2022 10,643,094 Masters in 49 22 Deloitte Consulting General Manager Business India Pvt. Ltd. Administration Satish Y 19/4/2000 25,234,374 BE 53 30 Jindal Vijayanagar Senior Vice President and Steel Ltd. Global Business Head—Cloud, Infrastructure and Security Services Seshu Kumar G V 10/8/1998 13,265,688 B.Tech 51 30 ECIL Vice President and Head Platform Engineering & VDI , Wipro FSC & DMTS Shirish Patil 8/1/2001 11,896,623 BE 51 29 StockHolding Senior Partner (Instrumentation), Corporation of India AMP Ltd. Somanath Ballari 22/6/2015 15,787,379 WISTA-MS Law 51 26 Avery Dennison Vice President & Deputy General (India) Pvt. Ltd. Counsel Somyajit Sethi 29/1/2024 14,785,164 Masters in 47 23 InterGlobe Aviation Vice President and Chief Ethics Business Ltd. Officer Economics Sonia Rajkumar Kakkar 15/2/2010 10,943,890 PGDHRM 43 18 Tech Mahindra Ltd. Vice President 145


LOGO

WIPRO INTEGRATED ANNUAL REPORT 2025-26 146 Date of joining Gross Experience Name of the Employee Qualification Age Last Employment Designation (DD-MM-YYYY) Remuneration (H) (yrs) Sreyans Jain 17/9/2013 11,934,607 PGDBA 49 24 WNS Global Services General Manager & Head GTM – AI & Immersive Operations STATUTORY Srikumar Rao 29/6/1998 25,010,778 BE, PGSEM 48 27 First Employment Managing Partner and Global Business Line Head—Wipro Engineering Sriram Ranganathan 7/11/2005 23,631,032 CA 43 21 Cognizant Senior Vice President and Global REPORTS Technology Tax Head Srivatsan Venkataramani 12/1/2012 17,027,172 PGDM (Finance) 58 31 Oracle Financial Managing PartnerAND Services Ltd. Sumit Taneja 8/5/2006 19,518,047 BA, PGD 48 22 Tata Motors Ltd. Vice President Sundararaman 18/6/2008 16,813,795 MS (Engineering 56 30 SAP America Inc. General Manager and Innovations Sankaranarayanan Management) Head—SAP FINANCIAL Suresh Kannan 4/7/2016 8,678,097 MS 58 32 Tata Consultancy Vice President & Delivery Head Services Surya Prakash Mohapatra 25/7/2016 10,484,984 B.Com 56 30 HP Computing and General Manager and Head— Printing Systems Talent Transformation India Pvt. Ltd. STATEMENTS Sushil Agrawal 7/3/2005 15,810,807 CA and EMBA 45 22 Magma Leasing Ltd. Vice President & Chief Financial (London Business Officer -Europe School) Tanmay Agarwal 17/4/2023 27,398,917 BE, MBA 56 32 Hindustan Coca Cola Vice President & Head Global Beverages Pvt. Ltd. People Operations BOARD’S Varun Dube 25/4/2005 11,398,314 BE 47 26 Oracle India Vice President Venkataraman Mahadevan 10/8/2004 22,569,042 B.Sc., Advance 55 21 NIIT Ltd. Vice President & Global Head Diploma in SMGT    REPORT Venkatraman E 18/9/2006 13,308,497 CA 42 19 First Employment Vice President Vijay Kumar K 28/2/2000 13,169,860 PHD (Elec & 54 31 Cadence Design DMTS—Master Communication Systems Engineering) Vinod Kumar Narasimhaiah 19/5/2022 22,115,028 BE 48 15 Rizing Global Technology Lead—Rizing Vinodkumar R Vanga 6/9/2021 11,097,340 MCA 43 25 Yes Bank General Manager Vishal Dixit 3/12/2024 17,346,593 MBA 48 26 Coforge Ltd. Vice President Vivek Mehrotra 1/4/2022 23,077,107 B.Com (Hons), CA 47 25 Microsoft Vice President Chief Financial Officer Americas 1 & Wipro Ventures Yogesh Kulkarni 9/1/2020 11,106,814 Masters in 48 24 Rapid7, India General Manager and CISO— Computer IP and Platforms Management


LOGO

C) Employed for part of the year with an average Remuneration of K 8.5 lakhs or above per month and posted in India Date of joining Gross Experience Name of the Employee Qualification Age Last Employment Designation (DD-MM-YYYY) Remuneration (H) (yrs) Amit Rangwani 1/8/2020 16,392,249 B.Tech (Computer 41 20 RBS Services India General Manager Engineering) Pvt. Ltd. Anup G Purohit 24/5/2021 22,516,585 BE (Electronics) 55 30 Yes Bank Chief Information Officer Bhuvaneswari V 23/3/2023 14,132,297 ACA, CWA 56 34 CTS Vice President Dilip Dialani 13/6/2005 11,402,054 MFM 49 27 MBT Chief Operating Officer—Americas 1 Dipak Kumar Bohra 14/6/2002 47,191,420 B.Com, CA, ICWAI 53 29 Aditya Birla Group Senior Vice President- Corporate Treasurer and Investor Relations Harsha Anand Almad 2/6/2025 17,030,827 MBA 45 21 BCG Managing Partner Indrajit Kar 28/7/2025 8,034,137 B.Sc. 41 20 A RPG Company—General Manager & Engineering Zensar Delivery Head Kumar Rajan 1/9/2018 10,699,363 B.Com 46 23 Alight HR Services General Manager India Private Ltd. Laxmikant Bhole 22/7/2024 9,831,227 BE 50 28 BlueRidge Global General Manager Pvt. Ltd. Mohit B Lal 16/3/1999 6,141,046 B.Sc., MCA 56 32 MXSS DELHI Senior Vice President and Chief Operating Officer-FSC Niloy Mukherjee 16/1/2020 19,086,614 M.Tech 56 30 Cognizant Vice President and Practice Technologies Head Nitin Kahol 14/8/2019 7,425,555 PGDM 36 14 Blackrock General Manager & Account Delivery Head Pallavi Umrani 11/12/2006 7,436,226 BE (Computer 49 27 I Flex Vice President & Sector Delivery Engineering) Executive , CMI & Canada Prasenjit Lahiri 5/1/1995 30,515,651 BE 57 32 TVS Electronics Vice President and Head Prashanth M G 27/5/1992 32,363,544 BE 56 33 First Employment Vice President & Global Head of Delivery and Operations-CIS Radhika Ananthakrishna 13/6/2022 9,126,769 B.Com 46 21 Unilog Content General Manager Solutions Pvt. Ltd. Raju Gopalan 13/7/2023 16,104,376 BE, MS (Software 55 31 Mindtree Vice President Engineering) Rituparna Ghosh 15/3/2001 26,033,781 MBA (Business 52 28 ITpace.com Vice President Management) 147


LOGO

WIPRO INTEGRATED ANNUAL REPORT 2025-26 148 Date of joining Gross Experience Name of the Employee Qualification Age Last Employment Designation (DD-MM-YYYY) Remuneration (H) (yrs) Ruchi Vijay 11/8/2025 7,223,657 MBA 53 28 Tata Medical and Vice President Diagnostics Ltd. STATUTORY Sagar Jhalani 14/8/2019 9,100,598 MBA 46 19 Thoughtfocus Center of Excellence Director Information Technologies Pvt. Ltd. REPORTS Sanjay Sharma 3/9/2019 8,201,474 B.Sc, LLB & PGD 53 31 Nestle India Ltd. General Manager (Personnel AND Management & Industrial Relations) FINANCIAL Santanu Ray 10/11/2025 7,145,881 BE 50 27 Stellantis General Manager Sathya Sovan Mohapatra 23/1/2026 3,973,273 B.Com, ICWA 48 21 Alliance Bernstein General Manager Business Services Pvt. Ltd. STATEMENTS Satish Raghammudi 19/11/2007 15,559,274 MBA (Operations 51 26 Infosys Technologies Vice President & Global Delivery Information Head Technology) Shahana Sen Mishra 1/9/2023 8,673,376 B.Sc (Computer 51 24 JIO General Manager & Practice Head Science) BOARD’S Sindhu Bhaskaran 20/3/2024 7,907,975 B.E (Information 51 29 Accenture General Manager & Practice Technology) and Head—Global AI Practice Executive MBA PGDBM REPORT Srinivasa Rao Gosala 2/12/2002 9,490,325 BE 58 36 Mphasis General Manager and Head Delivery Operations Sriram Narasimhan 2/5/2022 21,757,997 MS (Computer 55 31 Fidelity Institutional Senior Vice President Information Investor Group Systems) Sunita Cherian 4/11/1996 34,391,073 B.Tech., PGDBA 52 29 First Employment Chief Culture Officer & Senior Vice President—Human Resources Swati Oberoi 6/11/2017 12,074,305 Business 59 35 Tata Consultancy General Manager Management Services Science Ulhas Deshpande 2/5/2022 3,943,167 BE 55 32 Pricewaterhouse General Manager and Sales Head Coopers Pvt. Ltd.


LOGO

Date of joining Gross Experience Name of the Employee Qualification Age Last Employment Designation (DD-MM-YYYY) Remuneration (H) (yrs) Veena Srigopal 22/1/2024 7,957,472 BE 55 27 Exponent Dynamix General Manager & Practice Head Vikas Gupta 2/1/2024 17,229,858 BE 54 31 Tech Mahindra Ltd. Senior Vice President and Head -FSC Vikram Singh 14/8/2019 9,157,438 MBA 39 15 Ameriprise India Pvt. General Manager & Account Ltd. Delivery Head Venkata Rao K 11/5/2000 4,603,288 B.Tech (Civil) 52 26 First Employment General Manager and Sector Delivery Head Notes: 1. The above table contains details of employees in alphabetical order and does not include the details of remuneration drawn by the top 10 employees as their details are provided in item (A) of Annexure II to this Board’s Report. 2. Remuneration comprises salary, allowances, commission, performance based payments, perquisites and Company’s contribution to provident fund and superannuation as per the definition given in Section 2(78) of the Companies Act, 2013, paid during the year. It also includes perquisites value of Restricted Stock Units (RSUs) exercised, if any, by employees. 3. The nature of employment is contractual in all the above cases. 4. None of the employees employed throughout the financial year or part thereof, were in receipt of remuneration in that year, in which the aggregate, or as the case may be at a rate which, in the aggregate, is in excess of that drawn by the Managing Director or Whole-Time Director or Manager and hold by themselves or along with their spouse and dependent children, not less than two per cent of the equity shares of the Company. 5. In terms of the proviso to Rule 5 of the Companies (Appointment and Remuneration of Managerial Personnel) Rules, 2014, particulars of employees posted and working in a country outside India, not being Directors or their relatives, have not been included in the above statement. 149


LOGO

150 STATUTORY REPORTS AND FINANCIAL STATEMENTS BOARD’S REPORT ANNEXURE III Form No. MR-3 SECRETARIAL AUDIT REPORT [Pursuant to Sub Section (1) of Section 204 of the Companies Act, 2013 and Rule 9 of the Companies (Appointment and Remuneration of Managerial Personnel) Rules, 2014] For the Financial Year Ended March 31, 2026 To, iv. Foreign Exchange Management Act, 1999 and The Members, the rules and regulations made thereunder to the Wipro Limited, extent of Foreign Direct Investment and Overseas Doddakannelli, Sarjapur Road, Direct Investment. There was no External Commercial Bengaluru—560035 Borrowing by the Company during the period under review. We have conducted the secretarial audit of the compliance of applicable statutory provisions and the v. The following Regulations and Guidelines prescribed adherence to good corporate practices by Wipro Limited under the Securities and Exchange Board of India Act, (CIN-L32102KA1945PLC020800) (“the Company”). 1992 (“SEBI Act”): -Secretarial Audit was conducted in a manner that provided us a reasonable basis for evaluating the corporate conducts/ a. The Securities and Exchange Board of India statutory compliances and expressing our opinion thereon. (Substantial Acquisition of Shares and Takeovers) Regulations, 2011. Based on our verification of the Company’s books, papers, minute books, forms and returns filed and other records b. The Securities and Exchange Board of India maintained by the Company and also the information (Prohibition of Insider Trading) Regulations, 2015. provided by the Company, its officers, agents and authorized representatives during the conduct of secretarial audit, we c. The Securities and Exchange Board of India hereby report that in our opinion, the Company has, during (Issue of Capital and Disclosure Requirements) the audit period covering the financial year ended on March Regulations, 2018. (Not Applicable to the 31, 2026 (“the audit period”) complied with the statutory Company during the Audit Period). provisions listed hereunder and also that the Company d. Securities and Exchange Board of India (Listing has proper Board-processes and compliance-mechanism Obligations and Disclosure Requirements) in place to the extent, in the manner and subject to the Regulations, 2015. reporting made hereinafter: e. The Securities and Exchange Board of India We have examined the books, papers, minute books, forms 26 (Share Based Employee Benefits and Sweat—and returns filed and other records maintained by the Equity) Regulations, 2021. 2025 Company for the financial year ended on March 31, 2026, according to the provisions of: f. The Securities and Exchange Board of India REPORT (Buy-back of Securities) Regulations, 2018; (Not i. The Companies Act, 2013 (the Act) and the rules Applicable to the Company during the Audit made thereunder. ANNUAL Period). ii. The Securities Contracts (Regulation) Act, 1956 g. The Securities and Exchange Board of India (“SCRA”) and the rules made thereunder. (Issue and Listing of Non-Convertible Securities) INTEGRATED iii. The Depositories Act, 1996 and the Regulations and Regulations, 2021 (Not Applicable to the Byelaws framed thereunder. Company during the Audit Period). WIPRO 


LOGO

151 h. The Securities and Exchange Board of India We further report that: (Registrars to an Issue and Share Transfer Agents) th The Board of Directors of the Company is duly constituted Regulations, 1993 (upto 14 December, 2025) with proper balance of Executive Directors, Non-Executive and The Securities and Exchange Board of India Directors and Independent Directors. The changes (Registrars to an Issue and Share Transfer Agents) th in the composition of the Board of Directors that took Regulations, 2025 (from 15 December, 2025) place during the period under review were carried out in regarding the Companies Act and dealing with client; compliance with the provisions of the Act. i. The Securities and Exchange Board of India (Delisting Adequate notice is given to all directors to schedule the of Equity Shares) Regulations, 2021 (Not Applicable Board Meetings, agenda and detailed notes on agenda to the Company during the Audit Period). were sent as per the requirements of the statute and a We have relied on the representations made by the system exists for seeking and obtaining further information Company and its officers for compliance under other and clarifications on the agenda items before the meeting laws specifically applicable to the industry to which the and for meaningful participation at the meeting. Company belongs, as under; As per the minutes of the meetings duly recorded and a. Information Technology Act, 2000 and the rules signed by the Chairman, the decisions of the Board were made thereunder. unanimous, and no dissenting views have been recorded. b. Special Economic Zones Act, 2005 and the rules We further report that based on the review of the compliance made thereunder. reports/certificates of the Company which were taken on record by the Board of Directors, there are adequate c. Software Technology Parks of India rules systems and processes in the Company commensurate and regulations. with the size and operations of the company to monitor and We have also examined compliance with the applicable ensure compliance with applicable laws, rules, regulations, clauses of the following: and guidelines. i. Secretarial Standards issued by The Institute of We further report that during the audit period the following Company Secretaries of India on meetings of the events/actions were having a major bearing on the Board of Directors and general meetings. Company’s affairs in pursuance of the above-mentioned laws, rules, regulations, guidelines etc., ii. Listing Agreements entered into by the Company with Bombay Stock Exchange Limited and National a) The Hon’ble National Company Law Tribunal, Stock Exchange of India Limited. Bengaluru bench vide its order dated June 06, 2025, approved the scheme of amalgamation for the merger We have not examined compliance by the Company with of wholly owned subsidiaries Wipro HR Services India applicable financial laws, like direct and indirect tax laws, Private Limited, Wipro Overseas IT Services Private since the same have been subject to review by statutory Limited, Wipro Technology Product Services Private financial audit and other designated professionals. Limited, Wipro Trademarks Holding Limited and Wipro During the period under review, the Company has VLSI Design Services India Private Limited with Wipro complied with the provisions of the Act, Rules, Regulations, Limited. As per the said scheme, the appointed date is Guidelines, etc. mentioned above. April 1, 2025.


LOGO

152 STATUTORY REPORTS AND FINANCIAL STATEMENTS BOARD’S REPORT b) Wipro Digital Inc. has been incorporated as a For V. SREEDHARAN & ASSOCIATES wholly-owned subsidiary of Wipro Limited (the Company Secretaries “Company”) with effect from August 4, 2025. c) On August 21, 2025, the Company entered into (V. Sreedharan) a definitive agreement to acquire the Digital Partner Transformation Solutions (DTS) business unit of FCS: 2347; CP No. 833 HARMAN, a Samsung company, a global provider of Engineering, Research & Development (ER&D) Place: Bengaluru services and Information Technology (IT) services Date: June 2, 2026 for a total consideration including earn outs of USD 375 million. Pursuant to the transaction, UDIN: F002347H000566625 Wipro Digital Inc., a wholly owned subsidiary, merged with Wipro Connected Services, Inc. Peer Review Certificate No. 5543/2024 (formerly known as Harman Connected Services, Inc.) with effect from December 1, 2025, following This report is to be read with our letter of even which Wipro Connected Services, Inc. became a date which is annexed as ‘Annexure -1’ and wholly owned subsidiary of Wipro Limited. forms an integral part of this report. - 26 2025 REPORT ANNUAL INTEGRATED WIPRO 


LOGO

153 ‘Annexure -1’ To, 5. The compliance of the provisions of Corporate and The Members other applicable laws, rules, regulations, standards is Wipro Limited, the responsibility of management. Our examination was Doddakannelli, Sarjapur Road, limited to the verification of procedures on test basis. Bengaluru—560035 6. The Secretarial Audit report is neither an assurance as to Our report of even date is to be read along with this letter: the future viability of the Company nor of the efficacy or effectiveness with which the management has conducted 1. Maintenance of secretarial record is the responsibility of the affairs of the Company. the management of the company. Our responsibility is to express an opinion on these secretarial records based on our audit. 2. We have followed the audit practices and processes as For V. SREEDHARAN & ASSOCIATES were appropriate to obtain reasonable assurance about the Company Secretaries correctness of the contents of the Secretarial records. The verification was done on test basis to ensure that correct (V. Sreedharan) facts are reflected in secretarial records. We believe that the Partner processes and practices, we followed provide a reasonable basis for our opinion. FCS: 2347; CP No. 833 3. We have not verified the correctness and appropriateness Place: Bengaluru of financial records and Books of Accounts of the company. Date: June 2, 2026 4. Wherever required, we have obtained the Management representation about the compliance of laws, rules and UDIN: F002347H000566625 regulations and happening of events etc. Peer Review Certificate No. 5543/2024


LOGO

154 STATUTORY REPORTS AND FINANCIAL STATEMENTS BOARD’S REPORT ANNEXURE IV ANNUAL REPORT ON CORPORATE SOCIAL RESPONSIBILITY (“CSR”) ACTIVITIES FOR FY 2025-26 1. Brief outline on CSR Policy of the Company: A brief outline of the Company’s CSR policy, including overview of the projects or programs proposed to be undertaken, is available at https://www.wipro.com/investors/corporate-governance/corporate-social-responsibility/. 2. Composition of CSR Committee: The Nomination and Remuneration Committee (“Committee”) also acts as the CSR Committee of the Company. The details of the Committee composition and meetings held during the year ended March 31, 2026 are provided below: Number of Number of meetings of Sl. meetings of CSR Name of Director Designation/Nature of Directorship CSR Committee No. Committee held attended during during the year the year 1. Tulsi Naidu@ Independent Director, Chairperson of the Committee 5 4 2. Patrick Dupuis@# Independent Director, Member of the Committee 5 5 3. Deepak M. Satwalekar Independent Director, Member of the Committee 5 5 4. Päivi Rekonen* Independent Director, Member of the Committee 5 2 @With effect from July 1, 2025, Ms. Tulsi Naidu was appointed as Chairperson of the Committee in place of Mr. Patrick Dupuis. Mr. Dupuis continued to serve as Member of the Committee. #Mr. Patrick Dupuis retired as an Independent Director of the Company with effect from the close of business hours on March 31, 2026, after completion of his tenure under Section 149(11) of the Companies Act, 2013. *The Committee was re-constituted during the year on account of appointment of Ms. Päivi Rekonen as Member, w.e.f. October 1, 2025. Since her appointment, two CSR committee meetings were held. 3. Provide the web-link(s) where Composition of CSR committee, CSR Policy and CSR projects approved by the Board are disclosed on the website of the Company: Details on composition of CSR committee, CSR Policy and CSR projects approved by the Board of Directors are available at https://www.wipro.com/investors/corporate-governance/corporate-social-responsibility/. - 26 2025 REPORT ANNUAL INTEGRATED WIPRO


LOGO

155 4. Provide the executive summary along with web-link(s) of Impact Assessment of CSR Projects carried out in pursuance of sub-rule (3) of rule 8, if applicable: As required under rule 8(3) of the Companies (Corporate Social Responsibility Policy) Rules, 2014, the Company has carried out impact assessment on the applicable projects. The reports of such assessments are available at https://www.wipro.com/investors/corporate-governance/corporate-social-responsibility/. A brief summary is provided below: Name of the agency Name & Key objectives of the Project that conducted the Impact created impact assessment Higher Education for Skills Building: • Bridging the gap between academic SaathiRe Social Impact • Provided a practical-based or hands-on project theory and industry practice, Solutions Pvt. Ltd. based learning that allows students to gain practical equipping participants with both experience while pursuing their education. technical and professional skills. • The programs provide students with a blend of • Providing students with career theoretical and practical knowledge, making them readiness and organizational talent industry-ready professionals. development, ensuring alignment • The tuition-free model and financial assistance with evolving IT industry needs. significantly lower financial barriers for students, particularly those from lower- to middle-income households. This equal access to higher education not only benefits students but also positively impacts their families by reducing financial burdens. Engineering Education: • Aims to strengthen the quality and SaathiRe Social Impact • The program has catalyzed a permanent shift from relevance of engineering learning Solutions Pvt. Ltd. theory-centric to Project Based Learning resulting through more practical, application- in an improved industry readiness and higher logical oriented approaches. thinking skills amongst students. • Building industry-ready engineering • The program integrates students into specialized talent by improving students’ education pathways while simultaneously cultivating technical competencies and a steady pipeline of skilled and experienced talent for employability skills aligned to the industry, thereby supporting the socio-economic evolving industry needs. upliftment of their families. Renewable Energy: • Evaluating the extent to which GIST Advisory Pvt. Ltd. • Highly positive impact is observed on environment, renewable energy has helped to health and safety aspects. create a positive impact on the • Substantial Greenhouse gas and water consumption environment. savings are achieved through adoption and use of renewable energy. 5. a) Average net profit of the Company as per sub-section (5) of section 135: K 102,102 Million b) Two percent of average net profit of the Company as per sub-section (5) of section 135: K 2,042 Million c) Surplus arising out of the CSR Projects or programmes or activities of the previous financial years: NIL d) Amount required to be set-off for the financial year, if any: K 738 Million. This includes an amount of K 227 Million, being set-off from the excess spend in FY 2022-23, K 250 Million, being set-off from the excess spend in FY 2023-24 and K 261 Million, being set-off from the excess spend in FY 2024-25. e) Total CSR obligation for the financial year [(b)+(c)-(d)]: K 1,304 Million 6. a) Amount spent on CSR Projects (both Ongoing Project and other than Ongoing Project): K 2,214 Million b) Amount spent on Administrative Overheads: K 58 Million c) Amount spent on Impact Assessment, if applicable: K 2 Million


LOGO

156 STATUTORY REPORTS AND FINANCIAL STATEMENTS BOARD’S REPORT d) Total amount spent for the Financial Year [(a)+(b)+(c)]: K 2,274 Million e) CSR amount spent or unspent for the Financial Year: Amount Unspent (in H) Total Amount transferred to Amount transferred to any fund specified under Total Amount Spent for the Unspent CSR Account as per Schedule VII as per second proviso to section 135(5) Financial Year (in H Million) section 135(6) Date of Name of Date of Amount Amount transfer the Fund transfer 2,274 NIL NA NA NIL NA (Inclusive of administrative overheads and amount spent on impact assessments) f) Excess amount for set-off, if any: Sl. Amount Particular No. (in H Million) (i) Two percent of average net profit of the Company as per sub-section (5) of section 135 2,042 (ii) Total CSR obligation for the financial year 2025-26 1,304* (iii) Total amount spent for the financial year 2,274 (iv) Excess amount spent for the financial year [(iii)-(ii)] 970 (v) Surplus arising out of the CSR projects or programmes or activities of the previous financial NIL years, if any (vi) Amount available for set off in succeeding Financial Years [(iv)-(v)] 970 *This excludes an aggregate amount of H 738 Million, being the amount set-off in FY 2025-26 from the excess spends of FY 2022-23, 2023-24 and FY 2024-25. 7. Details of Unspent Corporate Social Responsibility amount for the preceding three financial years: 1 2 3 4 5 6 7 8 Amount Balance Amount transferred transferred to Amount in Amount to a Fund as specified Amount Preceding Unspent CSR Unspent CSR Spent in the under Schedule VII as remaining to Sl. Financial Account under Account under Reporting per second proviso be spent in Deficiency, No. Year(s) sub-section (6) sub-section (6) Financial Year to sub-section (5) of succeeding if any of section 135 section 135 (in ) section 135, if any Financial of H Amount Date of Years (in H) (in H) (in H)—26 (in H) transfer 2025 1 FY-1 NIL NIL NIL NIL—NIL - 2 FY-2 NIL NIL NIL NIL—NIL -REPORT 3 FY-3 NIL NIL NIL NIL—NIL - 8. Whether any capital assets have been created or acquired through Corporate Social Responsibility amount spent ANNUAL in the Financial Year: Yes No INTEGRATED If yes, enter the number of capital assets created/acquired: Not Applicable WIPRO


LOGO

157 Furnish the details relating to such asset(s) so created or acquired through Corporate Social Responsibility amount spent in the financial year: Not Applicable (1) (2) (3) (4) (5) (6) Short particulars of the property or asset(s) Pincode of the Sl. Amount of CSR Details of entity/Authority/ [including complete property or Date of creation No. amount spent beneficiary of the registered owner address and location of asset(s) the property] CSR Name Registered Registration address Number, if applicable 9. Specify the reason(s), if the Company has failed to spend two per cent of the average net profit as per sub-section (5) of section 135: Not Applicable Sd/- Sd/- Srinivas Pallia Tulsi Naidu Chief Executive Officer and Managing Director Chairperson of Nomination and Remuneration Committee (DIN: 10574442) (DIN: 03017471)


LOGO

158 STATUTORY REPORTS AND FINANCIAL STATEMENTS CORPORATE GOVERNANCE REPORT I. Wipro’s Philosophy on Corporate Governance At Wipro, corporate governance is more than merely a compliance requirement, it is a core enabler of long-term value creation. Our governance philosophy is deeply rooted in the Spirit of Wipro, which reflects our unwavering commitment to ethical conduct, respect for all stakeholders and a passion for excellence. These values are beyond just principles; they define who we are, how we operate and what we aspire to become. In early 2020, our Chairman introduced the Five Habits as part of a Company-wide culture transformation initiative aimed at fostering a growth mindset. These habits are designed to translate our enduring values, defined in the Spirit of Wipro into everyday behaviors that shape how we lead, collaborate and grow. Together, the Spirit of Wipro and the Five Habits reinforce our organizational identity and guide our conduct in a rapidly evolving business environment. By aligning our governance practices with these Five Habits, our Company is fostering a high-performance culture that embraces inclusion, accountability, and transparent leadership. These behaviors ensure that our decisions are compliant and ethical while also prioritizing a human-centric and future-ready approach. Spirit of Wipro These values are our bedrock. They define and make us. Our character and destinies are energized by our values. Be passionate about clients’ success Governance Treat each person with respect Be global and responsible Unyielding integrity in everything we do 26 Five Habits - 2025 When our behaviors and ways of working consistently reflect our values, REPORT we see Five Habits in action. ANNUAL Being Respectful Being Responsive INTEGRATED Always Communicating Demonstrating Stewardship WIPRO CorporateReport Building Trust


LOGO

159 We consistently engage with associates to understand The Company seeks approval of shareholders on various their experience of these habits as part of our culture resolutions at the Annual General Meeting held every conversations. More than 238,000 associates worldwide year. In addition, approval of shareholders is also sought have been part of the interactive Five Habits sessions through postal ballot in case of urgency of the matter as with leaders, including over 40,000 managers who have per the applicable regulations. been part of the sessions led by our Chairman, Mr. Rishad A. Premji. The Spirit of Wipro and the Five Habits have III. Board of Directors become deeply ingrained in our daily ways of working, governance, and business conduct. Composition of Board We firmly believe that effective governance starts As of March 31, 2026, our Board had two Executive with leadership. At Wipro, our leaders are expected to exemplify our cultural and ethical standards, champion Directors, six Non-Executive Independent Directors behaviors aligned with the Five Habits, and foster an and one Non-Executive, Non-Independent Director. environment where individuals thrive through mutual The Executive Chairman, and the Non-Executive, Non-respect, open communication, and shared accountability. Independent Director are Promoter Directors. The CEO This is central to our culture and guides how we lead, make & MD is a professional CEO who is responsible for the decisions, and engage with stakeholders. day-to-day operations of the Company. Of the seven Non-Executive Directors, six are Independent Directors, Wipro’s corporate governance is implemented through a free from any business or other relationship that could multi-layered framework encompassing governance by materially influence their judgment. In the opinion of the shareholders, the Board of Directors, Board committees and Board, all the Independent Directors are independent of management processes. This is supported by robust board the management and satisfy the criteria of independence governance practices, strong internal control systems and as defined under the Companies Act, 2013, the Listing rigorous audit mechanisms that ensure transparency and Regulations and the NYSE Listed Company Manual. accountability at all levels. These are articulated through Wipro’s Code of Business Conduct, Corporate Governance The Board is well diversified and consists of two women Guidelines and various Board-chartered policies. Together, Independent Directors and five Directors who are these mechanisms not only ensure regulatory compliance foreign nationals. The composition of the Board and its but also reinforce the Spirit of Wipro and our Five Habits as Committees is in compliance with the Company’s Board cornerstones of ethical and performance-driven governance. Diversity Policy, requirements of the Companies Act, 2013 In this report, we have provided details on how the and Regulation 17 of the Listing Regulations. In accordance corporate governance principles are put into practice with these provisions, the Directors periodically submit within Wipro. the requisite disclosures regarding their directorships and committee memberships in other companies. II. Shareholders Dr. Patrick J. Ennis and Mr. Patrick Dupuis completed their The Companies Act, 2013, Listing Regulations and NYSE tenure as Independent Directors of the Company with Listed Company Manual prescribes the governance effect from the close of business hours on March 31, 2026. mechanism by shareholders in terms of passing of ordinary Ms. Laura Marie Miller was appointed as an Independent and special resolutions, voting rights, participation in Director for a term of five (5) years with effect from April 1, corporate actions such as bonus issue, buyback of shares, 2026. The appointment was approved by the Members of declaration of dividend, etc. The Company follows a robust the Company vide special resolution dated May 21, 2026, process to ensure that the shareholders of the Company passed through postal ballot by e-voting. are well informed of the Board decisions both on financial and non-financial matters and adequate notice with a The brief profile of the present Directors on the Board detailed explanation is sent to the shareholders well in is available on our website at https://www.wipro.com/ advance to obtain necessary approvals. leadership.


LOGO

160 STATUTORY REPORTS AND FINANCIAL STATEMENTS CORPORATE GOVERNANCE REPORT Board Meetings The Board meets at least once in every quarter to requirements, the Board’s approval is obtained by review the quarterly results and other items on the way of resolutions passed through circulation, in agenda and additional Board meetings are held to accordance with the provisions of the Companies address specific needs and business requirements Act, 2013. Such resolutions are subsequently placed of the Company. The Members of the Board have before the Board in the next meeting for noting complete freedom to express their opinion and and confirmation. decisions are taken after detailed discussions. The Board meetings are normally scheduled over The Board meeting dates are decided in consultation two days. In line with Regulation 9 read with Para 4 of with the Board members. The schedule of the Board Schedule B of SEBI (Prohibition of Insider Trading) and Committee meetings are communicated in Regulations, 2015, it is the endeavor of the Company that advance to the Directors to enable them to attend the the gap between the clearance of accounts by the Audit meetings. In instances of special and urgent business Committee and Board Meeting is as narrow as possible. Attendance of Directors at Board Meetings Details of attendance of Directors at the Board meetings for the year ended March 31, 2026, were as under: Total Total October January April 15- May 22, July 16- March 16, Number of Number of Name of the Director 1 15-16, 15-16, 1 16, 2025 2025 17, 2025 2026 Meetings Meetings 2025 2026 Held attended Rishad A. Premji Yes Yes Yes Yes Yes Yes 6 6 Azim H. Premji Yes Yes Yes Yes Yes Yes 6 6 Srinivas Pallia Yes Yes Yes Yes Yes Yes 6 6 Patrick J. Ennis Yes Yes Yes Yes Yes Yes 6 6 Patrick Dupuis Yes Yes Yes Yes No Yes 6 5 Deepak M. Satwalekar Yes Yes Yes Yes Yes Yes 6 6 Tulsi Naidu Yes Yes Yes Yes No Yes 6 5 Päivi Rekonen Yes Yes Yes Yes Yes Yes 6 6 N.S. Kannan Yes Yes Yes Yes Yes Yes 6 6 1Meeting was held through video-conferencing. Information flow to the Board Members Corporate Social Responsibility, corporate actions 26—such as dividend, buyback, bonus, review of internal 2025 Information is provided to the Board Members on a and statutory audits, details of investor grievances, continuous basis for their review, inputs, and approval. specific cases of acquisitions, important managerial Our quarterly financial statements and annual financial decisions, material positive/negative developments, REPORT statements are first presented to the Audit Committee and subsequently to the Board for their approval. In risk management initiatives including cybersecurity ANNUAL addition, various matters such as review of business along with mitigation actions and legal/statutory performance, annual strategic plan and operating matters are presented to the respective Committees plans of our business, appointment of Directors and of the Board and later with the recommendation Key Managerial Personnel, Succession Planning, of Committees to the Board of Directors for their INTEGRATED Related Party Transactions, annual action plan for approval, as may be required. WIPRO


LOGO

161 As a system, in most cases, information to Directors is Lead Independent Director submitted along with the agenda papers well in advance of the Board meeting. Inputs and feedback of Board The Board has designated Mr. Deepak M. Satwalekar Members are taken and considered while preparing as the Lead Independent Director. The role of the agenda and documents for the Board meeting. Sufficient Lead Independent Director is described in the time is allocated for discussions and deliberations at Corporate Governance guidelines of the Company the meeting. and is available on the Company’s website at Documents containing Unpublished Price Sensitive https://www.wipro.com/content/dam/nexus/en/investor/ corporate-governance/policies-and-guidelines/ethical-Information are submitted to the Board and Committee guidelines/12766-corporate-governance-guidelines.pdf. Members, at a shorter notice, as per the general consent taken from the Board, from time to time. Given that our Board is composed of Directors based Policy for Nomination of Directors, their Remuneration and Board Diversity in different parts of the world, in-person attendance at all meetings may not always be feasible. To ensure The Nomination and Remuneration Committee has effective participation and seamless decision-making, adopted a policy for the selection and appointment of the Company facilitates attendance through video Directors, including the determination of qualifications, conferencing and other audio-visual means, enabling independence, and remuneration of Directors, Key Directors who are traveling or located remotely to actively Managerial Personnel, and Senior Management Personnel, engage in the proceedings. in accordance with Section 178(3) of the Companies Act, 2013. The policy forms part of the Committee’s Post the Board meeting, we have a formal system for charter and is available on the Company’s website at follow-up, review and reporting on actions taken by https://www.wipro.com/content/dam/nexus/en/investor/ the Management on the decisions of the Board and corporate-governance/policies-and-guidelines/ethical-its Committees. guidelines/wipro-limited-Remuneration-policy.pdf. Appointment of Directors The Company has also adopted a policy on Board Diversity which guides the organization’s The Board has adopted the provisions with respect approach to diversity in the composition of the to appointment and tenure of Independent Directors Board and is available on the Company’s website at consistent with the Companies Act, 2013 and the https://www.wipro.com/content/dam/nexus/en/investor/ Listing Regulations. corporate-governance/policies-and-guidelines/ethical- As per the provisions of the Companies Act, 2013, the guidelines/policy-on-appointment-of-directors-and-Independent Directors shall be appointed for not more board-diversity.pdf. than two terms of a maximum of five years each and shall Criteria for Selection of Independent not be liable to retire by rotation. At the time of appointment of an Independent Director, the Directors and Key Skills, Expertise, and Core Competencies of the Board Company issues a formal letter of appointment outlining their role, functions, duties, and responsibilities. The template The Board of the Company comprises of eminent of the letter of appointment is available on our website at personalities and leaders in their respective fields. These https://www.wipro.com/content/dam/nexus/en/investor/ Directors are nominated based on well-defined selection corporate-governance/policies-and-guidelines/ethical- criteria. The Nomination and Remuneration Committee guidelines/template-of-letter-of-appointment-to- considers, inter alia, experience, qualifications, skills, independent-directors.pdf. expertise, and competencies, whilst recommending to the Board the candidature for appointment of Details of the Director proposed for re-appointment at th Independent Director. the 80 Annual General Meeting (“AGM”) is provided at page 129 as part of the Board’s Report and in the notice In case of appointment of Independent Directors, the convening the 80th AGM. Nomination and Remuneration Committee satisfies


LOGO

162 STATUTORY REPORTS AND FINANCIAL STATEMENTS CORPORATE GOVERNANCE REPORT itself about the independence of the Directors as Directors are not disqualified for appointment vis-à-vis the Company to enable the Board to function under Section 164 and other applicable provisions of independently of the management and discharges the Companies Act, 2013 and the Listing Regulations its functions and duties effectively. In case of and that they are not debarred from holding the office re-appointment of Independent Directors, the Board also by virtue of SEBI order or any other authority. takes into consideration the performance evaluation As required under Rule 6 of the Companies and engagement level of the Independent Directors. (Appointment and Qualification of Directors) Rules, The Nomination and Remuneration Committee 2014, all Independent Directors have completed the ensures that the candidates identified for appointment registration with the Independent Directors Databank. In the opinion of the Board and the Nomination and Remuneration Committee, all the Directors of the Company possess below relevant skills, expertise, and competence1 to ensure effective functioning of the Company as per the matrix given below: Wide Management and Leadership experience Strong management and leadership experience, including in areas of business development, strategic Information Technology planning and mergers and acquisitions with major public companies having successful multinational operations Expertise or experience in information technology business, in technology, manufacturing, banking, investments and technology consulting and operations, emerging areas finance, international business, scientific research and of technology such as digital, cloud and cyber security, development, senior level government experience and intellectual property in information technology domain, artificial academic administration. intelligence and knowledge of technology trends. Functional and Managerial Experience Knowledge and skills in accounting and finance, business Diversity judgement, general management practices and processes, Diversity of thought, experience, knowledge, crisis response and management, industry knowledge, perspective, gender, and culture brought to the macro-economic perspectives, human resources, labour Board by individual members. Varied mix of strategic laws, international markets, sales and marketing, and risk perspectives, geographical focus with knowledge management. and understanding of key geographies. - 26 2025 Corporate Governance Experience in developing and implementing good corporate REPORT Personal Values governance practices, maintaining board and management Personal characteristics that match the Company’s accountability, managing stakeholders’ interests and values, such as integrity, accountability, and high- Company’s responsibilities towards customers, employees, ANNUAL performance standards. suppliers, investors, regulatory bodies, and the communities in which it operates. Experience in boards and committees of INTEGRATED other large companies. 1These skills/competencies are broad-based, encompassing several areas of expertise/experience as shown in the table above. Each Director WIPRO may possess varied combinations of skills/experience within the described set of parameters.


LOGO

163 Familiarization Program and Training for The Nomination and Remuneration Committee Directors implements this mechanism in concurrence with the Board. The Company has an extensive orientation/familiarization The Nomination and Remuneration Committee presents programme for its Directors covering the following: to the Board on a periodic basis, succession plans for a) Culture, values and orientation covering the Spirit of appointments to the Board based on various factors such Wipro, five habits, vision & aspirations. as current tenure of Directors, outcome of performance evaluation, Board diversity and business requirements, b) Board composition, roles & responsibilities, among others. In addition, the Company conducts duties and obligations of a member of the Board. bi-annual talent review process for Senior Management Board Committee composition, functioning of and other executive officers which provides a leadership-the Committee. level talent inventory and capability map that reflects the c) Business and industry context covering IT industry extent to which critical talent needs are fulfilled vis-à-vis overview, strategy, business model, financial metrics, business drivers. key milestones and historical perspective. d) Corporate governance framework including; risk Board Evaluation management, compliance & ethics, and internal audit. Details of methodology adopted for Board evaluation have As a process, when a new Director is appointed, a been provided at page 129 to 130 of the Board’s Report. familiarization programme is conducted by the senior management team. Each of our Directors has attended Remuneration Policy and Criteria for Making such orientation process/familiarization programme when Payments to Directors, Senior Management they were inducted into the Board and on an ongoing and Key Managerial Personnel basis at regular intervals. The Independent Directors are entitled to receive As a part of ongoing training, the Company schedules remuneration by way of sitting fees, reimbursement quarterly one-on-one meetings of business and functional of expenses for participation in the Board/Committee heads with the Directors. During these meetings, meetings and commission as detailed hereunder: comprehensive presentations would be made on various aspects such as, state of global IT services industry, new a) Sitting fees for each meeting of the Board attended business initiatives, trends in technology including digital by them, of such sum as may be approved by the transformation, artificial intelligence, human resources Board within the overall limits prescribed under the practices, risk management, cyber security and client updates, Companies Act, 2013 and the rules made thereunder. etc. These meetings also facilitate Directors to provide their b) Commission on a quarterly basis, as determined by the inputs and suggestions on various strategic and operational Board and Members, based on the recommendation matters directly to the business and functional heads. of the Nomination and Remuneration Committee. The details of the familiarization programmes are available The aggregate commission payable to all the on the website of the Company at https://www.wipro. Independent Directors and Non-Executive Directors com/content/dam/nexus/en/investor/corporate- put together shall not exceed 1% of the net profits governance/policies-and-guidelines/ethical-guidelines/ of the Company during any financial year. The Familiarization-programmes-imparted-to-independent- commission is payable on pro-rata basis to those directors-in-fy-2027.pdf. Directors who occupy office for part of the year. c) Reimbursement of travel, stay and other expenses Succession Planning for participation in Board/Committee meetings. We have an effective mechanism for succession planning d) Independent Directors and Promoter Directors which focuses on orderly succession of Directors, are not entitled to participate in the stock option including Executive Directors, Key Managerial Personnel, schemes of the Company. Senior Management and other executive officers.


LOGO

164 STATUTORY REPORTS AND FINANCIAL STATEMENTS CORPORATE GOVERNANCE REPORT Following are the terms and conditions for and Senior Management, the Nomination and determining the remuneration to Mr. Azim H. Premji, Remuneration Committee and the Board shall ensure/ who is a Non-Executive, Non-Independent Director: consider the following: a) Remuneration as applicable to other Non- a) The balance between fixed and variable pay Executive Directors of the Company in addition reflecting short and long-term performance to the sitting fees for attending the meetings of objectives, appropriate to the working of the the Board thereof, as may be determined by the Company and its goals. Board, provided however that, the aggregate b) Alignment of remuneration of Key Managerial remuneration including commission, paid to the Personnel and Directors with long-term interests Directors other than the Managing Director and of the Company. Whole-Time Director in a financial year shall not c) Company’s performance vis-à-vis the annual exceed 1% of the net profits of the Company, achievement, individuals’ performance vis-à-vis in terms of Section 197 of the Companies Act, KRAs/KPIs. 2013 and computed in the manner referred to in Section 198 of the Companies Act, 2013. d) Industry benchmark and current compensation b) Maintenance of Founder Chairman’s office trends in the market. including an executive assistant at Company’s The Nomination and Remuneration Committee expense. recommends the remuneration for the Chairman, CEO c) Reimbursement of travel, stay, and entertainment and Managing Director, Key Managerial Personnel expenses incurred in the course of business as and Senior Management to the Board of Directors. per the Company’s policy. The payment of remuneration to the Executive Directors and Non-Executive Directors is approved In determining the remuneration of Chairman, CEO by the Board and Members. There was no change to and Managing Director, Key Managerial Personnel the remuneration policy during the financial year. Details of remuneration to Directors Details of remuneration paid to the Directors for the services rendered during the financial year 2025-26 are given below. No stock options were granted to any of the Independent Directors and Promoter Directors during the financial year 2025-26. None of the Non-Executive Directors received remuneration exceeding 50% of the total annual remuneration paid to all Non-Executive Directors for the year ended March 31, 2026. (H in Millions) Rishad A. Srinivas Azim H. Patrick J. Patrick Deepak M. Tulsi Päivi N. S. Premji(1) Pallia* (2) Premji Ennis* Dupuis* Satwalekar Naidu* Rekonen* Kannan - 26 2025 Salary 25.45 154.99 0 0 0 0 0 0 0 Allowances 37.71 0 0 0 0 0 0 0 0 Commission/Incentives/ 2.17 98.55 10 24.63 25.47 19.09 25.15 19.46 13.31 REPORT Variable Pay Other annual compensation 0.34 232.69 0 0 0 0 0 0 0 ANNUAL Retirals 6.87 10.18 0 0 0 0 0 0 0 Sitting fees 0 0 0.60 0.60 0.60 0.60 0.60 0.60 0.60 Total 72.54 496.41 10.60 25.23 26.07 19.69 25.75 20.06 13.91 Notice period Up to Up to NA NA NA NA NA NA NA INTEGRATED 180 days 180 days *Figures mentioned in H are equivalent to amounts paid in foreign currency, wherever applicable. WIPRO Figures in the above table are subject to rounding-off adjustments.


LOGO

165 Notes: 1. Mr. Rishad A. Premji’s remuneration comprises of a fixed pay and commission at the rate of 0.35% on the incremental consolidated net profits of the Company over the previous financial year. However, the incremental consolidated net profits for financial year 2025-26, reflected a comparatively moderate increase as against the previous year. Accordingly, during the year the fixed pay was fully paid, while commission was determined in line with the approved framework, the overall impact on his remuneration represents a decline compared to the financial year 2024-25. His fixed pay for FY 2025-26 amounted to H 70.37 Million, and the commission (variable pay) was H 2.17 Million. 2. Mr. Srinivas Pallia’s remuneration comprises of fixed pay including Restricted Stock Units and variable pay including Performance Stock Units linked to the achievement of the Company’s performance parameters; revenue and profitability. For Mr. Pallia, target fixed pay and variable pay ratio is 41.7% and 58.3% respectively. His actual fixed pay for financial year 2025-26 stood at H 290.26 million, while the variable pay, linked to achievement of performance targets and including vesting of Performance Stock Units, was lower for the year and stood at H 206.15 million. The remuneration of Mr. Srinivas Pallia is computed on an accrual basis and includes the amortisation of RSUs granted to him, which will vest over a period of time, and PSUs that will vest based on the Company’s performance parameters. During the financial year 2025-26, Mr. Pallia was granted: a) 525,000 RSUs under the Wipro Employee Stock Option, Performance Stock Unit and Restricted Stock Unit Scheme 2024, effective May 3, 2025, to vest over a period of three years. b) 975,000 PSUs under the under the Wipro Employee Stock Option, Performance Stock Unit and Restricted Stock Unit Scheme 2024, effective May 3, 2025, to vest over a period of three years, subject to achievement of specified financial milestones. These milestones relate to revenue, EBIT and free cash flow, with weightages assigned at 40% each for revenue and EBIT, and 20% for free cash flow. Terms of Employment Arrangements Under the Companies Act, 2013, our shareholders must gratuity which are offered to all of our employees, but no approve the salary, bonus, and benefits of all Executive other benefits upon termination of employment except as Directors. Each of our Executive Directors has signed mentioned below. an agreement containing the terms and conditions of Pursuant to the terms of the employment arrangement employment, including a monthly salary, performance with Mr. Srinivas Pallia, if his employment is terminated by bonus and benefits including vacation, medical the Company, the Company is required to pay Mr. Srinivas reimbursement, and pension fund contributions. These Pallia, severance pay equivalent of 12 months’ base salary. agreements have varying terms, but either we or the Executive Director may generally terminate the agreement We also indemnify our Directors and Officers for claims upon six months’ notice to the other party. brought under any rule of law to the fullest extent permitted The terms of our employment arrangements with by applicable law. Mr. Rishad A. Premji, Mr. Srinivas Pallia and Ms. Aparna Iyer provide for up to a 180 days’ notice period in the Among other things, we agree to indemnify our Directors event of resignation, and country-specific leave and Officers for certain expenses, judgments, fines, and allowances in addition to statutory holidays, and an settlement amounts incurred in any action or proceeding, annual compensation review. Additionally, these officers including any action by or in the right of the Company, are required to relocate as we may determine, and to arising out of such person’s services as our Director or comply with confidentiality provisions. Service contracts Officer, and such other claims which are covered by the with our Executive Directors and Officers provide for our Directors and Officers liability insurance policy taken by standard retirement benefits that consist of a pension and the Company.


LOGO

WIPRO INTEGRATED ANNUAL REPORT 2025-26 166 Key information pertaining to Directors as on March 31, 2026, is given below: Chairmanship Membership Name of Attendance in in Other listed the Director Relationship Date of Directorship at the last No. of shares Sl. Committees Committees Companies where and Director with Designation initial in other AGM held held as on STATUTORY No. 1 2 of Board of Board the Director holds Identification Directors appointment Companies on July 16, March 31, 2026 2 of other of other Directorship Number (DIN) 3 3 2025 Companies Companies 1. Rishad A. Premji Son of Azim Executive Director and 1-May-2015 7 — Yes 13,537,7824—REPORTS (DIN: 02983899) H. Premji Chairman 2. Azim H. Premji Father of Non-Executive, 1-Sep-1968 9 — Yes 7,616,840,8984,5—AND (DIN: 00234280) Rishad A. Non-Independent Premji Director 3. Srinivas Pallia None Chief Executive Officer 7-Apr-2024 ——Yes 200,000 - (DIN: 10574442) and Managing Director 350,3706 FINANCIAL 4. Patrick J. Ennis None Independent Director 1-Apr-2016 ——Yes — (DIN: 07463299) 5. Patrick Dupuis None Independent Director 1-Apr-2016 ——Yes —(DIN: 07480046) 6. Deepak M. None Independent Director 1-Jul-2020 2 — Yes—Home First STATEMENTS Satwalekar Finance Company (DIN: 00009627) India Limited (Independent Director) 7. Tulsi Naidu None Independent Director 1-Jul-2021 1 — Yes —(DIN: 03017471) 8. Päivi Rekonen None Independent Director 1-Oct-2022 ——Yes — (DIN: 09669696) CORPORATE 9. N. S. Kannan None Independent Director 1-Oct-2023 3 2—Yes —(DIN: 00066009) 1 Dr. Patrick J. Ennis and Mr. Patrick Dupuis were re-appointed as Independent Directors of the Company for a second term of five (5) consecutive years with effect from April 1, 2021 to March 31, 2026. Upon completion of their tenure in accordance with Section 149(11) of the Companies Act, 2013, Dr. Patrick J. Ennis and Mr. Patrick Dupuis ceased to be Directors of the Company with effect from the close of business hours on March 31, 2026. GOVERNANCE Mr. Deepak M. Satwalekar was re-appointed as an Independent Director of the Company for a second term of five (5) consecutive years, with effect from July 1, 2025 to June 30, 2030. Ms. Tulsi Naidu was appointed as an Independent Director for a period of five (5) years from July 1, 2021 to June 30, 2026. She has been re-appointed as an Independent Director for REPORT a second term of five (5) consecutive years with effect from July 1, 2026 to June 30, 2031. Ms. Päivi Rekonen was appointed as an Independent Director of the Company for a period of five (5) years with effect from October 1, 2022 to September 30, 2027. Mr. N. S. Kannan was appointed as an Independent Director of the Company for a period of five (5) years with effect from October 1, 2023 to September 30, 2028. 2 This does not include position in foreign companies or as an advisory board member but includes position in private companies and companies under Section 8 of the Companies Act, 2013. None of our Directors hold directorship in more than seven listed companies. 3 In accordance with Regulation 26 of the Listing Regulations, Membership/Chairmanship of only Audit Committees and Stakeholders’ Relationship Committees in all public limited companies have been considered.


LOGO

167 4 Includes equity shares held with immediate family members. 5 Out of 7,616,840,898 equity shares held in the Company, Mr. Azim H. Premji disclaims the beneficial ownership of 680,385,966 equity shares held by Azim Premji Trust and 27,724,830 equity shares held by Azim Premji Philanthropic Initiatives Private Limited. 6 Represents ADSs having equivalent underlying equity shares. • None of the Independent Director(s) of the Company has resigned before the expiry of their tenure. • Ms. Laura Marie Miller (DIN: 11546063) was appointed as an Independent Director for a term of five (5) years with effect from April 1, 2026, to March 31, 2031. IV. Committees of Board Our Board has constituted Committees to focus on specific areas and make informed decisions within the authority delegated to each of the Committees. Each Committee of the Board is guided by its Charter, which defines the scope, powers, and composition of the Committee. All decisions and recommendations of the Committees are placed before the Board for information or approval. During the financial year, the Board has accepted all the recommendations of Committees on matters where such a recommendation is mandatorily required. There have been no instances where such recommendations have not been considered. We have three Committees of the Board as of March 31, 2026. The details are provided below: Constitution of the Committees Nomination and Remuneration Committee2 Administrative and Shareholders/Investors Audit, Risk and Compliance Committee1 (It also acts as Corporate Social Grievance Committee (Stakeholders Responsibility Committee) Relationship Committee) Mr. Deepak M. Satwalekar Ms. Tulsi Naidu3 Mr. Deepak M. Satwalekar Ms. Tulsi Naidu Mr. Deepak M. Satwalekar Mr. Rishad A. Premji Mr. N. S. Kannan Mr. Patrick Dupuis4 Dr. Patrick J. Ennis4 Ms. Päivi Rekonen5 Chairperson Member 1 Audit, Risk and Compliance Committee is also the Risk Management Committee. 2 Nomination and Remuneration Committee also acts as Corporate Social Responsibility Committee. 3 With effect from July 1, 2025, Ms. Tulsi Naidu was appointed as Chairperson of the Committee in place of Mr. Patrick Dupuis. Mr. Dupuis continued to serve as Member of the Committee. 4 Dr. Patrick J. Ennis and Mr. Patrick Dupuis, Independent Directors, completed their term as Independent Directors of the Company with effect from the close of business hours on March 31, 2026. 5 Ms. Päivi Rekonen was appointed as member of the Nomination and Remuneration Committee w.e.f. October 1, 2025. - Ms. Päivi Rekonen was appointed as member of the Administrative and Shareholders/Investors Grievance Committee w.e.f. April 1, 2026. Note: The Chairperson and Members of all the Committees were present at the 79th AGM of the Company held on July 16, 2025.


LOGO

168 STATUTORY REPORTS AND FINANCIAL STATEMENTS CORPORATE GOVERNANCE REPORT The terms of reference for each of the Committees of h. Review of utilization of loans and advances the Board as required under Schedule V of the Listing from, and investment by, the Company in Regulations are provided below: its subsidiaries; Audit, Risk and Compliance Committee i. Evaluation of internal financial controls, and monitoring and reviewing of the risk management The Audit, Risk and Compliance Committee of our plan and such other functions as the Board of Board is constituted in line with the provisions of Directors may deem fit; Regulation 18 and 21 of the Listing Regulations, j. Formulation and implementation of the risk Section 177 of the Companies Act, 2013 and management policy, including evaluating the Sections 303A.06 and 303A.07 of NYSE Listed adequacy of risk management and internal Company Manual. It reviews, acts on and reports control systems; to our Board with respect to various auditing and accounting matters. This Committee is also k. Approval of appointment of Chief Financial the Risk Management Committee. The roles and Officer of the Company after assessing the responsibilities include overseeing: qualifications, experience and background, including remuneration and terms of appointment a. Auditing and accounting matters, including of the candidate; and recommending the appointment of our independent auditors to the shareholders; l. Evaluation of risks related to cybersecurity and significant risk exposures of the Company and b. To oversee the independence of the external assessment of steps taken by management auditors and review any disclosed relationships to mitigate the exposures in a timely manner or services that may impact the objectivity and (including business continuity and disaster independence of the external auditors; recovery planning). c. Integrity of the Company’s financial statements The detailed charter of the Committee is available and discussions with the independent auditors on our website at https://www.wipro.com/investors/ regarding the scope of the annual audits and corporate-governance/charters/. fees to be paid to the independent auditors; All members of our Audit, Risk and Compliance d. Performance of the Company’s internal audit Committee are Independent Non-Executive Directors function, independent auditors and accounting who are financially literate. The Chairman of our Audit, practices; Risk and Compliance Committee has accounting and e. Compliance with legal and statutory requirements; related financial management expertise. f. Review and approval of related party transactions Statutory Auditors as well as Internal Auditors have and functioning of whistle blower mechanism; independent meetings with the Audit, Risk and Compliance Committee and also participate in the 26 g. Implementation of the applicable provisions - Audit, Risk and Compliance Committee meetings. Our of the Sarbanes-Oxley Act, including review of 2025 Chief Financial Officer and other corporate officers the progress of internal control mechanisms to make periodic presentations to the Audit, Risk and prepare for certification under Section 404 of the REPORT Compliance Committee on various issues. Sarbanes-Oxley Act; ANNUAL The composition and attendance of Members at the meetings held during FY 2025-26, were as under: Total Number Total Number April May July October January Name of the Director 1 of Meetings of Meetings 15, 2025 22, 2025 16, 2025 15, 2025 15, 2026 Held attended INTEGRATED Deepak M. Satwalekar Yes Yes Yes Yes Yes 5 5 Tulsi Naidu Yes Yes Yes Yes No 5 4 N. S. Kannan Yes Yes Yes Yes Yes 5 5 WIPRO 1Meeting was held through video-conferencing.


LOGO

169 Nomination and Remuneration Committee g) Talent development, employee engagement and retention; The Nomination and Remuneration Committee is h) Formulating compensation policies, including for constituted in line with the provisions of Regulation 19 Whole-Time Directors, Key Personnel, Chairman of of the Listing Regulations, Section 135 and 178 of the the Company, CEO, Key Management Personnel, Companies Act, 2013 and Sections 303A.04 and 303A.05 Senior Management Personnel and other employees, of NYSE Listed Company Manual. It reviews, acts on and in such a manner so as to attract and retain talent; reports to our Board with respect to various nomination and remuneration matters. This Committee also acts as i) Ensuring orderly succession planning for Board the Corporate Social Responsibility Committee. members, Key Managerial Personnel, and The roles and responsibilities of the Committee include: Senior Management; a) Determining the composition of the Board of j) Formulating, adopting, administering, enforcing, and Directors and the Committees of the Board; modifying the employee stock option schemes; and b) Identifying persons who are qualified to become k) Formulating and recommending to the Board a Directors, Key Managerial Personnel and who may Corporate Social Responsibility (“CSR”) policy be appointed as Senior Management in accordance which shall indicate the activities to be undertaken with the criteria laid down and recommends to the by the Company. Board their appointment and removal; The detailed charter of the Committee is available on our c) Formulating the criteria for determining qualifications, website at https://www.wipro.com/investors/corporate-positive attributes, and independence of a Director; governance/charters/. d) Developing, periodically reviewing, and recommending Our Chief Human Resources Officer makes periodic to the Board a set of corporate governance guidelines; presentations to the Nomination and Remuneration Committee on compensation reviews and performance e) Reviewing the Company’s policies that relate to linked compensation recommendations. All Members ESG matters; of the Nomination and Remuneration Committee are f) Carrying out evaluation of the Board, its Committees Independent Non-Executive Directors. The Nomination and every Director’s performance in accordance with and Remuneration Committee is the apex body that established evaluation criteria; oversees our CSR policy and programs. The composition and attendance of Members at the meetings held during FY 2025-26, were as under: Total Number Total Number April May July October January Name of the Director 1 1 of Meetings of Meetings 15, 2025 22, 2025 16, 2025 15, 2025 15, 2026 Held attended Tulsi Naidu2 Yes No Yes Yes Yes 5 4 Deepak M. Satwalekar Yes Yes Yes Yes Yes 5 5 Patrick Dupuis3 Yes Yes Yes Yes Yes 5 5 Päivi Rekonen4 NA NA NA Yes Yes 5 2 1Meeting was held through video-conferencing. 2With effect from July 1, 2025, Ms. Tulsi Naidu was appointed as Chairperson of the Committee in place of Mr. Patrick Dupuis. Mr. Dupuis continued to serve as Member of the Committee. 3Mr. Patrick Dupuis ceased to be Director of the Company with effect from the close of business hours on March 31, 2026. 4Ms. Päivi Rekonen was appointed as Member of the Committee, w.e.f. October 1, 2025. Since her appointment, two Committee meetings were held.


LOGO

170 STATUTORY REPORTS AND FINANCIAL STATEMENTS CORPORATE GOVERNANCE REPORT Administrative and Shareholders/ d) Reviewing the measures taken by the Company for Investors Grievance Committee effective exercise of voting rights by shareholders; (Stakeholders Relationship Committee) e) Implementing and overseeing the procedures and processes in handling and maintenance of The Administrative and Shareholders/Investors records, transfer of securities and payment of Grievance Committee carries out the role of dividend by the Company, RTA, and dividend Stakeholders Relationship Committee in compliance processing bank; with Section 178 of the Companies Act, 2013 and f) Reviewing the various measures and initiatives Regulation 20 of the Listing Regulations. taken by the Company for reducing the quantum The Administrative and Shareholders/Investors of unclaimed dividends and ensuring timely receipt Grievance Committee reviews, acts on and reports to of dividend warrants, annual reports, and statutory our Board with respect to various matters relating to notices by the shareholders of the Company; stakeholders. The roles and responsibilities include: g) Overseeing administrative matters like opening a) Redressal of grievances of the shareholders and closure of Company’s bank accounts, grant, of the Company pertaining to transfer or and revocation of general, specific, and banking transmission of shares, non-receipt of annual powers of attorney; and report and declared dividends, issue of new h) Considering and approving allotment of equity or duplicate share certificates, and grievances shares pursuant to exercise of stock options, setting pertaining to corporate actions; up branch offices and other administrative matters b) Approving consolidation, split or sub-division of as delegated by the Board, from time to time. share certificates, transmission of shares, issue The detailed charter of the Committee is available of duplicate share certificates, re-materialization on our website at https://www.wipro.com/investors/ of shares; corporate-governance/charters/. c) Reviewing the grievance redressal mechanism Mr. M. Sanaulla Khan, Company Secretary, is our implemented by the Company in coordination Compliance Officer under the Listing Regulations. with Company’s Registrar and Transfer Agent (“RTA”) from time to time; The composition and attendance of Members at the meetings held during FY 2025-26, were as under: Total Number Total Number April July October January Name of the Director of Meetings of Meetings 15, 2025 16, 2025 15, 2025 15, 2026 Held attended Deepak M. Satwalekar Yes Yes Yes Yes 4 4 Patrick J. Ennis1 Yes Yes Yes Yes 4 4—26 Rishad A. Premji Yes Yes Yes Yes 4 4 2025 1Dr. Patrick J. Ennis ceased to be Director of the Company with effect from the close of business hours on March 31, 2026. REPORT ANNUAL INTEGRATED WIPRO


LOGO

171 Status report of investor queries and complaints for the period from April 1, 2025 to March 31, 2026 is given below: Sl. No. of Particulars No. Complaints 1. Investor complaints pending at the beginning of the year 5 2. Investor complaints received during the year 9941 3. Investor complaints disposed of during the year 997 4. Investor complaints remaining unresolved at the end of the year 22 1Out of the 994 complaints received, 553 were investor requests regarding annual report and bonus issue related clarifications. 2These queries were received between March 28, 2026 to March 31, 2026 and subsequently responded by April 6, 2026. Apart from these queries/complaints, there are pending cases relating to dispute over title to shares in which, in certain cases, the Company has been made a party. However, these cases are not material in nature. IV. Particulars of Senior Management The particulars of senior management as per Regulation 16(1)(d) of the Listing Regulations including the changes during the financial year 2025-26 are as follows: Name of Senior Management Effective Date of change Designation Personnel (SMP) during FY 2025-26 Srinivas Pallia Chief Executive Officer and Managing Director -Aparna Iyer Senior Vice President and Chief Financial Officer -M. Sanaulla Khan Senior Vice President and Company Secretary - Saurabh Govil President and Chief Human Resources Officer -Nagendra P Bandaru* President and Managing Partner of Technology Services Global -Business Lines (GBLs) Suzanne Dann** Chief Executive Officer, Americas 2 -Malay Joshi Chief Executive Officer, Americas 1 -Sanjeev Jain Chief Operating Officer -Jasjit Singh Kang Managing Partner and Global Head – Business Process Services April 1, 2025 Omkar Nisal Chief Executive Officer, Europe -Srikumar Rao Managing Partner and Global Head—Engineering -Vinay Firake Chief Executive Officer, APMEA -Amit Kumar Managing Partner and Global Head, Wipro Consulting -Hari Shetty Chief Strategist and Technology Officer -Tejal Patil Senior Vice President and General Counsel -Raghuraman Ranganathan Chief Risk & Assurance Officer -Pavan N Rao Head of Internal Audit - Notes: *Mr. Nagendra Bandaru was appointed as Chief Executive Officer – AI-Native Business & Platforms Unit, with effect from April 1, 2026. Mr. Kanwar Singh assumed charge as President and Managing Partner – Technology Services GBLs, with effect from April 1, 2026. ** Ms. Suzanne Dann ceased to be Chief Executive Officer, Americas 2 with effect from the close of business hours of May 3, 2026. The following employee ceased to be designated as Senior Management Personnel during FY 2025-26: 1. Mr. Jo Debecker, Managing Partner and Global Head- Wipro FullStride Cloud, resigned with effect from close of business hours of April 4, 2025.


LOGO

172 STATUTORY REPORTS AND FINANCIAL STATEMENTS CORPORATE GOVERNANCE REPORT V. Governance Through Management The internal audit function is guided by its charter, Process as approved by the Audit, Risk and Compliance Committee and is available on the Company’s website Code of Business Conduct at https://www.wipro.com/content/dam/nexus/en/ investor/corporate-governance/charters/charters- In the year 1983, we articulated ‘Wipro Beliefs’ of-the-committees/internal-audit-charter.pdf. The consisting of six statements. At the core of beliefs internal audit function formulates an annual risk-based was integrity, articulated as “individual and company audit plan based on consultations and inputs from the relationship should be governed by the highest senior management and presents it to the Audit, Risk standard of conduct and integrity”. and Compliance Committee for approval. Findings of various audits carried out during the financial year Over the years, this articulation has evolved in form are also periodically presented to the Audit, Risk and but remained constant in substance. Today, we Compliance Committee. The internal audit function articulate it as Code of Business Conduct. At Wipro, adopts a risk-based audit approach and covers core the Board and all employees have a responsibility to areas such as regulatory compliance, financial audits, understand and follow the Code of Business Conduct. technology audits, third party risk audits, etc. All employees are expected to perform their work with The internal audit team comprises of personnel with honesty and integrity. professional qualifications, expertise and certifications Wipro’s Code of Business Conduct reflects general in audit and is rich in diversity. The audit team hones principles to guide employees in making ethical its skills through a robust knowledge management decisions. This Code is also applicable to our program to continuously assimilate the latest trends and representatives. This Code outlines fundamental skills in the domain and to retain the knowledge gained ethical considerations as well as specific considerations for future reference and dissemination. The internal audit that need to be maintained for professional conduct. team confirms its independence across all its staff. This Code has been displayed on the Company’s The Head of Internal Audit reports to the Chairman website at https://www.wipro.com/content/dam/ of the Audit, Risk and Compliance Committee and administratively to the Chief Risk & Assurance Officer. nexus/en/investor/corporate-governance/policies-The Head of Internal Audit has regular and exclusive and-guidelines/ethical-guidelines/code-of-business-meetings with the Audit, Risk and Compliance Committee. conduct-and-ethics.pdf. The function, which was the first Indian Internal audit unit Internal Audit to get ISO certified in 1998 was also an early adopter The Company has a robust Internal Audit function of the new ISO 9001:2015 version. ISO certification is annually renewed through a review by external which has been in place for last 4 decades with the accreditation body (DNV). Internal Audit function is in stated vision “to be amongst the best-in-class Internal conformance with the Global Internal Audit Standards 26—Audit function globally”. In pursuit of this vision, the issued by International Institute of Internal Auditors 2025 function provides independent objective assurance (“IIA”) and adheres to the highest standards under its and consulting services designed to add value and Quality Assurance & Improvement Program (“QAIP”). REPORT improve the organization’s operations by: The conformance has been reviewed by external firm (KPMG) since financial year 2019-20 & latest review of a) Assurance Reviews conformance was concluded in the financial year 2025-26. ANNUAL b) Operational Reviews c) Special Assignments Disclosure Policy d) Anti-fraud reviews INTEGRATED In line with requirements under Regulation 30 of the e) Limited Reviews Listing Regulations, the Company has framed a policy WIPRO f) Cyber Defense & Technology Audit on disclosure of material events and information, which


LOGO

173 is available on our website at https://www.wipro.com/ course of business. There are no materially significant content/dam/nexus/en/investor/corporate-governance/ related party transactions made by the Company with policies-and-guidelines/ethical-guidelines/12770- Promoters, Directors, Key Managerial Personnel, or other Disclosure-Policy.pdf. The objective of this policy is to designated persons which may have a potential conflict have uniform disclosure practices and ensure timely, with the interest of the Company at large. adequate, and accurate disclosure of information on an ongoing basis. The Company has constituted a Disclosure As required under Regulation 23 of the Listing Regulations, Committee consisting of senior officials, which approves the Company has adopted a policy on Related Party disclosures required to be made by the Company. Parity in Transactions. The policy on Related Party Transactions disclosures is maintained through simultaneous disclosure is available on the Company’s website at https://www. on the National Stock Exchange of India Limited, the BSE wipro.com/content/dam/nexus/en/investor/corporate-Limited, the New York Stock Exchange and the Singapore governance/policies-and-guidelines/ethical-guidelines/ Exchange Limited. Policy-for-related-party-transactions.pdf. Apart from receiving Director’s remuneration, none of the Policy for Preservation of Documents Directors have any pecuniary relationships or transactions Pursuant to the requirements under Regulation 9 of the vis-à-vis the Company. During the financial year 2025-26, Listing Regulations, the Board has formulated and approved no material transactions were entered by the Company a Document Retention Policy prescribing the manner of with the Management or their relatives that may have a retaining the Company’s documents and the time period up potential conflict of interest with the Company and the to which certain documents are to be retained. The policy concerned officials have given undertakings to that effect applies to all departments of the organization that handle as per the provisions of the Listing Regulations. the prescribed categories of documents. The Register of Contracts/arrangement in which directors This Policy has been displayed on the Company’s website are interested under Section 189 of the Companies Act, at https://www.wipro.com/content/dam/nexus/en/investor/ 2013 is maintained and particulars of the transactions corporate-governance/policies-and-guidelines/ethical- have been entered in the Register, as applicable. guidelines/12770-Document-Retention-Policy.pdf. Other Policies Performance Criteria for Vesting of Performance Stock Units (PSU) The Company has adopted an Ombuds policy (vigil The Company grants Stock Options to eligible leaders mechanism), a policy for prevention, prohibition & under the Wipro Employee Stock Option, Performance redressal of sexual harassment of women at workplace, as Stock Unit and Restricted Stock Unit Scheme 2024. well as a code of conduct to regulate, monitor and report The grant consists of Restricted Stock Units (RSUs) and insider trading. Details of these policies and disclosures in Performance Stock Units (PSUs). relation to the Sexual Harassment of Women at Workplace are provided as part of the Board’s report. The stock units granted under the Scheme vest in tranches with the first tranche vesting after a minimum period of 1 VI. Disclosures (one) year from the date of grant. All subsequent tranches for the vesting shall take place after an interval of 1 (one) Disclosure of Materially Significant Related year from the previous tranche. Party Transactions Vesting schedule is typically spread for a period of up to 3 All related party transactions entered during the financial years for both RSUs and PSUs. Vesting of PSUs is linked to year were at an arm’s length basis and in the ordinary cumulative financial performance and other parameters.


LOGO

174 STATUTORY REPORTS AND FINANCIAL STATEMENTS CORPORATE GOVERNANCE REPORT The Nomination and Remuneration Committee lays down certain performance metrics on the achievement of which performance-based RSUs would vest which have been explained below: Absolute Revenue Absolute EBIT Free Cash Flow Achievement Achievement Achievement Weightage 40% 40% 20% Maximum vesting 150% On Plan Vesting 100% Minimum vesting 50% Below Threshold Vesting 0% Subsidiary Monitoring Framework Wipro, LLC was incorporated on July 7, 1998, in the State of Delaware, United States of America. As local All the subsidiary companies of the Company are audit is not applicable, no auditors are appointed. managed by their Boards having the rights and Deloitte Haskins & Sells LLP, Chartered Accountants obligations to manage these companies in the best (Registration No. 117366W/W-100018) conduct audit interest of respective stakeholders. The Company under the Indian Accounting Standard (Ind AS). nominates its representatives on the Board of subsidiary companies and monitors performance of Details of non-compliance by the Company, such companies, inter alia, by: penalties, and strictures imposed on the a. Reviewing financial statements, investments, Company by Stock Exchanges or SEBI inter-corporate loans/advances made by the unlisted subsidiary companies, or any statutory authority, on any matter statement containing all significant transactions related to capital markets, during the last and arrangements entered by the unlisted three years subsidiary companies forming part of the financials. The Company has complied with all the requirements of the Stock Exchanges and SEBI on matters related b. Minutes of the meetings and circular resolutions to Capital Markets, as applicable, during the last three of the unlisted subsidiary companies, if any, are years. No penalties or strictures have been imposed placed before the Company’s Board regularly. on the Company. c. Providing necessary guarantees, letter of comfort and other support for their day-to-day Whistle Blower Policy and affirmation operations, from time-to-time. that no personnel have been denied As required under Regulation 16(1)(c) and 24 of the access to the Audit, Risk & Compliance 26 Listing Regulations, the Company has adopted a - 2025 policy for determining material subsidiary and the Committee said policy is available on the Company’s website As mentioned earlier in this report, the Company has at https://www.wipro.com/content/dam/nexus/ adopted an Ombuds process which is a channel for REPORT en/investor/corporate-governance/policies-and- receiving and redressing complaints. guidelines/ethical-guidelines/Policy-for-related- No personnel in the Company have been denied ANNUAL party-transactions.pdf. access to the Audit, Risk and Compliance Committee In terms of the Company’s Policy on determining or its Chairman. material subsidiary, during the financial year ended Mechanism followed under the Ombuds process INTEGRATED March 31, 2026, Wipro, LLC was determined as a material subsidiary whose net worth exceeded 10% has been displayed on the Company’s intranet and of the consolidated net worth of the Company in the website at https://www.wipro.com/investors/corporate-WIPRO immediately preceding financial year. governance/policies-and-guidelines/#WiprosOmbuds


LOGO

175 Process. All complaints received through Ombuds process engage with its investor base and facilitate KYC updation, and investigative findings are reviewed and approved by with the objective of minimising the transfer of unpaid the Chief Ethics Officer or designate. All employees and or unclaimed dividends to the IEPF and safeguarding stakeholders can also register their concerns either by post/ shareholder interests. courier to the Company’s registered office or by sending an For the detailed procedure on how shareholders can email to ombuds.person@wipro.com or through web-based claim the unclaimed dividend amount and the underlying portal at www.wiproombuds.com. equity shares transferred to IEPF, please refer to https:// Transfer to Investor Education and www.wipro.com/investors/details-of-shares-transferred- Protection Fund Authority (IEPF) to-iepf-account/. Pursuant to the provisions of Section 124 of the Companies Disclosures with respect to demat Act, 2013 and IEPF rules, during the financial year 2025-26, suspense account/unclaimed suspense the Company transferred unclaimed dividends amounting account (Unclaimed Shares) to H 2,638,784 for the financial year 2018-19, sale proceeds of fractional shares from the issuance of bonus shares for Regulation 39(4) of the Listing Regulations read with 2018-19 totaling H 865,269, and a total of 153,511 equity Schedule VI provides the manner of dealing with the shares, on which dividends remained unclaimed for seven shares issued pursuant to a public issue or any other consecutive years, to the IEPF Authority. No claim shall lie issue and which remain unclaimed with the Company. The against the Company in respect of unclaimed dividend Company maintains the details of shareholding of each amount and equity shares transferred to the IEPF. individual shareholder whose shares are transferred to Pursuant to the Ministry of Corporate Affairs (“MCA”) the Unclaimed Suspense Account. notification dated September 9, 2024, the Company has When a claim from a shareholder is received by the procured the prescribed special contingency insurance Company, the shares lying in the Unclaimed Suspense policy towards the risk arising out of claims filed by investors Account are transferred after due verification of documents in respect of e-verification report submitted by the Company. submitted by the shareholder. In case shares are lying The Company has appointed a Nodal Officer and Deputy unclaimed with the Company, shareholders are requested Nodal Officer under the provisions of IEPF, the details of to claim the same on submission of necessary documents which are available on the website of the Company at to the Company/RTA. For more details on the process and https://www.wipro.com/investors/investor-contacts/. other information refer to the FAQ section on the Company’s website at https://www.wipro.com/investors/faqs/. In alignment with the Saksham Niveshak – 100 day Further, the shares in respect of which dividend entitlements national campaign launched by the Investor Education and remained unclaimed for seven (7) consecutive years are Protection Fund Authority (“IEPFA”) under the Ministry transferred from the Unclaimed Suspense Account to of Corporate Affairs, the Company undertook targeted investor outreach measures to enhance awareness and IEPFA in accordance with Section 124(6) of the Companies facilitate timely KYC updation to strengthen investor Act, 2013 and rules made thereunder. engagement, transparency, and compliance with SEBI, vide its circular dated January 25, 2022, mandated regulatory requirements. that the Company/RTA shall verify and process the As part of this initiative, the Company published a investor service requests and thereafter issue a Letter of newspaper advertisement to ensure wider dissemination Confirmation (“LOC”) in lieu of physical share certificate(s). of information, hosted a detailed notice in the Investor FAQ The LOC shall be valid for a period of one hundred twenty section of its website providing step-by-step guidance for days from the date of issuance within which the Member/ shareholders, and leveraged social media platforms to Claimant shall make a request to the Depository Participant extend reach and engagement. Through these focused for dematerialising the said shares. In case, the demat initiatives, the Company effectively supported the request is not submitted within the aforesaid period, the objectives of the IEPFA campaign, reinforced transparent shares shall be credited to the Company’s Suspense Escrow investor communication, and enabled shareholders to Demat Account. As on March 31, 2026, there are no shares take timely action. The Company continues to proactively lying in the Company’s Suspense Escrow Demat Account.


LOGO

176 STATUTORY REPORTS AND FINANCIAL STATEMENTS CORPORATE GOVERNANCE REPORT The disclosure as required under Schedule V of the Listing Regulations is given below for the financial year 2025-26: Sl. No. of Particulars No. of shares No. shareholders 1 Aggregate number of shareholders and the outstanding shares in the 394 4,927,111 suspense account lying at the beginning of the year 2 Number of shareholders who approached the Company for transfer of shares 15 491,763 from suspense account during the year 3 Number of shareholders to whom shares were transferred from suspense 15 491,763 account during the year 4 Number of shares in respect of which dividend entitlements remained 1 2 unclaimed for seven consecutive years and transferred from the Unclaimed Suspense Account to the IEPF 5 Aggregate number of shareholders and the outstanding shares in the 378 4,435,346* suspense account lying at the end of the year *Voting rights on the shares shall remain frozen till the rightful owner of such shares claims the same. Fees Paid to Statutory Auditors The details of total fees for all services paid by the Company and its subsidiaries, on a consolidated basis, to the statutory auditors and all the entities in the network firm/network entity of which the statutory auditor is a part, are as follows: (C in Millions) Type of Service FY 2025-26 FY 2024-25 Audit Fees 163 147 Tax Fees 50 48 Others 39 28 Total 252 223 Shareholder Information Compliance with Corporate Governance Requirements Various shareholder information required to be disclosed pursuant to Schedule V of the Listing The Company has complied with all the mandatory Regulations are provided in Annexure I to this report. corporate governance requirements under the Listing The shareholders can also refer to the section on Regulations. Specifically, the Company confirms 26 grievance redressal mechanism and the escalation compliance with corporate governance requirements matrix available on the website of the Company at specified in Regulation 17 to 27 read with Schedule 2025 https://www.wipro.com/content/dam/nexus/en/ V and Regulation 46 of the Listing Regulations, as investor/grievance-redressal-and-escalation-matrix/ applicable, with regard to corporate governance. REPORT shareholder-grievance-redressal-and-escalation- Being a Foreign Private Issuer (FPI) for the purposes framework.pdf. of American Depositary Shares, we are permitted to ANNUAL follow home country practices in lieu of the provisions Disclosure of certain types of agreements of Section 303A of the NYSE Listed Company binding listed entities Manual, except that we are required to comply with the requirements of Sections 303A.06, 303A.11 INTEGRATED There are no agreements that require disclosure and 303A.12(b) and (c) of the NYSE Listed Company under clause 5A of paragraph A of Part A of Schedule Manual. With regard to Section 303A.11 of the NYSE WIPRO III of the Listing Regulations. Listed Company Manual, although the Company’s


LOGO

177 home country standards on corporate governance may Shareholders’ Rights differ from the NYSE listing standards, the Company’s actual corporate governance policies and practices are Considering the dynamic shareholder demography and generally in compliance with the NYSE Listed Company trading on the stock exchanges, as a prudent measure, we Manual applicable to FPIs. display our quarterly and half yearly results on our website https://www.wipro.com/ and also publish our results in widely circulated newspapers. The Shareholders’ rights Certificates from Practicing Company along with the escalation matrix for handling grievances Secretary is available on the Company’s website at https://www. wipro.com/content/dam/nexus/en/investor/grievance- The certificate dated May 25, 2026, issued by redressal-and-escalation-matrix/shareholder-grievance-Mr. V. Sreedharan, Partner, V. Sreedharan & Associates, redressal-and-escalation-framework.pdf. Practicing Company Secretaries, is given at page 185 of this Annual Report in compliance with corporate governance norms prescribed under the Modified opinion(s) in audit report Listing Regulations. The Statutory Auditors have issued an unmodified The Company has received certificate dated June 2, opinion on the financial statements of the Company. 2026, from Mr. V. Sreedharan, Partner, V. Sreedharan & Associates, Practicing Company Secretaries, confirming Independent Directors that none of the Directors of the Company have been The Independent Directors meet exclusively among debarred or disqualified from being appointed or themselves every quarter. They also meet the Chairman, continuing as Director of companies pursuant to an order Chief Executive Officer and Managing Director, Chief by SEBI/MCA or any such authority. Financial Officer and other functional and business heads The certificate is given at page 186 to 187 to of this every quarter to understand and review the industry Annual Report. landscape, various technological innovations and general market trends. VII. Compliance Report on Discretionary Requirements under Regulation 27(1) of NYSE Corporate Governance Listing the Listing Regulations Standards The Board The Company has made necessary disclosures in compliance with the NYSE Listing Standards and NYSE As per Para A of Part E of Schedule II of the Listing Listed Company Manual on its website at https://www. Regulations, a Non-Executive Chairman of the Board wipro.com/investors/corporate-governance/corporate-may be entitled to maintain a Chairman’s Office at the governance-reports/. Company’s expense and allowed reimbursement of expenses incurred in performance of his duties. The Rishad A. Premji Chairman of the Company is an Executive Director and Bengaluru Chairman hence this provision is not applicable to us. June 2, 2026 (DIN: 02983899)


LOGO

178 STATUTORY REPORTS AND FINANCIAL STATEMENTS CORPORATE GOVERNANCE REPORT Declaration as Required Under Regulation 34(3) and Schedule V of the Listing Regulations All Directors and Senior Management Personnel of the Company have affirmed compliance with Wipro’s Code of Business Conduct for the financial year ended March 31, 2026. Rishad A. Premji Chairman (DIN: 02983899) Srinivas Pallia Bengaluru Chief Executive Officer and Managing Director June 2, 2026 (DIN: 10574442) - 26 2025 REPORT ANNUAL INTEGRATED WIPRO 


LOGO

179 ANNEXURE I SHAREHOLDER INFORMATION Annual General Meeting Wednesday, Video Conferencing (“VC”) July 15, 2026 at 9 AM IST Instructions for attending AGM/E-voting: Refer Notice of the 80th Annual General Meeting Annual General Meetings of the last three years and Special Resolutions, if any: Financial Year Date and Time Venue Special resolutions passed 2022-23 July 12, 2023 at Meeting held -9:30 AM through VC 2023-24 July 18, 2024 Meeting held 1. Re-appointment of Mr. Azim H. Premji (DIN: 00234280) as a at 9 AM through VC Non-Executive, Non-Independent Director of the Company. 2. Approval of the Wipro Limited Employee Stock Options, Performance Stock Unit and/or Restricted Stock Unit Scheme 2024 (“2024 Scheme”) for grant of employee stock options, performance stock units and/or restricted stock units to the eligible employees under the 2024 Scheme. 3. Approval of Wipro Limited Employee Stock Options, Performance Stock Unit and/or Restricted Stock Unit Scheme 2024 (“2024 Scheme”) for grant of employee stock options, performance stock units and/or restricted stock units to the eligible employees of group company(ies) of the Company. 2024-25 July 16, 2025 Meeting held -at 9 AM through VC Details of resolutions passed through postal ballot during financial Year 2025-26 and details of the voting pattern During the financial year 2025-26, no resolution was proposed for approval of the members by way of Postal Ballot. Means of Communication with Shareholders/Analysts We have established procedures to disseminate, in a planned manner, relevant information to our shareholders, analysts, employees and the society at large. Our Audit, Risk and Compliance Committee reviews the earnings press releases, Form 20-F, Securities Exchange Commission (“SEC”) filings and annual and quarterly reports of the Company, before they are presented to the Board for their approval for release. We engage with our investor community through our investor relations team on a regular basis. Further, the details of the means of communication with shareholders/analysts are given below: News Releases and All our news releases and presentations made at investor conferences and to analysts are posted on the Company’s Presentations website at https://www.wipro.com/investors. Quarterly results Our quarterly results are published in widely circulated national newspapers such as Financial Express and the local daily Kannada Prabha. Website The Company’s website contains a dedicated section for Investors (https://www.wipro.com/investors), where annual reports, earnings press releases, stock exchange filings, quarterly reports, and corporate governance policies are available, apart from the details about the Company, Board of Directors, and Management. Annual Report Annual Report containing audited standalone accounts, consolidated financial statements together with Board’s Report, Business Responsibility and Sustainability Report, Corporate Governance Report, Management Discussion and Analysis Report, Auditors Report and other important information are circulated to the Members entitled thereto through permitted mode(s). Other Disclosures/ Our Form 20-F filed with SEC containing detailed disclosures, along with other disclosures including Press Filings Releases etc. are available at https://www.wipro.com/investors/annual-reports/.


LOGO

180 STATUTORY REPORTS AND FINANCIAL STATEMENTS CORPORATE GOVERNANCE REPORT Communication of Results: Means of Communications Number of times during 2025-26 Earnings Calls 4 Publication of results 4 Analysts/Investors Meetings/Analyst Day Details are provided in the MD & A Report forming part of this Annual Report. Dividend for FY 2025-26 Pursuant to the approval of the Board on July 17, 2025, the Company had declared an interim dividend of H 5 per equity share of face value of H 2 each, to shareholders whose names were appearing in the register of members as on July 28, 2025, being the record date fixed for this purpose. The dividend was paid on August 8, 2025. Further, the Board, on January 16, 2026, had declared an interim dividend of H 6 per equity share of face value of H 2 each, to shareholders whose names were appearing in the register of members as on January 27, 2026, being the record date fixed for this purpose. The dividend was paid on February 9, 2026. The Board has recommended the adoption of the aggregate interim dividend of H11 per equity share (H 5 declared in July 2025 and H 6 declared in January 2026) as the final dividend for the financial year ended March 31, 2026, subject to approval by the shareholders at the 80th AGM. Bonus Shares The Company did not undertake any bonus issue during the financial year 2025-26. Financial Calendar The financial year of the Company starts from the 1st day of April and ends on 31st day of March of the next year. Our tentative calendar for declaration of results for the financial year 2026-27 are as given below. In addition, the Board may meet on other dates as and when required. Quarter Ending Release of Results For the Quarter ending June 30, 2026 Third week of July 2026 For the Quarter and half year ending September 30, 2026 Third week of October 2026 For the Quarter and nine months ending December 31, 2026 Third week of January 2027 For the year ending March 31, 2027 Third week of April 2027 - 26 The Company generally closes its trading window for declaration of financial results from the 16th of the quarter closure 2025 month until 48 hours after declaration of financial results. REPORT Corporate Information ANNUAL a) Corporate Identity Number (CIN): L32102KA1945PLC020800 b) Company Registration Number: 20800 INTEGRATED c) International Securities Identification Number (ISIN): INE075A01022 d) CUSIP Number for Wipro American Depositary Shares: 97651M109 WIPRO


LOGO

181 e) Details of exchanges where Company’s shares are listed as of March 31, 2026: Equity shares Stock Codes Address BSE Limited (BSE) 507685 25th floor, Phiroze Jeejeebhoy Towers, Dalal Street, Fort, Mumbai - 400 001, India National Stock Exchange of India Limited (NSE) WIPRO Exchange Plaza, C-1, Block G, Bandra Kurla Complex, Bandra (E), Mumbai – 400 051, India American Depositary Receipts New York Stock Exchange (NYSE) WIT 11 Wall St, New York, NY 10005, United States of America Notes: 1. Listing fees for the year 2026-27 have been paid to the Indian Stock Exchanges as on date of this report. 2. Listing fees to NYSE for the calendar year 2026 has been paid as on date of this report. 3. The stock code on Reuters is WIPR.NS and on Bloomberg is WPRO:IN Distribution of Shareholding as on: Category March 31, 2026 March 31, 2025 (No. of Shares) No. of % of % of Total No. of % of % of Total No. of Shares No. of Shares Shareholders Shareholders Equity Shareholders Shareholders Equity 1-5000 2,593,811 99.64 328,270,062 3.13 2,422,403 99.64 292,177,357 2.79 5001- 10000 4,417 0.17 30,982,541 0.30 3,949 0.16 27,680,452 0.26 10001- 20000 1,974 0.08 28,204,576 0.27 1,850 0.08 26,547,555 0.25 20001- 30000 720 0.03 17,935,251 0.17 690 0.03 17,110,413 0.16 30001- 40000 375 0.01 13,022,553 0.12 359 0.01 12,479,388 0.12 40001- 50000 226 0.01 10,145,659 0.10 262 0.01 11,841,259 0.11 50001- 100000 546 0.02 38,122,853 0.36 538 0.02 37,616,776 0.36 100001 & Above 1,075 0.04 10,021,728,963 95.55 1,132 0.05 10,046,682,849 95.95 Total 2,603,144 100.00 10,488,412,458 100.00 2,431,183 100.00 10,472,136,049 100.00 Category of Equity Shareholding as on: Number of equity Number of equity Percentage Percentage Category shares held as on shares held as on of Holding of Holding March 31, 2026 March 31, 2025 Promoters and Promoter Group 7,616,840,898 72.62 7,616,840,898 72.73 Foreign Portfolio Investors 872,436,515 8.32 874,807,516 8.35 Insurance Companies 323,745,579 3.09 319,599,713 3.05 Mutual Fund 451,725,657 4.31 427,088,438 4.08 Resident Individuals 692,701,423 6.6 685,415,439 6.54 Others 530,962,386 5.06 548,384,045 5.25 Total 10,488,412,458 100.00 10,472,136,049 100.00


LOGO

182 STATUTORY REPORTS AND FINANCIAL STATEMENTS CORPORATE GOVERNANCE REPORT Top Ten Equity Shareholders of the Company (Excluding Promoters & Promoter Group) Sl. Number of equity Percentage Name of the shareholders* No. shares held of holding 1 Life Insurance Corporation of India 280,158,134 2.67 2 JP Morgan Chase Bank, NA 259,686,662 2.48 3 ICICI Prudential Technology Fund 161,485,400 1.54 4 SBI Nifty 50 ETF 81,678,919 0.78 5 ALCO Company Private Limited 70,177,000 0.67 6 Government Pension Fund Global 51,305,671 0.49 7 Tata Digital India Fund 44,037,234 0.42 8 Kotak Midcap Fund 36,890,458 0.35 9 Vanguard Emerging Markets Stock Index Fund, A Series 33,118,654 0.32 10 Vanguard Total International Stock Index Fund 29,797,110 0.28 *Shareholding is consolidated based on Permanent Account Number of the shareholders. Other Disclosures Description of Voting Rights All our equity shares carry voting rights on a pari-passu basis. Dematerialisation of Shares and 99.96% of outstanding equity shares have been dematerialized as of March 31, 2026. Liquidity Outstanding ADR/GDR/Warrants or The Company has 2.48% of outstanding ADRs as on March 31, 2026. any other Convertible instruments, Conversion Date and Likely Impact on Equity Commodity Price Risk or Foreign The Company had no exposure to commodity risks for the financial year 2025-26. For Exchange Risk and Hedging Activities Foreign exchange risk and hedging activities, please refer Management Discussion and Analysis Report for details. Credit Ratings During the financial year 2025-26, the ratings committee of ICRA has reaffirmed the long-term rating for lines of credit of Wipro Limited at [ICRA] AAA. The Outlook on the long term rating is stable. The ratings committee of ICRA has also reaffirmed the short-term rating for lines of credit of Wipro Limited at [ICRA] A1+. Fitch Ratings has assigned Long-term foreign and local currency Issuer Default Ratings (IDR) and foreign currency senior unsecured rating of A-. Standard & Poor has also assigned a rating of A-. The outlook is stable. Plant Locations The Company has various offices in India and abroad. Details of these locations as on 26 March 31, 2026, are available on our website www.wipro.com. - Details of utilization of funds raised During the financial year 2025-26, no funds were raised through preferential allotment or 2025 through preferential allotment or Qualified Institutional Placement as per the Regulation 32(7A) of the Listing Regulations. qualified institutions placement as specified under Regulation 32 (7A) of REPORT the Listing Regulations Loans and advances in the nature of During the financial year, the Company has not provided any loans and advances in the ANNUAL loans to firms/companies in which nature of loans to firms/companies in which Directors are interested. directors are interested by name INTEGRATED and amount WIPRO


LOGO

183 Registrar and Share Transfer Agent that our RTA, KFin Technologies Limited has launched an online application which can be accessed at https://ris.kfintech.com/ Company’s share transfer and related activities are operated default.aspx > Investor Services > Investor Support. through its Registrar and Share Transfer Agent: KFin Technologies Limited. The details of the Share Transfer Members are requested to register/signup, using the Name, Agent are provided under the section ‘Investor Queries and PAN, Mobile and email ID. Post registration, user can login via Grievances Redressal’. The same is also available on the OTP and execute activities like, raising Service Request, Query, Company’s website at https://www.wipro.com/investors/ Complaints, check for status, KYC details, Dividend, Interest, investor-contacts/. Redemptions, e-Meeting and e-Voting details. Share Transfer System Quick link to access the signup page: https://kprism.kfintech. com/signup. In accordance with the proviso to Regulation 40(1) of the Listing Regulations, effective from April 1, 2019, transfers of shares of the Investor Queries and Grievances Redressal Company shall not be processed unless the shares are held in the dematerialized form with a depository. Accordingly, shareholders The Company has established a structured and transparent holding equity shares in physical form are urged to have their mechanism for redressal of investor queries and grievances shares dematerialized so as to be able to freely transfer them. through a defined escalation matrix. Shareholders may, in the first instance, address their queries or grievances relating to Registering of E-mail Address shares, dividend, transfer, dematerialisation, annual reports or other related matters either to the RTA, KFin Technologies Members who have not yet registered their e-mail address Limited or to the Company, whose contact details are provided for availing the facility of e-communication, are requested to below. Further details on redressal of shareholder grievances register the same with the Company/RTA or their DPs for easier and escalation matrix is available on the Company’s website and faster correspondence. at https://www.wipro.com/content/dam/nexus/en/investor/ Members holding shares in dematerialised form are requested grievance-redressal-and-escalation-matrix/shareholder-to contact their respective Depository Participant(s) to register/ grievance-redressal-and-escalation-framework.pdf. update their email address. Members holding shares in physical form may register their email KFin Technologies Limited, Unit: Wipro Limited, address by writing to the Company’s Registrar and Transfer Agent Selenium Building, Tower-B, Plot No. 31 & 32, Financial District, (RTA), KFin Technologies Limited at Selenium Building, Tower-B, Nanakramguda, Serilingampally, Hyderabad, Rangareddy, Plot No. 31 & 32, Financial District, Nanakramguda, Serilingampally, Telangana, India 500 032 Toll Free No.: 1800-309-4001. Hyderabad, Rangareddy, Telangana, India 500 032 along with the duly completed Form ISR-1 along with the related proofs, which Contact Person: is available at https://www.wipro.com/investors/faqs/. Ms. Baireddy Swati Reddy E-mail id: swati.baireddy@kfintech.com Online Application for Investor Query Ms. Rajitha Cholleti E-mail id: rajitha.cholleti@kfintech.com Pursuant to SEBI Circular no. SEBI/HO/MIRSD/MIRSD-PoD-1/P/ Shareholders’ Grievances can also be sent through e-mail to CIR/2023/72 dated June 8, 2023, Members are hereby notified the following designated E-mail id: einward.ris@kfintech.com.


LOGO

184 STATUTORY REPORTS AND FINANCIAL STATEMENTS CORPORATE GOVERNANCE REPORT Shareholders can also send their correspondence to the through SEBI’s online grievance redressal platform, SEBI Company with respect to their shares, dividend, request Complaints Redress System (SCORES), available at https:// for annual reports and shareholder grievances. The contact scores.sebi.gov.in/. details are provided below: In the event the grievance remains unresolved or the shareholder is not satisfied with the resolution provided through Mr. M. Sanaulla Khan the aforesaid forums, the shareholder may, as a final recourse, Senior Vice President and opt for Online Dispute Resolution through SEBI’s SMART Company Secretary Ph: +91 80 28440011 Wipro Limited, (Extn: 226185) ODR platform accessible at https://smartodr.in/, or pursue Doddakannelli, Sarjapur E-mail: sanaulla.khan@wipro. appropriate civil remedies in accordance with applicable laws. Road, Bengaluru 560 035 com Depositary for ADS Mr. Mahadev Prakash General Manager & Head- Overseas Depositary for ADSs – J.P. Morgan Corporate Secretarial Ph: +91 80 28440011 Wipro Limited, (Extn: 226183) Chase Bank N.A. Doddakannelli, Sarjapur E-mail: mahadev.prakash@ Road, Bengaluru 560 035 wipro.com JPMorgan Chase Bank, N.A. 270 Park Avenue, Floor 8 New York, NY 10017 Analysts can reach our Investor Relations General: +1 800 990 1135 Team for any queries and clarification on From outside the U.S.: +1 651 453 2128 Tel: +1 212 552 8926 New York Financial/Investor Relations related matters: E-mail: drx_depo@jpmorgan.com Mr. Abhishek Jain Indian Custodian for ADSs Corporate Treasurer and Head Investor Relations Wipro Limited, Ph: +91 80 28440011 India Sub Custody Office Doddakannelli, Sarjapur Road, (Extn: 227201) Bengaluru 560 035 E-mail: Address: JPMorgan Chase Bank N.A., 3rd Floor, JP Morgan abhishek.jain2@wipro.com Tower, OFF C.S.T. Road, Kalina, Santacruz (East), Mumbai Mr. Harshad Ambekar 400 098 Senior Manager, Investor Relations, Ph: +91 80 28440011 Phone: +91 022 6649 2515 | F: +91 022 6649 2509 Wipro Limited, (Extn: 226126) Doddakannelli, Sarjapur Road, E-mail: The e-mail address and contact details for all Bengaluru 560 035 harshad.ambekar@wipro.com service-related queries is: In case of any queries, stakeholders are requested to write india.custody.client.service@jpmorgan.com to the above-mentioned Email IDs for a quicker response. Contact Persons: If the grievance is not resolved at this level, shareholders may - 26 escalate the matter to the concerned Stock Exchange(s), Nekzad Behramkamdin E-mail id: nekzad. 2025 viz. BSE Limited and National Stock Exchange of India behramkamdin@jpmorgan.com REPORT Limited, with supporting documents, or lodge a complaint Nayan Vyas E-mail id: nayan.x.vyas@jpmorgan.com ANNUAL INTEGRATED WIPRO


LOGO

185 Corporate Governance Compliance Certificate [Pursuant to Regulation 34(3) and Schedule V Para E of the SEBI (Listing Obligations and Disclosure Requirements) Regulations, 2015] Corporate Identity Number: L32102KA1945PLC020800 Nominal Capital: H 2,535.20 Crores To, The Members of Wipro Limited Doddakannelli, Sarjapur Road, Bengaluru – 560035 We have examined all the relevant records of Wipro Limited for the purpose of certifying compliance of the conditions of the Corporate Governance under the SEBI (Listing Obligations and Disclosure Requirements) Regulations, 2015 for the financial year ended March 31, 2026. We have obtained all the information and explanations which to the best of our knowledge and belief were necessary for the purposes of certification. The compliance of conditions of corporate governance is the responsibility of the Management. Our examination was limited to the procedure and implementation process adopted by the Company for ensuring the compliance of the conditions of the corporate governance. This certificate is neither an assurance as to the future viability of the Company nor of the efficacy or effectiveness with which the management has conducted the affairs of the Company. In our opinion and to the best of our information and according to the explanations and information furnished to us, we certify that the Company has complied with all the mandatory requirements of Corporate Governance as stipulated in Schedule II of the said Regulations. As regards Discretionary Requirements specified in Part E of Schedule II of the SEBI (Listing Obligations and Disclosure Requirements) Regulations, 2015, the Company has complied with items C, E and F. For V. SREEDHARAN & ASSOCIATES Company Secretaries (V. Sreedharan) Partner FCS: 2347; CP No. 833 Date: May 25, 2026 UDIN: F002347H000478218 Place: Bengaluru Peer Review Certificate No. 5543/2024


LOGO

186 STATUTORY REPORTS AND FINANCIAL STATEMENTS CORPORATE GOVERNANCE REPORT Certificate of Non-Disqualification of Directors [Pursuant to Regulation 34(3) and Schedule V Para C clause (10)(i) of the SEBI (Listing Obligations and Disclosure Requirements) Regulations, 2015] To, The Members of Wipro Limited Doddakannelli, Sarjapur Road, Bengaluru 560035 We have examined the relevant registers, records, forms, returns and disclosures received from the Directors of Wipro Limited, having CIN: L32102KA1945PLC020800 and having registered office at Doddakannelli, Sarjapur Road, Bengaluru 560035 (hereinafter referred to as ‘the Company’), produced before us by the Company for the purpose of issuing this Certificate, in accordance with Regulation 34(3) read with Schedule V Para-C Sub clause 10(i) of the Securities and Exchange Board of India (Listing Obligations and Disclosure Requirements) Regulations, 2015. In our opinion and to the best of our information and according to the verifications (including Directors Identification Number (DIN) status at the portal www.mca.gov.in) as considered necessary and explanations furnished to us by the Company & its officers, we hereby certify that none of the Directors on the Board of the Company as stated below for the Financial Year ending on March 31, 2026 have been debarred or disqualified from being appointed or continuing as Directors of companies by the Securities and Exchange Board of India (SEBI) and Ministry of Corporate Affairs (MCA), or any such other Statutory Authority. Details of Directors: Date of Sl. Name of Director Designation DIN appointment in No. Company 1. Mr. Azim Hasham Premji Non-Executive Non-Independent Director 00234280 01/09/1968 2. Mr. Rishad Azim Premji Executive Director, Chairman of the Board and 02983899 01/05/2015 the Company 3. Mr. Srinivas Pallia Executive Director, Chief Executive Officer and 10574442 07/04/2024 Managing Director 4. Ms. Tulsi Naidu Non-Executive Independent Director 03017471 01/07/2021 5. Dr. Patrick John Ennis Non-Executive Independent Director 07463299 01/04/2016 - 26 6. Mr. Patrick Lucien Andre Dupuis Non-Executive Independent Director 07480046 01/04/2016 2025 7. Mr. Deepak Madhav Satwalekar Non-Executive Independent Director 00009627 01/07/2020 8. Ms. Paivi Elina Rekonen Fleischer Non-Executive Independent Director 09669696 01/10/2022 REPORT 9. Mr. Kannan Narayanan Srinivasa Non-Executive Independent Director 00066009 01/10/2023 ANNUAL INTEGRATED WIPRO


LOGO

187 Notes: 1. Dr. Patrick John Ennis (DIN: 07463299) and Mr. Patrick Lucien Andre Dupuis (DIN: 07480046), Independent Directors retired from the Company’s Board of Directors, with effect from close of business hours on March 31, 2026, after completion of their tenure under Section 149(11) of the Companies Act, 2013. 2. The Board of Directors on March 5, 2026 through circular resolution, approved the appointment of Ms. Laura Marie Miller (DIN: 11546063) as an Additional Director in the capacity of Independent Director for a term of 5 years with effect from April 1, 2026 to March 31, 2031. The said appointment has subsequently been approved by the shareholders of the Company. Ensuring the eligibility for the appointment / continuity of every Director on the Board is the responsibility of the management of the Company. Our responsibility is to express an opinion based on our verification. This certificate is neither an assurance as to the future viability of the Company nor of the efficiency or effectiveness with which the management has conducted the affairs of the Company. For V. SREEDHARAN & ASSOCIATES Company Secretaries (V. Sreedharan) Partner FCS: 2347; CP No. 833 Date: June 2, 2026 UDIN: F002347H000566515 Place: Bengaluru Peer Review Certificate No. 5543/2024


LOGO

188 STATUTORY REPORTS AND FINANCIAL STATEMENTS STANDALONE FINANCIAL STATEMENT UNDER IND AS To The Members of Wipro Limited Report on the Audit of the Standalone Financial Statements OPINION We have audited the accompanying Standalone Financial Statements of Wipro Limited (the “Company”), which comprise the Balance Sheet as at March 31, 2026, and the Statement of Profit and Loss (including Other Comprehensive Income), the Statement of Changes in Equity and the Statement of Cash Flows and for the year ended on that date, and notes to the financial statements, including a summary of material accounting policies and other explanatory information (herein after referred to as “the Standalone Financial Statements”). In our opinion and to the best of our information and according to the explanations given to us, the aforesaid Standalone Financial Statements give the information required by the Companies Act, 2013 (the “Act”) in the manner so required and give a true and fair view in conformity with the accounting principles generally accepted in India, including Ind AS specified under section 133 of the Act, of the state of affairs of the Company as at March 31, 2026, and its profit, other comprehensive loss, the changes in equity and cash flows for the year ended on that date. BASIS FOR OPINION We conducted our audit of the Standalone Financial Statements in accordance with the Standards on Auditing (“SA”s) specified under section 143(10) of the Act. Our responsibilities under those Standards are further described in the Auditor’s Report Responsibility for the Audit of the Standalone Financial Statements section of our report. We are independent of the Company in accordance with the Code of Ethics issued by the Institute of Chartered Accountants of India (“ICAI”) together with the ethical requirements that are relevant to our audit of the Standalone Financial Statements under the provisions of the Act and the Rules made thereunder, and we have fulfilled our other ethical responsibilities in accordance with these requirements and the ICAI’s Code of Ethics. We believe that the audit evidence obtained by us is sufficient and appropriate to provide a basis for our audit opinion on the Standalone Auditor’s Financial Statements. 26 KEY AUDIT MATTER - 2025 Key audit matter is a matter that, in our professional judgment, is of most significance in our audit of the Standalone Financial Statements of the current period. This matter REPORT was addressed in the context of our audit of the Standalone Financial Statements as a whole, and in forming our opinion thereon, and we do not provide a separate opinion on this matter. We have determined the matter described below to be the key audit ANNUAL matter to be communicated in our report. INTEGRATED WIPRO Independent


LOGO

189 Revenue from fixed-price contracts using the percentage-of- • We selected a sample of fixed-price contracts with customers completion method Refer Notes 2 (iii)(a), 3(xiii)B(i) and 22 to accounted using percentage-of-completion method and the financial statements. performed the following: Key Audit Matter Description • Read the contract and based on the terms and conditions evaluated whether recognizing revenue Revenue from fixed-price contracts, including software over time using percentage-of-completion method development, and integration contracts, where the was appropriate, and confirmed that the contract was performance obligations are satisfied over time, is recognized included in management’s calculation of revenue using the percentage-of-completion method. over time. Use of the percentage-of-completion method requires the • Evaluated the appropriateness of and consistency Company to determine the project costs incurred to date as in the application of management’s policies and a percentage of total estimated project costs at completion. methodologies to estimate progress towards The estimation of total project costs involves significant satisfying the performance obligation. judgement and is assessed throughout the period of the contract to reflect any changes based on the latest available • Compared efforts incurred to date with Company’s information. In addition, provisions for estimated losses, if any, estimate of efforts incurred to date to identify on uncompleted contracts are recorded in the period in which significant variations and evaluate whether those such losses become probable based on the total estimated variations have been considered appropriately project costs. in estimating the remaining efforts to complete the contract. We identified the revenue recognition for fixed-price contracts where the percentage-of-completion method is used as a key • Tested the estimate for consistency with the status audit matter because of the significant judgement involved in of delivery of milestones, customer acceptances and estimating the efforts to complete such contracts. other related information to identify possible delays in achieving milestones, which require changes This estimate has a high inherent uncertainty and requires in estimated efforts to complete the remaining consideration of progress of the contract, efforts incurred performance obligations. to-date and estimates of efforts required to complete the remaining performance obligations. INFORMATION OTHER THAN THE This required a high degree of auditor judgment in evaluating FINANCIAL STATEMENTS AND AUDITOR’S the audit evidence supporting estimated efforts to complete and a higher extent of audit effort to evaluate the reasonableness of REPORT THEREON the total estimated efforts used to recognise revenue from fixed- • The Company’s Board of Directors is responsible for the price contracts using the percentage-of-completion method. other information. The other information comprises the How the Key Audit Matter Was Addressed in the Audit information included in the Management Discussion and Analysis, Board’s Report including Annexures to Board’s Our audit procedures related to estimates of efforts to complete report, Business Responsibility and Sustainability Report for fixed-price contracts accounted using the percentage-of- and Corporate Governance Report, but does not include the completion method included the following, among others: Consolidated Financial Statements, Standalone Financial • We tested the effectiveness of controls relating to (1) Statements and our auditor’s report thereon. recording of efforts incurred and estimation of efforts • Our opinion on the Standalone Financial Statements does required to complete the remaining performance obligations, not cover the other information and we do not express any and (2) access and application controls pertaining to form of assurance conclusion thereon. time recording and allocation systems, which prevents unauthorised changes to recording of efforts incurred.


LOGO

190 STATUTORY REPORTS AND FINANCIAL STATEMENTS STANDALONE FINANCIAL STATEMENT UNDER IND AS • In connection with our audit of the Standalone Financial The Company’s Board of Directors is also responsible for Statements, our responsibility is to read the other overseeing the Company’s financial reporting process. information and, in doing so, consider whether the other information is materially inconsistent with the AUDITOR’S RESPONSIBILITY FOR Standalone Financial Statements or our knowledge THE AUDIT OF THE STANDALONE obtained during the course of our audit or otherwise appears to be materially misstated. FINANCIAL STATEMENTS • If, based on the work we have performed, we conclude Our objectives are to obtain reasonable assurance about that there is a material misstatement of this other whether the Standalone Financial Statements as a whole information, we are required to report that fact. We have are free from material misstatement, whether due to fraud nothing to report in this regard. or error, and to issue an auditor’s report that includes our opinion. Reasonable assurance is a high level of assurance, RESPONSIBILITIES OF MANAGEMENT but is not a guarantee that an audit conducted in accordance with SAs will always detect a material misstatement when it AND BOARD OF DIRECTORS FOR THE exists. Misstatements can arise from fraud or error and are STANDALONE FINANCIAL STATEMENTS considered material if, individually or in the aggregate, they could reasonably be expected to influence the economic The Company’s Board of Directors is responsible for the decisions of users taken on the basis of these Standalone matters stated in section 134(5) of the Act with respect to the Financial Statements. preparation of these standalone financial statements that give a true and fair view of the financial position, financial As part of an audit in accordance with SAs, we exercise performance including other comprehensive income, cash professional judgment and maintain professional skepticism flows and changes in equity of the Company in accordance throughout the audit. We also: with the accounting principles generally accepted in India, • Identify and assess the risks of material misstatement including Ind AS specified under section 133 of the Act. of the Standalone Financial Statements, whether due This responsibility also includes maintenance of adequate to fraud or error, design and perform audit procedures accounting records in accordance with the provisions of responsive to those risks, and obtain audit evidence the Act for safeguarding the assets of the Company and for that is sufficient and appropriate to provide a basis preventing and detecting frauds and other irregularities; for our opinion. The risk of not detecting a material selection and application of appropriate accounting policies; misstatement resulting from fraud is higher than for making judgments and estimates that are reasonable and one resulting from error, as fraud may involve collusion, prudent; and design, implementation and maintenance of forgery, intentional omissions, misrepresentations, or adequate internal financial controls, that were operating the override of internal control. effectively for ensuring the accuracy and completeness of the accounting records, relevant to the preparation and • Obtain an understanding of internal financial controls presentation of the financial statements that give a true and relevant to the audit in order to design audit procedures 26 fair view and are free from material misstatement, whether that are appropriate in the circumstances. Under - 2025 due to fraud or error. section 143(3)(i) of the Act, we are also responsible for expressing our opinion on whether the Company In preparing the Standalone Financial Statements, has adequate internal financial controls with reference REPORT management and Board of Directors is responsible for to Standalone Financial Statements in place and the assessing the Company’s ability to continue as a going operating effectiveness of such controls. ANNUAL concern, disclosing, as applicable, matters related to going concern and using the going concern basis of accounting • Evaluate the appropriateness of accounting policies unless the Board of Directors either intend to liquidate used and the reasonableness of accounting estimates the Company or to cease operations, or has no realistic and related disclosures made by the management. INTEGRATED alternative but to do so. WIPRO


LOGO

191 • Conclude on the appropriateness of management’s use of We describe these matters in our auditor’s report unless law the going concern basis of accounting and, based on the or regulation precludes public disclosure about the matter or audit evidence obtained, whether a material uncertainty when, in extremely rare circumstances, we determine that a exists related to events or conditions that may cast significant matter should not be communicated in our report because doubt on the Company’s ability to continue as a going the adverse consequences of doing so would reasonably concern. If we conclude that a material uncertainty exists, we be expected to outweigh the public interest benefits of are required to draw attention in our auditor’s report to the such communication. related disclosures in the Standalone Financial Statements or, if such disclosures are inadequate, to modify our opinion. REPORT ON OTHER LEGAL AND Our conclusions are based on the audit evidence obtained REGULATORY REQUIREMENTS up to the date of our auditor’s report. However, future events or conditions may cause the Company to cease to continue 1. As required by Section 143(3) of the Act, based on our as a going concern. audit we report that: • Evaluate the overall presentation, structure and content of the a) We have sought and obtained all the information and Standalone Financial Statements, including the disclosures, explanations which to the best of our knowledge and and whether the Standalone Financial Statements represent belief were necessary for the purposes of our audit. the underlying transactions and events in a manner that b) In our opinion, proper books of account as required achieves fair presentation. by law have been kept by the Company so far as it Materiality is the magnitude of misstatements in the Standalone appears from our examination of those books. Financial Statements that, individually or in aggregate, makes c) The Balance Sheet, the Statement of Profit and Loss it probable that the economic decisions of a reasonably including Other Comprehensive Income, Statement knowledgeable user of the Standalone Financial Statements of Changes in Equity and the Statement of Cash may be influenced. We consider quantitative materiality and Flows dealt with by this Report are in agreement with qualitative factors in (i) planning the scope of our audit work the books of account. and in evaluating the results of our work; and (ii) to evaluate the effect of any identified misstatements in the Standalone d) In our opinion, the aforesaid Standalone Financial Financial Statements. Statements comply with the Ind AS specified under Section 133 of the Act. We communicate with those charged with governance regarding, among other matters, the planned scope and e) On the basis of the written representations received timing of the audit and significant audit findings, including any from the directors as on March 31, 2026 taken significant deficiencies in internal financial controls that we on record by the Board of Directors, none of the identify during our audit. directors is disqualified as on March 31, 2026 from being appointed as a director in terms of Section We also provide those charged with governance with a 164(2) of the Act. statement that we have complied with relevant ethical requirements regarding independence, and to communicate f) With respect to the adequacy of the internal financial with them all relationships and other matters that may controls with reference to Standalone Financial reasonably be thought to bear on our independence, and Statements of the Company and the operating where applicable, related safeguards. effectiveness of such controls, refer to our separate Report in “Annexure A”. Our report expresses From the matters communicated with those charged with an unmodified opinion on the adequacy and governance, we determine those matters that were of most operating effectiveness of the Company’s internal significance in the audit of the Standalone Financial Statements financial controls with reference to Standalone of the current period and are therefore the key audit matters. Financial Statements.


LOGO

192 STATUTORY REPORTS AND FINANCIAL STATEMENTS STANDALONE FINANCIAL STATEMENT UNDER IND AS g) With respect to the other matters to be included iv. (a) The Management has represented in the Auditor’s Report in accordance with the that, to the best of its knowledge and requirements of section 197(16) of the Act, as belief, no funds have been advanced amended, in our opinion and to the best of our or loaned or invested (either from information and according to the explanations borrowed funds or share premium given to us, the remuneration paid by the or any other sources or kind of Company to its directors during the year is in funds) by the Company to or in any accordance with the provisions of section 197 of other person or entity, including the Act. foreign entities (“Intermediaries”), with the understanding, whether h) With respect to the other matters to be included recorded in writing or otherwise, in the Auditor’s Report in accordance with Rule that the Intermediary shall, directly 11 of the Companies (Audit and Auditors) Rules, or indirectly lend or invest in other 2014, as amended in our opinion and to the persons or entities identified in best of our information and according to the any manner whatsoever by or on explanations given to us: behalf of the Company (“Ultimate i. The Company has disclosed the impact of Beneficiaries”) or provide any pending litigations on its financial position guarantee, security or the like on in its Standalone Financial Statements behalf of the Ultimate Beneficiaries. - Refer Note 34 to the Standalone (b) The Management has represented, Financial Statements; that, to the best of its knowledge ii. The Company has made provision, and belief, no funds have been as required under the applicable law received by the Company from any or accounting standards, for material person or entity, including foreign foreseeable losses, if any, on long-term entities (“Funding Parties”), with the contracts including derivative contracts understanding, whether recorded in - Refer Note 18 to the Standalone writing or otherwise, that the Company Financial Statements; shall, directly or indirectly, lend or invest in other persons or entities iii. There has been no delay in transferring identified in any manner whatsoever amounts, required to be transferred, to the by or on behalf of the Funding Party Investor Education and Protection Fund by (“Ultimate Beneficiaries”) or provide the Company any guarantee, security or the like on behalf of the Ultimate Beneficiaries. - 26 2025 REPORT ANNUAL INTEGRATED WIPRO 


LOGO

193 (c) Based on the audit procedures performed Further, during the course of our audit we did that have been considered reasonable and not come across any instance of the audit trail appropriate in the circumstances, nothing feature being tampered with and the audit trail has come to our notice that has caused us has been preserved by the Company as per the to believe that the representations under statutory requirements for record retention. sub-clause (i) and (ii) of Rule 11(e), as 2. As required by the Companies (Auditor’s Report) Order, provided under (a) and (b) above, contain 2020 (“the Order”) issued by the Central Government in any material misstatement. terms of Section 143(11) of the Act, we give in “Annexure v. The interim dividends declared and paid by the B” a statement on the matters specified in paragraphs 3 Company during the year is in accordance with and 4 of the Order. section 123 of the Act, as applicable. vi. Based on our examination, which included test For Deloitte Haskins & Sells LLP checks, the Company has used accounting Chartered Accountants software systems for maintaining its books Firm Registration No. 117366W/W 100018 of account for the financial year ended March 31, 2026 which have the feature of recording Anand Subramanian audit trail (edit log) facility and the same has Partner operated throughout the year for all relevant Bengaluru Membership No. 110815 transactions recorded in the software systems. June 2, 2026 UDIN: 26110815XKZVMT7408


LOGO

194 STATUTORY REPORTS AND FINANCIAL STATEMENTS STANDALONE FINANCIAL STATEMENT UNDER IND AS (Referred to in paragraph 1(f) under ‘Report on Other Legal and Regulatory Requirements’ section of our report of even date) REPORT ON THE INTERNAL FINANCIAL CONTROLS WITH REFERENCE TO STANDALONE FINANCIAL STATEMENTS UNDER CLAUSE (I) OF SUB-SECTION 3 OF SECTION 143 OF THE COMPANIES ACT, 2013 (THE “ACT”) We have audited the internal financial controls with reference to Standalone Financial Statements of Wipro Limited (the “Company”) as at March 31, 2026 in conjunction with our audit of the standalone Ind AS financial statements of the Company for the year ended on that date. MANAGEMENT’S AND BOARD OF DIRECTORS’ RESPONSIBILITIES FOR INTERNAL FINANCIAL CONTROLS The Company’s management and Board of Directors are responsible for establishing Report and maintaining internal financial controls with reference to Standalone Financial Statements based on the internal control with reference to Standalone Financial Statements criteria established by the Company considering the essential components of internal control stated in the Guidance Note on Audit of Internal Financial Controls Over Financial Reporting issued by the Institute of Chartered Accountants of India. These responsibilities include the design, implementation and maintenance of adequate internal financial controls that were operating effectively for ensuring the orderly and efficient conduct of its business, including adherence to the company’s policies, the safeguarding of its assets, the prevention and detection of Auditor’s frauds and errors, the accuracy and completeness of the accounting records, and the timely preparation of reliable financial information, as required under the Companies Act, 2013. AUDITOR’S RESPONSIBILITY Our responsibility is to express an opinion on the Company’s internal financial controls with reference to Standalone Financial Statements of the Company based on our audit. We conducted our audit in accordance with the Guidance Note on Audit of Internal Financial Controls Over Financial Reporting (the “Guidance Note”) issued—26 by the Institute of Chartered Accountants of India and the Standards on Auditing 2025 prescribed under Section 143(10) of the Companies Act, 2013, to the extent applicable “A” to an audit of internal financial controls with reference to Standalone Financial REPORT Statements. Those Standards and the Guidance Note require that we comply with Independent ethical requirements and plan and perform the audit to obtain reasonable assurance about whether adequate internal financial controls with reference to Standalone ANNUAL Financial Statements was established and maintained and if such controls operated INTEGRATED The effectively in all material respects. WIPRO Annexureto


LOGO

195 Our audit involves performing procedures to obtain audit INHERENT LIMITATIONS OF INTERNAL evidence about the adequacy of the internal financial controls with reference to Standalone Financial Statements and their FINANCIAL CONTROLS WITH REFERENCE operating effectiveness. Our audit of internal financial controls TO STANDALONE FINANCIAL STATEMENTS with reference to Standalone Financial Statements included Because of the inherent limitations of internal financial controls obtaining an understanding of internal financial controls with with reference to Standalone Financial Statements, including reference to Standalone Financial Statements, assessing the the possibility of collusion or improper management override risk that a material weakness exists, and testing and evaluating of controls, material misstatements due to error or fraud may the design and operating effectiveness of internal control based occur and not be detected. Also, projections of any evaluation on the assessed risk. The procedures selected depend on the of the internal financial controls with reference to Standalone auditor’s judgement, including the assessment of the risks of Financial Statements to future periods are subject to the risk material misstatement of the financial statements, whether due that the internal financial control with reference to Standalone to fraud or error. Financial Statements may become inadequate because of We believe that the audit evidence we have obtained is sufficient changes in conditions, or that the degree of compliance with and appropriate to provide a basis for our audit opinion on the policies or procedures may deteriorate. the Company’s internal financial controls with reference to Standalone Financial Statements. OPINION In our opinion, to the best of our information and according to the MEANING OF INTERNAL FINANCIAL explanations given to us in all material respects, an adequate CONTROLS WITH REFERENCE TO internal financial controls with reference to Standalone Financial STANDALONE FINANCIAL STATEMENTS Statements and such internal financial controls with reference to Standalone Financial Statements were operating effectively A company’s internal financial control with reference to as at March 31, 2026, based on the criteria for internal financial Standalone Financial Statements is a process designed to control with reference to Standalone Financial Statements provide reasonable assurance regarding the reliability of established by the Company considering the essential financial reporting and the preparation of financial statements components of internal control stated in the Guidance Note on for external purposes in accordance with generally accepted Audit of Internal Financial Controls Over Financial Reporting accounting principles. A company’s internal financial issued by the Institute of Chartered Accountants of India. control with reference to Standalone Financial Statements includes those policies and procedures that (1) pertain to the maintenance of records that, in reasonable detail, accurately and fairly reflect the transactions and dispositions of the assets of the company; (2) provide reasonable assurance that transactions are recorded as necessary to permit preparation of financial statements in accordance with generally accepted For Deloitte Haskins & Sells LLP accounting principles, and that receipts and expenditures Chartered Accountants of the company are being made only in accordance with Firm Registration No. 117366W/W—100018 authorisations of management and directors of the company; and (3) provide reasonable assurance regarding prevention or Anand Subramanian timely detection of unauthorised acquisition, use, or disposition Partner of the company’s assets that could have a material effect on the Bengaluru Membership No. 110815 financial statements. June 2, 2026 UDIN: 26110815XKZVMT7408


LOGO

196 STATUTORY REPORTS AND FINANCIAL STATEMENTS STANDALONE FINANCIAL STATEMENT UNDER IND AS (Referred to in paragraph 2 under ‘Report on Other Legal and Regulatory Requirements’ section of our report to the Members of Wipro Limited of even date) To the best of our information and according to the explanations provided to us by the Company and the books of account and records examined by us in the normal course of audit, we state that: (i) In respect of the Company’s Property, Plant and Equipment and Intangible Assets: (a) (A) The Company has maintained proper records showing full particulars, including quantitative details and situation of Property, Plant and Equipment and relevant details of right-of-use assets. (B) The Company has maintained proper records showing full particulars of intangible assets. (b) The Company has a program of physical verification of Property, Plant and Equipment and right-of-use assets so to cover all the assets once every three years which, in our opinion, is reasonable having regard to the size of the Company and the nature of its assets. Pursuant to the program, Report certain Property, Plant and Equipment and right-of-use assets were due for verification during the year and were physically verified by the Management during the year. According to the information and explanations given to us, no material discrepancies were noticed on such verification. (c) Based on the examination of the registered sale deed / transfer deed / conveyance deed / the property tax receipts and lease agreement for land on which building is constructed provided to us, we report that, the title deeds of all the immovable properties (other than immovable properties where the Company is the lessee and the lease agreements are duly Auditor’s executed in favour of the Company) disclosed in the financial statements included in property, plant and equipment are held in the name of the Company as at the balance sheet date. (d) The Company has not revalued any of its Property, Plant and Equipment (including right-of-use assets) and intangible assets during the year. (e) No proceedings have been initiated during the year or are pending against the Company as at March 31, 2026 for holding any benami property under the Benami Transactions (Prohibition) Act, 1988 (as amended in 2016) and—26 rules made thereunder. 2025 “B” REPORT Independent ANNUAL the INTEGRATED Annexuretto WIPRO


LOGO

197 (ii) (a) The inventories were physically verified during the The Company has made investments in companies during year by the Management at reasonable intervals. the year and our reporting in respect of clause 3 (iii) (b) is In our opinion and according to the information as under: and explanations given to us, the coverage and (b) The investments made, guarantees provided and procedure of such verification by the Management is the terms and conditions of guarantees provided, appropriate having regard to the size of the Company during the year are, in our opinion, prima facie, not and the nature of its operations. No discrepancies prejudicial to the Company’s interest. of 10% or more in the aggregate for each class of inventories were noticed on such physical verification (iv) The Company has complied with the provisions of Sections of inventories when compared with books of account. 185 and 186 of the Companies Act, 2013 in respect of loans granted, investments made and guarantees and (b) According to the information and explanations given securities provided, as applicable. to us, the Company has not been sanctioned working capital limits in excess of Rs. 5 crores, in aggregate, (v) The Company has not accepted any deposit or amounts at any point of time during the year, from banks which are deemed to be deposits. Hence, reporting under or financial institutions on the basis of security of clause (v) of the Order is not applicable to the Company. current assets. (vi) The maintenance of cost records has not been specified for Hence, reporting on the quarterly returns or statements the activities of the Company by the Central Government filed by the Company with such banks or financial under section 148(1) of the Companies Act, 2013 for the institutions is not applicable to the Company. business activities carried out by the Company. Hence reporting under Clause (vi) of the order is not applicable (iii) The Company has neither made any investments in firms to the Company. and Limited Liability Partnerships nor provided loans or advances in the nature of loans or provided security (vii) In respect of statutory dues: to any companies, firms, Limited Liability Partnerships (a) In our opinion, undisputed statutory dues, including or any other parties during the year hence reporting Goods and Service tax, Provident Fund, Employees’ under clause 3 (iii) of the order is not applicable to the State Insurance, Income-tax, Sales Tax, Service tax, Company in respect of the above type of transactions. duty of Custom, duty of Excise, Value Added Tax, However, the Company has stood guarantee on behalf of cess and any other material statutory dues applicable the subsidiaries during the year and details of which are to the Company have generally been regularly given below. deposited by it with the appropriate authorities. C in million There were no undisputed amounts payable in Guarantees respect of Goods and Service tax, Provident Fund, A. Aggregate amount granted/ 10,887 Income-tax, Sales Tax, Service Tax, duty of Custom, provided during the year on behalf duty of Excise, Value Added Tax, cess and other of subsidiaries material statutory dues in arrears as at March 31, B. Balance outstanding as at balance 10,887 sheet date in respect of above cases 2026 for a period of more than six months from the date they became payable.


LOGO

198 STATUTORY REPORTS AND FINANCIAL STATEMENTS STANDALONE FINANCIAL STATEMENT UNDER IND AS (b) Details of statutory dues referred to in sub-clause (a) above which have not been deposited as on March 31, 2026 on account of disputes are given below: C in million Amount not Forum where Period to which the Amount deposited as Name of Statute Nature of dues dispute is amount relates Involved at March pending 31, 2026 Assistant The Central Excise Act, 1944 Excise Duty 1991-92 to 2014-15 48 43 Commissioner The Central Excise Act, 1944 Excise Duty Commissioner 2004-05 to 2014-15 10 10 Commissioner The Central Excise Act, 1944 Excise Duty 1995-96 to 2012-13 13 13 (Appeals) The Central Excise Act, 1944 Excise Duty CESTAT 2004-05 to 2012-13 31 19 Assistant The Customs Act, 1962 Customs Duty Commissioner 1994-95 to 2008-09 49 45 of Customs 1991-92 to The Customs Act, 1962 Customs Duty CESTAT 11 4 2011-12 The Customs Act, 1962 Customs Duty Commissioner 1990-91 to 2009-10 94 90 Commissioner 1997-98 to The Customs Act, 1962 Customs Duty 343 307 (Appeals) 2009-10 Madras High The Customs Act, 1962 Customs Duty 2009-10 4 4 Court Karnataka High The Customs Act, 1962 Customs Duty 1996-97 2 2 Court Customs Duty- Karnataka High The Customs Act, 1962 2001-02 to 2004-05 2,711 2,631 Penalty Court Assistant 2008-09 to 2009-10, Finance Act, 1994 Service tax 5 5 Commissioner 2016-17 and 2017-18 2008-09 to 2009-10 and Finance Act, 1994 Service tax Commissioner 1,542 1,392 2014-15 to 2017-18 Commissioner 2004-05 to Finance Act, 1994 Service tax 365 19 (Appeals) 2009-10 Finance Act, 1994 Service tax Supreme Court 2002-03 to 2007-08 1,502 1,502 2004-05 to Finance Act, 1994 Service tax CESTAT 529 265 2011-12 26 Service tax- - Finance Act, 1994 Supreme Court 2002-03 to 2007-08 239 239 2025 Penalty Finance Act, 1994 Service Tax- Commissioner 2005-06 to 2009-10 5 5 Penalty (Appeals) REPORT Service Tax- Assistant Finance Act, 1994 Penalty Commissioner 2008-09, 2009-10 1 1 Service Tax- ANNUAL Finance Act, 1994 Commissioner 2008-09, 2009-10 327 327 Penalty Service Tax- Finance Act, 1994 CESTAT 2008-09 to 2011-12 76 76 INTEGRATED Penalty WIPRO


LOGO

199 C in million Amount not Forum where dispute is Period to which the Amount deposited as Name of Statute Nature of dues pending amount relates Involved at March 31, 2026 Assistant Commissioner/ Sales Tax / VAT Sales Tax / VAT 1986-87 to 2017-18 4404 4,113 Deputy Commissioner Sales Tax / VAT Sales Tax / VAT Commissioner (Appeals) 1988-89 to 2017-18 1,774 1,649 Additional Commissioner Sales Tax / VAT Sales Tax / VAT 1990 -91 to 2005-06 19 18 (Appeals) Sales Tax / VAT Sales Tax / VAT Commercial Tax Tribunal 1997-98 1 -Deputy Commissioner Sales Tax / VAT Sales Tax / VAT 2007-08 1 -(Appeals) Tamil Nadu Sales Tax Sales Tax / VAT Sales Tax / VAT 1986-87 to 1990-91 2 1 Appellate Tribunal Sales Tax / VAT Sales Tax / VAT Tribunal 2009-10 to 2016-17 810 746 Sales Tax / VAT Sales Tax / VAT High Court 2002-03 to 2013-14 34 27 Sales Tax/ VAT Sales Tax/ VAT Supreme Court 2001-02 12 12 Sales Tax/ VAT Sales Tax/ VAT Assessing Officer 2017-18 118 118 Goods and Goods and Services Tax Appellate Authority 2017-18 to 2021-22 1,784 1,283 Services Tax Goods and Goods and Services Tax Assistant Commissioner 2018-24 2 2 Services Tax Goods and Goods and Services Tax Deputy Commissioner 2018-19 and 2020-2021 246 77 Services Tax Goods and Goods and Services Tax High Court 2017-18, 2018-19 2,719 2,646 Services Tax 2003-04, 2011-12, 2017-18, 2018-19, 2020-21 to 2023-24, 2009-10 to The Income Tax Act, Commissioner of Income Income Tax—TDS 2013-14, 2009-10 to 338 328 1961 tax (Appeals) – TDS 2011-12, 2014-15 to 2018-19, 2020-21 to 2022-23 The Income Tax Act, Income Tax Assessing Officer 2007-08 97 42 1961 The Income Tax Act, Commissioner of Income Income Tax 2012-13 16 16 1961 tax (Appeals) The Income Tax Act, Income Tax Appellate 2007-08, 2009-10, 2019-Income Tax 13,010 11,910 1961 Tribunal 20, 2020-21, 2021-22 The Employees’ Provident Funds The Employees’ Provident Provident Fund 2006-07 to 2013-14 174 174 And Miscellaneous Funds Appellate Tribunal Provisions, ACT, 1952 The Employees’ Provident Funds Provident Fund High Court 2014-15 to 2020-2021 3,325 3,325 And Miscellaneous Provisions, ACT, 1952


LOGO

200 STATUTORY REPORTS AND FINANCIAL STATEMENTS STANDALONE FINANCIAL STATEMENT UNDER IND AS (viii) There were no transactions relating to previously (xi) (a) To the best of our knowledge, no fraud by the unrecorded income that were surrendered or Company and no material fraud on the Company disclosed as income in the tax assessments under the has been noticed or reported during the year. Income Tax Act, 1961 (43 of 1961) during the year. (b) No report under sub-section (12) of section 143 (ix) (a) In our opinion, the Company has not defaulted of the Companies Act has been filed in Form in the repayment of loans or other borrowings or ADT-4 as prescribed under rule 13 of Companies in the payment of interest thereon to any lender (Audit and Auditors) Rules, 2014 with the Central during the year. Government, during the year and upto the date of this report. (b) The Company has not been declared wilful defaulter by any bank or financial institution or (c) We have taken into consideration the whistle government or any government authority. blower complaints received by the Company during the year (and upto the date of this report) (c) The Company has not taken any term loan during and provided to us, when performing our audit. the year and there are no unutilised term loans at the beginning of the year and hence, reporting (xii) The Company is not a Nidhi Company and hence under clause (ix)(c) of the Order is not applicable reporting under clause (xii) of the Order is not to the Company. applicable to the Company. (d) On an overall examination of the financial (xiii) In our opinion, the Company is in compliance with statements of the Company, funds raised on Section 177 and 188 of the Companies Act, where short-term basis have, prima facie, not been applicable, for all transactions with the related parties used during the year for long-term purposes by and the details of related party transactions have been the Company. disclosed in the financial statements as required by the applicable accounting standards. (e) On an overall examination of the financial statements of the Company, the Company has (xiv) (a) In our opinion, the Company has an adequate not taken any funds from any entity or person internal audit system commensurate with the size on account of or to meet the obligations of its and the nature of its business. subsidiaries or associates. (b) We have considered, the internal audit reports (f) The Company has not raised any loans during provided to us for the year under audit and till the year on the pledge of securities held in date, when performing our audit. its subsidiaries and hence reporting under (xv) In our opinion, during the year the Company has clause (ix)(f) of the Order is not applicable to not entered into any non-cash transactions with its the Company. directors or persons connected with its directors and (x) (a) The Company has not raised moneys by way of hence provisions of section 192 of the Companies Act, initial public offer or further public offer (including 2013 are not applicable to the Company. - 26 debt instruments) during the year and hence (xvi) (a) In our opinion, the Company is not required to be 2025 reporting under clause (x)(a) of the Order is not registered under section 45-IA of the Reserve applicable to the Company. REPORT Bank of India Act, 1934. Hence, reporting under (b) During the year the Company has not made clause (xvi)(a), (b) and (c) of the Order is not any preferential allotment or private placement applicable to the Company. ANNUAL of shares or convertible debentures (fully or partly or optionally) and hence reporting under (b) The Group does not have any Core Investment Company as part of the Group and accordingly clause (x)(b) of the Order is not applicable to reporting under clause (xvi)(d) of the Order is not the Company. INTEGRATED applicable to the Company. WIPRO


LOGO

201 (xvii) The Company has not incurred cash losses during the (xx) (a) There is no unspent amount towards Corporate financial year covered by our audit and the immediately Social Responsibility (CSR) on other than ongoing preceding financial year. projects requiring a transfer to a Fund specified in Schedule VII to the Companies Act or special account (xviii) There has been no resignation of the statutory auditors of in compliance with the provision of sub-section (6) of the Company during the year. section 135 of the said Act. Accordingly, reporting (xix) On the basis of the financial ratios, ageing and expected under clause (xx)(a) of the Order is not applicable to dates of realisation of financial assets and payment of the Company. financial liabilities, other information accompanying the (b) In respect of ongoing projects, the Company has financial statements and our knowledge of the Board transferred unspent Corporate Social Responsibility of Directors and Management plans and based on our (CSR) amount, to a Special account before the date examination of the evidence supporting the assumptions, of this report and within a period of 30 days from nothing has come to our attention, which causes us to the end of the financial year in compliance with the believe that any material uncertainty exists as on the date provision of section 135(6) of the Act. of the audit report indicating that Company is not capable of meeting its liabilities existing at the date of balance sheet as and when they fall due within a period of one year from the balance sheet date. We, however, state that this is not an assurance as to the future viability of the Company. For Deloitte Chartered Haskins Accountants & Sells LLP We further state that our reporting is based on the facts Firm Registration No. 117366W/W—100018 up to the date of the audit report and we neither give any guarantee nor any assurance that all liabilities falling due Anand Subramanian within a period of one year from the balance sheet date, Partner will get discharged by the Company as and when they Bengaluru Membership No. 110815 fall due. June 2, 2026 UDIN: 26110815XKZVMT7408


LOGO

202 STATUTORY REPORTS AND FINANCIAL STATEMENTS STANDALONE FINANCIAL STATEMENT UNDER IND AS As at As at Notes stated) March 31, 2026 March 31, 2025 ASSETS otherwise Non-current assets Property, plant and equipment 4 68,146 70,517 unless Right-of-Use assets 5 14,506 12,909 data, Capital work-in-progress 6 4,122 1,785 Goodwill 7 6,098 6,082 share Other intangible assets 7 430 721 per Financial assets and Investments 8 242,145 204,399 share Derivative assets 20 -  ^ Unbilled receivables 7,010 - except Other financial assets 11 4,291 3,538 Deferred tax assets (net) 21 2,102 453 millions, Non-current tax assets (net) 5,558 7,075 in Other non-current assets 13 6,848 5,474 I ( Total non-current assets 361,256 312,953 Current assets Inventories 12 468 622 Financial assets Investments 8 394,720 409,568 Derivative assets 20 888 1,578 Trade receivables 9 96,616 80,796 Unbilled receivables 46,202 37,436 Cash and cash equivalents 10 26,778 44,342 Other financial assets 11 6,694 5,973 Current tax assets (net) 6,308 3,781 - 26 2025 Contract assets 7,352 9,815 Other current assets 13 26,142 22,408 REPORT Sheet Total current assets 612,168 616,319 TOTAL ASSETS 973,424 929,272 ANNUAL EQUITY AND LIABILITIES EQUITY INTEGRATED Equity share capital 14 20,977 20,944 Other equity 615,820 613,930 WIPRO Balance TOTAL EQUITY 636,797 634,874


LOGO

203 (I in millions, except share and per share data, unless otherwise stated) As at As at Notes March 31, 2026 March 31, 2025 LIABILITIES Non-current liabilities Financial liabilities Lease liabilities 5 15,213 11,978 Trade payables (a) Total outstanding dues of micro enterprises and small enterprises 16 -  -  (b) Total outstanding dues of creditors other than micro enterprises and 16 3,719 - small enterprises Other financial liabilities 17 731 1,051 Provisions 18 1,838 2,600 Deferred tax liabilities (net) 21 -  1,315 Non-current tax liabilities (net) 44,420 38,525 Other non-current liabilities 19 17,877 12,703 Total non-current liabilities 83,798 68,172 Current liabilities Financial liabilities Borrowings 15 61,500 60,500 Lease liabilities 5 4,148 3,813 Derivative liabilities 20 9,799 968 Trade payables (a) Total outstanding dues of micro enterprises and small enterprises 16 2,315 1,286 (b) Total outstanding dues of creditors other than micro enterprises and 16 57,788 66,537 small enterprises Other financial liabilities 17 28,681 22,656 Contract liabilities 18,829 15,162 Other current liabilities 19 10,479 10,037 Provisions 18 13,058 13,167 Current tax liabilities (net) 46,232 32,100 Total current liabilities 252,829 226,226 TOTAL LIABILITIES 336,627 294,398 TOTAL EQUITY AND LIABILITIES 973,424 929,272 ^ Value is less than H 0.5 The accompanying notes form an integral part of these standalone financial statements As per our report of even date attached For and on behalf of the Board of Directors for Deloitte Haskins & Sells LLP Rishad A. Premji Deepak M. Satwalekar Srinivas Pallia Chartered Accountants Chairman Director Chief Executive Officer and Firm’s Registration No.: 117366W/W—100018 (DIN: 02983899) (DIN: 00009627) Managing Director (DIN: 10574442) Anand Subramanian Aparna C. Iyer M. Sanaulla Khan Partner Chief Financial Officer Company Secretary Membership No.: 110815 Membership No.: F4129 Bengaluru June 2, 2026


LOGO

204 STATUTORY REPORTS AND FINANCIAL STATEMENTS STANDALONE FINANCIAL STATEMENT UNDER IND AS Year ended Year ended Notes stated) March 31, 2026 March 31, 2025 INCOME Revenue from operations 22 713,451 685,750 otherwise Other income 23 47,491 39,477 Total income 760,942 725,227 unless EXPENSES data, Purchases of stock-in-trade 3,352 2,113 Changes in inventories of stock-in- 24 148 90 share trade per Employee benefits expense 25 388,809 383,850 and Finance costs 26 10,959 10,018 Depreciation, amortisation and 14,182 15,013 share impairment expense Sub-contracting and technical 126,442 112,812 fees except Facility expenses 12,542 12,350 Software license expense for 17,331 16,023 millions, internal use in Travel 11,447 11,646 I Communication 2,333 2,335 ( Loss Legal and professional charges 6,075 7,189 Marketing and brand building 3,031 3,117 Other expenses 27 5,239 2,546 and Total expenses 601,890 579,102 Profit before tax 159,052 146,125 Tax expense Current tax 21 38,349 39,934 Deferred tax 21 (593) (2,940) Profit Total tax expense 37,756 36,994 Profit for the year 121,296 109,131 - 26 of 2025 Other comprehensive income (OCI) Items that will not be reclassified to REPORT profit or loss: Re-measurements of the defined 25 222 316 ANNUAL benefit plans, net Net change in fair value of investment in equity instruments 134 (9) measured at fair value through OCI INTEGRATED Income taxes relating to items that 21 will not be reclassified to profit or (49) (73) WIPRO Statements loss


LOGO

205 (I in millions, except share and per share data, unless otherwise stated) As at As at Notes March 31, 2026 March 31, 2025 Items that will be reclassified to profit or loss: Net change in time value of option contracts designated as cash flow hedges 20 73 (248) Net change in intrinsic value of option contracts designated as cash flow hedges 20 (1,622) 193 Net change in fair value of forward contracts designated as cash flow hedges 20 (7,478) (787) Net change in fair value of investment in debt instruments measured at fair value (2,413) 1,189 through OCI Income taxes relating to items that will be reclassified to profit or loss 21 2,468 (24) Total other comprehensive income/(losses)for the year, net of taxes (8,665) 557 Total comprehensive income for the year 112,631 109,688 Earnings per equity share 28 (Equity shares of par value H 2 each) Basic 11.59 10.44 Diluted 11.55 10.40 Weighted average number of equity share susedin computing earnings per equity share Basic 10,476,247,846 10,456,741,552 Diluted 10,503,422,936 10,488,939,392 The accompanying notes form an integral part of these standalone financial statements As per our report of even date attached For and on behalf of the Board of Directors for Deloitte Haskins & Sells LLP Rishad A. Premji Deepak M. Satwalekar Srinivas Pallia Chartered Accountants Chairman Director Chief Executive Officer and Firm’s Registration No.: 117366W/W—100018 (DIN: 02983899) (DIN: 00009627) Managing Director (DIN: 10574442) Anand Subramanian Aparna C. Iyer M. Sanaulla Khan Partner Chief Financial Officer Company Secretary Membership No.: 110815 Membership No.: F4129 Bengaluru June 2, 2026


LOGO

WIPRO INTEGRATED ANNUAL REPORT 2025-26 206 Statements of Changes in Equity STATUTORY REPORTS ( in millions, except share and per share data, unless otherwise I stated) AND A. EQUITY SHARE CAPITAL FINANCIAL Balance as at Changes in equity share capital Restated balance as at Changes in equity share capital Balance as at April 1, 2025 due to prior period errors April 1, 2025 during the current year March 31, 2026(2) 20,944 — 20,944 33 20,977 STATEMENTS Balance as at Changes in equity share capital Restated balance as at Changes in equity share capital Balance as at April 1, 2024 due to prior period errors April 1, 2024 during the previous year(1) March 31, 2025(2) 10,450 — 10,450 10,494 20,944 (1) I 10,467 is towards issue of bonus shares (Refer to Note 29) and I 27 is towards proceeds from issue of equity shares on exercise of options. (2) As at March 31, 2026, the Company has 10,488,412,458 equity shares of I 2 each (March 31, 2025: 10,472,136,049 equity shares). As at March 31, 2026, the Company has 11,905,480 treasury shares (March 31, 2025 : 11,905,480 treasury shares), held by a controlled trust consolidated as part of the Company. STANDALONE FINANCIAL STATEMENT UNDER IND AS


LOGO

207 (I in millions, except share and per share data, unless otherwise stated) B. OTHER EQUITY Reserves and Surplus Other components of equity Share Common Special Investment Investment application Capital control Share Economic Cashflow Foreign Remeasurements in debt inequity Total money Securities Capital redemption Retained transactions options Zone re- hedging currency of the defined instruments instruments other pending premium reserve reserve earnings capital outstanding investment reserve(1) translation benefit plans measured measured equity allotment reserve account reserve reserve at fair value at fair value through OCI through OCI BalanceasatApril1,2025 ^ 2,240 1,139 13 571,291 2,473 6,985 27,778 (241) 1,882 159 2,360 (2,149) 613,930 Profit for the year — — 121,296 — — — — 121,296 Other comprehensive — — — — (6,878)—169 (2,094) 138 (8,665) income Total comprehensive — — 121,296 ——(6,878)—169 (2,094) 138 112,631 income for the year Issue of equity shares on—3,530 — — (3,530) — — — -exercise of options Dividend (2) — — (115,206) — — — — (115,206) Compensation cost related — — — 4,465 — — — 4,465 to employee share-based payment Transferred from Special — — 1,812 — (1,812) — — —Economic Zone reinvestment reserve Other transactions for—3,530 — (113,394)—935 (1,812) — ——(110,741) the year Balance as at March 31, 2026 ^ 5,770 1,139 13 579,193 2,473 7,920 25,966 (7,119) 1,882 328 266 (2,011) 615,820 ^ Value is less than I 0.5 (1) Refer to Note 20 (2) Refer to Note 29


LOGO

WIPRO INTEGRATED ANNUAL REPORT 2025-26 208 (I in millions, except share and per share data, unless otherwise stated) Reserves and Surplus Other components of equity Share Investment Investment application Common Special Total Share Foreign in debt in equity money Capital control Economic Cash flow Remeasurements other Securities Capital Retained options currency instruments instruments STATUTORY pending redemption transactions Zone re- hedging of the defined equity premium reserve reserve earnings capital outstanding investment reserve(1) translation benefit plans measured measured allotment account reserve at fair value at fair value reserve reserve through OCI through OCI Balance as at April 1, 2024 ^ 2,903 1,139 1,674 509,281 2,473 6,384 42,129 399 1,882 (147) 1,397 (2,145) 567,369 REPORTS Adjustment on account of merger(3) — — 4,471 — ——68 — 4,539AND Adjusted balance as at April 1, 2024 ^ 2,903 1,139 1,674 513,752 2,473 6,384 42,129 399 1,882 (79) 1,397 (2,145) 571,908 Profit for the year — — 109,131 — — — — 109,131 Other comprehensive income — — — — (640)—238 963 (4) 557 Total comprehensive income for — — 109,131 ——(640)—238 963 (4) 109,688 FINANCIAL the year Issue of equity shares on exercise of - 4,950 — — (4,950) — — — -options Dividend (2) — — (62,750) — — — — (62,750) Compensation cost related to — — — 5,551—— ——5,551 employee share based payment STATEMENTS Bonus issue of equity shares(2)—(5,613)—(1,661) (3,193) — — — — (10,467) Transferred from Special Economic — — 14,351 — (14,351) — — —Zone re investment reserve Other transactions for the year—(663)—(1,661) (51,592)—601 (14,351) — ——(67,666) BalanceasatMarch31,2025 ^ 2,240 1,139 13 571,291 2,473 6,985 27,778 (241) 1,882 159 2,360 (2,149) 613,930 ^ Value is less than I 0.5 (1) Refer to Note 20 STANDALONE (2) Refer to Note 29 (3) Refer to Note 38 The accompanying notes form an integral part of these standalone financial statements FINANCIAL As per our report of even date attached For and on behalf of the Board of Directors for Deloitte Haskins & Sells LLP Rishad A. Premji Deepak M. Satwalekar Srinivas Pallia Chartered Accountants Chairman Director Chief Executive Officer and Firm’s Registration No.: 117366W/W—100018 (DIN: 02983899) (DIN: 00009627) Managing Director STATEMENT (DIN: 10574442) Anand Subramanian Aparna C. Iyer M. Sanaulla Khan Partner Chief Financial Officer Company Secretary UNDER Membership No.: 110815 Membership No.: F4129IND Bengaluru AS June 2, 2026


LOGO

209 For the year ended For the year ended Notes stated) March 31, 2026 March 31, 2025 Cash flows from operating activities Profit for the year 121,296 109,131 otherwise Adjustmentstoreconcileprofitfortheyearto net cash generated from operating activities Gain on sale of property, plant and unless (415) (712) equipment, net Depreciation, amortisation and impairment data, 14,182 15,013 expense share Unrealised exchange (gain)/loss and net exchange (gain)/loss on loans to (1,496) (788) per subsidiaries and Share-based compensation expense 3,874 4,847 Income tax expense 21 37,756 36,994 share Lifetime expected credit loss 27 2,729 829 Finance and other income, net of finance (32,945) (28,187) except costs Diminution in the value of investments in 27 (1,554) 359 subsidiaries millions, Changes in operating assets and liabilities in (Increase)/Decrease in trade receivables (17,933) 3,627 I (Increase)/Decrease in unbilled receivables ( (13,532) (2,920) and contract assets (Increase)/Decrease in inventories 154 107 (Increase)/Decrease in other financial (2,735) 5,740 assets and other assets Increase/(Decrease) in trade payables, Flows other financial liabilities, other liabilities 1,992 9,341 and provisions Increase/(Decrease) in contract liabilities 3,667 845 Cash generated from operating activities 115,040 154,226 before taxes Cash Income taxes paid, net (19,332) (20,860) Net cash generated from operating activities 95,708 133,366 Cash flows from investing activities of Payment for purchase of property, plant and (12,350) (10,956) equipment Proceeds from disposal of property, plant 648 1,789 and equipment Payment for purchase of investments (778,407) (797,809) Proceeds from sale of investments 796,704 704,597 Investment in subsidiaries (33,548) (51) Repayment of security deposit for property, — (300) plant and equipment Interest received 26,680 23,818 Dividend received 11,065 5,163 Net cash generated from/(used in)investing 10,792 (73,749) Statements activities


LOGO

210 STATUTORY REPORTS AND FINANCIAL STATEMENTS STANDALONE FINANCIAL STATEMENT UNDER IND AS (I in millions, except share and per share data, unless otherwise stated) For the year ended For the year ended Notes March 31, 2026 March 31, 2025 Cash flows from financing activities Proceeds from issuance of equity shares and shares pending allotment 33 27 Repayment of borrowings (218,000) (176,000) Proceeds from borrowings 219,000 194,750 Payment of lease liabilities including interest 5 (5,754) (5,254) Payment of dividend (115,206) (62,750) Interest and finance costs paid (4,343) (4,810) Net cash used in financing activities (124,270) (54,037) Net increase/(decrease) in cash and cash equivalents during the year (17,770) 5,580 Effect of exchange rate changes on cash and cash equivalents 206 (293) Cash and cash equivalents at the beginning of the year 10 44,342 39,055 Cash and cash equivalents at the end of the year 10 26,778 44,342 Refer to Note 15 for supplementary information on statement of cash flows. The accompanying notes form an integral part of these standalone financial statements As per our report of even date attached For and on behalf of the Board of Directors for Deloitte Haskins & Sells LLP Rishad A. Premji Deepak M. Satwalekar Srinivas Pallia Chartered Accountants Chairman Director Chief Executive Officer and Firm’s Registration No.: 117366W/W—100018 (DIN: 02983899) (DIN: 00009627) Managing Director (DIN: 10574442) Anand Subramanian Aparna C. Iyer M. Sanaulla Khan Partner Chief Financial Officer Company Secretary Membership No.: 110815 Membership No.: F4129 Bengaluru June 2, 2026 - 26 2025 REPORT ANNUAL INTEGRATED WIPRO 


LOGO

211 stated) 1. THE COMPANY OVERVIEW Wipro Limited (“Wipro” or “the Company” or “we” or “our” or “us”), is a leading artificial intelligence (“AI”) powered technology services and consulting company focused on building innovative solutions that address clients’ most complex digital transformation otherwise needs. Leveraging our consulting-led approach and the Wipro Intelligence™ unified suite of AI-powered platforms, solutions and transformative offerings, we help clients realise unless their boldest ambitions to build intelligent and sustainable businesses. data, Wipro is a public limited company incorporated and domiciled in India. The address of its registered office is Wipro Limited, Doddakannelli, Sarjapur Road, Bengaluru – 560 share 035, Karnataka, India. The Company has its primary listing with BSE Ltd. and National per Stock Exchange of India Limited. The Company’s American Depository Shares (“ADS”) representing equity shares are also listed on the New York Stock Exchange. Statements and The Company’s Board of Directors authorised these standalone financial statements for share issue on June 2, 2026. except 2. BASIS OF PREPARATION OF STANDALONE FINANCIAL STATEMENTS millions, (i) Statement of compliance and basis of preparation in The standalone financial statements have been prepared in compliance with Indian I Financial ( Accounting Standards (“Ind AS”), the provisions of Schedule III to the Companies Act, 2013 (“the Companies Act”), as applicable and guidelines issued by the Securities and Exchange Board of India (“SEBI”). The Ind AS are prescribed under Section 133 of the Companies Act read with Rule 3 of the Companies (Indian Accounting Standards) Rules, 2015 and amendments issued thereafter. All accounting policies have been applied consistently to all periods presented in these standalone financial statements, except for the adoption of new accounting standards, amendments and interpretations effective from April 1, 2025. The standalone financial statements correspond to the classification provisions contained in Ind AS 1, “Presentation of Financial Statements”. For clarity, various items are aggregated in the statement of profit and loss and balance sheet. These items are disaggregated separately in the notes to the standalone financial statements, Standalone where applicable. The assets which are expected to be realised within a period of twelve months from the end of reporting period are classified as current assets. Similarly, the liabilities which the are expected to be settled within a period of twelve months from the end of reporting period are classified as current liabilities. All other assets and liabilities are classified as to non-current. All amounts included in the standalone financial statements are reported in millions of Indian Rupees (I in millions) except share and per share data, unless otherwise stated. Due to rounding off, the numbers presented throughout the document may not add up precisely to the totals and percentages may not precisely reflect the absolute figures. Notes Previous year figures have been regrouped/rearranged, wherever necessary.


LOGO

212 STATUTORY REPORTS AND FINANCIAL STATEMENTS STANDALONE FINANCIAL STATEMENT UNDER IND AS Notes to the Standalone Financial Statements (I in millions, except share and per share data, unless otherwise stated) (ii) Basis of measurement a) Revenue recognition: The Company applies judgement to determine whether each product The standalone financial statements have been or service promised to a customer is capable prepared on a historical cost convention and on an of being distinct, and is distinct in the context accrual basis, except for the following material items, of the contract, if not, the promised product or which have been measured at fair value as required service is combined and accounted as a single by relevant Ind AS: performance obligation. The Company allocates the Transaction Price (as defined below in Note a) Derivative financial instruments; 3(xiii)) to separately identifiable performance b) Financial instruments classified as fair value obligation deliverables based on their relative through other comprehensive income or fair stand-alone selling price. In cases where the value through profit or loss; Company is unable to determine the stand-alone selling price the Company uses expected c) The defined benefit liability/(asset) is recognised cost-plus margin approach in estimating the as the present value of defined benefit obligation stand-alone selling price. The Company uses less fair value of plan assets; and the percentage of completion method using d) Contingent consideration. the input (cost expended) method to measure progress towards completion in respect of (iii) Use of estimates and judgement fixed price contracts. Percentage of completion method accounting relies on estimates of The preparation of these standalone financial total expected contract revenue and costs. statements in conformity with Ind AS requires the This method is followed when reasonably management to make judgements, accounting dependable estimates of the revenues and costs estimates and assumptions that affect the application applicable to various elements of the contract of accounting policies and the reported amounts of can be made. Key factors that are reviewed in assets, liabilities, income and expenses. Accounting estimating the future costs to complete include estimates are monetary amounts in the standalone estimates of future labor costs and productivity financial statements that are subject to measurement efficiencies. Because the financial reporting uncertainty. An accounting policy may require items of these contracts depends on estimates that in standalone financial statements to be measured at are assessed continually during the term of monetary amounts that cannot be observed directly these contracts, revenue recognised, profit and and must instead be estimated. In such a case, timing of revenue for remaining performance management develops an accounting estimate to obligations are subject to revisions as the achieve the objective set out by the accounting policy. contract progresses to completion. When Developing accounting estimates involves the use estimates indicate that a loss will be incurred, of judgements or assumptions based on the latest the loss is provided for in the period in which available and reliable information. Actual results may the loss becomes probable. Volume discounts - 26 2025 differ from those accounting estimates. are recorded as a reduction of revenue. When Accounting estimates and underlying assumptions the amount of discount varies with the levels of REPORT are reviewed on an ongoing basis. Changes to revenue, volume discount is recorded based on accounting estimates are recognised in the period in estimate of future revenue from the customer. which the estimates are changed and in any future b) Impairment testing: Goodwill recognised on ANNUAL periods affected. In particular, information about material areas of estimation, uncertainty and critical business combination is tested for impairment at least annually and when events occur or judgements in applying accounting policies that have changes in circumstances indicate that the INTEGRATED the material effect on the amounts recognised in the recoverable amount of goodwill or a cash standalone financial statements are included in the generating unit to which goodwill pertains, is less WIPRO following notes: than the carrying value. The Company assesses acquired intangible assets with finite useful


LOGO

213 Notes to the Standalone Financial Statements (I in millions, except share and per share data, unless otherwise stated) life for impairment whenever events or changes in estimating the acquisition date fair value of the circumstances indicate that the carrying amount identifiable assets acquired (including useful life may not be recoverable. The recoverable amount estimates), liabilities assumed, and contingent of an asset or a cash generating unit is higher of consideration assumed involves management value in use and fair value less cost of disposal. judgement. These measurements are based on The calculation of value in use of an asset or a cash information available at the acquisition date and are generating unit involves use of significant estimates based on expectations and assumptions that have and assumptions which include turnover, growth been deemed reasonable by management. Changes rates and net margins used to calculate projected in these judgements, estimates, and assumptions future cash flows, risk-adjusted discount rate, future can materially affect the results of operations. economic and market conditions. f) Defined benefit plans and compensated absences: c) Impairment of investment in subsidiaries: The The cost of the defined benefit plans, compensated Company reviews its carrying value of investments absences and the present value of the defined carried at cost (net of impairment, if any) annually benefit obligations are based on actuarial valuation or more frequently when there is indication for using the projected unit credit method. An actuarial impairment. If the recoverable amount is less than valuation involves making various assumptions that its carrying amount, the impairment loss is accounted may differ from actual developments in the future. for in the statement of profit and loss. These include the determination of the discount rate, future salary increases and mortality rates. Due d) Income taxes: The major tax jurisdictions for the to the complexities involved in the valuation and Company are India and the United States. its long-term nature, a defined benefit obligation is Significant judgements are involved in determining highly sensitive to changes in these assumptions. All the provision for income taxes including judgement assumptions are reviewed at each reporting date. on whether tax positions are probable of being g) Expected credit losses on financial assets: The sustained in tax assessments. A tax assessment can impairment provisions of financial assets are based involve complex issues, which can only be resolved on assumptions about risk of default and expected over extended time periods. timing of collection. The Company uses judgement Deferred tax is recorded on temporary differences in making these assumptions and selecting the between the tax bases of assets and liabilities and inputs to the expected credit loss calculation based their carrying amounts, at the rates that have been on the Company’s history of collections, customer’s enacted or substantively enacted at the reporting creditworthiness, existing market conditions as well date. The ultimate realisation of deferred tax assets as forward-looking estimates at the end of each is dependent upon the generation of future taxable reporting period. profits during the periods in which those temporary h) Useful lives of property, plant and equipment: The differences and tax loss carry-forwards become Company depreciates property, plant and equipment deductible. The Company considers expected on a straight-line basis over estimated useful lives reversal of deferred tax liabilities and projected of the assets. The charge in respect of periodic future taxable income in making this assessment. depreciation is derived based on an estimate of The amount of deferred tax assets considered an asset’s expected useful life and the expected realisable, however, could reduce in the near term if residual value at the end of its life. The lives are based estimates of future taxable income during the carry-on historical experience with similar assets as well as forward period are reduced. anticipation of future events, which may impact their life, such as changes in technology. The estimated useful life is reviewed at least annually. e) Business combinations: In accounting for business combinations, judgement is required to assess i) Provisions and contingent liabilities: The Company whether an identifiable intangible asset is to be estimates the provisions that have present obligations recorded separately from goodwill. Additionally, as a result of past events, and it is probable that


LOGO

214 STATUTORY REPORTS AND FINANCIAL STATEMENTS STANDALONE FINANCIAL STATEMENT UNDER IND AS Notes to the Standalone Financial Statements (I in millions, except share and per share data, unless otherwise stated) outflow of resources will be required to settle the denominated in foreign currency and measured at obligations. These provisions are reviewed at the historical cost are translated at the exchange rate end of each reporting date and are adjusted to prevalent at the date of transaction. Translation reflect the current best estimates. differences on non-monetary financial assets measured at fair value at the reporting date, such as The Company uses significant judgement to equities classified as financial instruments measured disclose contingent liabilities. Contingent liabilities at fair value through other comprehensive income are are disclosed when there is a possible obligation included in other comprehensive income, net of taxes. arising from past events, the existence of which will be confirmed only by the occurrence or non-occurrence of one or more uncertain future events (iii) Financial instruments not wholly within the control of the Company or a present obligation that arises from past events a) Non-derivativefinancialinstruments: where it is either not probable that an outflow of Non derivative financial instruments consist of: resources will be required to settle the obligation or a reliable estimate of the amount cannot be • financial assets, which include cash and made. Contingent assets are neither recognised cash equivalents, trade receivables, unbilled nor disclosed in the financial statements. receivables, finance lease receivables, employee and other advances, investments in equity and debt securities and eligible current and non-current 3. MATERIAL ACCOUNTING POLICY assets; and INFORMATION • financial liabilities, which include borrowings, trade (i) Functional and presentation currency payables, lease liabilities, and eligible current and non-current liabilities. These standalone financial statements are presented in Indian Rupees, which is the functional currency of Non- derivative financial instruments other than trade the Company. receivables and unbilled receivables are recognised initially at fair value. However, trade receivables (ii) Foreign currency transactions and unbilled receivables that do not contain a significant financing component are measured at the and translation Transaction Price. Subsequent to initial recognition, Transactions in foreign currency are translated into non-derivative financial instruments are measured as the functional currency using the exchange rates described below: prevailing at the date of the transaction. Foreign A. Cash and cash equivalents exchange gains and losses resulting from the settlement of such transactions and from translation The Company’s cash and cash equivalents at the exchange rates prevailing at the reporting date consist of cash on hand and in banks and demand—26 of monetary assets and liabilities denominated in deposits with banks, which can be withdrawn 2025 foreign currencies are recognised in the statement of at any time, without prior notice or penalty on profit and loss and reported within foreign exchange the principal. REPORT gains/(losses), net, within results of operating activities except when deferred in other comprehensive income For the purposes of the statement of cash as qualifying cash flow hedges and qualifying net flows, cash and cash equivalents include cash ANNUAL investment hedges. Net loss relating to translation on hand, in banks and demand deposits with banks, net of outstanding bank overdrafts that or settlement of borrowings denominated in foreign currency are reported within finance costs. Net gain are repayable on demand and are considered INTEGRATED relating to translation or settlement of borrowings part of the Company’s cash management denominated in foreign currency are reported within system. In the balance sheet, bank overdrafts Other income. Non-monetary assets and liabilities are presented under borrowings within current WIPRO financial liabilities.


LOGO

215 Notes to the Standalone Financial Statements (I in millions, except share and per share data, unless otherwise stated) B. Investments losses arising on re-measurement recognised in the statement of profit and loss. The gain or loss Financial instruments measured at on disposal is recognised in the statement of profit amortised cost: and loss. Debt instruments that meet the following criteria Interest income is recognised in the statement of are measured at amortised cost (except for debt profit and loss for FVTPL debt instruments. Dividends instruments that are designated at fair value through on financial assets at FVTPL is recognised when the profit or loss on initial recognition): Company’s right to receive dividends is established. • the asset is held within a business model whose objective is to hold assets in order to collect Investments in equity instruments: contractual cash flows; and The Company carries certain equity instruments • the contractual terms of the instrument give rise which are not held for trading. At initial recognition, on specified dates to cash flows that are solely the Company may make an irrevocable election payment of principal and interest on the principal to present subsequent changes in the fair value amount outstanding. of an investment in an equity instrument in other comprehensive income (FVTOCI) or through Financial instruments measured at fair value statement of profit and loss (FVTPL). For investments through other comprehensive income (“FVTOCI”): designated to be classified as FVTOCI, movements Debt instruments that meet the following criteria are in fair value of investments are recognised in other measured at FVTOCI (except for debt instruments comprehensive income and the gain or loss is that are designated at fair value through profit or loss not transferred to statement of profit and loss on on initial recognition): disposal of investments. For investments designated to be classified as FVTPL, both movements in fair • the asset is held within a business model value of investments and gain or loss on disposal whose objective is achieved both by collecting of investments are recognised in the statement of contractual cash flows and selling the financial profit and loss. asset; and Dividends from these investments are recognised in • the contractual terms of the instrument give rise the statement of profit and loss when the Company’s on specified dates to cash flows that are solely right to receive dividends is established. payment of principal and interest on the principal amount outstanding. When the investment in equity instruments is derecognised, the cumulative gain or loss in Interest income is recognised in statement of other comprehensive income is transferred to profit and loss for FVTOCI debt instruments. Other retained earnings. changes in fair value of FVTOCI financial assets are recognised in other comprehensive income. Investments in subsidiaries: When the investment is disposed of, the cumulative gain or loss previously accumulated in reserves is Investment in equity instruments of subsidiaries are transferred to statement of profit and loss. measured at cost less impairment. Investment in redeemable preference shares Financial instruments measured at fair value of subsidiaries are measured at FVTPL. These through profit or loss(“FVTPL”): investments are measured at fair value at the end Instruments that do not meet the amortised cost or of each reporting period, with any gains or losses FVTOCI criteria are measured at FVTPL. Financial arising on re-measurement recognised in statement assets at FVTPL are measured at fair value at the of profit and loss. The gain or loss on disposal is end of each reporting period, with any gains or recognised in statement of profit and loss.


LOGO

216 STATUTORY REPORTS AND FINANCIAL STATEMENTS STANDALONE FINANCIAL STATEMENT UNDER IND AS Notes to the Standalone Financial Statements (I in millions, except share and per share data, unless otherwise stated) C. Other financial assets A. Cash flow hedges Other financial assets are non-derivative financial Changes in the fair value of the derivative assets with fixed or determinable payments hedging instruments designated as a cash flow that are not quoted in an active market. These hedge are recognised in other comprehensive comprise trade receivables, unbilled receivables, income and held in cash flow hedging reserve, finance lease receivables, employee and other net of taxes, a component of equity, to the extent advances and eligible current and non-current that the hedge is effective. To the extent that the assets. They are presented as current assets, hedge is ineffective, changes in fair value are except for those expected to be realised later recognised in the statement of profit and loss and than twelve months after the reporting date reported within foreign exchange gains/(losses), which are presented as non-current assets. All net, within results from operating activities. If the financial assets are initially recognised at fair hedging instrument no longer meets the criteria value and subsequently measured at amortised for hedge accounting, then hedge accounting cost using the effective interest method, less any is discontinued prospectively. If the hedging impairment losses. However, trade receivables instrument expires or is sold, terminated or and unbilled receivables that do not contain a exercised, the cumulative gain or loss on the significant financing component are measured hedging instrument recognised in cash flow at the Transaction Price. hedging reserve till the period the hedge was effective remains in cash flow hedging reserve D. Trade payables and other liabilities until the forecasted transaction occurs. The cumulative gain or loss previously recognised Trade payables and other liabilities are initially in the cash flow hedging reserve is transferred recognised at the transaction price, and to the statement of profit and loss upon the subsequently carried at amortised cost using occurrence of the related forecasted transaction. the effective interest method. For these financial If the forecasted transaction is no longer instruments, the carrying amounts approximate expected to occur, such cumulative balance is fair value due to the short-term maturity of immediately recognised in the statement of profit these instruments. Contingent consideration and loss. recognised in a business combination is initially recognised at fair value and subsequently B. Others measured at fair value through profit or loss. Changes in fair value of foreign currency b) Derivative financial instruments derivative instruments not designated as cash flow hedges are recognised in the statement The Company is exposed to foreign currency of profit and loss and reported within foreign fluctuations on foreign currency assets, liabilities, net exchange gains/(losses), net, within results from 26 investment in foreign operations and forecasted cash—operating activities. 2025 flows denominated in foreign currency. Changes in fair value and gains/(losses), net, The Company limits the effect of foreign exchange rate on settlement of foreign currency derivative REPORT fluctuations by following established risk management instruments relating to borrowings, which have policies including the use of derivatives. The Company not been designated as hedges are recorded in ANNUAL enters into derivative financial instruments where the finance costs. counterparty is primarily a bank. Derivative financial instruments are recognised and c) Derecognition of financial instruments measured at fair value. Attributable transaction costs INTEGRATED The Company derecognises a financial asset when are recognised in the statement of profit and loss as cost. the contractual rights to the cash flows from the WIPRO Subsequent to initial recognition, derivative financial financial asset expire or it transfers the financial asset instruments are measured as described below: and the transfer qualifies for derecognition under Ind


LOGO

217 Notes to the Standalone Financial Statements (I in millions, except share and per share data, unless otherwise stated) AS 109. If the Company retains substantially all the risks be utilised in accordance with the provisions of Section 69 and rewards of a transferred financial asset, the Company of the Companies Act, 2013. Capital redemption reserve continues to recognise the financial asset and recognises amounting to I 13 and I 13 as of March 31, 2026 and 2025, a borrowing for the proceeds received. A financial liability respectively, is not freely available for distribution. (or a part of a financial liability) is derecognised from the Company’s balance sheet when the obligation specified e) Retained earnings in the contract is discharged or cancelled or expires. Retained earnings is comprised of the Company’s (iv) Equity and share capital undistributed earnings after taxes and is freely available for distribution. a) Share capital and securities premium The authorised share capital of the Company as at March f) Common Control Transactions Capital Reserve 31, 2026 is I 25,352 divided into 12,543,500,000 equity The Common Control Transactions Capital Reserve is on shares of I 2 each, 25,000,000 preference shares of account of merger of certain wholly owned subsidiaries I 10 each and 150,000, 10% optionally convertible with the Company during the year ended March 31, 2019. cumulative preference shares of I 100 each. Par value As of March 31, 2026 and 2025, this reserve amounting of the equity shares is recorded as share capital and the to I 2,473 and I 2,473, respectively, is not freely available amount received in excess of par value is classified as for distribution. securities premium. Every holder of equity shares, as reflected in the records g) Share options outstanding account of the Company as at the date of the shareholder meeting shall have one vote in respect of each share held for all The Share options outstanding account is used to matters submitted to vote in the shareholder meeting. record the value of equity-settled share-based payment transactions with employees. The amounts recorded in share options outstanding account are transferred to b) Shares held by controlled trust(Treasury securities premium upon exercise of stock options and shares) restricted stock unit options by employees. The Company’s equity shares held by the controlled trust, which is consolidated as part of the Company are classified h) Special Economic Zone re-investment reserve as treasury shares. The Company has 11,905,480 and The Special Economic Zone (“SEZ”) re-investment 11,905,480 treasury shares as at March 31, 2026 and reserve has been created out of profit of eligible Special 2025, respectively. Treasury shares are recorded at Economic Zone units as per provisions of section 10AA acquisition cost. (1)(ii) of the Income–tax Act, 1961 for acquiring new plant and machinery. The said reserve should be utilised by the c) Capital Reserve Company for acquiring plant and machinery as per the Capital reserve amounting to I 1,139 and I 1,139 as of terms of Section 10AA(2) of the Income-tax Act, 1961. This March 31, 2026 and 2025, respectively, is not freely reserve is not freely available for distribution. available for distribution. i) Others d) Capital Redemption Reserve Changes in the fair value of financial instruments As per the Companies Act, 2013, Capital redemption (debt or equity) measured at fair value through reserve is created when a company purchases its own other comprehensive income is recognised in other shares out of free reserves or securities premium. A sum comprehensive income, net of taxes and presented equal to the nominal value of the shares so purchased is within investment in debt instruments measured at fair transferred to capital redemption reserve. The reserve can value through OCI or investment in equity instruments measured at fair value through OCI.


LOGO

218 STATUTORY REPORTS AND FINANCIAL STATEMENTS STANDALONE FINANCIAL STATEMENT UNDER IND AS Notes to the Standalone Financial Statements (I in millions, except share and per share data, unless otherwise stated) Actuarial gains and losses on remeasurements of to the acquisition of the asset. General and specific the defined benefit plans are recognised in other borrowing costs directly attributable to the construction comprehensive income, net of taxes and presented of a qualifying asset are capitalised as part of the cost within equity in remeasurement of the defined till all the activities necessary to prepare the qualifying benefit plans. asset for its intended use or sale are substantially completed. The cost and related accumulated depreciation are derecognised upon sale or disposition j) Cash flow hedging reserve of the asset and the resultant gains or losses are Changes in fair value of derivative hedging instruments recognised in the statement of profit and loss. designated and effective as a cash flow hedge are Capital work-in-progress are measured at cost less recognised in other comprehensive income, net accumulated impairment losses, if any. of taxes, and presented within equity as cash flow hedging reserve. b) Depreciation k) Foreign currency translation reserve The Company depreciates property, plant and The exchange differences arising from the translation equipment over the estimated useful life on a straight-of financial statements of foreign operations with line basis from the date the assets are available for functional currency other than Indian Rupees is use. Leasehold improvements are amortised over recognised in other comprehensive income, net of the shorter of estimated useful life of the asset or taxes and is presented within equity in the FCTR. the related lease term. Term licenses are amortised over their respective contract term. Freehold land is not depreciated. The estimated useful life of assets l) Dividend is reviewed and where appropriate are adjusted, A final dividend on equity shares is recorded as a annually. The estimated useful lives of assets are liability on the date of approval by the shareholders. An as follows: interim dividend is recorded as a liability on the date of declaration by the Company’s Board of Directors. Category Useful life Buildings 28 to 40 years m) Buy back of equity shares Plant and equipment 5 to 21 years The buyback of equity shares, including tax thereon Computer equipment and software 2 to 7 years and related transaction costs are recorded as a Furniture, fixtures and equipment 5 years reduction of securities premium and retained earnings. Vehicles 4 to 5 years Further, capital redemption reserve is created as an The Company believes that the technically evaluated apportionment from retained earnings. useful lives, different from Schedule II of the 26 Companies Act, 2013, best represents the period over—2025 n) Bonus issue which these assets are expected to be used. For the purpose of bonus issue, the amount is When parts of an item of property, plant and equipment REPORT transferred from capital redemption reserve, securities have different useful lives, they are accounted for as premium and retained earnings to the share capital. separate items (major components) of property, plant and equipment. Subsequent expenditure relating ANNUAL (v) Property, plant and equipment to property, plant and equipment is capitalised only when it is probable that future economic benefits a) Recognition, measurement and derecognition associated with these will flow to the Company and INTEGRATED Property, plant and equipment are measured at cost the cost of the item can be measured reliably. less accumulated depreciation and impairment losses, Deposits and advances paid towards the acquisition WIPRO if any. Cost includes expenditures directly attributable of property, plant and equipment outstanding as at


LOGO

219 Notes to the Standalone Financial Statements (I in millions, except share and per share data, unless otherwise stated) each reporting date is classified as capital advances under b) Goodwill other non-current assets and the cost of property, plant and equipment not available for use before such date are The excess of the cost of an acquisition over the Company’s disclosed under capital work-in-progress. share in the fair value of the acquiree’s identifiable assets and liabilities is recognised as goodwill. If the excess is negative, a bargain purchase gain is recognised in equity (vi) Business combinations, Goodwill and as capital reserve. Goodwill is measured at cost less Intangible assets accumulated impairment (if any). a) Business combinations Goodwill associated with disposal of an operation that is part of a cash-generating unit is measured based on Business combinations are accounted for using the the relative values of the operation disposed of and the purchase (acquisition) method. The cost of an acquisition portion of the cash-generating unit retained, unless some is measured as the fair value of the assets transferred, other method better reflects the goodwill associated with liabilities incurred or assumed, and equity instruments the operation disposed of. issued at the date of exchange by the Company. Identifiable assets acquired and liabilities and contingent c) Intangible assets liabilities assumed in a business combination are measured initially at fair value at the date of acquisition. Intangible assets acquired separately are measured Transaction costs incurred in connection with a business at cost of acquisition. Intangible assets acquired in a acquisition are expensed as incurred. business combination are measured at fair value as at the date of acquisition. Following initial recognition, intangible The cost of an acquisition also includes the fair value of assets are carried at cost less accumulated amortisation any contingent consideration measured as at the date and impairment losses, if any. of acquisition. Any subsequent changes to the fair value of contingent consideration classified as liabilities, other The amortisation of an intangible asset with a finite useful than measurement period adjustments, are recognised in life reflects the manner in which the economic benefit is the statement of profit and loss. expected to be generated. The estimated useful life of amortisable intangibles is Common Control business combinations reviewed and where appropriate is adjusted, annually. The Company accounts for business combinations The estimated useful lives of the amortisable intangible involving entities or businesses in which all the combining assets are as follows: entities or businesses are ultimately controlled by the same party or parties both before and after the business Category Useful life combination and where that control is not transitory are Customer-related intangibles 5 to 10 years accounted for as per the pooling of interest method. The Marketing-related intangibles 7 years business combination is accounted for as if it had occurred at the beginning of the earliest comparative period Customer-related intangibles includes customer contracts presented or, if later, at the date that common control was and customer relationships acquired as a part of Business established; for this purpose, comparative periods are combinations. Marketing-related intangibles includes restated. Assets and liabilities acquired are recognised non-compete acquired as a part of Business combinations. at their carrying amounts. The identity of the reserves is preserved, and they appear in the consolidated financial (vii) Leases statements of the Group in the same form in which they appeared in the financial statements of the acquired The Company evaluates each contract or arrangement, entity. The difference, if any, between the consideration whether it qualifies as lease as defined under Ind AS 116. and the amount of share capital of the acquired entity is transferred to capital reserve. The Company as a lessee The Company enters into an arrangement for lease of land, buildings, plant and equipment including computer


LOGO

220 STATUTORY REPORTS AND FINANCIAL STATEMENTS STANDALONE FINANCIAL STATEMENT UNDER IND AS Notes to the Standalone Financial Statements (I in millions, except share and per share data, unless otherwise stated) equipment and vehicles. Such arrangements are The Company applies Ind AS 36 to determine whether generally for a fixed period but may have extension or a RoU asset is impaired and accounts for any identified termination options. The Company assesses whether impairment loss as described in the impairment of a contract is, or contains, a lease at its inception. A non-financial assets below. contract is considered to contain a lease if it conveys For lease liabilities at the commencement of the lease, the right to control the use of an identified asset for a the Company measures the lease liability at the present period of time in exchange for consideration. value of the lease payments that are not paid at that A contract conveys the right to control the use of an date. The lease payments are discounted using the identified asset if the Company has the right to: interest rate implicit in the lease, if that rate is readily determined, if that rate is not readily determined, the a) control use of an identified asset, lease payments are discounted using the incremental b) obtain substantially all the economic benefits borrowing rate that the Company would have to pay from use of the identified asset, and to borrow funds, including the consideration of factors such as the nature of the asset and location, collateral, c) direct the use of the identified asset market terms and conditions, as applicable in a similar The Company determines the lease term as the non- economic environment. cancellable period of a lease, together with periods After the commencement date, the amount of lease covered by an option to extend the lease, where liabilities is increased to reflect the accretion of interest the Company is reasonably certain to exercise that and reduced for the lease payments made. option. The Company makes an assessment on the expected lease term on a lease-by-lease basis and The lease liability is subsequently remeasured by thereby assesses whether it is reasonably certain that increasing the carrying amount to reflect interest on any options to extend or terminate the contract will the lease liability, reducing the carrying amount to be exercised. reflect the lease payments made and remeasuring the carrying amount to reflect any lease modifications. At the commencement of the lease, the Company The Company recognises the amount of the recognises a right of use (“RoU”) asset at cost and re-measurement of lease liability due to modification corresponding lease liability, except for leases with as an adjustment to the RoU asset or in statement term of twelve months or less (“Short-term leases”) of profit and loss, depending upon the nature of and low-value assets. For these Short-term leases and modification. Where the carrying amount of the low-value assets, the Company recognises the lease RoU asset is reduced to zero and there is a further payments as an operating expense on a straight-line reduction in the measurement of the lease liability, basis over the lease term. the Company recognises any remaining amount of the The cost of the RoU assets comprises the amount of re-measurement in the statement of profit and loss. the initial measurement of the lease liability, any lease Payment of lease liabilities including interest are payments made at or before the inception date of the 26—classified as cash used in financing activities in the lease, plus any initial direct costs, plus an estimate of statement of cash flows. 2025 costs to be incurred by the lessee in dismantling and removing the underlying asset or restoring the site on REPORT which it is located less any lease incentives received. The Company as a lessor Subsequently, the RoU assets are measured at cost Leases under which the Company is a lessor are less any accumulated depreciation and accumulated ANNUAL classified as a finance or operating lease. Lease impairment losses, if any. The RoU assets are contracts where all the risks and rewards are depreciated using the straight-line method from the substantially transferred to the lessee are classified commencement date over the shorter of lease term as a finance lease. All other leases are classified as INTEGRATED or useful life of RoU assets. The estimated useful lives operating lease. of RoU assets are determined on the same basis as WIPRO those of property, plant and equipment.


LOGO

221 Notes to the Standalone Financial Statements (I in millions, except share and per share data, unless otherwise stated) For leases under which the Company is an intermediate such investment is the higher of its fair value less cost of lessor, the Company accounts for the head-lease and the disposal (“FVLCD”) and its value-in-use (“VIU”). The VIU sub-lease as two separate contracts. The sub-lease is of the investment is calculated using projected future cash further classified either as a finance lease or an operating flows. If the recoverable amount of the investment is less lease by reference to the RoU asset arising from the than its carrying amount, the carrying amount is reduced head-lease. to its recoverable amount. The reduction is treated as an impairment loss and is recognised in the statement of (viii) Inventories profit and loss. Inventories are valued at lower of cost and net realisable C) Non-financial assets value, including necessary provision for obsolescence. Cost is determined using the weighted average method. The Company assesses long-lived assets such as property, plant and equipment, RoU assets and intangible assets for (ix) Impairment impairment whenever events or changes in circumstances indicate that the carrying amount of an asset or group of A) Financial assets assets may not be recoverable. If any such indication exists, the Company estimates the recoverable amount The Company applies the expected credit loss model for of the asset or group of assets. recognising impairment loss on financial assets measured at amortised cost, debt instruments classified as FVTOCI, Goodwill is tested for impairment at least annually at trade receivables, unbilled receivables, finance lease the same time and when events occur or changes in receivables and other financial assets. Expected credit circumstances indicate that the recoverable amount of the loss is the difference between the contractual cash flows cash generating unit is less than its carrying value. The and the cash flows that the entity expects to receive goodwill impairment test is performed at the level of cash-discounted using the effective interest rate. generating unit or groups of cash-generating units which represents the lowest level at which goodwill is monitored Loss allowances for trade receivables, unbilled receivables for internal management purposes. and finance lease receivables are measured at an amount equal to lifetime expected credit loss. Lifetime expected The recoverable amount of an asset or cash generating credit losses are the expected credit losses that result unit is the higher of its FVLCD and its VIU. The VIU of from all possible default events over the expected life long-lived assets is calculated using projected future of a financial instrument. Lifetime expected credit loss is cash flows. FVLCD of a cash generating unit is computed computed based on a provision matrix which takes into using turnover and earnings multiples. If the recoverable account, risk profiling of customers and historical credit amount of the asset or the recoverable amount of the loss experience adjusted for forward-looking information. cash generating unit to which the asset belongs is less For other financial assets, expected credit loss is measured than its carrying amount, the carrying amount is reduced at the amount equal to twelve months expected credit loss to its recoverable amount. The reduction is treated as an unless there has been a significant increase in credit risk impairment loss and is recognised in the statement of from initial recognition, in which case those are measured profit and loss. at lifetime expected credit loss. If at the reporting date, there is an indication that a previously assessed impairment loss on property, plant B) Impairment of Investment in subsidiaries and equipment, RoU assets and intangible assets, no The Company assesses investments in subsidiaries for longer exists, the recoverable amount is reassessed and impairment whenever events or changes in circumstances the impairment losses previously recognised are reversed indicate that the carrying amount of the investment such that the asset is recognised at its recoverable amount may not be recoverable. If any such indication exists, but not exceeding written down value which would have the Company estimates the recoverable amount of the been reported if the impairment losses had not been investment in subsidiary. The recoverable amount of recognised initially. An impairment loss in respect of goodwill is not reversed subsequently.


LOGO

222 STATUTORY REPORTS AND FINANCIAL STATEMENTS STANDALONE FINANCIAL STATEMENT UNDER IND AS Notes to the Standalone Financial Statements (I in millions, except share and per share data, unless otherwise stated) (x) Employee benefits contributions to the approved provident fund trust managed by the Company. A portion a) Post-employment plans of the employer’s contribution is made to the government administered pension fund. The Company participates in various employee The contributions to the provident fund trust benefit plans. Pensions and other post-employment managed by the Company is accounted for as benefits are classified as either defined contribution a defined benefit plan as the Company is liable plans or defined benefit plans. Under a defined for any shortfall in the fund assets based on the contribution plan, the Company’s sole obligation is to government specified minimum rates of return. pay a fixed amount with no obligation to pay further Certain employees receive benefits under the contributions if the fund does not hold sufficient assets provident fund plan in which both the employer to pay all employee benefits. The related actuarial and employees make periodic contributions to and investment risks are borne by the employee. the government administered provident fund. A The expenditure for defined contribution plans is portion of the employer’s contribution is made recognised as an expense during the period when the to the government administered pension fund. employee provides service. Under a defined benefit This is accounted as a defined contribution plan plan, it is the Company’s obligation to provide agreed as the obligation of the Company is limited to the benefits to the employees. The related actuarial and contributions made to the fund. investment risks are borne by the Company. The present value of the defined benefit obligations is calculated by an independent actuary using the B. Gratuity and foreign pension projected unit credit method. In accordance with the Code on Social Security, Remeasurements of the defined benefit plans, 2020, applicable for Indian companies, the comprising actuarial gains or losses, the effect of Company provides for a lump sum payment to changes to the asset ceiling, and the return on plan eligible employees, at retirement or termination assets (excluding interest) are immediately recognised of employment based on the last drawn salary in other comprehensive income, net of taxes and not and years of employment with the Company. reclassified to profit or loss in subsequent period. The gratuity fund is managed by the third-party fund managers. Net interest recognised in profit or loss is calculated by applying the discount rate used to measure the The Company also maintains pension and similar defined benefit obligation to the net defined benefit plans for employees outside India, based on liability or asset. The actual return on the plan assets country specific regulations. These plans are above or below the discount rate is recognised as partially funded, and the funds are managed by part of remeasurements of the defined benefit plans third party fund managers. The plans provide for through other comprehensive income, net of taxes. monthly payout after retirement as per salary drawn and service period or for a lump sum—26 Past service cost, both vested and unvested, is payment as set out in rules of each fund. 2025 recognised as an expense at the earlier of (a) when the plan amendment or curtailment occurs; and (b) when The Company’s obligations in respect of these REPORT the entity recognises related restructuring costs or plans, which are defined benefit plans, are termination benefits. provided for based on actuarial valuation using the projected unit credit method. ANNUAL The Company has the following employee benefit plans: C. Superannuation A. Providentfund Superannuation plan, a defined contribution INTEGRATED scheme is administered by third party fund Eligible employees receive benefits under the managers. The Company makes annual Company’s provident fund plan, into which both contributions based on a specified percentage WIPRO the employer and employees make periodic of each eligible employee’s salary.


LOGO

223 Notes to the Standalone Financial Statements (I in millions, except share and per share data, unless otherwise stated) b) Termination benefits intrinsic value on the date of grant approximates the fair value. The expense is recognised in the statement of Termination benefits are expensed when the profit and loss with a corresponding increase to the share Company can no longer withdraw the offer of options outstanding account, a component of equity. those benefits. The equity instruments or cash settled instruments generally vest in a graded manner over the vesting period. c) Short-term benefits The fair value determined at the grant date is expensed Short-term employee benefit obligations such as over the vesting period of the respective tranches of such cash bonus, management incentive plans or profit grants (accelerated amortisation). The stock compensation sharing plans are measured on an undiscounted expense is determined based on the Company’s estimate basis and are recorded as expense as the related of equity instruments or cash settled instruments that will service is provided. A liability is recognised for eventually vest. the amount expected to be paid under short-term Cash settled instruments granted are re-measured by cash bonus, management incentive plans or profit-reference to the fair value at the end of each reporting sharing plans, if the Company has a present legal or period and at the time of vesting. The expense is constructive obligation to pay this amount as a result recognised in the statement of profit and loss with a of past service provided by the employee and the corresponding increase to the financial liability. obligation can be estimated reliably. d) Compensated absences (xii) Provisions The employees of the Company are entitled to Provisions are recognised when the Company has a compensated absences. The employees can carry present obligation (legal or constructive), as a result of forward a portion of the unutilised accumulating a past event, it is probable that an outflow of economic compensated absences and utilise it in future benefits will be required to settle the obligation and periods or receive cash at retirement or termination a reliable estimate can be made of the amount of of employment. The Company records an obligation the obligation. for compensated absences in the period in which the The amount recognised as a provision is the best estimate employee renders the services that increases this of the consideration required to settle the present entitlement. The Company measures the expected obligation at the end of the reporting period, considering cost of compensated absences as the additional the risks and uncertainties surrounding the obligation. amount that the Company expects to pay as a result of the unused entitlement that has accumulated When some or all of the economic benefits required to at the end of the reporting period. The Company settle a provision are expected to be recovered from a recognises accumulated compensated absences third party, the receivable is recognised as an asset, if it is based on actuarial valuation using the projected virtually certain that reimbursement will be received and unit credit method. Non-accumulating compensated the amount of the receivable can be measured reliably. absences are recognised in the period in which the Provisions for onerous contracts are recognised when the absences occur. expected benefits to be derived by the Company from a contract are lower than the unavoidable costs of meeting (xi) Share-based payment transactions the future obligations under the contract. Provisions for onerous contracts are measured at the present value of Selected employees of the Company receive remuneration lower of the expected net cost of fulfilling the contract and in the form of equity settled instruments or cash settled the expected cost of terminating the contract. instruments, for rendering services over a defined vesting period and for Company’s performance-based stock options over the defined period. Equity instruments (xiii) Revenue granted are measured by reference to the fair value of The Company derives revenue primarily from software the instrument at the date of grant. In cases, where equity development, maintenance of software/hardware and instruments are granted at a nominal exercise price, the


LOGO

224 STATUTORY REPORTS AND FINANCIAL STATEMENTS STANDALONE FINANCIAL STATEMENT UNDER IND AS Notes to the Standalone Financial Statements (I in millions, except share and per share data, unless otherwise stated) related services, consulting services, business to measure progress towards completion requires process services and sale of IT products. judgement and is based on the nature of the promised products or services to be provided. Revenues from customer contracts are considered for recognition and measurement when the contract The method for recognising revenues and costs has been approved by the parties to the contract, the depends on the nature of contracts with customers parties to contract are committed to perform their as given below: respective obligations under the contract, and the contract is legally enforceable. Revenue is recognised A. Time and materials contracts upon transfer of control of promised products or services to customers in an amount that reflects the Revenues and costs relating to time and materials consideration the Company expects to receive (the contracts are recognised as the related services “Transaction Price”). Revenue towards satisfaction of are rendered. the performance obligation is measured at the amount of the Transaction Price (net of variable consideration B. Fixed-price contracts on account of discounts and allowances) allocated to that performance obligation. To recognise revenues, i) Fixed-price development contracts the Company applies the following five step approach: Revenues from fixed-price development (1) identify the contract with a customer, (2) identify the contracts, including software development, and performance obligations in the contract, (3) determine integration contracts, where the performance the Transaction Price, (4) allocate the Transaction obligations are satisfied over time, are recognised Price to the performance obligations in the contract, using the “percentage-of-completion” method. and (5) recognise revenues when a performance The performance obligations are satisfied as obligation is satisfied. When there is uncertainty as to and when the services are rendered since the collectability, revenue recognition is postponed until customer generally obtains control of the work such uncertainty is resolved. as it progresses. Percentage of completion is At contract inception, the Company assesses its determined based on project costs incurred to promise to transfer products or services to a customer date as a percentage of total estimated project to identify separate performance obligations. The costs required to complete the project. The Company applies judgement to determine whether cost expended (or input) method has been each product or service promised to a customer used to measure progress towards completion is capable of being distinct, and are distinct in the as there is a direct relationship between input context of the contract, if not, the promised products and productivity. This method is followed or services are combined and accounted as a single when reasonably dependable estimates of performance obligation. The Company allocates the revenues and costs applicable to various the Transaction Price to separately identifiable elements of the contract can be made. Key factors performance obligations based on their relative stand- that are reviewed in estimating the future costs - 26 2025 alone selling price or residual method. Stand-alone to complete include estimates of future labor selling prices are determined based on sale prices costs and productivity efficiencies. Because the for the components when they are regularly sold financial reporting of these contracts depends on REPORT estimates that are assessed continually during separately, in cases where the Company is unable to the term of these contracts, revenue recognised, determine the stand-alone selling price, the Company ANNUAL uses third-party prices for similar deliverables or the profit and timing of revenue for remaining Company uses expected cost-plus margin approach performance obligations are subject to revisions in estimating the stand-alone selling price. as the contract progresses to completion. If the For performance obligations where control is Company is not able to reasonably measure the INTEGRATED progress of completion, revenue is recognised transferred over time, revenues are recognised only to the extent of costs incurred for which WIPRO by measuring progress towards completion of the recoverability is probable. When total cost performance obligation. The selection of the method


LOGO

225 Notes to the Standalone Financial Statements (I in millions, except share and per share data, unless otherwise stated) estimates exceed revenues in an arrangement, the C. Products estimated losses are recognised in the statement of profit and loss in the period in which such losses Revenue on product sales are recognised when the become probable based on the current contract customer obtains control of the specified product. estimates as an onerous contract provision. D. Others A contract asset is a right to consideration that is conditional upon factors other than the passage • Any change in scope or price is considered as a contract of time. Contract assets primarily relate to unbilled modification. The Company accounts for modifications amounts on fixed-price development contracts to existing contracts by assessing whether the services and are classified as non-financial asset as the added are distinct and whether the pricing is at the contractual right to consideration is dependent on stand-alone selling price. Services added that are completion of contractual milestones. not distinct are accounted for on a cumulative catch up basis, while those that are distinct are accounted A contract liability is an entity’s obligation to transfer for prospectively, either as a separate contract if the goods or services to a customer for which the entity additional services are priced at the stand-alone selling has received consideration (or the amount is due) price, or as a termination of the existing contract and from the customer. creation of a new contract if not priced at the stand- ii) Maintenance contracts alone selling price. • The Company accounts for variable considerations Revenues related to fixed-price maintenance like, volume discounts, rebates and pricing incentives contracts are recognised on a straight-line basis to customers and penalties as reduction of revenue on when services are performed through an indefinite a systematic and rational basis over the period of the number of repetitive acts over a specified period contract. The Company estimates an amount of such or ratably using percentage of completion method variable consideration using expected value method when the pattern of benefits from the services or the single most likely amount in a range of possible rendered to the customers and the cost to fulfil the consideration depending on which method better contract is not even through the period of contract predicts the amount of consideration to which the because the services are generally discrete in nature Company may be entitled and when it is probable that and not repetitive. a significant reversal of cumulative revenue recognised Revenue for contracts in which the invoicing is will not occur when the uncertainty associated with the representative of the value being delivered is variable consideration is resolved. recognised based on our right to invoice. If our • Revenues are shown net of allowances/returns, sales invoicing is not consistent with value delivered, tax, value added tax, goods and services tax and revenues are recognised as the service is performed applicable discounts. using the percentage of completion method. • The Company may enter into arrangements with third In certain projects, a fixed quantum of service or party suppliers to resell products or services. In such output units is agreed at a fixed price for a fixed cases, the Company evaluates whether the Company term. In such contracts, revenue is recognised with is the principal (i.e. report revenues on a gross basis) respect to the actual output achieved till date as a or agent (i.e. report revenues on a net basis). In doing percentage of total contractual output. Any residual so, the Company first evaluates whether the Company service unutilised by the customer is recognised as controls the good or service before it is transferred to revenue on completion of the term. the customer. The Company considers whether it has iii) Element or Volume based contracts the primary obligation to fulfil the contract, inventory risk, pricing discretion and other factors to determine Revenues and costs are recognised as the related whether it controls the goods or services and therefore, services are rendered. is acting as a principal or an agent. If the Company controls the good or service before it is transferred to


LOGO

226 STATUTORY REPORTS AND FINANCIAL STATEMENTS STANDALONE FINANCIAL STATEMENT UNDER IND AS Notes to the Standalone Financial Statements (I in millions, except share and per share data, unless otherwise stated) the customer, the Company is the principal; if not, (xiv) Finance costs the Company is the agent. Finance costs comprise interest on borrowings, interest • Estimates of the Transaction Price and total costs or on lease liabilities, interest on tax matters, interest on efforts are continuously monitored over the term of net defined benefit liability, net loss on translation or the contract and are recognised in net profit in the settlement of foreign currency borrowings, changes period when these estimates change or when the in fair value of derivative instruments and gains/ estimates are revised. Revenues and the estimated (losses) of settlement of borrowing related derivative total costs or efforts are subject to revision as the instruments. Borrowing costs that are not directly contract progresses. attributable to a qualifying asset are recognised in • The Company accrues the estimated cost of the statement of profit and loss using the effective warranties at the time when the revenue is interest method. recognised. The accruals are based on the Company’s historical experience of material usage (xv) Finance and other income and service delivery costs. Finance and other income comprises interest income • Incremental costs that relate directly to a contract on deposits, dividend income, gains/(losses) on and incurred in securing a contract with a customer disposal of investments, gains/(losses) on investments are recognised as an asset when the Company classified as FVTPL, net gain on translation or expects to recover these costs. settlement of foreign currency borrowings, changes in fair value and gains/(losses) on settlement of related • The Company recognises contract fulfilment cost derivative instruments and net gains/(losses) on sale as an asset if those costs specifically relate to a of property, plant and equipment. Interest income contract or to an anticipated contract, the costs is recognised using the effective interest method. generate or enhance resources that will be used in Dividend income is recognised when the right to satisfying performance obligations in future; and receive payment is established. the costs are expected to be recovered. • Costs to obtain contracts relating to upfront (xvi) Income tax payments to customers are amortised to revenue and other costs to obtain contracts and costs to fulfil Income tax comprises current and deferred tax. contracts are amortised to cost over the respective Income tax expense is recognised in the statement contract life on a systematic basis consistent with of profit and loss except to the extent it relates to the transfer of goods or services to customer to a business combination, or items directly recognised which the asset relates. in equity or in other comprehensive income. • The Company assesses the timing of the transfer a) Current income tax of goods or services to the customer as compared - 26 to the timing of payments to determine whether Current income tax for the current and prior periods 2025 a significant financing component exists. As a are measured at the amount expected to be recovered practical expedient, the Company does not assess from or paid to the taxation authorities based on the REPORT the existence of a significant financing component taxable income for the period. The tax rates and tax when the difference between payment and transfer laws used to compute the current tax amounts are of deliverables is twelve months or less. If the those that are enacted or substantively enacted as ANNUAL difference in timing arises for reasons other than at the reporting date and applicable for the period. the provision of finance to either the customer or While determining the tax provisions, the Company us, no financing component is deemed to exist. assesses whether each uncertain tax position is to be considered separately or together with one or more INTEGRATED • Unbilled receivables are classified as a financial asset where the right to consideration is uncertain tax positions depending upon the nature and circumstances of each uncertain tax position. unconditional and only the passage of time is WIPRO The Company offsets current tax assets and current required before the payment is due.


LOGO

227 Notes to the Standalone Financial Statements (I in millions, except share and per share data, unless otherwise stated) tax liabilities, where it has a legally enforceable right to entities where there is a right and an intention to settle set off the recognised amounts and where it intends the current tax liabilities and assets on a net basis or their either to settle on a net basis, or to realise the asset and tax assets and liabilities will be realised simultaneously. liability simultaneously. (xvii) Earnings per share b) Deferred income tax Basic earnings per share is computed using the weighted Deferred income tax is recognised using the balance average number of equity shares outstanding during sheet approach. Deferred income tax assets and liabilities the period adjusted for treasury shares held. Diluted are recognised for deductible and taxable temporary earnings per share is computed using the weighted-differences arising between the tax base of assets and average number of equity and dilutive equivalent shares liabilities and their carrying amount in these standalone outstanding during the period, using the treasury stock financial statements, except when the deferred income tax method for options, except where the results would be arises from the initial recognition of goodwill or an asset or anti-dilutive. liability in a transaction that is not a business combination The number of equity shares and potentially dilutive and affects neither accounting nor taxable profits or loss equity shares are adjusted retrospectively for all periods at the time of the transaction. presented for any splits and bonus shares issues including Deferred income tax assets are recognised to the extent for change effected prior to the approval of the standalone it is probable that taxable profit will be available against financial statements by the Company’s Board of Directors. which the deductible temporary differences and the carry forward of unused tax credits and unused tax losses can (xviii) Statement of cash flows be utilised. Cash flows are reported using the indirect method, Deferred income tax liabilities are recognised for all whereby profit for the period is adjusted for the effects taxable temporary differences except in respect of taxable of transactions of a non-cash nature, any deferrals or temporary differences that is expected to reverse within accruals of past or future operating cash receipts or the tax holiday period, taxable temporary differences payments and item of income or expenses associated associated with investments in subsidiaries, associates with investing or financing cash flows. The cash generated and foreign branches where the timing of the reversal from/(used in) operating, investing and financing activities of the temporary difference can be controlled and it is of the Company are segregated. probable that the temporary difference will not reverse in the foreseeable future. New Accounting standards, amendments The carrying amount of deferred income tax assets is and interpretations adopted by the Company reviewed at each reporting date and reduced to the extent effectivefromApril1,2025: that it is no longer probable that sufficient taxable profit will be available to allow all or part of the deferred income AmendmentstoIndAS21 –The effects of changes in tax asset to be utilised. Foreign exchange rates Deferred income tax assets and liabilities are measured The amendment clarifies how an entity should assess at the tax rates that are expected to apply in the period whether a currency is exchangeable and how it should when the asset is realised or the liability is settled, based determine a spot exchange rate when exchangeability is on tax rates (and tax laws) that have been enacted or lacking, as well as require the disclosure of information substantively enacted at the reporting date. that enables users of financial statements to understand the impact of a currency not being exchangeable. These The Company offsets deferred income tax assets and amendments are effective for annual reporting periods liabilities, where it has a legally enforceable right to offset beginning on or after April 1, 2025. The adoption of these current tax assets against current tax liabilities, and they amendments to Ind AS 21 did not have any material impact relate to taxes levied by the same taxation authority on on the standalone financial statements. either the same taxable entity, or on different taxable


LOGO

228 STATUTORY REPORTS AND FINANCIAL STATEMENTS STANDALONE FINANCIAL STATEMENT UNDER IND AS Notes to the Standalone Financial Statements (I in millions, except share and per share data, unless otherwise stated) AmendmentstoIndAS1 –Presentation of Financial and are to be applied retrospectively. The adoption statements of these amendments to Ind AS 7 and Ind AS 107 did not have any material impact on the standalone On August 13, 2025, the MCA has issued “Classification financial statements. of liabilities as current or non-current and non-current liabilities with covenants (Amendments to Ind AS Amendments to Ind AS 12 – Income taxes 1)” The amendments aim to promote consistency in applying the requirements by helping companies On August 13, 2025, the MCA issued International Tax to determine whether, in the statement of financial Reform—Pillar Two Model Rules—Amendments to Ind position, debt and other liabilities with an uncertain AS 12 “Income Taxes” to clarify the application of Ind settlement date should be classified as current (due AS 12 to income taxes arising from tax law enacted or or potentially due to be settled within one year) or substantively enacted to implement the Organisation non-current. The amendments also clarified the for Economic Co-operation and Development (OECD), classification requirements for debt a company might including tax law that implements qualified domestic settle by converting it into equity. These amendments minimum top-up taxes described in those rules. are effective for annual reporting periods beginning The Company has applied the temporary exception on or after April 1, 2025, and are to be applied from the accounting requirements for deferred retrospectively. The adoption of these amendments taxes in Ind AS 12. Accordingly, the Company to Ind AS 1 did not have any material impact on the neither recognised, nor disclosed information about standalone financial statements. deferred tax assets and liabilities related to Pillar Two income taxes. AmendmentstoIndAS7 -Statement of cashflows andindAS107-Financialinstruments New accounting standards, amendments and On August 13, 2025, MCA issued ‘Supplier Finance interpretations not yet adopted by the company: Arrangements (Amendments to Ind AS 7 and Ind AS Ministry of Corporate Affairs (“MCA”) notifies new 107)’, that require companies to disclose information standards or amendments to the existing standards about its supplier finance arrangements that enables under Companies (Indian Accounting Standards) Rules users of financial statements to assess the effects of as issued from time to time. For the year ended March those arrangements on the companies liabilities and 31, 2026, MCA has not notified any new standards or cash flows and on the companies exposure to liquidity amendments to the existing standards applicable to risk. These amendments are effective for annual the Company. reporting periods beginning on or after April 1, 2025 - 26 2025 REPORT ANNUAL INTEGRATED WIPRO 


LOGO

229 Notes to the Standalone Financial Statements (I in millions, except share and per share data, unless otherwise stated) 4. PROPERTY, PLANT AND EQUIPMENT Furniture Plant and Office Land Buildings (1) and Vehicles Total equipment equipment fixtures Gross carrying value: AsatApril1,2025 I 4,205 I 48,535 I 74,919 I 17,321 I 6,456 I 22 I 151,458 Additions - 656 6,338 1,524 611 3 9,132 Disposals - (447) (11,616) (1,111) (522) (1) (13,697) As at March 31, 2026 K 4,205 K 48,744 K 69,641 K 17,734 K 6,545 K 24 K146,893 Accumulated depreciation/ impairment: AsatApril1,2025 I - I 11,388 I 53,063 I 11,511 I 4,969 I 10 I 80,941 Depreciation and impairment - 1,340 7,230 2,062 530 4 11,166 Disposals - (330) (11,445) (1,067) (517) (1) (13,360) As at March 31, 2026 I -I 12,398 I 48,848 I 12,506 I 4,982 I 13 I 78,747 Net carrying value as at I 4,205 I 36,346 I 20,793 I 5,228 I 1,563 I 11 I 68,146 March 31, 2026 Gross carrying value: As at April 1, 2024 I 4,211 I 44,274 I 75,559 I 15,969 I 6,090 I 17 I 146,120 Adjustment on account of merger - 162 1,024 103 118 - 1,407 Adjusted balance as at April 1, 2024 I 4,211 I 44,436 I 76,583 I 16,072 I 6,208 I 17 I147,527 Additions - 4,585 8,661 2,746 730 9 16,731 Disposals (6) (486) (10,325) (1,497) (482) (4) (12,800) AsatMarch31,2025 I 4,205 I 48,535 I 74,919 I 17,321 I 6,456 I 22 I151,458 Accumulated depreciation/ impairment: As at April 1, 2024 I -I 10,093 I 53,776 I 10,801 I 4,877 I 10 I 79,557 Adjustment on account of merger - 161 788 97 74 - 1,120 Adjusted balance as at April 1, 2024 I -I 10,254 I 54,564 I 10,898 I 4,951 I 10 I 80,677 Depreciation and impairment - 1,368 8,426 1,913 481 4 12,192 Disposals - (234) (9,927) (1,300) (463) (4) (11,928) AsatMarch31,2025 I - I 11,388 I 53,063 I 11,511 I 4,969 I 10 I 80,941 Net carrying value as at I 4,205 I 37,147 I 21,856 I 5,810 I 1,487 I 12 I 70,517 March31,2025 (1) Including net carrying value of computer equipment and software amounting to I 11,976 and I 12,252 as at March 31, 2026 and 2025, respectively.


LOGO

230 STATUTORY REPORTS AND FINANCIAL STATEMENTS STANDALONE FINANCIAL STATEMENT UNDER IND AS Notes to the Standalone Financial Statements (I in millions, except share and per share data, unless otherwise stated) 5. RIGHT-OF-USEASSETS Category of Right-of-Use asset Plant and Land Buildings Vehicles Total equipment Gross carrying value: AsatApril1,2025 I 1,122 I 19,590 I 3 I—I 20,715 Additions—4,777 — 4,777 Disposals—(3,457) (2)—(3,459) As at March 31, 2026 I 1,122 I 20,910 I 1 I —I 22,033 Accumulated depreciation AsatApril1,2025 I 106 I 7,697 I 3 I—I 7,806 Depreciation 19 2,706 — 2,725 Disposals—(3,002) (2)—(3,004) As at March 31, 2026 I 125 I 7,401 I 1 I—I 7,527 NetcarryingvalueasatMarch31,2026 I 997 I 13,509 I—I—I 14,506 Gross carrying value: As at April 1, 2024 I 1,343 I 9,914 I 106 I 28 I 11,391 Adjustment on account of merger—2,146—1 2,147 Adjusted balance as at April 1, 2024 I 1,343 I 12,060 I 106 I 29 I 13,538 Additions—8,243 — 8,243 Disposals (221) (713) (103) (29) (1,066) AsatMarch31,2025 I 1,122 I 19,590 I 3 I—I 20,715 Accumulated depreciation As at April 1, 2024 I 98 I 4,766 I 86 I 26 I 4,976 Adjustment on account of merger—1,107—1 1,108 Adjusted balance as at April 1, 2024 I 98 I 5,873 I 86 I 27 I 6,084 Depreciation 21 2,486 20 2 2,529 Disposals (13) (662) (103) (29) (807) AsatMarch31,2025 I 106 I 7,697 I 3 I—I 7,806 - 26 NetcarryingvalueasatMarch31,2025 I 1,016 I 11,893 I—I—I 12,909 2025 REPORT The Company recognised the following expenses in the statement of profit and loss: Year ended Year ended ANNUAL March 31, 2026 March 31, 2025 Rent expense recognized under facility expenses pertaining to: Leases of low-value assets I—I -INTEGRATED Short-term leases    3,386    3,730 I 3,386 I 3,730 WIPRO


LOGO

231 Notes to the Standalone Financial Statements (I in millions, except share and per share data, unless otherwise stated) Income from subleasing ROU assets to subsidiaries for the years ended March 31, 2026 and 2025 amounting to I 214 and I 182, respectively. The Company is committed to a lease amounting to I 576 which have not commenced as of March 31, 2026. The term of this lease is 5 years. Payments toward leases of low-value assets and Short-term leases, are disclosed under operating activities in the statement of cash flows. All other lease payments during the period are disclosed under financing activities in the statement of cash flows. Lease liability Year ended Year ended March 31, 2026 March 31, 2025 Balance at the beginning of the year I 15,791 I 10,304 Additions 7,593 9,755 Deletions (554) (54) Finance cost accrued during the period 1,072 875 Payment of lease liabilities (5,754) (5,254) Translation adjustment 1,213 165 Balance at the end of the year I 19,361 I 15,791 Included in the balance sheet as follows: Non-current I 15,213 I 11,978 Current 4,148 3,813 Refer to Note 20 for remaining contractual maturities of lease liabilities. 6. CAPITAL WORK-IN-PROGRESS (“CWIP”) The following table represent ageing of CWIP as on March 31, 2026: Amount in CWIP for a period of Less than More than 1-2years 2-3years Total 1year 3years Projects in progress I 3,322 I 450 I 350 I— I 4,122 Total I 3,322 I 450 I 350 I— I 4,122 The following table represent ageing of CWIP as on March 31, 2025: Amount in CWIP for a period of Less than More than 1-2 years 2-3 years Total 1 year 3 years Projects in progress I 1,426 I 359 I— I— I 1,785 Total I 1,426 I 359 I— I— I 1,785 As on March 31, 2026 and 2025, there are no projects under CWIP whose completion is overdue compared to its original plan. As on March 31, 2026 and 2025, there are no projects under CWIP where the project costs has exceeded as compared to its original plan.


LOGO

232 STATUTORY REPORTS AND FINANCIAL STATEMENTS STANDALONE FINANCIAL STATEMENT UNDER IND AS Notes to the Standalone Financial Statements (I in millions, except share and per share data, unless otherwise stated) 7. GOODWILLANDOTHERINTANGIBLEASSETS The movement in goodwill balance is given below: Year ended Year ended March 31, 2026 March 31, 2025 Balance at the beginning of the year I 6,082 I 4,604 Adjustment on account of merger— 1,478 Adjusted balance at the beginning of the year I 6,082 I 6,082 Additions through Business combination 16 — Balance at the end of the year I 6,098 I 6,082 The Company is organised by two operating segments: IT Services and IT Products. Goodwill of I 6,098 and I 6,082 as at March 31, 2026 and 2025 has been allocated to the IT Services operating segment. Goodwill recognised on business combinations is allocated to Cash Generating Units (“CGUs”), within the IT Services operating segment, which are expected to benefit from the synergies of the acquisitions. As at As at March 31, 2026 March 31, 2025 CGUs Americas 1 I 7 I 7 Americas 2 4,669 4,669 Europe 12 12 Asia Pacific, Middle East and Africa 1,410 1,394 Total I 6,098 I 6,082 For impairment testing, goodwill is allocated to a CGU representing the lowest level within the Company at which goodwill is monitored for internal management purposes, and which is not higher than the Company’s operating segment. Goodwill is tested for impairment at least annually in accordance with the Company’s procedure for determining the recoverable value of each CGU. The recoverable amount of the CGU is determined based on FVLCD. The FVLCD of the CGU is determined based on the market capitalisation approach, using the turnover and earnings multiples derived from observable market data. The fair value measurement is categorised as a level 2 fair value based on the inputs in the valuation techniques used. Based on the above testing, no impairment was identified as at March 31, 2026 and 2025 as the recoverable value 26 of the CGUs exceeded the carrying value. A sensitivity analysis to the change in the key parameters (turnover and - 2025 earnings multiples), did not identify any probable scenarios where the CGU’s recoverable amount would fall below its REPORT carrying amount. ANNUAL INTEGRATED WIPRO


LOGO

233 Notes to the Standalone Financial Statements (I in millions, except share and per share data, unless otherwise stated) The movement in other intangible assets is given below: Other intangible assets Customer-related Marketing-related Total Gross carrying value: AsatApril1,2025 I 2,295 I 32 I 2,327 As at March 31, 2026 I 2,295 I 32 I 2,327 Accumulated amortisation/impairment: AsatApril1,2025 I 1,580 I 26 I 1,606 Amortisation 287 4 291 As at March 31, 2026 I 1,867 I 30 I 1,897 NetcarryingvalueasatMarch31,2026 I 428 I 2 I 430 Gross carrying value: As at April 1, 2024 I 2,295 I 32 I 2,327 AsatMarch31,2025 I 2,295 I 32 I 2,327 Accumulated amortisation/impairment: As at April 1, 2024 I 1,293 I 21 I 1,314 Amortisation 287 5 292 AsatMarch31,2025 I 1,580 I 26 I 1,606 NetcarryingvalueasatMarch31,2025 I 715 I 6 I 721 As at March 31, 2026, the net carrying value and estimated remaining amortisation period for intangible assets acquired on acquisition are as follows: Estimated Net remaining Acquisition carrying amortisation value period Vara Infotech Private Limited I 430 0.50 – 3.50 years Total I 430


LOGO

234 STATUTORY REPORTS AND FINANCIAL STATEMENTS STANDALONE FINANCIAL STATEMENT UNDER IND AS Notes to the Standalone Financial Statements (I in millions, except share and per share data, unless otherwise stated) 8.INVESTMENTS As at As at March 31, 2026 March 31, 2025 Non-current Financial instruments at FVTPL Equity instruments—unquoted(1) I 113 I 56 Fixed maturity plan mutual funds—unquoted— 1,203 Investment in redeemable preference shares of subsidiary (Refer to Note 8.1) 19,706 16,661 Financial instruments at FVTOCI Equity instruments—quoted 36 57 Equity instruments—unquoted 211 212 Financial instruments at amortised cost Inter corporate and term deposits—unquoted(3) 8,574 7,807 Investment in equity instruments of subsidiaries, net of impairment (Refer to Note 8.1) 213,505 178,403 I 242,145 I 204,399 Aggregate amount of quoted investments and aggregate market value thereof I 36 I 57 Aggregate amount of unquoted investments 242,109 204,342 Aggregate amount of impairment in value of investments in subsidiaries (8,350) (9,904) Current Financial instruments at FVTPL Short-term mutual funds—unquoted(2) I 76,594 I 88,625 Fixed maturity plan mutual funds—unquoted 1,281 300 Financial instruments at FVTOCI Non-convertible debentures—quoted 210,328 219,389 Government securities—quoted 8,946 10,650 Commercial papers—quoted 14,227 2,858 Bonds—quoted 10,385 21,138 Financial instruments at amortised cost Inter corporate and term deposits—unquoted(3) 72,959 66,608 I 394,720 I 409,568 26 Aggregate amount of quoted investments and aggregate market value thereof I 243,886 I 254,035 - 2025 Aggregate amount of unquoted investments 150,834 155,533 REPORT Financial instruments at FVTPL I 97,694 I 106,845 Financial instruments at FVTOCI 244,133 254,304 ANNUAL Financial instruments at amortised cost 295,038 252,818 Total Investments I 636,865 I 613,967 (1) Uncalled capital commitments outstanding as at March 31, 2026 and 2025, was I 62 and I 107, respectively. INTEGRATED (2) As at March 31, 2026 and 2025, short-term mutual funds include units placed on lien with bank on account of margin money for currency derivatives amounting to I Nil and I 233, respectively. (3) These deposits earn a fixed rate of interest. As at March 31, 2026 and 2025, term deposits include current deposits in lien with banks, held as margin WIPRO money deposits against guarantees, amounting to I 961 and I 903, respectively.


LOGO

235 Notes to the Standalone Financial Statements (I in millions, except share and per share data, unless otherwise stated) 8.1 Details of non-current investment in unquoted equity instruments and preference shares of subsidiaries (fully paid up) Number of Number of Balances as Balances as Currency of Name of the subsidiary Face Value units as at units as at at March, 31 at March, 31 Investment March 31, 2026 March 31, 2025 2026 2025 Equity Instruments Wipro, LLC (2) U.S.$ Note 1 Note 1 Note 1 I 138,243 I 104,695 Wipro Philippines, Inc. PHP PHP 100 1,889,145 1,889,142 47,298 47,298 Wipro IT Services UK Societas EUR EUR 1 163,617 163,617 18,903 18,903 Wipro Holdings (UK) Limited U.S.$ U.S.$ 1 226,151,974 226,151,974 11,807 11,807 Capco Technologies Private Limited INR I 10 10,000 10,000 2,713 2,713 Wipro Networks Pte Limited SGD SGD 1 28,126,108 28,126,108 1,339 1,339 Wipro Japan KK U.S.$ Note 2 16 16 640 640 Wipro IT Services Bangladesh Limited BDT BDT 10 42,499,990 42,499,990 359 359 Attune Consulting India Private Limited INR I 10 20,000 20,000 122 122 Wipro Chengdu Limited U.S.$ Note 3 Note 3 Note 3 24 24 Wipro Shanghai Limited INR Note 3 Note 3 Note 3 9 9 Aggne Global IT Services Private Limited INR I 10 6,000 6,000 340 340 Wipro, Inc. U.S.$ U.S.$ 0.01 1,000 1,000 51 51 Wipro Japan KK JPY Note 2 650 650 6 6 Wipro Travel Services Limited INR I 10 66,171 66,171 1 1 Wipro Connected Services, Inc.(1) U.S.$ U.S.$ 0.01 1,000 -  ^ -  Sub-total I 221,855 I 188,307 Preference Shares Wipro IT Services UK Societas EUR EUR 100 1,810,000 1,810,000 I 19,706 I 16,661 Sub-total I 19,706 I 16,661 Totalinvestmentinunquotedequityandpreferenceinstrumentsofsubsidiaries I 241,561 I 204,968 Less: Impairment in value of investments in subsidiary Wipro IT Services Bangladesh Limited I    (359) I    (359) Wipro Holdings (UK) Limited (7,937) (9,545) Attune Consulting India Private Limited (54) -  Sub-total I (8,350) I (9,904) Netinvestmentinunquotedequityandpreferenceinstrumentsofsubsidiaries I 233,211 I 195,064 ^ Value is less than I 0.5 (1) Wipro Digital Inc. 100% subsidiary of the Company was reverse merged with Wipro Connected Services, Inc. (Formerly known as Harman Connected Services, Inc.) effective December 1, 2025. (2) During the year ended March 31, 2026, the Company invested I 33,548 in Wipro, LLC, its wholly owned subsidiary. Note 1—As per the local laws of USA, there is no requirement of number of shares and face value thereof for a Limited Liability Company (LLC). Hence the investment by the Company is considered as equity contribution. Note 2—As per the local laws of Japan, the shares do not have face value. Note 3—As per the local laws of People’s Republic of China, there is no requirement of number of shares and face value thereof. Hence the investment by the Company is considered as equity contribution.


LOGO

236 STATUTORY REPORTS AND FINANCIAL STATEMENTS STANDALONE FINANCIAL STATEMENT UNDER IND AS Notes to the Standalone Financial Statements (I in millions, except share and per share data, unless otherwise stated) 9. TRADERECEIVABLES The following table represent ageing of Trade receivables as on March 31, 2026: Outstanding for following periods from due date of payment Less than 6 months More than Not Due 1-2years 2-3years Total 6 months -1year 3years Unsecured—Current Undisputed Trade receivables – considered good I 72,784 I 21,775 I 705 I 171 I 262 I 2,487 I 98,184 Undisputed Trade receivables – credit impaired 772 171 1,665 57 65 431 3,161 Disputed Trade receivables – considered good 5 9—102 53 1,372 1,541 Gross Trade receivables I73,561 I21,955 I 2,370 I 330 I 380 I 4,290 I102,886 Less: Allowance for lifetime expected credit loss (6,270) Net Trade receivables I 96,616 The following table represent ageing of Trade receivables as on March 31, 2025: Outstanding for following periods from due date of payment Less than 6 months More than Not Due 1-2 years 2-3 years Total 6 months—1 year 3 years Unsecured—Current Undisputed Trade receivables – considered good I 56,598 I 18,873 I 2,419 I 971 I 1,775 I 1,664 I 82,300 Undisputed Trade receivables – credit impaired 740 178 13 5 28 511 1,475 Disputed Trade receivables – considered good 1 215 75 93 ^ 1,560 1,944 Disputed Trade receivables – credit impaired — — — 241 241 Gross Trade receivables I 57,339 I 19,266 I 2,507 I 1,069 I 1,803 I 3,976 I 85,960 Less: Allowance for lifetime expected credit loss (5,164) Net Trade receivables I 80,796 ^ Value is less than I 0.5 The activity in the allowance for lifetime expected credit loss is given below: As at As at March 31, 2026 March 31, 2025 Balance at the beginning of the year I 5,164 I 4,578 - 26 Adjustment on account of merger— 70 2025 Adjusted balance at the beginning of the year I 5,164 I 4,648 REPORT Additions, net (Refer to Note 27) 2,729 829 Additons on account of Unbilled receivables (261)— ANNUAL Charged against allowance (1,821) (336) Translation adjustment 459 23 INTEGRATED Balance at the end of the year I 6,270 I 5,164 WIPRO


LOGO

237 Notes to the Standalone Financial Statements (I in millions, except share and per share data, unless otherwise stated) 10. CASH AND CASH EQUIVALENTS As at As at March 31, 2026 March 31, 2025 Balances with banks Current accounts I 22,790 I 18,351 Demand deposits(1) 3,811 25,927 Unclaimed dividend 177 64 Cheques and drafts on hand— ^ I 26,778 I 44,342 ^ Value is less than I 0.5 (1) These deposits can be withdrawn by the Company at any time without prior notice and without any penalty on the principal. 11. OTHER FINANCIAL ASSETS As at As at March 31, 2026 March 31, 2025 Non-current Finance lease receivables I 3,181 I 2,500 Security deposits 1,094 1,013 Dues from officers and employees 16 25 I 4,291 I 3,538 Current Finance lease receivables I 3,062 I 3,382 Security deposits 1,848 1,507 Receivables from redemption of mutual funds 800 — Dues from officers and employees 334 404 Claims receivables 281 136 Interest receivable 243 498 Advance to customers 58 — Other receivables 68 46 I 6,694 I 5,973 I 10,985 I 9,511


LOGO

238 STATUTORY REPORTS AND FINANCIAL STATEMENTS STANDALONE FINANCIAL STATEMENT UNDER IND AS Notes to the Standalone Financial Statements (I in millions, except share and per share data, unless otherwise stated) Finance lease receivables Finance lease receivables consist of assets that are leased for contract terms ranging from 1 to 5 years, with lease payments due in monthly or quarterly installments. Details of finance lease receivables is given below: As at As at March 31, 2026 March 31, 2025 Year 1 I 3,352 I 3,650 Year 2 2,009 1,457 Year 3 1,017 787 Year 4 289 361 Year 5 113 145 Gross investment in lease I 6,780 I 6,400 Less: Unearned finance income (537) (518) Present value of minimum lease payment receivables I 6,243 I 5,882 Included in the balance sheet as follows: Non-current I 3,181 I 2,500 Current 3,062 3,382 12. INVENTORIES As at As at March 31, 2026 March 31, 2025 Stock-in-trade I 465 I 613 Stores and spare parts 3 9 I 468 I 622 13. OTHER ASSETS As at As at March 31, 2026 March 31, 2025 Non-current Unsecured, considered good Capital advances I 441 I 247 - 26 2025 Others Prepaid expenses 2,743 2,015 REPORT Interest receivable from statutory authorities 1,062 1,148 Deferred contract cost Costs to obtain contracts(1) 2,552 1,991 ANNUAL Costs to fulfil contracts(2) 50 73 I 6,848 I 5,474 Current INTEGRATED Unsecured, considered good Advance other than capital advances Advances to suppliers I 1,668 I 1,944 WIPRO Dues from officers and employees 427 420


LOGO

239 Notes to the Standalone Financial Statements (I in millions, except share and per share data, unless otherwise stated) As at As at March 31, 2026 March 31, 2025 Others Prepaid expenses 14,502 12,847 Balance with GST and other authorities 6,766 5,576 Withholding taxes 968 532 Defined benefit plan asset, net 10 26 Deferred contract cost Costs to obtain contracts(1) 1,732 1,035 Costs to fulfil contracts(2) 23 23 Other receivables 46 5 I 26,142 I 22,408 I 32,990 I 27,882 (1) Costs to obtain contracts amortisation of I 1,773 and I 988 during the years ended March 31, 2026 and 2025, respectively. (2) Costs to fulfil contracts amortisation of I 23 and I 8 during the years ended March 31, 2026 and 2025, respectively. 14. EQUITY SHARE CAPITAL As at As at March 31, 2026 March 31, 2025 Authorised capital 12,543,500,000 equity shares, par value of I 2 per share (March 31, 2025: 12,543,500,000 equity I 25,087 I 25,087 shares) 25,000,000 preference shares, par value of I 10 per share (March 31, 2025: 25,000,000 250 250 preference shares) 150,000 10% optionally convertible cumulative preference shares, par value of I 100 per share 15 15 (March 31, 2025: 150,000 10% optionally convertible cumulative preference shares) I 25,352 I 25,352 Issued, subscribed and fully paid-upcapital 10,488,412,458 equity shares of I 2 each (March 31, 2025: 10,472,136,049 equity shares) I 20,977 I 20,944 I 20,977 I 20,944 Terms and rights attached to equity shares The Company has only one class of equity shares having a par value of I 2 per share. Each shareholder of equity shares is entitled to one vote per share. The Company declares and pays dividend in Indian Rupees. The final dividend proposed by the Board of Directors is subject to shareholders approval in the ensuing Annual General Meeting. Following is the summary of per share dividends recognised as distributions to equity shareholders: Year ended Year ended March 31, 2026 March 31, 2025 Interim dividend (Board recommended the adoption of the interim dividend as the final dividend) I 11 per share I 6 per share (Refer to Note 29) In the event of liquidation of the Company, the equity shareholders will be entitled to receive the remaining assets of the Company, after distribution of all preferential amounts, if any, in proportion to the number of equity shares held by the shareholders.


LOGO

240 STATUTORY REPORTS AND FINANCIAL STATEMENTS STANDALONE FINANCIAL STATEMENT UNDER IND AS Notes to the Standalone Financial Statements (I in millions, except share and per share data, unless otherwise stated) i. Reconciliation of number of equity shares Equity shares/American Depository Receipts (ADRs) As at March 31, 2026 As at March 31, 2025 Number of shares I Million Number of shares I Million Balance at the beginning of the year 10,472,136,049 I 20,944 5,225,138,246 I 10,450 Issue of equity shares on exercise of options 16,276,409 33 13,628,596 27 Bonus issue of equity shares (Refer to Note 29) — 5,233,369,207 10,467 Balance at the end of the year 10,488,412,458 I 20,977 10,472,136,049 I 20,944 ii. Reconciliation of number of treasury shares held by controlled trust As at As at Equity shares March 31, 2026 March 31, 2025 Number of shares Number of shares Balance at the beginning of the year 11,905,480 5,952,740 Bonus issue of equity shares (Refer to Note 29)— 5,952,740 Balance at the end of the year 11,905,480 11,905,480 iii. Details of shareholders holding more than 5% of the total equity shares of the company Name of the Shareholder As at March 31, 2026 As at March 31, 2025 Number of shares % held Number of shares % held Mr. Azim Hasham Premji Partner representing 1,886,826,730 17.99 1,767,826,730 16.88 Hasham Traders Mr. Azim Hasham Premji Partner representing 2,160,297,946 20.60 2,041,297,946 19.49 Prazim Traders Mr. Azim Hasham Premji Partner representing 2,202,133,582 21.00 2,081,133,582 19.87 Zash Traders Azim Premji Trust 680,385,966 6.49 1,063,185,966 10.15 iv. Other details of equity shares for a period of five years immediately preceding March 31, 2026 and 2025 - 26 As at As at 2025 March 31, 2026 March 31, 2025 Number of shares Number of shares Aggregate number and class of shares allottedas fully paid up pursuant to REPORT Nil Nil contract(s) without payment being received in cash ANNUAL During the year ended March 31, 2025 5,233,369,207 — Aggregatenumberandclassofsharesallottedasfullypaidupbywayofbonusshares 5,233,369,207— INTEGRATED During the year ended March 31, 2024 269,662,921 269,662,921 During the year ended March 31, 2021 237,500,000 237,500,000 During the year ended March 31, 2020— 323,076,923 WIPRO Aggregate number and class of shares bought back 507,162,921 830,239,844


LOGO

241 Notes to the Standalone Financial Statements (I in millions, except share and per share data, unless otherwise stated) v. Shares reserved for issue under employee stock incentive plans For details of shares reserved for issue under the employee stock incentive plans of the Company, refer to Note 31. vi. Details of Shareholding of Promoter and Promoter Group are as under As at March 31, 2026 As at March 31, 2025 Name of the Promoter and Promoter Group Number of %of total % change Number of % of total % change shares shares during the year shares shares during the year Azim H. Premji 431,156,714 4.11% (0.01)% 431,156,714 4.12% (0.01)% Yasmeen A. Premji 5,118,756 0.05% 0.00% 5,118,756 0.05% (0.00)% Rishad A. Premji 13,537,782 0.13% 0.00% 13,537,782 0.13% 0.00% Tariq A. Premji 13,238,430 0.13% 0.00% 13,238,430 0.13% 0.00% Mr. Azim Hasham Premji Partner 1,886,826,730 17.99% 1.11% 1,767,826,730 16.88% (0.04)% representing Hasham Traders Mr. Azim Hasham Premji Partner 2,160,297,946 20.60% 1.11% 2,041,297,946 19.49% (0.90)% representing Prazim Traders Mr. Azim Hasham Premji Partner 2,202,133,582 21.00% 1.13% 2,081,133,582 19.87% (0.81)% representing Zash Traders Hasham Investment and 2,711,906 0.03% 0.00% 2,711,906 0.03% (0.00)% Trading Co. Pvt. Ltd. Prazim Trading And Investment 193,708,256 1.85% 0.23% 169,908,256 1.62% 1.62% Company Pvt Ltd. Azim Premji Trust(1) 680,385,966 6.49% (3.66)% 1,063,185,966 10.15% (0.02)% Azim Premji Philanthropic Initiatives (2) 27,724,830 0.26% 0.00% 27,724,830 0.26% (0.01)% Private Limited (1) Mr. Azim H Premji disclaims the beneficial ownership of 680,385,966 shares held by Azim Premji Trust. (2) Mr. Azim H Premji also disclaims the beneficial ownership of 27,724,830 shares held by Azim Premji Philanthropic Initiatives Private Limited 15.BORROWINGS As at As at March 31, 2026 March 31, 2025 Current Unsecured Borrowings from banks I 61,500 I 60,500 I 61,500 I 60,500 Short-term borrowings As at As at March 31, 2026 March 31, 2025 Indian Rupee Interest rate Interest rate Indian Rupee Unsecured borrowings from banks I 46,500 T-Bill + Spread 5.20%—5.83% I 50,500 Unsecured borrowings from banks 15,000 Fixed 6.10% 10,000 I 61,500 I 60,500 The principal source of short-term borrowings from banks as at March 31, 2026 primarily consists of lines of credit of approximately I 89,023 from bankers for working capital requirements and other short-term needs. As at March 31, 2026, the Company has


LOGO

242 STATUTORY REPORTS AND FINANCIAL STATEMENTS STANDALONE FINANCIAL STATEMENT UNDER IND AS Notes to the Standalone Financial Statements (I in millions, except share and per share data, unless otherwise stated) unutilised lines of credit aggregating I 27,523. To utilise these unused lines of credit, the Company requires consent of the lender and compliance with certain financial covenants. Significant portion of these lines of credit are revolving credit facilities and floating rate loans, renewable on a periodic basis. Borrowings from banks bear floating rates of interest, referenced to country specific official benchmark interest rates and a spread, determined based on market conditions. Refer to Note 26 for interest expense on borrowings. Cash and non-cash changes in liabilities arising from financing activities: Non-Cash Changes Adjusted Adjustment Net balance as Foreign March April1,2025 on account Cashflow additions on April 1, exchange 31, 2026 ofmerger to lease 2025 movements liabilities Borrowings I 60,500 I—I 60,500 I 1,000 I—I—I 61,500 Lease Liabilities 15,791—15,791 (5,754) 8,111 1,213 19,361 Total I 76,291 I—I 76,291 I (4,754) I 8,111 I 1,213 I 80,861 Adjusted Non-Cash Changes Adjustment balance as Net additions Foreign March April 1, 2024 on account of Cash flow on April 1, to lease exchange 31, 2025 merger 2024 liabilities movements Borrowings I 41,750 I— I 41,750 I 18,750 I— I— I 60,500 Lease Liabilities 9,245 1,059 10,304 (5,254) 10,576 165 15,791 Total I 50,995 I 1,059 I 52,054 I 13,496 I 10,576 I 165 I 76,291 Non fund based The Company has non-fund based revolving credit facilities in various currencies equivalent to I 37,961 and I 39,228 as at March 31, 2026 and 2025, respectively, towards operational requirements that can be used for the issuance of letters of credit and bank guarantees. As at March 31, 2026 and 2025, an amount of I 27,764 and I 28,756, respectively, was unutilised out of these non-fund based facilities. 16. TRADE PAYABLES The following table represent ageing of Trade payables as on March 31, 2026: Outstanding for following periods from due date of payment - 26 Less than 1 More than 3 Unbilled Not Due 1-2years 2-3years Total 2025 year years Non-Current REPORT MSME I—I—I—I—I—I—I - Others 3,719 — ——3,719 I 3,719 I—I—I—I—I—I 3,719 ANNUAL Current MSME I 1,269 I 1,032 I 14 I—I—I—I 2,315 Others 24,426 24,887 8,009 147 55 9 57,533 INTEGRATED Disputed dues—MSME — — —— Disputed dues—Others 143 112 — — 255 I 25,838 I 26,031 I 8,023 I 147 I 55 I 9 I 60,103 WIPRO Total I 29,557 I 26,031 I 8,023 I 147 I 55 I 9 I 63,822


LOGO

243 Notes to the Standalone Financial Statements (I in millions, except share and per share data, unless otherwise stated) The following table represent ageing of Trade payables as on March 31, 2025: Outstanding for following periods from due date of payment Unbilled Not Due Less than 1 1-2 years 2-3 years More than 3 Total year years Current MSME I 781 I 495 I 10 I—I—I—I 1,286 Others 22,879 31,383 11,720 244 41 17 66,284 Disputed dues—MSME — — — -Disputed dues—Others 133 120 — — 253 Total I 23,793 I31,998 I11,730 I 244 I 41 I 17 I 67,823 Dues of micro enterprises and small enterprises The disclosure pursuant to the Micro, Small and Medium Enterprises Development Act, 2006, (MSMED Act) for dues to micro enterprises and small enterprises as at March 31, 2026 and 2025 is as under: As at As at March 31, 2026 March 31, 2025 (a) Principal amount remaining unpaid I 2,315 I 1,286 (b) Interest due thereon remaining unpaid 9 8 (c) Interest paid by the Company in terms of Section 16 of the MSMED Act, along with the 602 248 amount of the payment made to the supplier beyond the appointed day (d) Interest due and payable for the period of delay in making payment (which have been paid but beyond the appointed day during the period) but without adding interest specified under 1 1 the MSMED Act (e) Interest accrued and remaining unpaid 1 1 (f) The amount of further interest remaining due and payable even in the succeeding years, until such date when the interest dues as above are actually paid to the small enterprises, 1 ^ for the purpose of disallowance as a deductible expenditure under section 23. ^ Value is less than I 0.5 This information has been determined to the extent such parties have been identified on the basis of information available with the Company. Relationship with the struck off companies The Company had nil transactions and outstanding balance with struck off companies for the year ended March 31, 2026. Transactions with struck off companies for the year ended March 31, 2025 is as follows: Relationship Transactions for Balance Nature of Name of struck off company with struck off the year ended outstanding as at transaction company March 31, 2025 March 31, 2025 IBIS Marcom Limited Vendor Payables ^ I - ^ Value is less than I 0.5


LOGO

244 STATUTORY REPORTS AND FINANCIAL STATEMENTS STANDALONE FINANCIAL STATEMENT UNDER IND AS Notes to the Standalone Financial Statements (I in millions, except share and per share data, unless otherwise stated) 17.OTHERFINANCIALLIABILITIES As at As at March 31, 2026 March 31, 2025 Non-current Liabilities towards customer contracts I 719 I 1,026 Rent deposit 12 25 I 731 I 1,051 Current Salary payable I 21,374 I 20,003 Liabilities towards customer contracts 721 342 Capital creditors 508 1,195 Rent deposit 477 475 Advance from customers 329 127 Unclaimed dividends 177 64 Interest accrued but not due on borrowing 78 204 Deferred consideration for Business combination 12 12 Other liabilities(1) 5,005 234 I 28,681 I 22,656 I 29,412 I 23,707 (1) Includes liability on non-designated hedges. 18.PROVISIONS As at As at March 31, 2026 March 31, 2025 Non-current Provision for employee benefits Compensated absences I 596 I 498 Defined benefit plans—gratuity and foreign pension 384 1,062 Other employee benefit obligations 852 746 Provision for onerous contracts 6 294 - 26 2,600 I 1,838 I 2025 Current Provision for employee benefits REPORT Compensated absences I 11,656 I 11,676 Other employee benefit obligations 146 118 ANNUAL Provision for onerous contracts 944 1,024 Provision for warranty 214 207 Others 98 142 INTEGRATED I 13,058 I 13,167 WIPRO I 14,896 I 15,767


LOGO

245 Notes to the Standalone Financial Statements (I in millions, except share and per share data, unless otherwise stated) A summary of activity in provision for warranty, provision for onerous contracts and other provisions is as follows: Year ended March 31, 2026 Year ended March 31, 2025 Provision Provision Provision Provision for for for Others Total for Others Total onerous onerous warranty warranty contracts contracts Provision at the beginning of the year I 207 I 1,318 142 I 1,667 I 217 I 1,478 I 155 I 1,850 Adjustment on account of merger — ——80—80 Adjusted balance at the beginning of K207 K1,318 K 142 K1,667 K 217 K 1,558 K 155 K 1,930 the year Additions during the year, net 214 189—403 207 283—490 Utilised/written-back during the year (207) (596) (44) (847) (217) (529) (13) (759) Translation adjustment—39—39—6—6 Provision at the end of the year I 214 I 950 I 98 I 1,262 I 207 I 1,318 I 142 I 1,667 Included in the balance sheet as follows: Non-current portion I—I 6 I—I 6 I—I 294 I—I 294 Current portion 214 944 98 1,256 207 1,024 142 1,373 Provision for warranty represents cost associated with providing sales support services which are accrued at the time of recognition of revenues and are expected to be utilised over a period of 1 year. Provision for onerous contracts is recognised when the expected benefit by the company from a contract are lower than the unavoidable costs of meeting the future obligations under the contract. Other provisions primarily include provisions for compliance related contingencies. The timing of cash outflows in respect of such provision cannot be reasonably determined. 19.OTHERLIABILITIES As at As at March 31, 2026 March 31, 2025 Non-current Statutory and other liabilities I 17,877 I 12,703 I 17,877 I 12,703 Current Statutory and other liabilities I 10,153 I 9,681 Advance from customers 326 356 I 10,479 I 10,037 I 28,356 I 22,740


LOGO

246 STATUTORY REPORTS AND FINANCIAL STATEMENTS STANDALONE FINANCIAL STATEMENT UNDER IND AS Notes to the Standalone Financial Statements (I in millions, except share and per share data, unless otherwise stated) 20. FINANCIAL INSTRUMENTS The carrying value of financial instruments by categories as at March 31, 2026 is as follows: Fair value through other Fair value comprehensive income Amortised through Designated Total cost profit or loss Mandatory upon initial recognition Financial assets Cash and cash equivalents (Refer to Note 10) I—I—I—I 26,778 I 26,778 Investments (Refer to Note 8) Equity Instruments 113—247—360 Fixed maturity plan mutual funds 1,281 ——1,281 Investment in redeemable preference shares of 19,706 ——19,706 subsidiary Investment in equity instruments of ——213,505 213,505 subsidiaries, net of impairment Short-term mutual funds 76,594 ——76,594 Non-convertible debentures—210,328 — 210,328 Government securities—8,946 — 8,946 Commercial papers—14,227 — 14,227 Bonds—10,385 — 10,385 Inter corporate and term deposits ——81,533 81,533 Other financial assets Trade receivables (Refer to Note 9) ——96,616 96,616 Unbilled receivables ——53,212 53,212 Other financial assets (Refer to Note 11) ——10,985 10,985 Derivative assets (Refer to Note 20) 295—593—888 I97,989 I 243,886 I 840 I 482,629 I 825,344 Financial liabilities Trade payables and other financial liabilities Trade payables (Refer to Note 16) I—I—I—I 63,822 I 63,822 Other financial liabilities (Refer to Note 17) ——29,412 29,412 - 26 Borrowings (Refer to Note 15) ——61,500 61,500 2025 Lease liabilities ——19,361 19,361 Derivative liabilities (Refer to Note 20) 637—9,162—9,799 REPORT I 637 I—I 9,162 I 174,095 I 183,894 ANNUAL INTEGRATED WIPRO


LOGO

247 Notes to the Standalone Financial Statements (I in millions, except share and per share data, unless otherwise stated) The carrying value of financial instruments by categories as at March 31, 2025 is as follows: Fair value through other Fair value comprehensive income Amortised through Designated Total cost profit or loss Mandatory upon initial recognition Financial assets Cash and cash equivalents (Refer to Note 10) I—I—I—I 44,342 I 44,342 Investments (Refer to Note 8) Equity Instruments 56—269—325 Fixed maturity plan mutual funds 1,503 ——1,503 Investment in redeemable preference shares of 16,661 ——16,661 subsidiary Investment in equity instruments of subsidiaries, net of ——178,403 178,403 impairment Short-term mutual funds 88,625 ——88,625 Non-convertible debentures—219,389 — 219,389 Government securities—10,650 — 10,650 Commercial papers—2,858 — 2,858 Bonds—21,138 — 21,138 Inter corporate and term deposits ——74,415 74,415 Other financial assets Trade receivables (Refer to Note 9) ——80,796 80,796 Unbilled receivables ——37,436 37,436 Other financial assets (Refer to Note 11) ——9,511 9,511 Derivative assets (Refer to Note 20) 912—666—1,578 I 107,757 I 254,035 I 935 I 424,903 I 787,630 Financial liabilities Trade payables and other financial liabilities Trade payables (Refer to Note 16) I- I- I- I 67,823 I 67,823 Other financial liabilities (Refer to Note 17) ——23,707 23,707 Borrowings (Refer to Note 15) ——60,500 60,500 Lease liabilities ——15,791 15,791 Derivative liabilities (Refer to Note 20) 75—893—968 I 75 I—I 893 I 167,821 I 168,789


LOGO

248 STATUTORY REPORTS AND FINANCIAL STATEMENTS STANDALONE FINANCIAL STATEMENT UNDER IND AS Notes to the Standalone Financial Statements (I in millions, except share and per share data, unless otherwise stated) Offsetting financial assets and financial liabilities The following table contains information on financial assets and financial liabilities subject to offsetting: As at March 31, 2026 As at March 31, 2025 Gross Gross amounts of amounts of Financial assets Gross Net Gross Net recognized recognised amounts amounts amounts amounts financial financial recognised recognised recognised recognised liabilities liabilities setoff set off Trade receivables I 104,755 I (8,139) I 96,616 I 86,977 I (6,181) I 80,796 Unbilled receivables—non-current 7,010—7,010 — -Unbilled receivables—current 47,051 (849) 46,202 39,007 (1,571) 37,436 Other financial assets—non-current 4,291—4,291 3,538—3,538 Other financial assets—current 6,694—6,694 5,973—5,973 I 169,801 I (8,988) I 160,813 I 135,495 I (7,752) I 127,743 As at March 31, 2026 As at March 31, 2025 Gross Gross amounts of amounts of Financial liabilities Gross Net Gross Net recognised recognised amounts amounts amounts amounts financial financial recognised recognised recognised recognised assets set assets set off off Trade payables—non-current I 3,719 I—I 3,719 I—I—I -Trade payables—current 69,091 (8,988) 60,103 75,575 (7,752) 67,823 Other financial liabilities—non-current 731—731 1,051—1,051 Other financial liabilities—current 28,681—28,681 22,656—22,656 I 102,222 I (8,988) I93,234 I99,282 I (7,752) I91,530 For the financial assets and liabilities subject to offsetting or similar arrangements, each agreement between the Company and the counterparty allows for net settlement of the relevant financial assets and liabilities when both elect to settle on a net basis. In the absence of such an election, financial assets and liabilities will be settled on a gross basis and hence are not offset. Fair value - 26 2025 Financial assets and liabilities include cash and cash equivalents, trade receivables, unbilled receivables, finance lease receivables, employee and other advances, loans to subsidiaries, eligible current and non-current assets, borrowings, REPORT lease liabilities, trade payables, and eligible current and non-current liabilities. The fair value of cash and cash equivalents, trade receivables, unbilled receivables, short-term borrowings, lease liabilities, ANNUAL trade payables, other current financial assets and liabilities approximate their carrying amount largely due to the short-term nature of these instruments. Finance lease receivables are periodically evaluated based on individual credit worthiness of customers. Based on this evaluation, the Company records allowance for estimated credit losses on these receivables. As at March 31, 2026, and 2025 the carrying value of such financial assets, net of allowances, and liabilities approximates INTEGRATED the fair value. WIPRO


LOGO

249 Notes to the Standalone Financial Statements (I in millions, except share and per share data, unless otherwise stated) Investments in short-term mutual funds and fixed maturity plan mutual funds, which are classified as FVTPL are measured using net asset values at the reporting date multiplied by the quantity held. Fair value of investments in non-convertible debentures, government securities, commercial papers and bonds classified as FVTOCI is determined based on the indicative quotes of price and yields prevailing in the market at the reporting date. Fair value of investments in equity instruments classified as FVTOCI or FVTPL is determined using market approach primarily based on market multiples method. The fair value of derivative financial instruments is determined based on observable market inputs including currency spot and forward rates, yield curves and currency volatility. Fair value hierarchy The table below analyses financial instruments carried at fair value, by valuation method. The different levels have been defined as follows: Level 1 – Quoted prices (unadjusted) in active markets for identical assets or liabilities. Level 2 – Inputs other than quoted prices included within Level 1 that are observable for the asset or liability, either directly (i.e. as prices) or indirectly (i.e. derived from prices). Level 3 – Inputs for the assets or liabilities that are not based on observable market data (unobservable inputs). There were no transfers between Levels 1, 2 and 3 during the years ended March 31, 2026 and 2025. The following table presents fair value hierarchy of assets and liabilities measured at fair value on a recurring basis: As at March 31, 2026 As at March 31, 2025 Fair value measurements at reporting date Fair value measurements at reporting date Total Level 1 Level 2 Level 3 Total Level 1 Level 2 Level 3 Assets Derivative instruments: Cash flow hedges I 593 I—I 593 I—I 666 I—I 666 I - Others 295—295—912—912 - Investments: Short-term mutual funds 76,594 76,594 — 88,625 88,625 — Fixed maturity plan mutual 1,281—1,281—1,503—1,503 -funds Equity instruments – other 360 36—324 325 57—268 than subsidiaries Redeemable preference 19,706 — 19,706 16,661 — 16,661 shares of subsidiary Non-convertible debentures, government securities, 243,886 8,854 235,032—254,035 10,550 243,485 -commercial papers and bonds Liabilities Derivative instruments: Cash flow hedges I (9,162) I—I (9,162) I—I (893) I—I (893) I - Others (637)—(637)—(75)—(75) -


LOGO

250 STATUTORY REPORTS AND FINANCIAL STATEMENTS STANDALONE FINANCIAL STATEMENT UNDER IND AS Notes to the Standalone Financial Statements (I in millions, except share and per share data, unless otherwise stated) The following methods and assumptions were used to estimate the fair value of the Level 2 financial instruments included in the above table. Financial instrument Method and assumptions Derivative instruments (assets and liabilities) The Company enters into derivative financial instruments with various counterparties, primarily banks with investment grade credit ratings. Derivatives valued using valuation techniques with market observable inputs are mainly interest rate swaps, foreign exchange forward contracts and foreign exchange option contracts. The most frequently applied valuation techniques include forward pricing, swap models and Black Scholes models (for option valuation), using present value calculations. The models incorporate various inputs including the credit quality of counterparties, foreign exchange spot and forward rates, interest rate curves and forward rate curves of the underlying. As at March 31, 2026, the changes in counterparty credit risk had no material effect on the hedge effectiveness assessment for derivatives designated in hedge relationships and other financial instruments recognised at fair value. Investment in non-convertible debentures, Fair value of these instruments is derived based on the indicative quotes of government securities, commercial papers price and yields prevailing in the market as at reporting date. and bonds Investment in Fixed maturity plan mutual funds Fair value of these instruments is derived based on the indicative quotes of price prevailing in the market as at reporting date. The following methods and assumptions were used to estimate the fair value of the Level 3 financial instruments included in the above table. Financial instrument Method and assumptions Investment in equity instruments Fair value of these instruments is determined using market approach primarily based on market multiples method. Investment in redeemable preference Fair value is determined using discounted cash flow method. shares of subsidiary The following table presents changes in Level 3 assets and liabilities for the years ended March 31, 2026 and 2025: As at As at March 31, 2026 March 31, 2025 Investment in equity instruments-other than subsidiaries Balance at the beginning of the year I 268 I 193 Additions 68 76 26—Disposals(1) (181) (1) 2025 Gain/(loss) recognised in statement of profit and loss 13 (4) Gain/(loss) recognised in other comprehensive income 156 4 REPORT Balance at the end of the year I 324 I 268 (1) During the year ended March 31, 2026, as a result of an acquisition by another investor, the Company sold its shares of equity instruments in a ANNUAL company at a fair value of I 181 and recognised a cumulative gain of I 161 in other comprehensive income. INTEGRATED WIPRO


LOGO

251 Notes to the Standalone Financial Statements (I in millions, except share and per share data, unless otherwise stated) As at As at March 31, 2026 March 31, 2025 Investment in redeemable preference shares of subsidiary Balance at the beginning of the year I 16,661 I 16,282 Unrealised exchange gain /(loss) 3,045 379 Balance at the end of the year I 19,706 I 16,661 Derivative assets and liabilities: The Company is exposed to currency fluctuations on foreign currency assets/liabilities, forecasted cash flows denominated in foreign currency and net investment in foreign operations. The company is also exposed to interest rate fluctuations on investments in floating rate financial assets and floating rate borrowings. The Company follows established risk management policies, including the use of derivatives to hedge foreign currency assets/liabilities, interest rates, foreign currency forecasted cash flows and net investment in foreign operations. The counterparties in these derivative instruments are primarily banks and the Company considers the risks of non-performance by the counterparty as immaterial. The following table presents the aggregate contracted principal amounts of the Company’s derivative contracts outstanding: (in millions) As at March 31, 2026 As at March 31, 2025 Notional Fair Value Notional Fair Value Designated derivative instruments Sell: Forward contracts U.S.$ 2,413 I (8,211) U.S.$ 1,008 I (608) € 118 I 347 € 46 I 78 £ 66 I 169 £ 43 I 30 AUD 31 I (20) AUD 23 I 79 Buy: Forward contracts U.S.$ 750 I 500 U.S.$—I - Range Forward Option contracts U.S.$ 400 I (1,497) U.S.$ 764 I 333 € 41 I 108 € 36 I (55) £ 41 I 67 £ 43 I (89) AUD 76 I (32) AUD 31 I 5 Non-designated derivative instruments Sell: Forward contracts U.S.$ 675 I (768) U.S.$ 555 I 757 € 237 I 299 € 94 I (27) £ 77 I 179 £ 12 I (14) AUD 47 I 74 AUD 65 I 12 SGD 45 I 55 SGD 34 I 4 ZAR 55 I 8 ZAR 162 I (13) CAD 95 I 47 CAD 142 I 71 SAR 30 I ^ SAR 179 I (4) QAR 5 I ^ QAR 13 I ^ TRY 90 I 1 TRY 90 I 2 NOK 12 I 1 NOK—I -OMR 1 I ^ OMR 2 I ^ JPY 1,220 I 32 JPY 705 I (13)


LOGO

252 STATUTORY REPORTS AND FINANCIAL STATEMENTS STANDALONE FINANCIAL STATEMENT UNDER IND AS Notes to the Standalone Financial Statements (I in millions, except share and per share data, unless otherwise stated) (in millions) As at March 31, 2026 As at March 31, 2025 Notional Fair Value Notional Fair Value DKK—I—DKK 31 I (11) CNH—I—CNH 7 I (1) COP 8,120 I (3) COP 8,120 I 1 MYR 24 I 20 MYR 32 I 1 RON—I—RON 8 I (1) HKD 42 I ^ HKD 39 I ^ TWD 57 I 1 TWD 40 I ^ CHF 6 I 13 CHF 9 I (3) PHP—I—PHP 150 I (4) THB 52 I (2) THB 43 I 2 PLN 8 I 1 PLN 10 I 1 BRL 106 I (18) BRL 17 I (2) Buy: Forward contracts U.S.$ 20 I 15 U.S.$ 18 I (25) € 193 I (162) € 10 I 23 £ 16 I (16) £ 24 I 37 AUD—I—AUD 3 I (2) CAD 20 I (11) CAD 19 I (40) QAR 9 I ^ QAR 4 I ^ CNH 208 I (7) CNH 137 I (1) RON 51 I (12) RON 67 I 11 PLN 76 I (43) PLN 99 I 56 SEK 19 I (7) SEK 34 I 18 BRL 10 I 8 BRL 66 I 18 JPY 347 I (1) JPY 306 I 3 DKK 9 I ^ DKK 9 I (1) THB 30 I (6) THB 178 I (5) CRC 2,300 I (7) CRC 1,871 I ^ PHP 90 I (2) PHP 168 I 2 PEN—I—PEN 5 I ^ LKR 1,693 I (2) LKR 1,100 I (1) CLP 2,900 I (3) CLP 2,900 I (5) 26 BHD 1 I ^ BHD 1 I ^ - 2025 OMR ^ I ^ OMR ^ I ^ HKD—I—HKD 38 I (5) REPORT SGD—I—SGD 2 I (3) MYR 9 I (4) MYR 7 I ^ MXN 178 I (14) MXN 81 I (1) ANNUAL AED 16 I ^ AED—I - SAR 11 I ^ SAR—I - KRW 6,400 I (8) KRW—I - INTEGRATED I(8,911) I 610 ^ Value is less than 0.5 WIPRO


LOGO

253 Notes to the Standalone Financial Statements (I in millions, except share and per share data, unless otherwise stated) The Company determines the existence of an economic relationship between the hedging instrument and the hedged item based on the currency, amount and timing of its forecasted cash flows. Hedge effectiveness is determined at the inception of the hedge relationship, and through periodic prospective effectiveness assessments to ensure that an economic relationship exists between the hedged item and hedging instrument, including whether the hedging instrument is expected to offset changes in cash flows of hedged items. If the hedge ratio for risk management purposes is no longer optimal but the risk management objective remains unchanged and the hedge continues to qualify for hedge accounting, the hedge relationship will be rebalanced by adjusting either the volume of the hedging instrument or the volume of the hedged item so that the hedge ratio aligns with the ratio used for risk management purposes. Any hedge ineffectiveness is calculated and accounted for in the statement of profit and loss at the time of the hedge relationship rebalancing. The following table summarises activity in the cash flow hedging reserve within equity related to all derivative instruments classified as cash flow hedges: As at As at March 31, 2026 March 31, 2025 Balance as at the beginning of the year I (318) I 524 Changes in fair value of effective portion of derivatives (13,467) (1,167) Deferred cancellation gain/(loss), net (776) (91) Net (gain)/loss reclassified to statement of profit and loss on occurrence of hedged (1) 5,216 416 transactions Gain/(loss) on cash flow hedging derivatives, net I (9,027) I (842) Balance as at the end of the year I (9,345) I (318) Deferred tax asset/(liability) thereon 2,226 77 Balance as at the end of the year, net of deferred taxes I (7,119) I (241) (1) Includes net (gain)/loss reclassified to revenue of I 6,093 and I 394 for the years ended March 31, 2026 and 2025, respectively; net (gain)/loss reclassified to employee benefits expense of I (877) and I (51) for the years ended March 31, 2026 and 2025, respectively and net (gain)/loss reclassified to other income of I Nil and I 73 for the years ended March 31, 2026 and 2025, respectively. The related hedge transactions for balance in cash flow hedging reserves as at March 31, 2026 are expected to occur and be reclassified to the statement of profit and loss over a period of 12 months. As at March 31, 2026 and 2025, there were no gains or losses on derivative transactions or portions thereof that have become ineffective as hedges or associated with an underlying exposure that did not occur. Sale of financial assets From time to time, in the normal course of business, the Company transfers accounts receivables, unbilled receivables, net investment in finance lease receivables (financial assets) to banks. Under the terms of the arrangements, the Company either substantially transfers its risks and rewards or surrenders control over the financial assets and transfer is without recourse. Accordingly, on such transfers the financial assets are derecognised and considered as sale of financial assets. Gains and losses on the sale of financial assets without recourse are recorded in finance costs, at the time of sale based on the carrying value of the financial assets and fair value of servicing liability. The incremental impact of such transactions on our cash flow and liquidity for the years ended March 31, 2026 and 2025 is not material.


LOGO

254 STATUTORY REPORTS AND FINANCIAL STATEMENTS STANDALONE FINANCIAL STATEMENT UNDER IND AS Notes to the Standalone Financial Statements (I in millions, except share and per share data, unless otherwise stated) Financial risk management Market Risk Market risk is the risk of loss of future earnings, to fair values or to future cash flows that may result from a change in the price of a financial instrument. The value of a financial instrument may change as a result of changes in the interest rates, foreign currency exchange rates and other market changes that affect market risk sensitive instruments. Market risk is attributable to all market risk sensitive financial instruments including investments, foreign currency receivables, payables and borrowings. The Company’s exposure to market risk is a function of investment and borrowing activities and revenue generating activities in foreign currency. The objective of market risk management is to avoid excessive exposure of the Company’s earnings and equity to losses. Risk Management Procedures The Company manages market risk through a corporate treasury department, which evaluates and exercises independent control over the entire process of market risk management. The corporate treasury department recommends risk management objectives and policies, which are approved by our senior management and the Company’s Audit, Risk and Compliance Committee. The activities of this department include management of cash resources, implementing hedging strategies for foreign currency exposures, borrowing strategies, and ensuring compliance with market risk limits and policies. Foreign currency risk The Company operates internationally, and a major portion of its business is transacted in several currencies. Consequently, the Company is exposed to foreign exchange risk through receiving payment for sales and services in the United States and elsewhere and making purchases from overseas suppliers in various foreign currencies. The exchange rate risk primarily arises from foreign exchange revenue, receivables, cash balances, forecasted cash flows, payables and foreign currency borrowings. A significant portion of the Company’s revenue is in the U.S. Dollars, Pound Sterling, Euro, Indian Rupee, Australian Dollars and Canadian Dollars, while a large portion of costs are in Indian Rupees. The exchange rate between the Indian Rupee and these currencies has fluctuated significantly in recent years and may continue to fluctuate in the future. Appreciation of the Indian Rupee against these currencies can adversely affect the Company’s results of operations. The Company evaluates exchange rate exposure arising from these transactions and enters into foreign currency derivative instruments to mitigate such exposure. The Company follows established risk management policies, including the use of derivatives like foreign exchange forward/option contracts to hedge forecasted cash flows denominated in foreign currency. - 26 2025 The Company has designated certain derivative instruments as cash flow hedges to mitigate the foreign exchange exposure of forecasted highly probable cash flows. REPORT As at March 31, 2026, a I 1 increase in the spot exchange rate of the Indian Rupee with the U.S. Dollar would result in an approximately I 2,667 (including statement of profit and loss of I 655 and other comprehensive income of I 2,012) ANNUAL decrease in the fair value, and a I 1 decrease would result in an approximately I 2,653 (including statement of profit and loss of I 655 and other comprehensive income of I 1,998) increase in the fair value of foreign currency dollar denominated INTEGRATED derivative instruments (forward and option contracts). WIPRO


LOGO

255 Notes to the Standalone Financial Statements (I in millions, except share and per share data, unless otherwise stated) The below table presents foreign currency risk from non-derivative financial assets/(liabilities) as of March 31, 2026 and 2025: As at March 31, 2026 Pound Australian Canadian Other U.S.$ Euro (1) Total Sterling Dollar Dollar currencies Trade receivables I 57,342 I 13,266 I 10,418 I 2,728 I 565 I 6,723 I 91,042 Unbilled receivables 29,314 5,538 7,169 2,091 965 2,932 48,009 Cash and cash equivalents 5,394 2,749 2,853 1,687 7,333 2,386 22,402 Other financial assets 1,192 1,580 390 93 150 841 4,246 Investment in redeemable - 19,706 — — 19,706 preference shares of subsidiary Lease liabilities (3,739) (2,974) (2,828) (80) (25) (712) (10,358) Trade payables and other financial (44,290) (11,197) (11,861) (2,886) (2,745) (6,235) (79,214) liabilities Non-derivative financial assets/ I45,213 I28,668 I 6,141 I 3,633 I 6,243 I 5,935 I95,833 (liabilities), net (1) Other currencies reflect currencies such as Singapore Dollar, Swiss Franc, Swedish Krona, United Arab Emirates Dirham and Polish Zloty As at March 31, 2025 Pound Australian Canadian Other U.S.$ Euro (1) Total Sterling Dollar Dollar currencies Trade receivables I 38,924 I 12,335 I 7,616 I 2,599 I 1,213 I 8,494 I 71,181 Unbilled receivables 22,604 4,118 4,025 1,587 539 1,862 34,735 Cash and cash equivalents 5,261 1,602 1,117 1,007 4,392 1,735 15,114 Other financial assets 745 1,181 353 161 101 1,046 3,587 Investment in redeemable - 16,661 — — 16,661 preference shares of subsidiary Lease liabilities (2,402) (1,836) (2,402) (259) (72) (1,084) (8,055) Trade payables and other financial (41,054) (8,679) (7,275) (1,414) (857) (6,074) (65,353) liabilities Non-derivative financial assets/ I 24,078 I 25,382 I 3,434 I 3,681 I 5,316 I 5,979 I 67,870 (liabilities), net (1) Other currencies reflect currencies such as Saudi Riyal, Singapore Dollar, Swiss Franc, Polish Zloty and United Arab Emirates Dirham. As at March 31, 2026 and 2025, respectively, every 1% increase/decrease in the respective foreign currencies compared to functional currency of the Company would increase/decrease the Company’s profit before taxes by approximately I 958 and I 679, respectively. Interest rate risk Interest rate risk primarily arises from floating rate borrowings, including various revolving and other lines of credit. The Company’s investments are primarily in short-term investments, which do not expose it to significant interest rate risk. Interest rate risk primarily arises from floating rate borrowing, including various revolving and other lines of credit. If interest rates were to increase by 100 bps as on March 31, 2026 additional net annual interest expense on floating rate borrowing would amount to approximately I 465. Certain borrowings are also transacted at fixed interest rates.


LOGO

256 STATUTORY REPORTS AND FINANCIAL STATEMENTS STANDALONE FINANCIAL STATEMENT UNDER IND AS Notes to the Standalone Financial Statements (I in millions, except share and per share data, unless otherwise stated) Credit risk Credit risk arises from the possibility that customers may not be able to settle their obligations as agreed. To manage this, the Company periodically assesses the credit rating and financial reliability of customers, considering the financial condition, current economic trends, forward-looking macroeconomic information, analysis of historical bad debts and ageing of accounts receivable. No single customer accounted for more than 10% of the accounts receivable as at March 31, 2026 and 2025, and revenues for the years ended March 31, 2026 and 2025. There is no significant concentration of credit risk. Trade receivables and unbilled receivables are written off where there is no reasonable expectation of recovery. Indicators that there is no reasonable expectation of recovery include, amongst others, the failure of a customer to engage in a repayment plan with the Company. Refer to Note 9 for changes in allowance for lifetime expected credit loss. Counter party risk Counterparty risk encompasses issuer risk on marketable securities, settlement risk on derivative and money market contracts and credit risk on cash and time deposits. Issuer risk is minimised by only buying securities in India which are at least AA rated by Indian rating agencies. Settlement and credit risk is reduced by the policy of entering into transactions with counterparties that are usually banks or financial institutions with acceptable credit ratings. Exposure to these risks are closely monitored and maintained within predetermined parameters. There are limits on credit exposure to any financial institution. The limits are regularly assessed and determined based upon credit analysis including financial statements and capital adequacy ratio reviews. Cash and cash equivalents includes demand deposits of I 404 and bank balances of I 21,456 held with two banks having high credit ratings, which are individually in excess of 10% or more of the Company’s total cash and cash equivalents as at March 31, 2026. Refer to Note 10. The Company did not have any significant concentration of investment risk, as no investments with any single counterparty exceeded 10% of total investments, excluding investments in equity instruments and redeemable preference shares of subsidiaries as at March 31, 2026. Refer to Note 8. Liquidity risk Liquidity risk is defined as the risk that the Company will not be able to settle or meet its obligations on time or at a reasonable price. The Company’s corporate treasury department is responsible for liquidity and funding as well as settlement management. In addition, processes and policies related to such risks are overseen by senior management. Management monitors the Company’s net liquidity position through rolling forecasts based on the expected cash flows. - 26 As at March 31, 2026, cash and cash equivalents are held with major banks and financial institutions. 2025 REPORT ANNUAL INTEGRATED WIPRO


LOGO

257 Notes to the Standalone Financial Statements (I in millions, except share and per share data, unless otherwise stated) The table below provides details regarding the remaining contractual maturities of financial liabilities at the reporting date. The amounts include estimated interest payments and exclude the impact of netting agreements, if any. As at March 31, 2026 Interest Less than Beyond4 Total cash included in Carrying 1-2years 2-4years 1year years flows total cash value flows Borrowings(1) I 61,988 I—I—I—I 61,988 I (488) I 61,500 Lease liabilities(1) 5,135 4,250 5,134 9,284 23,803 (4,442) 19,361 Trade payables 60,103 1,420 1,777 522 63,822—63,822 Derivative liabilities 9,799 ——9,799—9,799 Other financial liabilities Salary payable 21,374 ——21,374—21,374 Liabilities towards customer 721 359 360—1,440—1,440 contracts Capital creditors 508 ——508—508 Rent deposit 477 12 — 489—489 Advance from customers 329 ——329—329 Others 5,272 ——5,272—5,272 I165,706 I 6,041 I 7,271 I 9,806 I188,824 I (4,930) I183,894 As at March 31, 2025 Interest Less than Beyond 4 Total cash included in Carrying 1-2 years 2-4 years 1 year years flows total cash value flows Borrowings(1) I 61,290 I—I—I—I 61,290 I (790) I 60,500 Lease liabilities(1) 4,631 3,325 3,912 7,826 19,694 (3,903) 15,791 Trade payables 67,823 ——67,823—67,823 Derivative liabilities 968 ——968—968 Other financial liabilities Salary payable 20,003 ——20,003—20,003 Liabilities towards customer 342 342 684—1,368—1,368 contracts Capital creditors 1,195 ——1,195—1,195 Rent deposit 475 4 21—500—500 Advance from customers 127 ——127—127 Others 514 ——514—514 I 157,368 I 3,671 I 4,617 I 7,826 I 173,482 I (4,693) I 168,789 (1) Includes future cash outflow towards estimated interest on borrowings and lease liabilities.


LOGO

258 STATUTORY REPORTS AND FINANCIAL STATEMENTS STANDALONE FINANCIAL STATEMENT UNDER IND AS Notes to the Standalone Financial Statements (I in millions, except share and per share data, unless otherwise stated) The balanced view of liquidity and financial indebtedness is stated in the table below. This calculation of the net cash position is used by the management for external communication with investors, analysts and rating agencies: As at As at March 31, 2026 March 31, 2025 Cash and cash equivalents I 26,778 I 44,342 Investments—current 394,720 409,568 Borrowings (61,500) (60,500) I 359,998 I 393,410 21. INCOME TAX Income tax expense has been allocated as follows: Year ended Year ended March 31, 2026 March 31, 2025 Income tax expense as per the statement of profit and loss Current tax expense I 38,349 I 39,934 Deferred tax expense/(reversal) (593) (2,940) I 37,756 I 36,994 Income tax included in other comprehensive income on: Gains/(losses) on investment securities I (323) I 221 Gains/(losses) on cash flow hedging derivatives (2,149) (202) Remeasurements of the defined benefit plans 53 78 I (2,419) I 97 I 35,337 I 37,091 The reconciliation between the provision of income tax and amounts computed by applying the Indian statutory income tax rate to profit before taxes is as follows: Year ended Year ended March 31, 2026 March 31, 2025 Profit before tax I 159,052 I 146,125 Enacted income tax rate in India 34.94% 34.94% 26 Computed expected tax expense I 55,573 I 51,056 - 2025 Effect of: Income exempt from tax I (17,492) I (14,139) REPORT Basis differences that will reverse during a tax holiday period 66 (331) Income taxed at higher/(lower) rates (223) (74) ANNUAL Taxes related to prior years (3,949) (4,156) Changes in unrecognised deferred tax assets (543) 441 Expenses disallowed for tax purpose 4,317 4,194 INTEGRATED Others, net 7 3 Income tax expense I 37,756 I 36,994 WIPRO Effective income tax rate 23.74% 25.32%


LOGO

259 Notes to the Standalone Financial Statements (I in millions, except share and per share data, unless otherwise stated) The components of deferred tax assets and liabilities are as follows: As at As at March 31, 2026 March 31, 2025 Deferred tax assets Carry-forward losses I 116 I 112 Trade payables and other liabilities 4,331 4,789 Allowances for lifetime expected credit loss 1,647 1,129 Cash flow hedges 2,226 77 Others 13 62 I 8,333 I 6,169 Deferred tax liabilities Property, plant and equipment I (1,031) I (771) Amortisable goodwill (449) (378) Interest income and fair value movement of investments (2,124) (2,397) Special Economic Zone re-investment reserve (2,627) (3,485) I (6,231) I (7,031) Deferred tax assets/(liabilities),net I 2,102 I (862) Amounts presented in the balance sheet Deferred tax assets I 2,102 I 453 Deferred tax liabilities— 1,315 Movement in deferred tax assets and liabilities Movement during the year ended March 31, 2026 Credit/ Credit/ Adjusted (charge) Adjustment (charge) As at balance in the Translation As at March on account in other April1,2025 as at April 1, statement adjustment 31, 2026 of merger comprehensive 2025 of profit and income loss Carry-forward losses I 112 I—I 112 I 4 I—I—I 116 Trade payables and other 4,789—4,789 (405) (53)—4,331 liabilities Allowances for lifetime expected 1,129—1,129 518 — 1,647 credit loss Cash flow hedges 77—77—2,149—2,226 Property, plant and equipment (771)—(771) (260) — (1,031) Amortisable goodwill (378)—(378) (71) — (449) Interest income and fair value (2,397)—(2,397) (50) 323—(2,124) movement of investments Special Economic Zone (3,485)—(3,485) 858 — (2,627) re-investment reserve Others 62—62 (1)—(48) 13 Deferred tax assets/(liabilities), net I (862) I—I (862) I 593 I 2,419 I (48) I 2,102


LOGO

260 STATUTORY REPORTS AND FINANCIAL STATEMENTS STANDALONE FINANCIAL STATEMENT UNDER IND AS Notes to the Standalone Financial Statements (I in millions, except share and per share data, unless otherwise stated) Movement during the year ended March 31, 2025 Credit/ Credit/ Adjusted (charge) Adjustment (charge) As at As at balance in the Translation on account in other March 31, April 1, 2024 as at April 1, statement adjustment of merger comprehensive 2025 2024 of profit income and loss Carry-forward losses I 766 I— I 766 I (654) I— I— I 112 Trade payables and other 3,572 376 3,948 919 (78)—4,789 liabilities Allowances for lifetime 1,340 46 1,386 (257) — 1,129 expected credit loss Cash flow hedges (125)—(125)—202—77 Property, plant and (1,141) 147 (994) 223 — (771) equipment Amortisable goodwill (300)—(300) (78) — (378) Interest income and fair value movement of (710) (23) (733) (1,443) (221)—(2,397) investments Special Economic Zone (7,820)—(7,820) 4,335 — (3,485) re-investment reserve Others 181 (3) 178 (105)—(11) 62 Deferred tax assets/ (liabilities), net I(4,237) I 543 I (3,694) I 2,940 I (97) I (11) I (862) Deferred taxes on unrealised foreign exchange gain/loss relating to cash flow hedges, fair value movements in investments and remeasurements of the defined benefit plans are recognised in other comprehensive income and presented within equity. Other than these, the change in deferred tax assets and liabilities is primarily recorded in the statement of profit and loss. In assessing the realisability of deferred tax assets, the Company considers the extent to which it is probable that the deferred tax asset will be realised. The ultimate realisation of deferred tax assets is dependent upon the generation of future taxable profits during the periods in which those temporary differences and tax loss carry-forwards become deductible. The Company considers the expected reversal of deferred tax liabilities, projected future taxable income and tax planning strategies in making this assessment. Based on this, the Company believes that it is probable that the Company will realise the benefits of these deductible differences. The amount of deferred tax asset considered realisable, however, could be reduced in the near term if the estimates of future taxable income during the carry-forward period 26 are reduced. - 2025 The Company has recognised deferred tax assets of I 116 and I 112 as at March 31, 2026 and 2025 primarily in respect of capital loss incurred on account of liquidation of an investment. Management’s projections of future taxable capital gain REPORT support the assumption that it is probable that sufficient taxable income will be available to utilise this deferred tax asset. A substantial portion of the profits of the Company’s India operations are exempt from Indian income taxes being profits ANNUAL attributable to export operations and profits from units established under Special Economic Zone Act, 2005 scheme. Units in designated SEZs providing service on or after April 1, 2005 will be eligible for a deduction of 100% of profits or gains derived from the export of services for the first five years from commencement of provision of services and 50% of such profits and gains for a further five years. A 50% tax deduction is available for a further five years subject to the unit meeting INTEGRATED certain defined conditions. Profits from certain other undertakings are also eligible for preferential tax treatment. New SEZ units set up on or after April 1, 2021 are not eligible for aforesaid deduction. The tax holiday period being currently available WIPRO to the Company expires in various years through fiscal years 2034-35. The impact of tax holidays has resulted in a decrease


LOGO

261 Notes to the Standalone Financial Statements (I in millions, except share and per share data, unless otherwise stated) of current tax expense of I 13,092 and I 11,798 for the years ended March 31, 2026 and 2025, respectively, compared to the effective tax amounts that the Company estimates it would have been required to pay if these incentives had not been available. The per equity share effect of these tax incentives for the years ended March 31, 2026 and 2025 is I 1.25 and I 1.13, respectively. Deferred income tax liabilities are recognised for all taxable temporary differences except in respect of taxable temporary differences associated with U.S. branch profit tax where the timing of the reversal of the temporary difference can be controlled and it is probable that the temporary difference will not reverse in the foreseeable future. Accordingly, deferred income tax liabilities on branch profit tax at 15% of the U.S. branch profits have not been recognised. Further, it is not practicable to estimate the amount of the unrecognised deferred tax liabilities for these undistributed earnings. The Pillar Two legislations are neither enacted nor substantively enacted by Government of India, where the parent company is incorporated. Pillar Two legislation has been enacted, or substantively enacted, in certain other jurisdictions where the Company operates. However, the Company does not expect any material financial impact for the year ended March 31, 2026. In line with amended Ind AS 12, the Company has not recognised deferred taxes related to Pillar Two income taxes and accordingly has applied the mandatory exception as per the said standard. 22. REVENUE FROM OPERATIONS A. Contract assets and Contract liabilities The following table presents the changes in contract assets balance: As at As at March 31, 2026 March 31, 2025 Balance at the beginning of the year I 9,815 I 12,941 Adjustment on account of merger— 3 Adjusted balance at the beginning of the year I 9,815 I 12,944 Amount reclassified to receivables pertaining to fixed price development contracts (8,737) (8,952) on completion of milestones Increase due to revenue recognised during the year 6,274 5,823 Balance at the end of the year I 7,352 I 9,815 The following table presents the changes in contract liabilities balance: As at As at March 31, 2026 March 31, 2025 Balance at the beginning of the year I 15,162 I 14,265 Adjustment on account of merger— 52 Adjusted balance at the beginning of the year I 15,162 I 14,317 Revenue recognised from opening balance of contract liabilities (11,526) (11,171) Increase due to invoicing during the year 15,193 12,016 Balance at the end of the year I 18,829 I 15,162 Contract assets and liabilities are reported in a net position on a contract-by-contract basis at the end of each reporting period.


LOGO

262 STATUTORY REPORTS AND FINANCIAL STATEMENTS STANDALONE FINANCIAL STATEMENT UNDER IND AS Notes to the Standalone Financial Statements (I in millions, except share and per share data, unless otherwise stated) B. Reconciliation of revenue Reconciliation of revenue recognised with the contracted price as follows: As at As at March 31, 2026 March 31, 2025 Contracted price I 728,904 I 695,862 Reductions towards variable consideration components(1) (15,453) (10,112) Revenue recognized in the statement of profit and loss I 713,451 I 685,750 (1) Variable consideration comprises of volume discount, service level credits and liquidated damages. C. Remaining performance obligations Revenue allocated to remaining performance obligations represents contracted revenue that has not yet been recognised, which includes contract liabilities and amounts that will be invoiced and recognised as revenue in future periods. Applying the practical expedient, the Company has not disclosed its right to consideration from customers in an amount that corresponds directly with the value to the customer of the Company’s performance completed to date, which are contracts invoiced on time and material basis and volume based. As at March 31, 2026 and 2025, the aggregate amount of the Transaction Price allocated to remaining performance obligations, other than those meeting the exclusion criteria above, were I 266,386 and I 223,292, respectively, of which approximately 60% and 66%, respectively, is expected to be recognised as revenues within two years, and the remainder thereafter. This includes contracts, with a substantive enforceable termination penalty if the contract is terminated without cause by the customer, based on an overall assessment of the contract carried out at the time of inception. Historically, customers have not terminated contracts without cause. D. Disaggregation of revenue The tables below present disaggregated revenue from contracts with customers by business segment and nature of contract. The Company believes that the below disaggregation best depicts the nature, amount, timing and uncertainty of revenue and cash flows from economic factors. Revenue by nature of services Year ended Year ended March 31, 2026 March 31, 2025 Rendering of services I 709,602 I 684,307 - 26 2025 Sale of products 3,849 1,443 REPORT I 713,451 I 685,750 Revenue by nature of contract ANNUAL Year ended Year ended March 31, 2026 March 31, 2025 Fixed price and volume based I 374,187 I 381,864 INTEGRATED Time and materials 335,415 302,443 Products 3,849 1,443 WIPRO I 713,451 I 685,750


LOGO

263 Notes to the Standalone Financial Statements (I in millions, except share and per share data, unless otherwise stated) 23. OTHER INCOME Year ended Year ended March 31, 2026 March 31, 2025 Interest income I 25,512 I 24,674 Dividend income from investment in equity instruments of subsidaries 11,062 5,161 Dividend income from equity investments designated as FVTOCI 3 2 Net gain from investments classified as FVTPL 6,969 8,440 Net loss from investments classified as FVTOCI 358 (72) Finance and other income K 43,904 K 38,205 Foreign exchange gain/(loss), net on derivatives measured at FVTPL I (4,664) C (182) Foreign exchange gain/(loss), net on investments measured at FVTPL 3,045 379 Other foreign exchange differences, net 4,791 363 Foreign exchange gain, net K 3,172 K 560 Gain on sale of property, plant and equipment, net(1) I 415 I 712 K 47,491 K 39,477 (1)Gain on sale of property, plant and equipment, net for the year ended March 31, 2026 and 2025, includes gain on transfer of building of I 405 and gain on relinquishment of the lease hold rights of land, and transfer of building along with other assets of I 885, respectively. 24. CHANGES IN INVENTORIES OF STOCK-IN-TRADE Year ended Year ended March 31, 2026 March 31, 2025 Stock at the beginning of the year I 613 H 703 Less: Stock at the end of the year 465 613 Decrease during the year I 148 H 90 25.EMPLOYEEBENEFITS a) Employee costs includes Year ended Year ended March 31, 2026 March 31, 2025 Salaries and bonus I 365,644 I 364,236 Contribution to provident and other funds 19,291 14,776 Share-based compensation(1) 3,874 4,838 I 388,809 I 383,850 (1) Includes I Nil and I (9) for the years ended March 31, 2026 and 2025, respectively, towards cash settled ADSs and RSUs.


LOGO

264 STATUTORY REPORTS AND FINANCIAL STATEMENTS STANDALONE FINANCIAL STATEMENT UNDER IND AS Notes to the Standalone Financial Statements (I in millions, except share and per share data, unless otherwise stated) Defined benefit plan actuarial (gains)/losses recognised in other comprehensive income include: Year ended Year ended March 31, 2026 March 31, 2025 Return on plan assets excluding interest income—loss/(gain) I 439 I (248) Actuarial loss/(gain) arising from financial assumptions 757 237 Actuarial loss/(gain) arising from demographic assumptions 29 (111) Actuarial loss/(gain) arising from experience adjustments (1,454) (207) Change in the effect of asset ceiling—loss/(gain) 7 13 (Gain)/loss on remeasurement of defined benefit plans, net I (222) I (316) b) Gratuity and foreign pension: Defined benefit plans include gratuity for employees drawing salary in Indian Rupees, pension and certain benefits plans in foreign jurisdictions. Amount recognised in the statement of profit and loss in respect of defined benefit plans is as follows: Year ended Year ended March 31, 2026 March 31, 2025 Current service cost I 3,280 I 2,805 Past service cost 3,377 — Net interest income on net defined benefit liability/(asset) 147 14 Net charge to the statement of profit and loss I 6,804 I 2,819 Actual return on plan assets I 659 I 1,353 Change in present value of defined benefit obligation is summarised below: As at As at March 31, 2026 March 31, 2025 Defined benefit obligation at the beginning of the year I 18,042 I 14,828 Adjustment on account of merger— 1,116 Adjustedbalanceofdefinedbenefitobligationatthebeginningoftheyear I 18,042 I 15,944 Current service cost 3,280 2,805 Past service cost 3,377 — —26 Interest expense on obligation 1,242 1,117 2025 Benefits paid (2,100) (1,799) REPORT Transfer in/(out), net 1 21 Remeasurement loss/(gain) ANNUAL Actuarial loss/(gain) arising from financial assumptions 757 237 Actuarial loss/(gain) arising from demographic assumptions 29 (111) Actuarial loss/(gain) arising from experience adjustments (1,454) (207) Translation adjustment 174 35 INTEGRATED Defined benefit obligation at the end of the year I 23,348 I 18,042 WIPRO


LOGO

265 Notes to the Standalone Financial Statements (I in millions, except share and per share data, unless otherwise stated) Change in plan assets is summarised below: As at As at March 31, 2026 March 31, 2025 Fair value of plan assets at the beginning of the year I 17,072 I 15,717 Expected return on plan assets 1,098 1,105 Employer contributions 5,225 5 Benefits paid (27) (30) Remeasurement (loss)/gain Return on plan assets excluding interest income—(loss)/gain (439) 248 Translation adjustment 134 27 Fair value of plan assets at the end of the year I 23,063 I 17,072 As at As at March 31, 2026 March 31, 2025 Defined benefit obligation I 23,348 I 18,042 Fair value of plan assets 23,063 17,072 Present value of unfunded obligation (285) (970) Change in the effect of asset ceiling (89) (66) Recognised liability (374) (1,036) Change in effect of asset ceiling is summarised below: As at As at March 31, 2026 March 31, 2025 Effect of asset ceiling at the beginning of the year I 66 I 50 Interest expense on effect of asset ceiling 3 2 Changes in the effect of limiting the surplus to the asset ceiling 7 13 Translation adjustment 13 1 Effect of asset ceiling at the end of the year I 89 I 66 As at March 31, 2026 and 2025, plan assets were primarily invested in insurer managed funds. The Company has established an income tax approved irrevocable trust fund to which it regularly contributes to finance the liabilities of the gratuity plan. The fund’s investments are managed by certain insurance companies as per the selection made by the trustees among the fund plan available. The principal assumptions used for the purpose of actuarial valuation of these defined benefit plans are as follows: As at As at March 31, 2026 March 31, 2025 Discount rate 6.38% 6.49% Expected return on plan assets 6.38% 6.49% Expected rate of salary increase 7.67% 7.66% Weighted average duration of defined benefit obligations 5.27 years 5.65 years


LOGO

266 STATUTORY REPORTS AND FINANCIAL STATEMENTS STANDALONE FINANCIAL STATEMENT UNDER IND AS Notes to the Standalone Financial Statements (I in millions, except share and per share data, unless otherwise stated) The discount rate is primarily based on the prevailing market yields of government securities for the estimated term of the obligations. The estimates of future salary increase considered takes into account the inflation, seniority, promotion and other relevant factors. Attrition rate considered is the management’s estimate, based on previous years’ employee turnover of the Company. The expected return on plan assets is based on expectation of the average long-term rate of return expected on investments of the fund during the estimated term of the obligations. Expected future contribution and estimated future benefit payments from the fund are as follows: For the year ended March 31, 2026 Expected contribution to the fund during the year ending March 31, 2027 I 3,315 Estimated benefit payments from the fund for the year ending March 31: 2027 I 4,101 2028 3,589 2029 3,242 2030 2,977 2031 2,625 Thereafter 18,027 Total I 34,561 For the year ended March 31, 2025 Expected contribution to the fund during the year ending March 31, 2026 I 3,416 Estimated benefit payments from the fund for the year ending March 31: 2026 I 2,715 2027 2,720 2028 2,503 2029 2,281 2030 2,022 Thereafter 15,357 Total I 27,598 The expected benefits are based on the same assumptions used to measure the Company’s benefit obligations as at March 31, 2026. Sensitivity for significant actuarial assumptions is computed to show the movement in defined benefit obligation by 1 percentage. - 26 As at March 31, 2026, every 1 percentage point increase/(decrease) in discount rate will result in (decrease)/ 2025 increase of defined benefit obligation by approximately I (1,203) and I 1,319, respectively (March 31, 2025: I (985) and I 1,096, respectively). REPORT As at March 31, 2026, every 1 percentage point increase/(decrease) in expected rate of salary will result in increase/(decrease) of defined benefit obligation by approximately I 1,388 and I (1,316), respectively ANNUAL (March 31, 2025: I 1,055 and I (998), respectively). The sensitivity analysis to significant actuarial assumptions may not be representative of the actual change in the defined benefit obligations as the change in assumptions may not occur in isolation since some of the INTEGRATED assumptions may be correlated. Furthermore, in presenting the sensitivity analysis, the present value of the defined benefit obligations has been calculated using the projected unit credit method at the end of the reporting period, which is the same as that applied in calculating the defined benefit obligation liability recognised in the WIPRO balance sheet.


LOGO

267 Notes to the Standalone Financial Statements (I in millions, except share and per share data, unless otherwise stated) c) Provident fund: The details of fund and plan assets are given below: As at As at March 31, 2026 March 31, 2025 Fair value of plan assets I 133,417 I 121,067 Present value of defined benefit obligation (133,417) (121,067) Net shortfall I— I— The total expense for the years ended March 31, 2026 and 2025 is I 7,058 and I 6,517, respectively. The plan assets have been invested as per the regulations of Employees’ Provident Fund Organisation (EPFO). The principal assumptions used in determining the present value obligation of interest guarantee under the deterministic approach are as follows: As at As at March 31, 2026 March 31, 2025 Discount rate for the term of the obligation 6.50% 6.55% Weighted Average remaining tenure of investment portfolio 13.81 years 6.71 years Guaranteed rate of return 8.25% 8.25% d) Defined contribution plans: The total expense for the years ended March 31, 2026 and 2025 was I 5,576 and I 5,454, respectively. 26. FINANCE COSTS Year ended Year ended March 31, 2026 March 31, 2025 Interest on borrowings I 3,692 I 4,058 Interest on lease liabilities 1,072 875 Other finance costs 6,195 5,085 I 10,959 I 10,018 27.OTHEREXPENSES Year ended Year ended March 31, 2026 March 31, 2025 Rates, taxes and insurance I 3,458 I 3,420 Lifetime expected credit loss 2,729 829 Provision for diminution in value of investments in subsidiaries (Refer to Note 8) (1,554) 359 Miscellaneous expenses/(income), net(1) 606 (2,062) I 5,239 I 2,546 (1) Miscellaneous expenses/(income), net includes an insurance claim received of I 1,805 during the year ended March 31, 2025.


LOGO

268 STATUTORY REPORTS AND FINANCIAL STATEMENTS STANDALONE FINANCIAL STATEMENT UNDER IND AS Notes to the Standalone Financial Statements (I in millions, except share and per share data, unless otherwise stated) 28.EARNINGSPEREQUITYSHARE A reconciliation of profit for the year and equity shares used in the computation of basic and diluted earnings per equity share is set out below: Basic: Basic earnings per equity share is calculated by dividing the profit attributable to equity shareholders of the Company by the weighted average number of equity shares outstanding during the year, excluding equity shares purchased by the Company and held as treasury shares. Year ended Year ended March 31, 2026 March 31, 2025 Profit attributable to equity holders of the Company I 121,296 I 109,131 Weighted average number of equity shares outstanding 10,476,247,846 10,456,741,552 Basic earnings per equity share I 11.59 I 10.44 Diluted: Diluted earnings per equity share is calculated by adjusting the weighted average number of equity shares outstanding during the year for assumed conversion of all dilutive potential equity shares. Employee share options are dilutive potential equity shares for the Company. The calculation is performed in respect of share options to determine the number of equity shares that could have been acquired at fair value (determined as the average market price of the Company’s equity shares during the year). The number of equity shares calculated as above is compared with the number of equity shares that would have been issued assuming the exercise of the share options. Year ended Year ended March 31, 2026 March 31, 2025 Profit attributable to equity holders of the Company I 121,296 I 109,131 Weighted average number of equity shares outstanding 10,476,247,846 10,456,741,552 Effect of dilutive equivalent share options 27,175,090 32,197,840 Weighted average number of equity shares for diluted earnings per share 10,503,422,936 10,488,939,392 Diluted earnings per equity share I 11.55 I 10.40 For the years ended March 31, 2026 and 2025, 1,586,275 and 1,294,623 options, respectively, were excluded from diluted weighted-average number of equity shares calculation because their effect would have been anti-dilutive. 29.DIVIDENDS,BONUSISSUEANDBUYBACKOFEQUITYSHARES 26 The Company declares and pays dividends in Indian Rupees. According to the Companies Act, 2013 any dividend should - 2025 be declared out of accumulated distributable profits. A company may, before the declaration of any dividend, transfer a percentage of its profits for that financial year as it may consider appropriate to the reserves. REPORT The cash dividends paid per equity share were I 11 (I 5 declared on July 17, 2025 and I 6 declared on January 16, 2026) and I 6, during the years ended March 31, 2026 and 2025, respectively. ANNUAL During the year ended March 31, 2025, the Company concluded bonus issue in the ratio of 1:1 i.e. 1 (one) bonus equity share of I 2 each for every 1 (one) fully paid-up equity shares held (including ADS holders) was approved by the shareholders of the Company on November 21, 2024. Subsequently, on December 4, 2024, the Company allotted 5,232,094,402 INTEGRATED equity shares (including ADS) to shareholders who held equity shares as on the record date of December 3, 2024. The Company also allotted 1:1 bonus equity share on 1,274,805 equity shares (including ADS) under allotment as on the record date. Consequently, I 10,467 (representing par value of I 2 per share) was transferred from capital redemption reserve, WIPRO securities premium and retained earnings to the share capital.


LOGO

269 Notes to the Standalone Financial Statements (I in millions, except share and per share data, unless otherwise stated) 30. ADDITIONAL CAPITAL DISCLOSURES The key objective of the Company’s capital management is to ensure that it maintains a stable capital structure with the focus on total equity to uphold investor, creditor, and customer confidence and to ensure future development of its business. The Company’s focus is on keeping a strong total equity base to ensure independence, security, as well as a high financial flexibility for potential future borrowings, if required without impacting the risk profile of the Company. The Company’s goal is to continue to be able to return excess liquidity to shareholders by continuing to distribute annual dividends in future periods. The amount of future dividends/buyback of equity shares will be balanced with efforts to continue to maintain an adequate liquidity status. The capital structure as at March 31, 2026 and 2025 was as follows: Year ended Year ended % Change March 31, 2026 March 31, 2025 Total equity I 636,797 I 634,874 0.3% As percentage of total capital 88.7% 89.3% Current borrowings I 61,500 I 60,500 Current and non-current lease liabilities 19,361 15,791 Total borrowings and lease liabilities I 80,861 I 76,291 6.0% As percentage of total capital 11.3% 10.7% Total capital I 717,658 I 711,165 0.9% Borrowings represent 8.6% and 8.5% of total capital as at March 31, 2026 and 2025, respectively. The Company is not subjected to any externally imposed capital requirements. 31. EMPLOYEE STOCK INCENTIVE PLANS The stock compensation expense recognised for employee services received during the years ended March 31, 2026 and 2025, were I 3,874 and I 4,838, respectively. Wipro Equity Reward Trust (“WERT”) In 1984, the Company established a controlled trust called WERT. In previous years, WERT purchased shares of the Company out of funds borrowed from the Company. The Company’s Nomination and Remuneration Committee recommends to WERT certain officers and key employees, to whom WERT issues shares from its holdings at nominal price subject to vesting conditions. WERT held 11,905,480 and 11,905,480 treasury shares as of March 31, 2026 and 2025, respectively. Wipro Employee Restricted Stock Unit Option Plans A summary of the general terms of grants under restricted stock unit (“RSU”) option plans are as follows: Number of options Range of Name of Plan reserved under exercise price the plan Wipro ADS Restricted Stock Unit Plan (WARSUP 2004 Plan)(1) 174,595,958 U.S.$ 0.03 Wipro Employee Restricted Stock Unit Plan 2005 (WSRUP 2005 Plan)(1) 96,595,958 I 2 Wipro Employee Restricted Stock Unit Plan 2007 (WSRUP 2007 Plan)(1) 67,663,302 I 2 Wipro Limited Employee Stock Options, Performance Stock Unit and/or Restricted Stock Unit 400,000,000 U.S.$ 0.03/I 2 Scheme 2024 (Wipro 2024 Scheme)(1) (1) The maximum contractual term of these RSU option plans is perpetual until the options are available for grant under the plan.


LOGO

270 STATUTORY REPORTS AND FINANCIAL STATEMENTS STANDALONE FINANCIAL STATEMENT UNDER IND AS Notes to the Standalone Financial Statements (I in millions, except share and per share data, unless otherwise stated) Employees covered under the RSU options plans are granted an option to purchase shares of the Company at the respective exercise prices, subject to requirements of vesting conditions. These options generally vest in tranches over a period of one to three years from the date of grant. Upon vesting, the employees can acquire one equity share for every option and can exercise within a period of twelve months from the vesting date of last tranche under the grant. The activity in equity-settled RSU option plans is summarised below: Range of exercise price Year ended Year ended and Weighted average March 31, 2026 March 31, 2025 exercise price Number of Number of options options I    2 18,634,747 7,735,669 Outstanding at the beginning of the year U.S.$ 0.03 36,956,579 18,851,226 I    2— 10,749,111 Bonus on outstanding (Refer to Note 29) U.S.$ 0.03— 22,882,839 I    2 10,617,130 5,513,469 Granted U.S.$ 0.03 23,259,750 15,030,302 Adjustment of Performance based stock options on I    2 (1,841,526) (331,920) completion of performance measurement period U.S.$ 0.03 (3,986,719) (499,875) I    2 (5,293,789) (3,731,212) Exercised U.S.$ 0.03 (10,982,620) (9,897,384) I    2 (2,771,279) (1,300,370) Forfeited and expired U.S.$ 0.03 (8,303,933) (9,410,529) I    2 19,345,283 18,634,747 Outstanding at the end of the year U.S.$ 0.03 36,943,057 36,956,579 I    2 2,010,308 1,996,731 Exercisable at the end of the year U.S.$ 0.03 1,283,137 1,007,466 The Company has granted below options under RSU and ADS option plans(1): Year ended Year ended March 31, 2026 March 31, 2025 Restricted Stock Units (RSU) 6,743,031 3,498,476 Performance based stock options (RSUs) 3,874,099 2,014,993 Total 10,617,130 5,513,469 - 26 ADS RSU 14,834,924 9,707,235 2025 Performance based stock options (ADS) 8,424,826 5,323,067 REPORT Total 23,259,750 15,030,302 (1) Numbers in above table are not given effect of bonus shares issued during the year ended March 31, 2025. ANNUAL During the year ended March 31, 2026, RSU and ADS grants were issued under Wipro 2024 Scheme. Performance-based INTEGRATED stock options will vest based on the performance parameters of the Company. WIPRO


LOGO

271 Notes to the Standalone Financial Statements (I in millions, except share and per share data, unless otherwise stated) The activity in cash-settled RSU option plans is summarised below: Year ended Year ended March 31, 2026 March 31, 2025 Number of Number of options options Outstanding at the beginning of the year— 7,000 Exercised— — Forfeited and expired— (7,000) Outstanding at the end of the year— — Exercisable at the end of the year— — The following table summarises information about outstanding RSU option plans: As at March 31, 2026 As at March 31, 2025 Range of exercise price and Weighted average exercise price Weighted average Weighted average Number  of Number of remaining life remaining life options options (months) (months) I 2 19,345,283 16 18,634,747 18 U.S.$ 0.03 36,943,057 18 36,956,579 19 The weighted-average grant-date fair value of options granted during the years ended March 31, 2026, and 2025 was I 249.40 and I 454.58 for each option, respectively. The weighted average share price of options exercised during the years ended March 31, 2026 and 2025 was I 246.01 and I 389.52 for each option, respectively. 32. RELATED PARTY RELATIONSHIP AND TRANSACTIONS The list of subsidiaries, associate and joint venture as of March 31, 2026 are provided in the table below: Subsidiaries Subsidiaries Subsidiaries Country of Incorporation Holding Attune Consulting India Private India 100.00% Limited Capco Technologies Private Limited India 100.00% Wipro Chengdu Limited China 8.96% Wipro Holdings (UK) Limited U.K. 100.00% Wipro Technologies SRL Romania ^ Wipro IT Services Bangladesh Limited Bangladesh 100.00% Wipro IT Services UK Societas U.K. 100.00% Capco Consulting Middle (2) UAE 100.00% East FZE Designit A/S Denmark 100.00% Designit Denmark A/S Denmark 100.00% Designit Germany GmbH Germany 100.00% Designit Oslo A/S Norway 100.00%


LOGO

272 STATUTORY REPORTS AND FINANCIAL STATEMENTS STANDALONE FINANCIAL STATEMENT UNDER IND AS Notes to the Standalone Financial Statements (I in millions, except share and per share data, unless otherwise stated) Subsidiaries Subsidiaries Subsidiaries Country of Incorporation Holding Designit Spain Digital, Spain 100.00% S.L.U Designit T.L.V Ltd. Israel 100.00% Wipro Bahrain Limited Co. Bahrain 100.00% W.L.L Wipro Czech Republic IT Czech Republic 100.00% Services s.r.o. Wipro CRM Services Belgium 100.00% Wipro 4C Consulting France 100.00% France SAS Wipro CRM Services B.V. Netherlands 100.00% Wipro CRM Services ApS Denmark 100.00% Wipro CRM Services UK U.K. 100.00% Limited Grove Holdings 2 S.á.r.l Luxembourg 100.00% Capco Solution Services Germany 100.00% GmbH The Capital Markets Italy 100.00% Company Italy Srl Capco Brasil Serviços E Brazil 99.99% Consultoria Ltda The Capital Markets (1) Belgium 100.00% Company BV PT. WT Indonesia Indonesia 99.60% Rainbow Software LLC Iraq 100.00% Wipro Arabia Limited Saudi Arabia 66.67% Women’s Business Park Saudi Arabia 100.00% Technologies Limited Wipro Doha LLC Qatar 100.00% Wipro Financial Outsourcing Services U.K. 100.00% Limited Wipro UK Limited U.K. 100.00% 26 Wipro Gulf LLC Sultanate of Oman 99.98% - 2025 Wipro Information Technology Netherlands Netherlands 100.00% REPORT BV. Wipro Gulf LLC Sultanate of Oman 0.02% Wipro Technologies SA Argentina 2.62% ANNUAL Wipro (Thailand) Co. Limited Thailand 0.03% Wipro Technologies GmbH Germany 14.87% Wipro Do Brasil Sistemas INTEGRATED Brazil 0.07% De Informatica Ltda WIPRO


LOGO

273 Notes to the Standalone Financial Statements (I in millions, except share and per share data, unless otherwise stated) Subsidiaries Subsidiaries Subsidiaries Country of Incorporation Holding Wipro do Brasil (1) Brazil 99.44% Technologia Ltda Wipro Information Technology Kazakhstan Kazakhstan 100.00% LLP Wipro Outsourcing Ireland 100.00% Services (Ireland) Limited Wipro Portugal S.A.(1) Portugal 100.00% Wipro Solutions Canada Canada 100.00% Limited Wipro Technologies Russia 99.99% Limited Wipro Technologies Peru Peru 99.98% SAC Wipro Technologies W.T. Costa Rica 100.00% Sociedad Anonima Wipro Technology Chile Chile 100.00% SPA Applied Value Netherlands 100.00% Technologies B.V. Wipro IT Service Ukraine, Ukraine 100.00% LLC Wipro IT Services Poland Poland 100.00% SP Z.O.O Wipro IT Services S.R.L. Romania 100.00% Wipro Regional Saudi Arabia 100.00% Headquarter Wipro Technologies Australia 100.00% Australia Pty Ltd Wipro Ampion Holdings (1) Australia 100.00% Pty Ltd Wipro Technologies SA Argentina 97.38% Wipro Technologies SA Mexico 91.08% DE CV Wipro Technologies South Africa (Proprietary) South Africa 69.42% Limited Wipro Technologies Nigeria 99.84% Nigeria Limited Wipro Technologies SRL Romania 100.00% Wipro (Thailand) Co. Thailand 99.97% Limited Wipro Shanghai Limited China 84.63% Wipro Technologies Nigeria 0.16% Nigeria Limited Wipro Technologies Russia 0.01% Limited Wipro Technologies Peru Peru 0.02% SAC Wipro Japan KK Japan 100.00% Wipro Networks Pte Limited Singapore 100.00%


LOGO

274 STATUTORY REPORTS AND FINANCIAL STATEMENTS STAND ALONE FINANCIAL STATEMENT UNDER IND AS Notes to the Standalone Financial Statements (I in millions, except share and per share data, unless otherwise stated) Subsidiaries Subsidiaries Subsidiaries Country of Incorporation Holding Applied Value Singapore 100.00% Technologies Pte. Limited Wipro Chengdu Limited China 91.04% PT. WT Indonesia Indonesia 0.40% Wipro (Thailand) Co. Thailand ^ Limited Wipro (Dalian) Limited China 100.00% Wipro Technologies SDN Malaysia 100.00% BHD Wipro (Tianjin) Limited(3) China 100.00% Wipro Philippines, Inc. Philippines 100.00% Wipro Shanghai Limited China 15.37% Wipro Travel Services Limited India 100.00% Wipro, LLC USA 100.00% Wipro Technologies SA Mexico 8.92% DE CV Wipro Gallagher Solutions, USA 100.00% LLC Wipro Insurance Solutions, USA 100.00% LLC Wipro IT Services, LLC(8) USA 100.00% Aggne Global Inc. USA 60.00% Edgile, LLC USA 100.00% HealthPlan Services, Inc.(1) USA 100.00% Infocrossing, LLC USA 100.00% International TechneGroup (1) USA 100.00% Incorporated Wipro NextGen Enterprise (1) USA 100.00% Inc. Rizing Intermediate (1) USA 100.00% Holdings, Inc. Wipro Appirio, Inc.(1) USA 100.00% Wipro Designit Services, (1) USA 100.00% Inc. Wipro Telecom Consulting 26 USA 100.00% - LLC 2025 Wipro VLSI Design USA 100.00% Services, LLC Applied Value REPORT USA 100.00% Technologies, Inc. Wipro Business Services (10) USA 100.00% ANNUAL LLC The Capital Markets (1)(7) USA 100.00% Company, LLC Aggne Global IT Services India 60.00% INTEGRATED Private Limited WIPRO


LOGO

275 Notes to the Standalone Financial Statements (I in millions, except share and per share data, unless otherwise stated) Subsidiaries Subsidiaries Subsidiaries Country of Incorporation Holding Wipro, Inc. USA 100.00% Wipro Life Science USA 100.00% Solutions, LLC Wipro Connected Services, Inc. (Formerly known as Harman USA 100.00% Connected Services, Inc.)(4)(5) Wipro Connected Services Mauritius Pvt. Ltd. (Formerly known Mauritius 100.00% as Harman Connected Services Mauritius Pvt. Ltd.) Connected Services Corporation Wipro India Private Limited (Formerly India 98.40% known as Harman Connected Services Corporation India Pvt. Ltd.) Connected Services Corporation Wipro India Private Limited (Formerly India 1.60% known as Harman Connected Services Corporation India Pvt. Ltd.) Wipro Connected Services Engineering Corp. (Formerly known USA 100.00% as Harman Connected Services Engineering Corp.) Wipro Connected Services UK Limited (Formerly known as Harman UK 100.00% Connected Services UK Limited) Harman Connected Morocco 100.00% Services Morocco Wipro Connected Services US Midco LLC (Formerly known as Harman USA 100.00% Connected Services US Midco LLC) Harman Connected (1) Sweden 100.00% Services AB The Wipro SA Broad Based Ownership Scheme Trust Wipro SA Broad Based Ownership Scheme SPV 100.00% (RF) (PTY) LTD Wipro Technologies South Africa (Proprietary) South Africa 30.58% Limited ^ Value is less than 0.01% The Company controls ‘The Wipro SA Broad Based Ownership Scheme Trust’, ‘Wipro SA Broad Based Ownership Scheme SPV (RF) (PTY) LTD’ incorporated in South Africa and Wipro Foundation in India. (2) Grove Holdings 2 S.á.r.l. has transferred its entire shareholding in Capco Consulting Middle East FZE to Wipro IT Services UK Societas, effective September 19, 2025.


LOGO

276 STATUTORY REPORTS AND FINANCIAL STATEMENTS STANDALONE FINANCIAL STATEMENT UNDER IND AS Notes to the Standalone Financial Statements (I in millions, except share and per share data, unless otherwise stated) (3) Wipro (Tianjin) Limited has been incorporated with effect from May 23, 2025, which is 100% held by Wipro Networks Pte Limited. (4) The Company, through its subsidiaries, has acquired 100% shareholding in Wipro Connected Services, Inc. (Formerly known as Harman Connected Services, Inc.) and its subsidiaries, effective December 1, 2025. (5) Wipro Digital Inc., a wholly owned subsidiary, has merged with Wipro Connected Services, Inc. (Formerly known as Harman Connected Services, Inc.), a step-down subsidiary, effective December 1, 2025. (6) Cardinal US Holdings, Inc transferred its entire ownership in Capco Consulting Services LLC to The Capital Markets Company, LLC effective March 30, 2026. (7) Capco RISC Consulting LLC merged with The Capital Markets Company, LLC effective March 30, 2026. (8) Cardinal US Holdings, Inc. merged with Wipro IT Services, LLC effective March 31, 2026. (9) Rizing Consulting USA, LLC (Formerly known as Rizing Consulting USA, Inc.) merged with Rizing LLC effective March 31, 2026. (10) Wipro Business Services LLC has been incorporated as a step down subsidiary of the Company with effect from January 20, 2026, which is 100% held by Wipro, LLC. (1) Step Subsidiary details of The Capital Markets Company LLC, HealthPlan Services, Inc., International TechneGroup Incorporated, Wipro NextGen Enterprise Inc., Rizing Intermediate Holdings, Inc., The Capital Markets Company BV, Wipro Ampion Holdings Pty Ltd, Wipro Appirio, Inc., Wipro Designit Services, Inc., Wipro do Brasil Technologia Ltda, Wipro Portugal S.A. and Harman Connected Services AB are as follows: Subsidiaries Subsidiaries Subsidiaries Country of Incorporation Holding The Capital Markets Company, USA LLC Capco Consulting (6) USA 100.00% Services LLC HealthPlan Services, Inc. USA HealthPlan Services USA 100.00% Insurance Agency, LLC International TechneGroup USA Incorporated International U.K. 100.00% TechneGroup Ltd. ITI Proficiency Ltd Israel 100.00% MechWorks S.R.L. Italy 100.00% Wipro NextGen Enterprise Inc. USA LeanSwift AB Sweden 100.00% Rizing Intermediate Holdings, Inc. USA Rizing Lanka (Private) Sri Lanka 100.00% Ltd Attune Netherlands (11) Netherlands 100.00% 26 B.V. - Rizing Solutions Canada 2025 Canada 100.00% Inc. REPORT Rizing LLC(9) USA 100.00% Rizing B.V. Netherlands 100.00% Rizing Consulting Ireland 100.00% ANNUAL Ireland Limited INTEGRATED WIPRO


LOGO

277 Notes to the Standalone Financial Statements (I in millions, except share and per share data, unless otherwise stated) Subsidiaries Subsidiaries Subsidiaries Country of Incorporation Holding Rizing Consulting Pty Ltd. Australia 100.00% Rizing Geospatial LLC USA 100.00% Rizing GmbH Germany 100.00% Rizing Limited U.K. 100.00% Rizing Pte Ltd. (11) Singapore 100.00% The Capital Markets Company BV Belgium CapAfric Consulting (Pty) South Africa 100.00% Ltd Capco Belgium BV Belgium 100.00% The Capital Markets Slovakia 15.00% Company s.r.o Capco Consultancy Thailand 0.04% (Thailand) Ltd Capco Consultancy Malaysia 100.00% (Malaysia) Sdn. Bhd Capco Consultancy Thailand 99.92% (Thailand) Ltd Capco Consulting Singapore 100.00% Singapore Pte. Ltd Capco Greece Single Greece 100.00% Member P.C Capco Poland sp. z.o.o Poland 100.00% The Capital Markets U.K. 100.00% Company (UK) Ltd Capco Consultancy Thailand 0.04% (Thailand) Ltd The Capital Markets Hong Kong 0.01% Company Limited The Capital Markets Germany 100.00% Company GmbH Capco Austria GmbH Austria 100.00% The Capital Markets Hong Kong 99.99% Company Limited The Capital Markets Canada 100.00% Company Limited Capco Brasil Serviços E Brazil 0.01% Consultoria Ltda The Capital Markets Switzerland 100.00% Company S.á.r.l Andrion AG Switzerland 100.00% The Capital Markets France 100.00% Company S.A.S The Capital Markets Slovakia 85.00% Company s.r.o


LOGO

278 STATUTORY REPORTS AND FINANCIAL STATEMENTS STANDALONE FINANCIAL STATEMENT UNDER IND AS Notes to the Standalone Financial Statements (I in millions, except share and per share data, unless otherwise stated) Subsidiaries Subsidiaries Subsidiaries Country of Incorporation Holding Wipro Ampion Holdings Pty Ltd Australia Wipro Revolution IT Pty Australia 100.00% Ltd Wipro Shelde Australia Australia 100.00% Pty Ltd Wipro Appirio, Inc. USA Wipro Appirio (Ireland) Ireland 100.00% Limited Wipro Appirio UK Limited U.K. 100.00% Topcoder, LLC USA 100.00% Wipro Designit Services, Inc. USA Wipro Designit Services Ireland 100.00% Limited Wipro do Brasil Technologia Ltda Brazil Wipro do Brasil Servicos Brazil 100.00% Ltda Wipro Do Brasil Sistemas Brazil 96.84% De Informatica Ltda Wipro Portugal S.A. Portugal Wipro do Brasil Brazil 0.56% Technologia Ltda Wipro Do Brasil Sistemas Brazil 3.09% De Informatica Ltda Wipro Technologies Germany 85.13% GmbH Wipro Business (11) Germany 100.00% Solutions GmbH Wipro IT Services Austria Austria 100.00% GmbH Harman Connected Services AB Sweden Harman Connected Services Solutions China 100.00% (Chengdu) Co. Ltd. (11) Step Subsidiary details of Attune Netherlands B.V., Rizing Pte Ltd. and Wipro Business Solutions GmbH are as follows: Subsidiaries Subsidiaries Subsidiaries Country of Incorporation Holding Attune Netherlands B.V. Netherlands Rizing Germany GmbH Germany 100.00%—26 Attune Italia S.R.L Italy 100.00% 2025 Attune UK Ltd. U.K. 100.00% Rizing Pte Ltd. Singapore REPORT Rizing New Zealand Ltd. New Zealand 100.00% Rizing Philippines Inc. Philippines 100.00% Rizing SDN BHD Malaysia 100.00% ANNUAL Rizing Solutions Pty Ltd Australia 100.00% Wipro Business Solutions GmbH Germany Wipro Technology Romania 100.00% INTEGRATED Solutions S.R.L WIPRO


LOGO

279 Notes to the Standalone Financial Statements (I in millions, except share and per share data, unless otherwise stated) As at March 31, 2026, Wipro, LLC held 43.7% interest in Drivestream Inc., incorporated in the USA, and Wipro IT Services LLC held 27% interest in SDVerse LLC, incorporated in the USA, accounted for using the equity method. The list of controlled trusts are: Name of the entity Country of incorporation Wipro Equity Reward Trust India Wipro Foundation India Vide the order dated June 06, 2025, the Hon’ble National Company Law Tribunal, Bengaluru bench, approved the scheme of amalgamation for the merger of wholly owned subsidiaries Wipro HR Services India Private Limited, Wipro Overseas IT Services Private Limited, Wipro Technology Product Services Private Limited, Wipro Trademarks Holding Limited and Wipro VLSI Design Services India Private Limited with Wipro Limited. As per the said scheme, the appointed date is April 1, 2025. The other related parties are: Name of the related parties: Nature Azim Premji Foundation Entity controlled by Promoters Azim Premji Foundation for Development Entity controlled by Promoters Hasham Traders Entity controlled by Promoters Prazim Traders Entity controlled by Promoters Zash Traders Entity controlled by Promoters Hasham Investment and Trading Co. Pvt. Ltd Entity controlled by Promoters Azim Premji Philanthropic Initiatives Pvt. Ltd Entity controlled by Promoters Azim Premji Trust Entity controlled by Promoters Azim Premji Trustee Company Pvt Ltd Entity controlled by Promoters Azim Premji Safe Deposit Pvt Ltd Entity controlled by Promoters Hasham Premji Pvt Ltd Entity controlled by Promoters PI Opportunities Fund I Entity controlled by Promoters PI Opportunities Fund II Entity controlled by Promoters Apex Trust Entity controlled by Promoters Napean Trading and Investment Company (Singapore) Pte Ltd Entity controlled by Promoters Pioneer Private Trust Entity controlled by Promoters Pioneer Investment Fund Entity controlled by Promoters Azim Premji Trust Services Pvt Ltd Entity controlled by Promoters Pl International Holdings LLC Entity controlled by Promoters Azim Premji Custodial & Management Service Private Limited Entity controlled by Promoters Azim Premji Education Trust Entity controlled by Promoters Prazim Trading & Investment Company Private Limited Entity controlled by Promoters Nina Investment & Estates Pvt. Ltd. Entity controlled by Promoters Varsha Investment & Estates Pvt. Ltd. Entity controlled by Promoters Bharti Investment & Estates Pvt. Ltd. Entity controlled by Promoters Napean Opportunities LLP Entity controlled by Promoters Best Value Chem Private Limited Entity controlled by Promoters PI Investment Advisory LLP Entity controlled by Promoters


LOGO

280 STATUTORY REPORTS AND FINANCIAL STATEMENTS STANDALONE FINANCIAL STATEMENT UNDER IND AS Notes to the Standalone Financial Statements (I in millions, except share and per share data, unless otherwise stated) Name of the related parties: Nature WEPL Family Trust Entity controlled by Promoters Hygienic Research Institute Private Limited Entity controlled by Promoters Wipro Enterprises (P) Limited and its subsidiaries Entity controlled by Promoters Azim Premji University Entity controlled by Promoters PI Opportunities Fund I Scheme II Entity controlled by Promoters PI Opportunities AIF V LLP Entity controlled by Promoters Vidyaniti LLP Entity controlled by Promoters Pioneer Investment Fund Scheme II Entity controlled by Promoters Tariq Azim Premji Trust Entity controlled by Promoters Pioneer Independent Trust Entity controlled by Promoters Central Camera Co. Pvt. Ltd. Entity controlled by Promoters Gem Photographic (India) Pvt. Ltd. Entity controlled by Promoters Wipro GE Healthcare Private Limited Joint Venture between Wipro Enterprises (P) Limited and General Electric S.B. Packagings Private Limited Entity with significant influence of Promoters Financial Software and Systems Private Limited Entity with significant influence of Promoters Fab India Limited Entity with significant influence of Promoters Amagi Media Labs Private Limited Entity with significant influence of Promoters Finnovation Tech Solutions Private Limited Entity with significant influence of Promoters Shubham Housing Development Finance Company Limited Entity with significant influence of Promoters Microplastics Private Limited Entity with significant influence of Promoters Comfort Grid Technologies Private Limited Entity with significant influence of Promoters TI Medical Private Limited Entity with significant influence of Promoters Indiejewel Fashions Private Limited Entity with significant influence of Promoters The Woodenstreet Furnitures Private Limited Entity with significant influence of Promoters SBI General Insurance Company Limited Entity with significant influence of Promoters Weaver Services Private Limited Entity with significant influence of Promoters Krazybee Services Private Limited Entity with significant influence of Promoters Post-employment benefit plans 26 Wipro Information Technology Limited Provident Fund Trust Post-employment benefit plans - 2025 Wipro Systems Provident Fund Trust Post-employment benefit plans Wipro Limited Management Employees Pension Fund Post-employment benefit plans REPORT Wipro Limited BPO Division Employees Superannuation Trust Post-employment benefit plans Wipro Infotech Limited Management Employees Pension Fund Post-employment benefit plans ANNUAL Wipro Limited Employees Superannuation Fund Post-employment benefit plans Wipro Limited Employees Gratuity Fund Post-employment benefit plans INTEGRATED Wipro Limited BPO Division Employees Gratuity Trust Post-employment benefit plans WIPRO


LOGO

281 Notes to the Standalone Financial Statements (I in millions, except share and per share data, unless otherwise stated) Name of the related parties: Nature Key management personnel Azim H. Premji Non-Executive, Non-Independent Director (designated as “Founder Chairman”)(1) Rishad A. Premji     Chairman of the Board (designated as “Executive Chairman”) Srinivas Pallia Chief Executive Officer and Managing Director Aparna C. Iyer Chief Financial Officer Päivi Rekonen Independent Director N. S. Kannan Independent Director Dr. Patrick J. Ennis     Independent Director(2) Patrick Dupuis  Independent Director(2) Laura Marie Miller Independent Director(3) Deepak M. Satwalekar Independent Director Tulsi Naidu Independent Director M. Sanaulla Khan Company Secretary (1) Mr. Azim H. Premji is the ultimate controlling party. (2) Dr. Patrick J. Ennis and Mr. Patrick Dupuis retired from their positions as Independent Directors of the Company with effect from the close of business hours on March 31, 2026. (3) On March 5, 2026, the Board of Directors approved the appointment of Ms. Laura Marie Miller as an Additional Director in the capacity of Independent Director for a term of five years, with effect from April 1, 2026 to March 31, 2031, subject to the approval of the Members of the Company. The appointment was approved by the Members of the Company vide special resolution dated May 21, 2026, passed through postal ballot by e-voting. Close members of Key management personnel: - Yasmeen A. Premji - Tariq A. Premji - Aditi Mehta Premji - Avita Hazarika


LOGO

282 STATUTORY REPORTS AND FINANCIAL STATEMENTS STANDALONE FINANCIAL STATEMENT UNDER IND AS Notes to the Standalone Financial Statements (I in millions, except share and per share data, unless otherwise stated) The Company has the following related party transactions: Entities controlled by/ Key Associate/ Subsidiaries/ Other related with significant management Joint venture of Trusts parties influence of personnel subsidiaries Promoters Transaction for the year ended March 31, 2026 Sale of goods and services I 112,992 I 358 I—I 7 I -Purchase of goods and services 60,455 170 — -Items of property, plant and 7 145 — -equipments purchased Items of property, plant and 1 — —equipments sold Dividend paid(1)—78,692 5,097 — Dividend received 11,062 — —Commission paid 1,450 — —Rent paid 505—12 —Rental income 386 6 — -Sale of investments ——181 -Advance paid—50 — - Others(2) 7,771 20 — - Bad debt written off 890 — —Corporate guarantee given 10,887 — —Corporate guarantee 349 — —commission Contribution to post employment — — 7,058 benefit plans Contribution to Gratuity trust — — 5,220 Investment in wholly owned 33,548 — —subsidiary Key management personnel(3) Remuneration and short-term (4) I—I—I 525 I—I -benefits - 26 2025 Other benefits(5) — 278 — REPORT Balance as at March 31, 2026 Receivables I 14,492 I 264 I—I—I - Less: Provision for expected 827 — — ANNUAL credit loss Net Receivables 13,665 264 — - INTEGRATED Payables 18,479—139 — WIPRO


LOGO

283 Notes to the Standalone Financial Statements (I in millions, except share and per share data, unless otherwise stated) Entities controlled Associate/ Subsidiaries/ by/with significant Key management Other related Joint venture of Trusts influence of personnel parties subsidiaries Promoters Transaction for the year ended March31,2025 Sale of goods and services I 111,448 I 305 I—I—I -Purchase of goods and services 51,201 423 — -Items of property, plant and - 155 — -equipments purchased Items of property, plant and 15 — —equipments sold Dividend paid(1)—42,923 2,780 —Dividend received 5,161 — —Commission paid 1,532 — —Rent paid 322—12 —Rental income 341 31 — -Others(2) 7,895 70 — -Interest expense 1 — —Corporate guarantee commission 304 — —Contribution to post employment — — 6,517 benefit plans Investment in wholly owned 51 — —subsidiary Key management personnel(3) Remuneration and short-term (4) I—I—I 619 I—I -benefits Other benefits(5) — 290 — BalanceasatMarch31,2025 Receivables I 9,268 I 181 I—I- I -Less: Provision for expected 861 — —credit loss Net Receivables 8,407 181 — - Payables 26,744—256 — (1) Includes close members of key management personnel. (2) Others includes reimbursement. (3) Post-employment benefits and other long-term benefits including compensated absences are not disclosed, as these are determined for the Company as a whole based on actuarial valuation. (4) Remuneration and short-term benefits includes sitting fees and commission paid to non-executive directors, non-independent directors, and independent directors. (5) Other benefits include I 272 and I 284 for the years ended March 31, 2026 and 2025, respectively, towards amortisation of RSUs granted to key management personnel, which vest over a period of time. This also includes RSU’s that will vest based on performance parameters of the Company.


LOGO

284 STATUTORY REPORTS AND FINANCIAL STATEMENTS STANDALONE FINANCIAL STATEMENT UNDER IND AS Notes to the Standalone Financial Statements (I in millions, except share and per share data, unless otherwise stated) The following are the significant related party transactions during the years ended March 31, 2026 and 2025: Year ended Year ended March 31, 2026 March 31, 2025 Sale of goods and services to subsidiaries/trusts Wipro, LLC I 83,678 I 80,394 Wipro Solutions Canada Limited 4,019 5,893 Wipro Technologies GmbH 2,551 2,910 Wipro Gallagher Solutions, LLC 2,432 2,957 Wipro Arabia Limited 2,150 2,361 Infocrossing, LLC 2,081 2,004 Wipro Japan KK 1,760 1,771 Wipro Financial Outsourcing Services Limited 1,395 117 Wipro Networks Pte Limited 1,281 1,432 HealthPlan Services, Inc. 1,121 648 Wipro Information Technology Netherlands BV. 1,004 67 Wipro do Brasil Technologia Ltda 830 366 Wipro Technologies Australia Pty Ltd 761 1,153 Wipro Technologies SA DE CV 744 1,351 Wipro IT Services UK Societas 718 139 The Capital Markets Company, LLC 683 594 Wipro Appirio, Inc. 582 1,188 Wipro Technologies South Africa (Proprietary) Limited 534 596 Wipro Doha LLC 485 401 Rizing Limited 393 48 Wipro Revolution IT Pty Ltd 330 215 International TechneGroup Incorporated 320 287 Rizing Consulting USA, LLC 260 95 Wipro Holdings (UK) Limited 235 767 Rizing Germany Gmbh 227 54 The Capital Markets Company (UK) Ltd 208 69 Wipro IT Services Austria GmbH 204 75 26 Wipro NextGen Enterprise Inc. 197 247 - 2025 Edgile, LLC 196 175 Wipro CRM Services UK Limited 123 175 REPORT The Capital Markets Company GmbH 113 10 Women’s Business Park Technologies Limited 112 109 ANNUAL Wipro IT Services Poland SP Z.O.O 111 189 Wipro Technologies SDN BHD 110 123 Rizing Solutions Canada Inc. 107 470 INTEGRATED Rizing Consulting Pty Ltd. 102 283 Rizing LLC 98 662 WIPRO Wipro Bahrain Limited Co. W.L.L 84 95


LOGO

285 Notes to the Standalone Financial Statements (I in millions, except share and per share data, unless otherwise stated) Year ended Year ended March 31, 2026 March 31, 2025 PT. WT Indonesia 65 186 Wipro (Dalian) Limited 63 54 The Capital Markets Company Limited (Canada) 56 13 Rizing Lanka (Private) Ltd 53 13 Wipro Connected Services, Inc. 48—Rizing Solutions Pty Ltd 44 32 Wipro (Thailand) Co. Limited 41 29 Wipro Gulf LLC 29 92 Rizing Geospatial LLC 26 57 Rizing Consulting Ireland Limited 2 63 Wipro IT Services Bangladesh Limited ^ 115 Rizing SDN BHD ^ 55 Wipro Telecom Consulting LLC—56 Saleofgoodsandservicestoentitiescontrolledby/withsignificantinfluenceofPromoters Wipro Enterprises (P) Limited I 348 I 269 Wipro GE Healthcare Private Limited 10 36 Sale of goods and services to Associate/Joint venture of subsidiaries SDVerse LLC I 7 I - Purchase of goods and services from subsidiaries/trusts Wipro Technologies GmbH I 6,902 I 6,151 Wipro Insurance Solutions, LLC 4,997 4,434 Wipro Philippines, Inc. 3,907 3,226 Wipro Business Solutions GmbH 3,820 3,458 Wipro Technologies SA DE CV 3,520 3,958 Wipro, LLC 3,213 2,100 The Capital Markets Company (UK) Ltd 3,142 3,541 Wipro Technologies SRL 2,847 2,746 Wipro IT Services Poland SP Z.O.O 2,596 2,769 Wipro Chengdu Limited 2,501 1,433 Wipro Appirio, Inc. 1,969 1,954 Wipro Solutions Canada Limited 1,796 1,040 Wipro do Brasil Technologia Ltda 1,648 2,436 Wipro Technology Solutions S.R.L 1,478 1,445 Capco Consulting Singapore Pte. Ltd 1,343 705 Wipro (Dalian) Limited 1,035 857 Capco Technologies Private Limited 995 584 The Capital Markets Company, LLC 914 386


LOGO

286 STATUTORY REPORTS AND FINANCIAL STATEMENTS STANDALONE FINANCIAL STATEMENT UNDER IND AS Notes to the Standalone Financial Statements (I in millions, except share and per share data, unless otherwise stated) Year ended Year ended March 31, 2026 March 31, 2025 Wipro Portugal S.A. 882 860 Edgile, LLC 704 736 Rizing LLC 703 434 Applied Value Technologies, Inc. 695—Wipro Shelde Australia Pty Ltd 625 629 Wipro Information Technology Netherlands BV. 608 98 Wipro Telecom Consulting LLC 543 430 Wipro Networks Pte Limited 471 681 Designit Denmark A/S 467 650 Wipro Revolution IT Pty Ltd 459 501 Wipro Technologies W.T. Sociedad Anonima 451 303 Designit Spain Digital, S.L.U 293—Capco Poland sp. z.o.o 288 19 Wipro Shanghai Limited 287 7 Aggne Global IT Services Private Limited 276 43 International TechneGroup Incorporated 235 150 Rizing Consulting USA, LLC 207 117 Wipro NextGen Enterprise Inc. 207 27 Wipro Designit Services, Inc. 184 94 Designit Oslo A/S 181 80 Wipro Holdings (UK) Limited 180 203 Applied Value Technologies Pte. Limited 166—Designit Germany GmbH 147 20 Attune UK Ltd. 136 118 Rizing SDN BHD 133 39 The Capital Markets Company Limited (Hong Kong) 123 48 Wipro Technologies Australia Pty Ltd 117 195 The Capital Markets Company S.á.r.l 113 5 Wipro Japan KK 107 116 The Capital Markets Company S.A.S 107 - - 26 2025 Rizing Solutions Canada Inc. 94 63 Wipro VLSI Design Services, LLC 91 168 REPORT Wipro (Tianjin) Limited 89— Wipro Regional Headquarter 88 -ANNUAL Wipro Technologies South Africa (Proprietary) Limited 75 72 Rizing Consulting Pty Ltd. 72 118 Wipro Gallagher Solutions, LLC 70 22 Wipro CRM Services ApS 69 94 INTEGRATED Wipro Technologies SA 65 36 Rizing Philippines Inc. 64 11 WIPRO Wipro IT Services S.R.L. 62 1


LOGO

287 Notes to the Standalone Financial Statements (I in millions, except share and per share data, unless otherwise stated) Year ended Year ended March 31, 2026 March 31, 2025 Rizing Pte Ltd. 61 2 Wipro CRM Services 57 59 Wipro (Thailand) Co. Limited 57 51 Rizing Germany Gmbh 57 13 Wipro 4C Consulting France SAS 55 106 Wipro Appirio UK Limited 55 72 Rizing Limited 54 18 Wipro IT Services UK Societas 51 2 The Capital Markets Company GmbH 46 1 Designit T.L.V Ltd. 46—Aggne Global Inc. 43 18 Rizing Solutions Pty Ltd 36 1 Wipro CRM Services UK Limited 35 74 Wipro Arabia Limited 32 52 Capco RISC Consulting LLC—134 HealthPlan Services, Inc.—23 Purchaseofgoodsandservicesfromentitiescontrolledby/withsignificant influence of Promoters Wipro Pari GmbH I 88 I 409 SBI General Insurance Company Limited 82—Wipro Pari Private limited—11 Wipro Enterprises (P) Limited—3 Itemsofproperty,plantandequipmentspurchasedfromSubsidiaries/Trusts Wipro Business Solutions GmbH I 7 I - Itemsofproperty,plantandequipmentspurchasedfromentitiescontrolledby/with significant influence of Promoters Wipro Enterprises (P) Limited I 142 I 155 Wipro Pari Private Limited 3 - Items of property, plant and equipments sold to subsidiaries/trusts Wipro Technologies Australia Pty Ltd I 1 I—Wipro IT Services UK Societas—9 Capco Technologies Private Limited—5 Capco Consulting Singapore Pte. Ltd—1 Dividendpaidtoentitiescontrolledby/withsignificantinfluenceofPromoters Zash Traders I 24,224 I 12,487 Prazim Traders 23,763 12,248


LOGO

288 STATUTORY REPORTS AND FINANCIAL STATEMENTS STANDALONE FINANCIAL STATEMENT UNDER IND AS Notes to the Standalone Financial Statements (I in millions, except share and per share data, unless otherwise stated) Year ended Year ended March 31, 2026 March 31, 2025 Hasham Traders 20,755 10,607 Azim Premji Trust 7,484 6,379 Prazim Trading & Investment Company Private Limited 2,131 1,020 Azim Premji Philanthropic Initiatives Pvt. Ltd 305 166 Hasham Investment and Trading Co. Pvt. Ltd 30 16 Dividend paid to Key management personnel Azim H. Premji I 4,743 I 2,587 Rishad A. Premji 149 81 Tariq A. Premji 146 80 Yasmeen A. Premji 55 31 Srinivas Pallia 2 1 Aparna C. Iyer 1 ^ M. Sanaulla Khan 1 ^ Dividend received from subsidiaries/trusts Wipro IT Services UK Societas I 8,519 I 4,288 Capco Technologies Private Limited 1,580—Wipro Networks Pte Limited 610 840 Attune Consulting India Private Limited 200—Wipro Chengdu Limited 106 33 Wipro Japan KK 47 - Commission paid to subsidiaries/trusts Wipro Technologies Gmbh I 1,107 I 1,115 Wipro Japan KK 267 286 Wipro Travel Services Limited 75 69 Wipro Technologies Nigeria Limited 1 6 Wipro Information Technology Netherlands BV. ^ 56 - 26 2025 Rent paid to subsidiaries/trusts Wipro IT Services UK Societas I 162 I 22 REPORT Wipro Technologies Australia Pty Ltd 160 88 Wipro, LLC 57 54 ANNUAL Wipro Japan KK 53 62 Designit Oslo A/S 29 26 The Capital Markets Company Limited (Canada) 24 18 INTEGRATED Wipro IT Services Austria GmbH 11 10 The Capital Markets Company (UK) Ltd 6 6 WIPRO Designit Denmark A/S 2 4


LOGO

289 Notes to the Standalone Financial Statements (I in millions, except share and per share data, unless otherwise stated) Year ended Year ended March 31, 2026 March 31, 2025 The Capital Markets Company Limited (Hong Kong) 1 1 Wipro Holdings (UK) Limited—30 Designit A/S—1 Rent paid to Key management personnel Azim H. Premji I 12 I 12 Rental income from subsidiaries/trusts Capco Technologies Private Limited I 154 I 146 The Capital Markets Company S.A.S 50—Wipro, LLC 40 76 Capco Consulting Singapore Pte. Ltd 31 22 Designit Denmark A/S 18—Wipro Technologies GmbH 17—Wipro Travel Services Limited 13 12 Rizing SDN BHD 13 9 Capco Consultancy (Malaysia) Sdn. Bhd 13 7 Wipro VLSI Design Services, LLC 8 55 Wipro Business Solutions GmbH 7—Capco Consulting Middle East FZE 7—Wipro Gallagher Solutions, LLC 6—Wipro Information Technology Netherlands BV. 5 3 Wipro 4C Consulting France SAS 4 8 Wipro CRM Services UK Limited—2 Wipro Appirio UK Limited—1 Rentalincomefromentitiescontrolledby/withsignificantinfluenceofPromoters Wipro Enterprises (P) Limited I 6 I 7 PI Investment Advisory LLP—24 Sale of investments to Associate/Joint venture of subsidiaries Drivestream Inc. I 181 I - Advancespaidtoentitiescontrolledby/withsignificantinfluenceofPromoters SBI General Insurance Company Limited I 50 I - Others transactions with subsidiaries/trusts Wipro, LLC I 1,935 I 2,161 HealthPlan Services, Inc. 1,856 1,135 Infocrossing, LLC 1,051 617


LOGO

290 STATUTORY REPORTS AND FINANCIAL STATEMENTS STANDALONE FINANCIAL STATEMENT UNDER IND AS Notes to the Standalone Financial Statements (I in millions, except share and per share data, unless otherwise stated) Year ended Year ended March 31, 2026 March 31, 2025 Wipro Financial Outsourcing Services Limited 906 25 The Capital Markets Company, LLC 482 178 Wipro Gallagher Solutions, LLC 425 280 Rizing LLC 335 410 Capco Consulting Services LLC 285 50 Wipro Designit Services, Inc. 264 353 Wipro Technologies SA DE CV 219 208 International TechneGroup Incorporated 211 119 Wipro Technologies SRL 196 197 Edgile, LLC 182 225 The Capital Markets Company (UK) Ltd 179 170 Wipro Technologies GmbH 160 185 Wipro IT Services UK Societas 134 (13) Wipro Telecom Consulting LLC 132 125 Wipro IT Services Poland SP Z.O.O 124 92 Wipro Insurance Solutions, LLC 109 70 Wipro Appirio, Inc. 89 122 Rizing Solutions Canada Inc. 88 18 Wipro Arabia Limited 87 124 Wipro NextGen Enterprise Inc. 77 112 Rizing Consulting USA, LLC 70 66 Attune UK Ltd. 51 (41) Wipro Regional Headquarter 40 7 Wipro Portugal S.A. 35 39 Wipro Revolution IT Pty Ltd 34 3 Rizing Limited 34 (13) Capco Consulting Singapore Pte. Ltd 33 41 Wipro Technologies South Africa (Proprietary) Limited 29 61 Capco Technologies Private Limited 29 (20) The Capital Markets Company S.A.S 25 (7) - 26 2025 Rizing Geospatial LLC 24 30 International TechneGroup Ltd. 21 27 REPORT Wipro IT Services, LLC 21 364 Cardinal US Holdings, Inc. 18 5 ANNUAL The Capital Markets Company Limited (Canada) 15 35 Wipro Information Technology Netherlands BV. 11 33 Wipro Technologies Australia Pty Ltd 7 24 The Capital Markets Company S.á.r.l 4 27 INTEGRATED LeanSwift AB—53 WIPRO Capco RISC Consulting LLC—35


LOGO

291 Notes to the Standalone Financial Statements (I in millions, except share and per share data, unless otherwise stated) Year ended Year ended March 31, 2026 March 31, 2025 The Capital Markets Company s.r.o (75)—Wipro Solutions Canada Limited (153) 150 Wipro Philippines, Inc. (182) 1,169 Wipro Travel Services Limited (1,901) (1,578) Otherstransactionswithentitiescontrolledby/withsignificantinfluenceofPromoters Wipro Enterprises (P) Limited I 8 I 9 Wipro Pari Private limited 6 2 Azim Premji Foundation 5 2 Azim Premji Philanthropic Initiatives Pvt. Ltd 1 1 Azim Premji Education Trust ^ ^ PI Investment Advisory LLP—^ Interest paid to subsidiaries/trusts Wipro IT Services UK Societas I—I 1 Bad Debt Written off of subsidiaries/Trust Wipro IT Services Bangladesh Limited I 890 I - Corporate guarantee given to subsidiaries/Trust Wipro Technologies Gmbh I 10,887 I - Corporate guarantee commission from subsidiaries/trusts Wipro IT Services, LLC I 176 I 167 Wipro, LLC 94 89 Wipro Financial Outsourcing Services Limited 30 27 Wipro Technologies GmbH 27 1 Rizing Solutions Canada Inc. 20 18 Rizing Solutions Pty Ltd 2 2 Contribution to post employment benefit plans Wipro Systems Provident Fund Trust I 7,058 I 6,517 Contribution to Gratuity trust Wipro Limited Employees Gratuity Fund I 5,220 I - Investment in wholly owned subsidiary Wipro, LLC I 33,548 I—Wipro, Inc.—51


LOGO

292 STATUTORY REPORTS AND FINANCIAL STATEMENTS STANDALONE FINANCIAL STATEMENT UNDER IND AS Notes to the Standalone Financial Statements (I in millions, except share and per share data, unless otherwise stated) Year ended Year ended March 31, 2026 March 31, 2025 Remuneration paid to Key management personnel Azim H. Premji(1) I 11 I 11 Rishad A. Premji 73 138 Srinivas Pallia 496 536 Aparna C. Iyer 67 72 Patrick Dupuis(2) 26 27 Tulsi Naidu(2) 26 22 M. Sanaulla Khan 25 30 Dr. Patrick J. Ennis(2) 25 24 Deepak M. Satwalekar(2) 20 18 Paivi Rekonen(2) 20 18 N. S. Kannan(2) 14 13 Receivables from subsidiaries/trusts Wipro, LLC I 6,320 I—Wipro Financial Outsourcing Services Limited 1,447—Wipro Arabia Limited 815 3,260 Wipro IT Services Bangladesh Limited 801 1,421 Wipro Japan KK 596 32 Infocrossing, LLC 474 111 HealthPlan Services, Inc. 377—The Capital Markets Company, LLC 356 174 Wipro Technologies Nigeria Limited 319 269 Wipro Gallagher Solutions, LLC 310 268 Capco Consulting Services LLC 278 6 Women’s Business Park Technologies Limited 150 736 Wipro IT Services UK Societas 129—Wipro Connected Services, Inc. 122—Wipro Doha LLC 121 - 26 HealthPlan Services Insurance Agency, LLC 118 — 2025 The Capital Markets Company GmbH 118 1 Wipro Networks Pte Limited 102 17 REPORT Rizing Consulting USA, LLC 101 38 International TechneGroup Incorporated 64 4 ANNUAL Wipro Technologies South Africa (Proprietary) Limited 63 119 Rizing SDN BHD 54 7 Wipro IT Services, LLC 47 42 INTEGRATED Rizing Limited 45 15 Wipro IT Services Austria GmbH 38 - WIPRO


LOGO

293 Notes to the Standalone Financial Statements (I in millions, except share and per share data, unless otherwise stated) Year ended Year ended March 31, 2026 March 31, 2025 Wipro Technologies SDN BHD 33 17 Wipro Technologies Australia Pty Ltd 29 640 Wipro Designit Services, Inc. 14 320 Wipro CRM Services UK Limited 8 41 Wipro Gulf LLC 1 51 Wipro Solutions Canada Limited—443 Rizing Solutions Canada Inc.—141 Wipro NextGen Enterprise Inc.—40 Payable to subsidiaries/trusts Wipro Business Solutions GmbH I 4,799 I 3,762 Wipro Philippines, Inc. 3,099 3,007 Wipro Technologies GmbH 2,298 1,312 Wipro IT Services Poland SP Z.O.O 1,282 1,897 Wipro Holdings (UK) Limited 876 732 Wipro Chengdu Limited 744 425 Wipro Solutions Canada Limited 518—Wipro Insurance Solutions, LLC 435 378 Wipro Technologies SRL 419 447 Wipro Technology Solutions S.R.L 386 491 Wipro (Dalian) Limited 352 179 Capco Technologies Private Limited 297 86 Capco Consulting Singapore Pte. Ltd 294 242 Wipro Technologies W.T. Sociedad Anonima 253 52 Wipro Technologies SA DE CV 228—Wipro (Thailand) Co. Limited 197 122 Rizing LLC 168 72 Wipro do Brasil Technologia Ltda 142 1,580 Wipro Shanghai Limited 135 7 Applied Value Technologies, Inc. 99—The Capital Markets Company S.á.r.l 94—Edgile, LLC 94 285 Wipro Technologies SA 91 104 Wipro (Tianjin) Limited 90—The Capital Markets Company Limited (Hong Kong) 84 36 Wipro Appirio, Inc. 79 166 The Capital Markets Company s.r.o 78—Wipro Travel Services Limited 74 45 Wipro Shelde Australia Pty Ltd 73 51 Capco Poland sp. z.o.o 71 16


LOGO

294 STATUTORY REPORTS AND FINANCIAL STATEMENTS STANDALONE FINANCIAL STATEMENT UNDER IND AS Notes to the Standalone Financial Statements (I in millions, except share and per share data, unless otherwise stated) Year ended Year ended March 31, 2026 March 31, 2025 Wipro NextGen Enterprise Inc. 70—Wipro Portugal S.A. 68 383 Aggne Global IT Services Private Limited 63 25 Rizing Pte Ltd. 56—Wipro Telecom Consulting LLC 46 41 Designit Denmark A/S 37 128 The Capital Markets Company (UK) Ltd 19 778 Attune UK Ltd. 7 81 Wipro, LLC—9,275 Wipro Doha LLC—83 Wipro Information Technology Netherlands BV.—58 Wipro Financial Outsourcing Services Limited—161 HealthPlan Services, Inc.—56 Receivablesfromentitiescontrolledby/withsignificantinfluenceofPromoters Wipro Enterprises (P) Limited I 228 I 148 SBI General Insurance Company Limited 17—Wipro Pari Private limited 12 4 PI Investment Advisory LLP 3 4 Azim Premji Foundation 3 3 Wipro GE Healthcare Private Limited—21 Azim Premji Philanthropic Initiatives Pvt. Ltd—1 Payable to key management personnel Azim H. Premji I 3 I 3 Rishad A. Premji 2 70 Srinivas Pallia 99 149 Aparna C. Iyer 1 3 M. Sanaulla Khan 1 2 26 Päivi Rekonen 5 4—2025 Dr. Patrick J. Ennis 6 6 Patrick Dupuis 7 7 REPORT Deepak M. Satwalekar 5 4 Tulsi Naidu 7 5 ANNUAL N. S. Kannan 3 3 Number of bonus shares issued to key management personnel INTEGRATED Azim H. Premji—215,578,357 Rishad A. Premji—6,768,891 Tariq A. Premji—6,619,215 WIPRO Srinivas Pallia—100,000


LOGO

295 Notes to the Standalone Financial Statements (I in millions, except share and per share data, unless otherwise stated) Year ended Year ended March 31, 2026 March 31, 2025 Aparna C. Iyer—16,751 M. Sanaulla Khan—20,200 Yasmeen A. Premji—2,559,378 Numberofbonussharesissuedtoentitiescontrolledby/withsignificantinfluenceof Promoters Zash Traders—1,040,566,791 Hasham Traders—883,913,365 Prazim Traders—1,020,648,973 Azim Premji Trust—531,592,983 Hasham Investment and Trading Co. Pvt. Ltd—1,355,953 Prazim Trading & Investment Company Private Limited—84,954,128 Azim Premji Philanthropic Initiatives Pvt. Ltd—13,862,415 ^ Value is less than I 0.5 (1) Includes sitting fees and commission paid to Non-Executive, Non-Independent Director. (2) Includes sitting fees and commission paid to Independent Directors. All related party transactions were entered at an arm’s length basis and in the ordinary course of business. There are no materially significant related party transactions made by the Company with promoters, directors or key management personnel, which may have a potential conflict with the interests of the Company at large.


LOGO

296 STATUTORY REPORTS AND FINANCIAL STATEMENTS STANDALONE FINANCIAL STATEMENT UNDER IND AS Notes to the Standalone Financial Statements (I in millions, except share and per share data, unless otherwise stated) 33. ANALYTICAL RATIOS March March Ratio Measured In Numerator Denominator Variance 31, 2026 31, 2025 Current Current ratio times Current assets 2.42 2.72 (11.03)% liabilities Debt-equity ratio times Debt(1) Total equity 0.13 0.12 8.33% Debt service coverage Earnings available (3) times (2) Debt service 0.66 0.75 (12.00)% ratio for debt service Average total Return on equity % Profit for the year 19.08% 17.93% 1.15% equity Inventory turnover Average (5) times Sale of products 7.06 2.14 229.91% ratio inventory Trade receivable Revenue from Average trade times 8.04 8.26 (2.66)% turnover ratio operations receivables Purchase of Trade payables technical services, Average trade times 2.84 2.69 5.58% turnover ratio software licenses payables and other expenses Net capital turnover Revenue from Average times 1.90 1.90 0.00% ratio operations working capital Revenue from Net profit ratio % Profit for the year 17.00% 15.91% 1.09% operations Return on capital Earnings before Capital % (4) 23.91% 22.13% 1.78% employed interest and tax employed Time weighted Income generated Return on investment % average 7.33% 8.02% (0.69)% from investments investments (1) Debt consists of borrowings and lease liabilities. (2) Profit for the year, adjusted for non cash operating expenses, finance costs and other expenses such as provision for diminution in value of investments in subsidiaries and loss on sale of property, plant and equipment. (3) Debt service consists of gross repayment of borrowings, lease liabilities and interest and finance costs paid. (4) Capital employed consists of tangible net worth, borrowings, lease liabilities and deferred tax liabilities. (5) Increase in inventory turnover ratio is due to increase in product revenue during the year ended March 31, 2026 34. COMMITMENTS AND CONTINGENCIES - 26 Capital commitments: As at March 31, 2026 and 2025, the Company had committed to spend approximately I 8,990 2025 and I 8,266, respectively, under agreements to purchase/construct property and equipment. These amounts are net of capital advances paid in respect of these purchases. Refer to Note 8 for uncalled capital commitments on REPORT investment in equity instruments. ANNUAL Contingent liabilities to the extent not provided for: As at As at March 31, 2026 March 31, 2025 INTEGRATED Guarantees given by the banks on behalf of the Company I 10,197 I 10,472 Guarantees given by the Company on behalf of subsidiaries 74,635 67,300 WIPRO


LOGO

297 Notes to the Standalone Financial Statements (I in millions, except share and per share data, unless otherwise stated) Contingencies and lawsuits: The Company is subject to legal proceedings and claims resulting from tax assessment orders/penalty notices issued under the Income Tax Act, 1961, which have arisen in the ordinary course of its business. Some of the claims involve complex issues and it is not possible to make a reasonable estimate of the expected financial effect, if any, that will result from ultimate resolution of such proceedings. However, the resolution of these legal proceedings is not likely to have a material and adverse effect on the results of operations or the financial position of the Company. The Company’s assessments are completed for the years up to March 31, 2022. The Company has received demands on multiple tax issues. These claims are primarily arising out of denial of deduction under section 10A of the Income Tax Act, 1961 in respect of profit earned by the Company’s undertaking in Software Technology Park at Bengaluru, the appeals filed against the said demand before the appellate authorities have been allowed in favor of the Company by the second appellate authority for the years up to March 31, 2008 which either has been or may be contested by the Income tax authorities before the Supreme Court of India. Other claims relate to disallowance of tax benefits on profits earned from Software Technology Park and Special Economic Zone units, capitalisation of research and development expenses, transfer pricing adjustments on intercompany/inter unit transactions and other issues. Income tax claims against the Company amounting to I 103,344 and I 99,291 are not acknowledged as debt as at March 31, 2026 and 2025, respectively. These matters are pending before various appellate authorities and the management expects its position will likely be upheld on ultimate resolution and will not have a material adverse effect on the Company’s financial position and results of operations. The contingent liability in respect of disputed demands for excise duty, custom duty, sales tax and other matters amounting to I 20,447 and I 19,292 as of March 31, 2026 and 2025, respectively. However, the resolution of these disputed demands is not likely to have a material and adverse effect on the results of operations or the financial position of the Company. 35.CORPORATESOCIALRESPONSIBILITY a. Gross amount required to be spent by the Company is I 2,042 and I 1,973 for the years ended March 31, 2026 and 2025, respectively. b. Amount spent during the year on: FortheyearendedMarch31,2026 Yet to be In Cash Total paid in Cash (i) Construction/acquisition of any asset I— I— I—(ii) On purposes other than above (i) above 2,238 36 2,274 Total amount spent during the year I 2,238 I 36 I 2,274 For the year ended March 31, 2025 Yet to be In Cash Total paid in Cash (i) Construction/acquisition of any asset I— I— I—(ii) On purposes other than above (i) above 2,009 46 2,055 Total amount spent during the year I 2,009 I 46 I 2,055 During the years ended March 31, 2026 and 2025, the Company contributed I 513 and I 416 respectively, to Wipro Foundation a trust controlled by the Company. There is no shortfall out of the amount required to be spent by the Company during the years ended March 31, 2026 and 2025.


LOGO

298 STATUTORY REPORTS AND FINANCIAL STATEMENTS STANDALONE FINANCIAL STATEMENT UNDER IND AS Notes to the Standalone Financial Statements (I in millions, except share and per share data, unless otherwise stated) The nature of corporate social responsibility activities undertaken by the Company for the years ended March 31, 2026 and 2025 includes systemic reforms in education, access to education for the under privileged as well as children with disabilities, sustainability education, higher education skill building, sustainability initiatives and healthcare. 36. PAYMENTS TO THE AUDITOR Year ended Year ended March 31, 2026 March 31, 2025 Auditors’ remuneration Audit fees I 102 I 99 Other services 26 28 Out of pocket expenses 8 8 I 136 I 135 37.SEGMENTINFORMATION The Company publishes these standalone financial statements along with the consolidated financial statements. In accordance with Ind AS 108, Operating Segments, the Company has disclosed the segment information in the consolidated financial statements. 38. Vide its order dated June 06, 2025, the Hon’ble National Company Law Tribunal, Bengaluru bench, approved the scheme of amalgamation for the merger of wholly owned subsidiaries Wipro HR Services India Private Limited, Wipro Overseas IT Services Private Limited, Wipro Technology Product Services Private Limited, Wipro Trademarks Holding Limited and Wipro VLSI Design Services India Private Limited with Wipro Limited. As per the said scheme, the appointed date is April 1, 2025. The Scheme has been accounted for under the “Pooling of Interests Method” as prescribed under Appendix C of Ind AS 103, “Business Combinations” as per the terms of the court order. Prior period numbers have been restated to give effect as if this merger had occurred from the beginning of the preceding period in the financial statements i.e. April 1, 2024. Accordingly, the carrying value of assets, liabilities and reserves pertaining to these entities as appearing in the consolidated financials statements of Wipro Limited has been recognised in the standalone financial statements of Wipro Limited on account of merger effective April 1, 2024. 39. On November 21, 2025, the Government of India notified four labour codes (the “Labour Codes”), effective immediately, replacing the existing 29 labour laws. In accordance with Ind AS 19, employee benefits and changes to employee benefit plans arising from legislative amendments are treated as plan amendments, requiring immediate recognition of past service cost in the Statement of Profit and Loss. This approach is consistent with the guidance—26 issued by the Institute of Chartered Accountants of India. 2025 The Company has concluded the salary restructuring exercise in compliance with the Labour Codes. The REPORT implementation of the Labour Codes has resulted in a net increase of I 2,562 in the provision for gratuity and remeasurement of leave encashment, which has been recognised as employee benefit expense in the current year. The Company continues to monitor the finalisation of Central and State Rules, as well as Government clarifications ANNUAL on other aspects of the Labour Codes. INTEGRATED WIPRO


LOGO

299 Notes to the Standalone Financial Statements (I in millions, except share and per share data, unless otherwise stated) 40. EVENTS AFTER THE REPORTING PERIOD On April 16, 2026, the Company’s Board of Directors approved a proposal to buyback of equity shares, subject to the approval of shareholders, for purchase by the Company of up to 600,000,000 equity shares of I 2 each (being 5.7% of total number of equity shares) from the shareholders of the Company on a proportionate basis by way of a tender offer at a price of I 250 per equity share for an aggregate amount not exceeding I 150,000, in accordance with the provisions contained in the SEBI (Buy-back of Securities) Regulations, 2018, as amended and the Companies Act, 2013 and rules made thereunder. This proposal was approved by the shareholders of the Company by way of a special resolution dated May 21, 2026, passed through postal ballot by e-voting. As per our report of even date attached For and on behalf of the Board of Directors for Deloitte Haskins & Sells LLP Rishad A. Premji Deepak M. Satwalekar Srinivas Pallia Chartered Accountants Chairman Director Chief Executive Officer and Firm’s Registration No.: 117366W/W—100018 (DIN: 02983899) (DIN: 00009627) Managing Director (DIN: 10574442) Anand Subramanian Aparna C. Iyer M. Sanaulla Khan Partner Chief Financial Officer Company Secretary Membership No.: 110815 Membership No.: F4129 Bengaluru June 2, 2026


LOGO

300 STATUTORY REPORTS AND FINANCIAL STATEMENTS CONSOLIDATED FINANCIAL STATEMENT UNDER IND AS To The Members of Wipro Limited Report on the Audit of the Consolidated Financial Statements OPINION We have audited the accompanying Consolidated Financial Statements of Wipro Limited (the “Company”) and its subsidiaries, (the Company and its subsidiaries together referred to as the “Group”) which comprise the Consolidated Balance Sheet as at March 31, 2026, and the Consolidated Statement of Profit and Loss including Other Comprehensive Income, the Consolidated Statement of Changes in Equity and the Consolidated Statement of Cash Flows for the year ended on that date, and notes to the financial statements, including a summary of material accounting policies and other explanatory information. In our opinion and to the best of our information and according to the explanations given to us, the aforesaid Consolidated Financial Statements give the information required by the Companies Act, 2013 (the “Act”) in the manner so required and give a true and fair view in conformity with the accounting principles generally accepted in India, including Ind AS specified under section 133 of the Act, of the consolidated state of affairs of the Group as at March 31, 2026, and it’s consolidated profit, consolidated Report other comprehensive income, consolidated changes in equity and consolidated cash flows for the year ended on that date. BASIS FOR OPINION We conducted our audit of the Consolidated Financial Statements in accordance with the Standards on Auditing (“SA”s) specified under section 143 (10) of the Act. Our responsibilities under those Standards are further described in the Auditor’s Auditor’s Responsibility for the Audit of the Consolidated Financial Statements section of our report. We are independent of the Group in accordance with the Code of Ethics issued by the Institute of Chartered Accountants of India (“ICAI”) together with the ethical requirements that are relevant to our audit of the Consolidated Financial Statements under the provisions of the Act and the Rules made thereunder, and we have fulfilled our other ethical responsibilities in accordance with these requirements and the ICAI’s Code of Ethics. We believe that the audit evidence obtained by us is sufficient and appropriate to provide a basis for our audit opinion on the Consolidated Financial Statements. Independent KEY AUDIT MATTER Key audit matter is a matter that, in our professional judgment, is of most significance REPORT 2025-26 in our audit of the Consolidated Financial Statements of the current period. This matter ANNUAL was addressed in the context of our audit of the Consolidated Financial Statements as a whole, and in forming our opinion thereon, and we do not provide a separate INTEGRATED opinion on this matter. We have determined the matter described below to be the key audit matter to be communicated in our report. WIPRO


LOGO

301 Revenue from fixed-price contracts using the percentage-of- • We selected a sample of fixed-price contracts with customers completion method—Refer Notes 2 (iii)(a), 3(xiv)B(i) and 22 to accounted using percentage-of-completion method and the Consolidated Financial Statements. performed the following: Key Audit Matter Description • Read the contract and based on the terms and conditions evaluated whether recognizing revenue over time using Revenue from fixed-price contracts, including software percentage-of-completion method was appropriate, and development, and integration contracts, where the confirmed that the contract was included in management’s performance obligations are satisfied over time, is recognized calculation of revenue over time. using the percentage-of-completion method. • Evaluated the appropriateness of and consistency Use of the percentage-of-completion method requires the in the application of management’s policies and Group to determine the project costs incurred to date as a methodologies to estimate progress towards satisfying the percentage of total estimated project costs at completion. The performance obligation. estimation of total project costs involves significant judgement and is assessed throughout the period of the contract to reflect • Compared efforts incurred to date with Company’s estimate any changes based on the latest available information. In of efforts incurred to date to identify significant variations and addition, provisions for estimated losses, if any, on uncompleted evaluate whether those variations have been considered contracts are recorded in the period in which such losses appropriately in estimating the remaining efforts to complete become probable based on the total estimated project costs. the contract. We identified the revenue recognition for fixed-price contracts • Tested the estimate for consistency with the status of where the percentage-of-completion method is used as a key delivery of milestones, customer acceptances and other audit matter because of the significant judgement involved in related information to identify possible delays in achieving estimating the efforts to complete such contracts. milestones, which require changes in estimated efforts to complete the remaining performance obligations. This estimate has a high inherent uncertainty and requires consideration of progress of the contract, efforts incurred to-date and estimates of efforts required to complete the INFORMATION OTHER THAN THE remaining performance obligations. FINANCIAL STATEMENTS AND This required a high degree of auditor judgment in evaluating $8’,725ń6b5(3257_7+(5(21 the audit evidence supporting estimated efforts to complete and • The Company’s Board of Directors is responsible for the a higher extent of audit effort to evaluate the reasonableness of other information. The other information comprises the the total estimated efforts used to recognise revenue from fixed-information included in the Management Discussion and price contracts using the percentage-of-completion method. Analysis, Board’s report including Annexures to Board’s How the Key Audit Matter Was Addressed in the Audit report, Business Responsibility and Sustainability Report and Corporate Governance Report, but does not include Our audit procedures related to estimates of efforts to complete the Consolidated Financial Statements, standalone financial for fixed-price contracts accounted using the percentage-of-statements and our auditor’s report thereon. completion method included the following, among others: • Our opinion on the Consolidated Financial Statements does • We tested the effectiveness of controls relating to (1) not cover the other information and we do not express any recording of efforts incurred and estimation of efforts form of assurance conclusion thereon. required to complete the remaining performance obligations, and (2) access and application controls pertaining to • In connection with our audit of the Consolidated Financial time recording and allocation systems, which prevents Statements, our responsibility is to read the other information unauthorised changes to recording of efforts incurred. and consider whether the other information is materially inconsistent with the Consolidated Financial Statements or our knowledge obtained during the course of our audit or otherwise appears to be materially misstated.


LOGO

302 STATUTORY REPORTS AND FINANCIAL STATEMENTS CONSOLIDATED FINANCIAL STATEMENT UNDER IND AS • If, based on the work we have performed, we conclude AUDITOR’S RESPONSIBILITY FOR that there is a material misstatement of this other THE AUDIT OF THE CONSOLIDATED information, we are required to report that fact. We have nothing to report in this regard. FINANCIAL STATEMENTS Our objectives are to obtain reasonable assurance about RESPONSIBILITIES OF MANAGEMENT whether the Consolidated Financial Statements as a whole AND BOARD OF DIRECTORS FOR are free from material misstatement, whether due to fraud THE CONSOLIDATED FINANCIAL or error, and to issue an auditor’s report that includes our opinion. Reasonable assurance is a high level of assurance, STATEMENTS but is not a guarantee that an audit conducted in accordance The Company’s Board of Directors is responsible for the with SAs will always detect a material misstatement when it matters stated in section 134(5) of the Act with respect to exists. Misstatements can arise from fraud or error and are the preparation of these consolidated financial statements considered material if, individually or in the aggregate, they that give a true and fair view of the consolidated financial could reasonably be expected to influence the economic position, consolidated financial performance including other decisions of users taken on the basis of these Consolidated comprehensive income, consolidated changes in equity Financial Statements. and consolidated cash flows of the Group in accordance As part of an audit in accordance with SAs, we exercise with the accounting principles generally accepted in India, professional judgment and maintain professional skepticism including Ind AS specified under section 133 of the Act. The throughout the audit. We also: respective Board of Directors of the companies included in the Group are responsible for maintenance of adequate • Identify and assess the risks of material misstatement accounting records in accordance with the provisions of of the Consolidated Financial Statements, whether due the Act for safeguarding the assets of the Group and for to fraud or error, design and perform audit procedures preventing and detecting frauds and other irregularities; responsive to those risks, and obtain audit evidence selection and application of appropriate accounting policies; that is sufficient and appropriate to provide a basis making judgments and estimates that are reasonable and for our opinion. The risk of not detecting a material prudent; and design, implementation and maintenance of misstatement resulting from fraud is higher than for adequate internal financial controls, that were operating one resulting from error, as fraud may involve collusion, effectively for ensuring the accuracy and completeness forgery, intentional omissions, misrepresentations, or of the accounting records, relevant to the preparation and the override of internal control. presentation of the financial statements that give a true and • Obtain an understanding of internal financial controls fair view and are free from material misstatement, whether relevant to the audit in order to design audit procedures due to fraud or error, which have been used for the purpose that are appropriate in the circumstances. Under of preparation of the Consolidated Financial Statements by section 143(3)(i) of the Act, we are also responsible for the Directors of the Company, as aforesaid. expressing our opinion on whether the Company and In preparing the Consolidated Financial Statements, the its subsidiary companies incorporated in India, has respective Management and Board of Directors of the adequate internal financial controls with reference to companies included in the Group are responsible for Consolidated Financial Statements in place and the REPORT 2025-26 assessing the ability of the respective entities to continue as operating effectiveness of such controls. a going concern, disclosing, as applicable, matters related • Evaluate the appropriateness of accounting policies ANNUAL to going concern and using the going concern basis of used and the reasonableness of accounting estimates accounting unless the respective Board of Directors either and related disclosures made by the management. INTEGRATED intend to liquidate their respective entities or to cease operations, or has no realistic alternative but to do so. • Conclude on the appropriateness of management’s use of the going concern basis of accounting and, based The respective Board of Directors of the companies on the audit evidence obtained, whether a material included in the Group are also responsible for overseeing uncertainty exists related to events or conditions that WIPRO the financial reporting process of the Group. may cast significant doubt on the ability of the Group to


LOGO

303 continue as a going concern. If we conclude that a material Statements of the current period and are therefore the key uncertainty exists, we are required to draw attention in our audit matters. We describe these matters in our auditor’s auditor’s report to the related disclosures in the Consolidated report unless law or regulation precludes public disclosure Financial Statements or, if such disclosures are inadequate, about the matter or when, in extremely rare circumstances, to modify our opinion. Our conclusions are based on the we determine that a matter should not be communicated in audit evidence obtained up to the date of our auditor’s our report because the adverse consequences of doing so report. However, future events or conditions may cause the would reasonably be expected to outweigh the public interest Group to cease to continue as a going concern. benefits of such communication. • Evaluate the overall presentation, structure and content of the Consolidated Financial Statements, including the REPORT ON OTHER LEGAL AND disclosures, and whether the Consolidated Financial REGULATORY REQUIREMENTS Statements represent the underlying transactions and 1. As required by Section 143(3) of the Act, based on our events in a manner that achieves fair presentation. audit we report that: • Obtain sufficient appropriate audit evidence regarding the a) We have sought and obtained all the information and financial information of the entities or business activities explanations which to the best of our knowledge and within the Group to express an opinion on the Consolidated belief were necessary for the purposes of our audit Financial Statements. of the aforesaid Consolidated Financial Statements. Materiality is the magnitude of misstatements in the b) In our opinion, proper books of account as required Consolidated Financial Statements that, individually or in by law relating to preparation of the aforesaid aggregate, makes it probable that the economic decisions of a Consolidated Financial Statements have been reasonably knowledgeable user of the Consolidated Financial kept so far as it appears from our examination of Statements may be influenced. We consider quantitative those books. materiality and qualitative factors in (i) planning the scope of our audit work and in evaluating the results of our work; and c) The Consolidated Balance Sheet, the Consolidated (ii) to evaluate the effect of any identified misstatements in the Statement of Profit and Loss including Other Consolidated Financial Statements. Comprehensive Income, the Consolidated We communicate with those charged with governance of the Statement of Changes in Equity and the Consolidated Company and such other entities included in the Consolidated Statement of Cash Flows dealt with by this Report Financial Statements of which we are the independent auditors are in agreement with the relevant books of account regarding, among other matters, the planned scope and maintained for the purpose of preparation of the timing of the audit and significant audit findings, including any Consolidated Financial Statements. significant deficiencies in internal financial controls that we d) In our opinion, the aforesaid Consolidated Financial identify during our audit. Statements comply with the Ind AS specified under We also provide those charged with governance with a Section 133 of the Act. statement that we have complied with relevant ethical e) On the basis of the written representations received requirements regarding independence, and to communicate from the directors of the Company as on March 31, with them all relationships and other matters that may 2026 taken on record by the Board of Directors of the reasonably be thought to bear on our independence, and Company and the reports of the statutory auditors of where applicable, related safeguards. its subsidiary companies incorporated in India, none From the matters communicated with those charged with of the directors of the Group companies incorporated governance, we determine those matters that were of in India is disqualified as on March 31, 2026 from most significance in the audit of the Consolidated Financial being appointed as a director in terms of Section 164 (2) of the Act.


LOGO

304 STATUTORY REPORTS AND FINANCIAL STATEMENTS CONSOLIDATED FINANCIAL STATEMENT UNDER IND AS f) With respect to the adequacy of the internal whose financial statements have financial controls with reference to Consolidated been audited under the Act, have Financial Statements and the operating represented to us that, to the best of effectiveness of such controls, refer to our their knowledge and belief, no funds separate Report in “Annexure A” which is based have been advanced or loaned or on the auditors’ reports of the company and its invested (either from borrowed funds subsidiary companies, incorporated in India. Our or share premium or any other sources report expresses an unmodified opinion on the or kind of funds) by the Company or adequacy and operating effectiveness of internal any of such subsidiaries or in any other financial controls with reference to Consolidated person or entity, including foreign Financial Statements of those companies. entities (“Intermediaries”), with the g) With respect to the other matters to be included understanding, whether recorded in the Auditor’s Report in accordance with the in writing or otherwise, that the requirements of section 197(16) of the Act, as Intermediary shall, directly or indirectly amended, in our opinion and to the best of our lend or invest in other persons or information and according to the explanations entities identified in any manner given to us, the remuneration paid by the whatsoever by or on behalf of the Company to its directors during the year is in Company or any of such subsidiaries accordance with the provisions of section 197 of (“Ultimate Beneficiaries”) or provide the Act. any guarantee, security or the like on behalf of the Ultimate Beneficiaries. h) With respect to the other matters to be included (b) The respective Managements of the in the Auditor’s Report in accordance with Rule Company and its subsidiaries which 11 of the Companies (Audit and Auditors) Rules, are companies incorporated in India, 2014, as amended in our opinion and to the whose financial statements have best of our information and according to the been audited under the Act, have explanations given to us: represented to us that, to the best of i) The Consolidated Financial Statements their knowledge and belief, no funds disclose the impact of pending litigations have been received by the Company on the consolidated financial position of the or any of such subsidiaries from any Group—Refer Note 34 to the Consolidated person or entity, including foreign Financial Statements; entities (“Funding Parties”), with the ii) ProvisionhasbeenmadeintheConsolidated understanding, whether recorded Financial Statements, as required in writing or otherwise, that the under the applicable law or accounting Company or any of such subsidiaries standards, for material foreseeable losses, shall, directly or indirectly, lend or if any, on long-term contracts including invest in other persons or entities derivative contracts—Refer Note 19 to the identified in any manner whatsoever Consolidated Financial Statements; by or on behalf of the Funding Party REPORT 2025-26 (“Ultimate Beneficiaries”) or provide ANNUAL iii) There has been no delay in transferring any guarantee, security or the like on amounts, required to be transferred, to the behalf of the Ultimate Beneficiaries. INTEGRATED Investor Education and Protection Fund by (c) Based on the audit procedures the Company and its subsidiary companies performed that have been considered incorporated in India. reasonable and appropriate in the iv) (a) The respective Managements of the circumstances performed by us on the Company and its subsidiaries, which Company and that performed by the WIPRO are companies incorporated in India, auditors of the subsidiaries which are 


LOGO

305 companies incorporated in India whose across any instance of the audit trail feature financial statements have been audited being tampered with. Additionally, the audit trail under the Act, nothing has come to our has been preserved by the Company and above or other auditor’s notice that has caused referred subsidiary companies incorporated us or the other auditors to believe that the in India as per the statutory requirements for representations under sub-clause (i) and (ii) record retention. of Rule 11(e), as provided under (a) and (b) 2. With respect to the matters specified in clause (xxi) of above, contain any material misstatement. paragraph 3 and paragraph 4 of the Companies (Auditor’s v) The interim dividends declared and paid by the Report) Order, 2020 (“CARO”/ “the Order”) issued by the Company during the year is in accordance with Central Government in terms of Section 143(11) of the section 123 of the Act, as applicable. Act, according to the information and explanations given vi) Based on our examination which included test to us, and based on the CARO reports issued by us and checks and that performed by the respective the auditors of respective companies included in the auditors of the subsidiaries and based on Consolidated Financial Statements to which reporting the other auditor’s reports of its subsidiary under CARO is applicable, as provided to us by the companies incorporated in India whose Management of the Company, we report that there are financial statements have been audited under no qualifications or adverse remarks by the respective the Act, the Company, its subsidiary companies auditors in the CARO reports of the said companies incorporated in India have used accounting included in the Consolidated Financial Statements. software systems for maintaining their respective books of account for the financial year ended March 31, 2026 which have the feature of recording audit trail (edit log) facility For Deloitte Haskins & Sells LLP Chartered Accountants and the same has operated throughout the year Firm Registration Number: 117366W/W—100018 for all relevant transactions recorded in the software systems. Further, during the course Anand Subramanian of audit, we and respective other auditors, Partner whose reports have been furnished to us by the Bengaluru Membership number: 110815 Management of the Company, have not come June 2, 2026 UDIN: 26110815LOIHWA8108


LOGO

306 STATUTORY REPORTS AND FINANCIAL STATEMENTS CONSOLIDATED FINANCIAL STATEMENT UNDER IND AS (Referred to in paragraph 1(f) under ‘Report on Other Legal and Regulatory Requirements’ section of our report of even date) REPORT ON THE INTERNAL FINANCIAL CONTROLS WITH REFERENCE TO CONSOLIDATED FINANCIAL STATEMENTS UNDER CLAUSE (I) OF SUB-SECTION 3 OF SECTION 143 OF THE COMPANIES ACT, 2013 (THE “ACT”) In conjunction with our audit of the consolidated Ind AS financial statements of the Company as at and for the year ended March 31, 2026, we have audited the internal financial controls with reference to Consolidated Financial Statements of Wipro Limited (hereinafter referred to as “the Company”) and its subsidiary companies which Report are companies incorporated in India as of that date. MANAGEMENT’S AND BOARD OF DIRECTORS’ RESPONSIBILITIES FOR INTERNAL FINANCIAL CONTROLS The respective management and Board of Directors of the Company, and its subsidiary companies, which are companies incorporated in India, are responsible for Auditor’s establishing and maintaining internal financial controls based on the internal control with reference to the financial statements criteria established by the respective companies considering the essential components of internal control stated in the Guidance Note on Audit of Internal Financial Controls Over Financial Reporting issued by the Institute of Chartered Accountants of India (ICAI). These responsibilities include the design, implementation and maintenance of adequate internal financial controls that were operating effectively for ensuring the orderly and efficient conduct of its business, including adherence to the respective company’s policies, the safeguarding of its assets, the prevention and detection of frauds and errors, the accuracy and Independent completeness of the accounting records, and the timely preparation of reliable financial information, as required under the Companies Act, 2013. AUDITOR’S RESPONSIBILITY Our responsibility is to express an opinion on the Company’s internal financial controls with reference to Consolidated Financial Statements based on our audit. “A” We conducted our audit in accordance with the Guidance Note on Audit of Internal Financial Controls Over Financial Reporting (the “Guidance Note”) issued by the Institute of Chartered Accountants of India and the Standards on Auditing, prescribed Annexure under Section 143(10) of the Companies Act, 2013, to the extent applicable to an audit REPORT 2025-26 of internal financial controls with reference to Consolidated Financial Statements. ANNUAL Those Standards and the Guidance Note require that we comply with ethical requirements and plan and perform the audit to obtain reasonable assurance about INTEGRATED the whether adequate internal financial controls with reference to Consolidated Financial Statements was established and maintained and if such controls operated effectively in all material respects. tto WIPRO


LOGO

307 Our audit involves performing procedures to obtain audit INHERENT LIMITATIONS OF INTERNAL evidence about the adequacy of the internal financial controls FINANCIAL CONTROLS WITH REFERENCE with reference to Consolidated Financial Statements and their operating effectiveness. Our audit of internal financial controls TO CONSOLIDATED FINANCIAL with reference to Consolidated Financial Statements included STATEMENTS obtaining an understanding of internal financial controls with Because of the inherent limitations of internal financial controls reference to Consolidated Financial Statements, assessing the with reference to Consolidated Financial Statements, including risk that a material weakness exists, and testing and evaluating the possibility of collusion or improper management override the design and operating effectiveness of internal control based of controls, material misstatements due to error or fraud may on the assessed risk. The procedures selected depend on the occur and not be detected. Also, projections of any evaluation auditor’s judgement, including the assessment of the risks of of the internal financial controls with reference to Consolidated material misstatement of the financial statements, whether due Financial Statements to future periods are subject to the risk to fraud or error. that the internal financial control with reference to Consolidated We believe that the audit evidence we have obtained is sufficient Financial Statements may become inadequate because of and appropriate to provide a basis for our audit opinion on changes in conditions, or that the degree of compliance with the internal financial controls with reference to Consolidated the policies or procedures may deteriorate. Financial Statements of the Company, its subsidiary companies, which are companies incorporated in India. OPINION MEANING OF INTERNAL FINANCIAL In our opinion to the best of our information and according to the explanations given to us, the Company, and its subsidiary CONTROLS WITH REFERENCE TO companies, which are companies incorporated in India, have, CONSOLIDATED FINANCIAL STATEMENTS in all material respects, adequate internal financial controls A company’s internal financial control with reference to with reference to Consolidated Financial Statements and Consolidated Financial Statements is a process designed such internal financial controls with reference to Consolidated to provide reasonable assurance regarding the reliability of Financial Statements were operating effectively as at March financial reporting and the preparation of financial statements 31, 2026, based on the criteria for internal financial control with for external purposes in accordance with generally accepted reference to Consolidated Financial Statements established accounting principles. A company’s internal financial control by the respective companies considering the essential with reference to Consolidated Financial Statements components of internal control stated in the Guidance Note on includes those policies and procedures that (1) pertain to the Audit of Internal Financial Controls Over Financial Reporting maintenance of records that, in reasonable detail, accurately issued by the Institute of Chartered Accountants of India. and fairly reflect the transactions and dispositions of the assets of the company; (2) provide reasonable assurance that transactions are recorded as necessary to permit preparation of financial statements in accordance with generally accepted accounting principles, and that receipts and expenditures For Deloitte Haskins & Sells LLP Chartered Accountants of the company are being made only in accordance with Firm Registration Number: 117366W/W—100018 authorisations of management and directors of the company; and (3) provide reasonable assurance regarding prevention or Anand Subramanian timely detection of unauthorised acquisition, use, or disposition Partner of the company’s assets that could have a material effect on the Bengaluru Membership number: 110815 financial statements. June 2, 2026 UDIN: 26110815LOIHWA8108


LOGO

308 STATUTORY REPORTS AND FINANCIAL STATEMENTS CONSOLIDATED FINANCIAL STATEMENT UNDER IND AS stated) As at As at Notes March 31, 2026 March 31, 2025 otherwise ASSETS Non-current assets Property, plant and equipment 4 77,224 78,473 unless Right-of-Use assets 5 28,287 25,598 Capital work-in-progress 6 4,122 1,964 Goodwill 7 382,214 320,346 Other intangible assets 7 29,176 27,450 Investments accounted for using 2,126 1,327 9 the equity method Financial assets Investments 9 28,053 26,458 Derivative assets 10—^ share and per share data,except Trade receivables 11 349 299 Unbilled receivables 7,433— 2WKHU_ÙQDQFLDO_DVVHWV 12 6,259 4,664 millions, Deferred tax assets (net) 28 5,242 2,561 Sheet Non-current tax assets (net) 7,787 7,230 in Other non-current assets 13 9,451 7,707 I ( Total non-current assets 587,723 504,077 Current assets Inventories 14 517 694 Financial assets Balance Investments 9 437,680 411,474 Derivative assets 10 888 1,820 Trade receivables 11 135,901 117,745 Unbilled receivables 76,823 64,280 Cash and cash equivalents 15 105,555 121,974 _ _ 2WKHU_ÙQDQFLDO_DVVHWV 12 10,245 8,448 Current tax assets (net) 10,762 6,417 Contract assets 14,819 15,795 Consolidated Other current assets 13 33,164 29,128 2025-26 Total current assets 826,354 777,775 REPORT TOTAL ASSETS 1,414,077 1,281,852 EQUITY AND LIABILITIES ANNUAL EQUITY Equity share capital 16 20,977 20,944 INTEGRATED Other equity 859,206 802,697 Equity attributable to the equity 880,183 823,641 holders of the Company Non-controlling interests 2,509 2,138 WIPRO TOTAL EQUITY 882,692 825,779


LOGO

309 (I in millions, except share and per share data, unless otherwise stated) As at As at Notes March 31, 2026 March 31, 2025 LIABILITIES Non-current liabilities Financial liabilities Borrowings 17 1,962 63,954 Lease liabilities 5 26,327 22,193 Trade payables 21 4,394—_ _ 2WKHU_ÙQDQFLDO_OLDELOLWLHV 18 6,743 7,793 Provisions 19 5,389 4,656 Deferred tax liabilities (net) 28 17,266 16,443 Non-current tax liabilities (net) 48,195 42,024 Other non-current liabilities 20 17,877 12,757 Total non-current liabilities 128,153 169,820 Current liabilities Financial liabilities Borrowings 17 165,912 97,863 Lease liabilities 5 8,709 8,025 Derivative liabilities 10 10,978 968 Trade payables 21 62,894 58,667 _ _ 2WKHU_ÙQDQFLDO_OLDELOLWLHV 18 43,387 33,463 Contract liabilities 25,434 20,063 Other current liabilities 20 16,834 15,085 Provisions 19 19,463 17,638 Current tax liabilities (net) 49,621 34,481 Total current liabilities 403,232 286,253 TOTAL LIABILITIES 531,385 456,073 TOTAL EQUITY AND LIABILITIES 1,414,077 1,281,852 ^ Value is less than H 0.5 7KH_DFFRPSDQ¥LQJ_QRWHV_IRUP_DQ_LQWHJUDO_SDUW_RI_WKHVH_FRQVROLGDWHG_ŮQDQFLDO_VWDWHPHQWV As per our report of even date attached For and on behalf of the Board of Directors for Deloitte Haskins & Sells LLP Rishad A. Premji Deepak M. Satwalekar Srinivas Pallia Chartered Accountants Chairman Director Chief Executive Officer and Firm’s Registration No.: 117366W/W—100018 (DIN: 02983899) (DIN: 00009627) Managing Director (DIN: 10574442) Anand Subramanian Aparna C. Iyer M. Sanaulla Khan Partner Chief Financial Officer Company Secretary Membership No.: 110815 Membership No.: F4129 Bengaluru June 2, 2026


LOGO

310 STATUTORY REPORTS AND FINANCIAL STATEMENTS CONSOLIDATED FINANCIAL STATEMENT UNDER IND AS stated) Year ended Year ended Notes March 31, 2026 March 31, 2025 otherwise INCOME Revenue from operations 22 926,240 890,884 Other income 23 38,737 38,840 Total income (A) 964,977 929,724 Loss unless EXPENSES Purchases of stock-in-trade 5,755 2,967 Changes in inventories of stock- 24 171 195 in-trade (PSOR¥HH_EHQHŮWV_H[SHQVH 25 555,855 533,477 and Finance costs 26 14,577 14,770 Depreciation, amortisation and 29,107 29,579 impairment expense Sub-contracting and technical 107,668 100,148 fees Profit share and per share data, Facility expenses 15,886 16,067 except Software license expense for 21,720 19,338 internal use millions, Travel 13,882 14,095 Communication 3,414 3,842 Legal and professional charges 10,199 11,270 in Marketing and brand building 3,480 3,591 of I ( Lifetime expected credit loss 2,838 324 Other expenses 27 7,260 5,358 Statements Total expenses (B) 791,812 755,021 3URÙW_EHIRUH_VKDUH_RI_QHW_SURÙW__ORVV__ 173,165 174,703 of associate and joint venture 6KDUH_RI_QHW_SURÙW__ORVV__RI_DVVRFLDWH_ 9 and joint venture accounted for using 257 254 the equity method (C) 3URŮW_EHIRUH_WD[__$___%___&_ 173,422 174,957 Tax expense Current tax 28 42,665 45,405 Deferred tax 28 (1,898) (2,628) Total tax expense 40,767 42,777 3URŮW_IRU_WKH_¥HDU 132,655 132,180 Consolidated 2025-26 Other Comprehensive Income (OCI) REPORT ,WHPV_WKDW_ZLOO_QRW_EH_UHFODVVLÙHG_WR_ SURÙW_RU_ORVV_ _ _5HPHDVXUHPHQWV_RI_WKH_GHÙQHG_ 25 ANNUAL 142 323 EHQHÙW_SODQV__QHW Net change in fair value of INTEGRATED investment in equity instruments (1,452) (3,619) measured at fair value through OCI Income taxes relating to items 28 WKDW_ZLOO_QRW_EH_UHFODVVLÙHG_WR_ (6) 94 WIPRO SURÙW_RU_ORVV


LOGO

311 (I in millions, except share and per share data, unless otherwise stated) Year ended Year ended Notes March 31, 2026 March 31, 2025 ,WHPV_WKDW_ZLOO_EH_UHFODVVLÙHG_WR_SURÙW_RU_ORVV_ Foreign currency translation differences relating to foreign operations 46,126 7,216 5HFODVVLŮFDWLRQ_RI_IRUHLJQ_FXUUHQF¥_WUDQVODWLRQ_GLIIHUHQFHV_RQ_OLTXLGDWLRQ_RI_ 29—(41) VXEVLGLDULHV_WR_FRQVROLGDWHG_VWDWHPHQW_RI_SURÙW_DQG_ORVV 1HW_FKDQJH_LQ_WLPH_YDOXH_RI_RSWLRQ_FRQWUDFWV_GHVLJQDWHG_DV_FDVK_ùRZ_KHGJHV 10 73 (248) 1HW_FKDQJH_LQ_LQWULQVLF_YDOXH_RI_RSWLRQ_FRQWUDFWV_GHVLJQDWHG_DV_FDVK_ùRZ_KHGJHV 10 (1,622) 193 1HW_FKDQJH_LQ_IDLU_YDOXH_RI_IRUZDUG_FRQWUDFWV_GHVLJQDWHG_DV_FDVK_ùRZ_KHGJHV 10 (7,902) (993) Net change in fair value of investment in debt instruments measured at fair value (2,413) 1,189 through OCI ,QFRPH_WD[HV_UHODWLQJ_WR_LWHPV_WKDW_ZLOO_EH_UHFODVVLÙHG_WR_SURÙW_RU_ORVV 28 2,576 34 Total other comprehensive income for the year, net of taxes 35,522 4,148 Total comprehensive income for the year 168,177 136,328 3URŮW_IRU_WKH_¥HDU_DWWULEXWDEOH_WR_ Equity holders of the Company 131,974 131,354 Non-controlling interests 681 826 132,655 132,180 2WKHU_FRPSUHKHQVLYH_LQFRPH_IRU_WKH_¥HDU_DWWULEXWDEOH_WR_ Equity holders of the Company 35,276 4,126 Non-controlling interests 246 22 35,522 4,148 7RWDO_FRPSUHKHQVLYH_LQFRPH_IRU_WKH_¥HDU_DWWULEXWDEOH_WR_ Equity holders of the Company 167,250 135,480 Non-controlling interests 927 848 168,177 136,328 (DUQLQJV_SHU_HTXLW¥_VKDUH___(TXLW¥_VKDUHV_RI_SDU_YDOXH_K 2 each) 30 Basic 12.60 12.56 Diluted 12.56 12.52 Weighted average number of equity shares used in computing earnings per equity share Basic 10,476,247,846 10,456,741,552 Diluted 10,503,422,936 10,488,939,392 7KH_DFFRPSDQ¥LQJ_QRWHV_IRUP_DQ_LQWHJUDO_SDUW_RI_WKHVH_FRQVROLGDWHG_ŮQDQFLDO_VWDWHPHQWV As per our report of even date attached For and on behalf of the Board of Directors for Deloitte Haskins & Sells LLP Rishad A. Premji Deepak M. Satwalekar Srinivas Pallia Chartered Accountants Chairman Director Chief Executive Officer and Firm’s Registration No.: 117366W/W—100018 (DIN: 02983899) (DIN: 00009627) Managing Director (DIN: 10574442) Anand Subramanian Aparna C. Iyer M. Sanaulla Khan Partner Chief Financial Officer Company Secretary Membership No.: 110815 Membership No.: F4129 Bengaluru June 2, 2026


LOGO

WIPRO INTEGRATED ANNUAL REPORT 2025-26 312 Consolidated Statements of Changes in Equity STATUTORY REPORTS (I in millions, except share and per share data, unless otherwise stated) AND A. EQUITY SHARE CAPITAL FINANCIAL Balance as at Changes in equity share capital Restated balance as at Changes in equity share capital Balance as at April 1, 2025 due to prior period errors April 1, 2025 during the current year March 31, 2026(2) 20,944 — 20,944 33 20,977 STATEMENTS Balance as at Changes in equity share capital Restated balance as at Changes in equity share capital Balance as at April 1, 2024 due to prior period errors April 1, 2024 during the previous year(1) March 31, 2025(2) 10,450 — 10,450 10,494 20,944 (1) I 10,467 is towards issue of bonus shares (Refer to Note 32) and I 27 is towards proceeds from issue of equity shares on exercise of options. (2) As at March 31, 2026, the Company has 10,488,412,458 equity shares of I 2 each (March 31, 2025: 10,472,136,049 equity shares) . As at March 31, 2026, the Company has 11,905,480 treasury shares (March 31, 2025: 11,905,480 treasury shares), held by a controlled trust consolidated as part of the Group. CONSOLIDATED FINANCIAL STATEMENT UNDER IND AS 


LOGO

(I in millions, except share and per share data, unless otherwise stated) B. OTHER EQUITY Reserves and Surplus Other components of equity Share Equity Investment Investment application Special Gross attributable Non- Foreign Remeasure—in debt in equity Total other money Capital Share options Economic &DVK_ùRZ_ obligation to to equity controlling Securities Capital Retained currency ments of instruments instruments equity pending redemption outstanding Zone re- hedging non-controlling holders of the interests premium reserve earnings translation (2) WKH_GHÙQHG_ measured measured allotment reserve account investment (1) reserve interests under Company reserve EHQHÙW_SODQV at fair value at fair value reserve put options through OCI through OCI Balance as at April 1, 2025 ^ 2,699 1,139 13 712,693 6,985 27,778 52,393 (210) (127) 2,360 1,212 (4,238) 802,697 2,138 804,835 3URŮW_IRU_WKH_¥HDU — — 131,974 — ——— 131,974 681 132,655 Other comprehensive income — — ——45,860 (7,194) 152 (2,094) (1,448)—35,276 246 35,522 7RWDO_FRPSUHKHQVLYH_LQFRPH__ORVV__ — — 131,974 — 45,860 (7,194) 152 (2,094) (1,448)—167,250 927 168,177 for the year Issue of equity shares on exercise —3,530 ——(3,530) — —-—— -of options Dividend (3) — — (115,206) — ——— (115,206) (569) (115,775) Compensation cost related to — ——4,465 — —-— 4,465—4,465 employee share-based payment Transferred from Special Economic — — 1,812—(1,812) —————Zone re-investment reserve Others — — ——(5) 5 (8)—8 — 13 13 Other transactions for the year—3,530 — (113,394) 935 (1,812) (5) 5 (8)—8—(110,741) (556) (111,297) Balance as at March 31, 2026 ^ 6,229 1,139 13 731,273 7,920 25,966 98,248 (7,399) 17 266 (228) (4,238) 859,206 2,509 861,715 ^ Value is less than H 0.5 (1) Refer to Note 29 (2) Refer to Note 10 (3) Refer to Note 32 313


LOGO

WIPRO INTEGRATED ANNUAL REPORT 2025-26 314 (I in millions, except share and per share data, unless otherwise stated) Reserves and Surplus Other components of equity Share Equity Investment Investment application Special Gross attributable Non- Foreign Remeasure—in debt in equity Total other money Capital Share options Economic &DVK_ùRZ_ obligation to to equity controlling Securities Capital Retained currency ments of instruments instruments equity pending redemption outstanding Zone re- hedging non-controlling holders of the interestsSTATUTORY premium reserve earnings translation (2) WKH_GHÙQHG_ measured measured allotment reserve accoun investment reserve interests under Company reserve(1) EHQHÙW_SODQV at fair value at fair value reserve put options through OCI through OCI Balance as at April 1, 2024 ^ 3,362 1,139 1,674 627,152 6,384 42,129 45,269 578 (286) 1,397 10,320 (4,238) 734,880 1,340 736,220 REPORTS _3URŮW_IRU_WKH_¥HDU_ — — 131,354 — — — — 131,354 826 132,180AND Other comprehensive — — ——7,138 (788) 289 963 (3,476)—4,126 22 4,148 income 7RWDO_FRPSUHKHQVLYH_LQFRPH_ — — 131,354 — 7,138 (788) 289 963 (3,476)—135,480 848 136,328 _ORVV__IRU_WKHb¥HDU_ FINANCIAL Issue of equity shares on exercise of options—4,950 ——(4,950) — — — — — Bonus issue of equity shares (3)—(5,613)—(1,661) (3,193) — — — — (10,467)—(10,467) Dividend (3) — — (62,750) — — — — (62,750)—(62,750) STATEMENTS Transfer from Other (4) — — 5,754 — — (130)—(5,624) — —components of equity Transfer of shares pertaining to — — 25 — (14) ——(8)—3 (3) -Non-controlling interests of subsidiary Compensation cost related to employee share-based — ——5,551 — — ——5,551—5,551 payment CONSOLIDATED Transferred from Special Economic Zone re-investment — — 14,351—(14,351) — — — ——reserve FINANCIAL STATEMENT UNDER IND AS 


LOGO

(I in millions, except share and per share data, unless otherwise stated) Reserves and Surplus Other components of equity Share Equity Investment Investment application Special Gross attributable Non- Foreign Remeasure—in debt in equity Total other money Capital Share options Economic &DVK_ùRZ_ obligation to to equity controlling Securities Capital Retained currency ments of instruments instruments equity pending redemption outstanding Zone re- hedging non-controlling holders of the interests premium reserve earnings translation (2) WKH_GHÙQHG_ measured measured allotment reserve accoun investment (1) reserve interests under Company reserve EHQHÙW_SODQV at fair value at fair value reserve put options through OCI through OCI Others — — — — — — — (47) (47) Other transactions for the —(663)—(1,661) (45,813) 601 (14,351) (14)—(130)—(5,632)—(67,663) (50) (67,713) year Balance as at ^ 2,699 1,139 13 712,693 6,985 27,778 52,393 (210) (127) 2,360 1,212 (4,238) 802,697 2,138 804,835 March 31, 2025 ^ Value is less than H 0.5 (1) Refer to Note 29 (2) Refer to Note 10 (3) Refer to Note 32 (4) Towards transfer of cumulative realised (gain)/loss on disposal of investments in equity instruments designated as FVTOCI and towards transfer of cumulative (gain)/loss on remeasurement of defined benefit plans to retained earnings. 7KH_DFFRPSDQ¥LQJ_QRWHV_IRUP_DQ_LQWHJUDO_SDUW_RI_WKHVH_FRQVROLGDWHG_ŮQDQFLDO_VWDWHPHQWV As per our report of even date attached For and on behalf of the Board of Directors for Deloitte Haskins & Sells LLP Rishad A. Premji Deepak M. Satwalekar Srinivas Pallia Chartered Accountants Chairman Director Chief Executive Officer and Firm’s Registration No.: 117366W/W—100018 (DIN: 02983899) (DIN: 00009627) Managing Director (DIN: 10574442) Anand Subramanian Aparna C. Iyer M. Sanaulla Khan Partner Chief Financial Officer Company Secretary Membership No.: 110815 Membership No.: F4129 Bengaluru June 2, 2026 315


LOGO

316 STATUTORY REPORTS AND FINANCIAL STATEMENTS CONSOLIDATED FINANCIAL STATEMENT UNDER IND AS stated) For the year ended For the year ended Notes March 31, 2026 March 31, 2025 otherwise &DVK_ùRZV_IURP_RSHUDWLQJ_DFWLYLWLHV_ 3URŮW_IRU_WKH_¥HDU 132,655 132,180 $GMXVWPHQWV_WR_UHFRQFLOH_SURŮW_IRU_WKH_ year to net cash generated from operating unless activities Gain on sale of property, plant and (393) (606) equipment, net Depreciation, amortisation and 29,107 29,579 impairment expense Flows Unrealised exchange (gain)/loss, net 2,168 (623) Share-based compensation expense 4,465 5,551 6KDUH_RI_QHW__SURÙW__ORVV_RI_DVVRFLDWH_ and joint venture accounted for using (257) (254) equity method Income tax expense 28 40,767 42,777 Finance and other income, net of (21,914) (23,432) ÙQDQFH_FRVWV Cash Change in fair value of contingent share and per share data, 49 (169) consideration except Lifetime expected credit loss 11 2,838 324 Changes in operating assets and millions, liabilities, net of effects from acquisitions (Increase)/Decrease in trade (11,442) 1,894 receivables (Increase)/Decrease in unbilled of (14,498) (1,331) in receivables and contract assets I ( (Increase)/Decrease in inventories 184 213 _,QFUHDVH__‘HFUHDVH_LQ_RWKHU_ÙQDQFLDO_ Statements (205) 6,609 assets and other assets Increase/(Decrease) in trade payables, RWKHU_ÙQDQFLDO_OLDELOLWLHV__RWKHU_OLDELOLWLHV_ 8,482 548 and provisions Increase/(Decrease) in contract 3,555 2,341 liabilities Cash generated from operating activities 175,561 195,601 before taxes Income taxes paid (26,245) (26,175) Net cash generated from operating 149,316 169,426 activities &DVK_ùRZV_IURP_LQYHVWLQJ_DFWLYLWLHV_ Payment for purchase of property, (15,603) (14,737) plant and equipment Proceeds from disposal of property, 758 1,822 plant and equipment Consolidated Investment in associate (352) -Payment for purchase of investments (837,806) (801,582) 2025-26 Proceeds from sale of investments 816,732 706,520 REPORT Payment for business acquisitions including deposits and escrow, net of (26,033) (964) cash acquired ANNUAL Repayment of security deposit for —(300) property, plant and equipment Interest received 28,878 26,212 INTEGRATED Dividend received 23 3 2,299 Net cash used in investing activities (33,423) (80,730) WIPRO


LOGO

317 (I in millions, except share and per share data, unless otherwise stated) For the year ended For the year ended Notes March 31, 2026 March 31, 2025 &DVK_ùRZV_IURP_ÙQDQFLQJ_DFWLYLWLHV_ Proceeds from issuance of equity shares and shares pending allotment 33 27 Repayment of borrowings (259,841) (177,672) Proceeds from borrowings 253,089 195,595 Payment of lease liabilities including interests 5 (11,561) (10,474) Payment for contingent consideration (648) -Payment of deferred consideration on business combination (221)—,QWHUHVW_DQG_ÙQDQFH_FRVWV_SDLG (6,336) (8,689) Payment of dividend (115,206) (62,750) Payment of dividend to Non-controlling interest holders (569)—1HW_FDVK_XVHG_LQ_ÙQDQFLQJ_DFWLYLWLHV (141,260) (63,963) Net increase/(decrease) in cash and cash equivalents during the year (25,367) 24,733 Effect of exchange rate changes on cash and cash equivalents 8,948 290 Cash and cash equivalents at the beginning of the year 15 121,974 96,951 Cash and cash equivalents at the end of the year 15 105,555 121,974 5HIHU_WR_1RWH____IRU_VXSSOHPHQWDU¥_LQIRUPDWLRQ_RQ_FRQVROLGDWHG_VWDWHPHQW_RI_FDVK_ůRZV 7KH_DFFRPSDQ¥LQJ_QRWHV_IRUP_DQ_LQWHJUDO_SDUW_RI_WKHVH_FRQVROLGDWHG_ŮQDQFLDO_VWDWHPHQWV As per our report of even date attached For and on behalf of the Board of Directors for Deloitte Haskins & Sells LLP Rishad A. Premji Deepak M. Satwalekar Srinivas Pallia Chartered Accountants Chairman Director Chief Executive Officer and Managing Director Firm’s Registration No.: 117366W/W—100018 (DIN: 02983899) (DIN: 00009627) (DIN: 10574442) Anand Subramanian Aparna C. Iyer M. Sanaulla Khan Partner Chief Financial Officer Company Secretary Membership No.: 110815 Membership No.: F4129 Bengaluru June 2, 2026


LOGO

318 STATUTORY REPORTS AND FINANCIAL STATEMENTS CONSOLIDATED FINANCIAL STATEMENT UNDER IND AS 1. THE COMPANY OVERVIEW stated) Wipro Limited (“Wipro” or the “Parent Company”), together with its subsidiaries Statements otherwise and controlled trusts (collectively, “we”, “us”, “our”, “the Company” or “the Group”) is a leading artificial intelligence (“AI”) powered technology services and consulting company focused on building innovative solutions that address clients’ most complex digital transformation needs. Leveraging our consulting-led approach and the Wipro Intelligence™ unified suite of AI-powered platforms, solutions and transformative offerings, we help clients realise their boldest ambitions to build intelligent and sustainable businesses. Wipro is a public limited company incorporated and domiciled in India. The address of its registered office is Wipro Limited, Doddakannelli, Sarjapur Road, Bengaluru – 560 035, Karnataka, India. The Company has its primary listing with BSE Ltd. and National Stock Exchange of India Limited. The Company’s Financial American Depository Shares (“ADS”) representing equity shares are also listed on the New York Stock Exchange. The Company’s Board of Directors authorised these consolidated financial except share and per share data, unless statements for issue on June 2, 2026. millions, 2. BASIS OF PREPARATION OF CONSOLIDATED in FINANCIAL STATEMENTS I ( Consolidated (i) Statement of compliance and basis of preparation The consolidated financial statements have been prepared in compliance with Indian Accounting Standards (“Ind AS”), the provisions of Schedule III to the Companies Act, 2013 (“the Companies Act”), as applicable and guidelines issued by the Securities and Exchange Board of India (“SEBI”). The Ind AS are prescribed under Section 133 of the Companies Act read with Rule 3 of the Companies (Indian Accounting Standards) Rules, 2015 and amendments issued thereafter. All accounting policies have been consistently applied to all periods presented in these financial statements, except for the adoption of new accounting standards, amendments and interpretations effective from April 1, 2025. The consolidated financial statements correspond to the classification provisions contained in Ind AS 1, “Presentation of Financial Statements”. For the clarity, various items are aggregated in the consolidated statement of profit and loss and consolidated balance sheet. These items are disaggregated separately REPORT 2025-26 in the notes to the consolidated financial statements, where applicable. ANNUAL The assets which are expected to be realised within a period of twelve months to from the end of reporting period are classified as current assets. Similarly, the INTEGRATED Notes liabilities which are expected to be settled within a period of twelve months from the end of reporting period are classified as current liabilities. All other assets and liabilities are classified as non-current. WIPRO


LOGO

319 Notes to the Consolidated Financial Statements (I in millions, except share and per share data, unless otherwise stated) All amounts included in the consolidated financial Accounting estimates and underlying assumptions are statements are reported in millions of Indian Rupees reviewed on an ongoing basis. Changes to accounting (I in millions) except share and per share data, unless estimates are recognised in the period in which the otherwise stated. Due to rounding off, the numbers estimates are changed and in any future periods presented throughout the document may not add up affected. In particular, information about material areas precisely to the totals and percentages may not precisely of estimation, uncertainty and critical judgements in reflect the absolute figures. Previous year figures have applying accounting policies that have the material effect been regrouped/rearranged, wherever necessary. on the amounts recognised in the consolidated financial statements are included in the following notes: (ii) Basis of measurement a) Revenue recognition: The Company applies The consolidated financial statements have been judgement to determine whether each product or prepared on a historical cost convention and on an service promised to a customer is capable of being accrual basis, except for the following material items distinct, and is distinct in the context of the contract, if which have been measured at fair value as required by not, the promised product or service is combined and relevant Ind AS: accounted as a single performance obligation. The a. Derivative financial instruments; Company allocates the Transaction Price (as defined below in Note 3(xiv)) to separately identifiable b. Financial instruments classified as fair value through performance obligation deliverables based on their other comprehensive income or fair value through relative stand-alone selling price. In cases where the profit or loss; Company is unable to determine the stand-alone c. The defined benefit liability/(asset) is recognised as selling price the Company uses expected cost-plus the present value of defined benefit obligation less margin approach in estimating the stand-alone fair value of plan assets; and selling price. The Company uses the percentage of d. Contingent consideration and liability on written completion method using the input (cost expended) put options. method to measure progress towards completion in respect of fixed price contracts. Percentage of (iii) Use of estimates and judgement completion method accounting relies on estimates The preparation of the consolidated financial statements of total expected contract revenue and costs. This in conformity with Ind AS requires the management to method is followed when reasonably dependable makejudgements,accountingestimatesandassumptions estimates of the revenues and costs applicable to that affect the application of accounting policies and various elements of the contract can be made. Key the reported amounts of assets, liabilities, income and factors that are reviewed in estimating the future expenses. Accounting estimates are monetary amounts costs to complete include estimates of future labor in the consolidated financial statements that are subject costs and productivity efficiencies. Because the to measurement uncertainty. An accounting policy may financial reporting of these contracts depends on require items in consolidated financial statements to be estimates that are assessed continually during the measured at monetary amounts that cannot be observed term of these contracts, revenue recognised, profit directly and must instead be estimated. In such a case, and timing of revenue for remaining performance management develops an accounting estimate to obligations are subject to revisions as the contract achieve the objective set out by the accounting policy. progresses to completion. When estimates indicate Developing accounting estimates involves the use of that a loss will be incurred, the loss is provided for judgements or assumptions based on the latest available in the period in which the loss becomes probable. and reliable information. Actual results may differ from Volume discounts are recorded as a reduction of those accounting estimates. revenue. When the amount of discount varies with the levels of revenue, volume discount is recorded based on estimate of future revenue from the customer.


LOGO

320 STATUTORY REPORTS AND FINANCIAL STATEMENTS CONSOLIDATED FINANCIAL STATEMENT UNDER IND AS Notes to the Consolidated Financial Statements (I in millions, except share and per share data, unless otherwise stated) b) Impairment testing: Goodwill recognised on d) Business combinations: In accounting for business combination is tested for impairment at business combinations, judgement is required least annually and when events occur or changes to assess whether an identifiable intangible in circumstances indicate that the recoverable asset is to be recorded separately from goodwill. amount of goodwill or a cash generating Additionally, estimating the acquisition date unit to which goodwill pertains, is less than fair value of the identifiable assets acquired the carrying value. The Company assesses (including useful life estimates), liabilities acquired intangible assets with finite useful life assumed, and contingent consideration for impairment whenever events or changes in assumed involves management judgement. circumstances indicate that the carrying amount These measurements are based on information may not be recoverable. The recoverable available at the acquisition date and are based amount of an asset or a cash generating unit is on expectations and assumptions that have higher of value-in-use and fair value less cost been deemed reasonable by management. of disposal. The calculation of value-in-use of Changes in these judgements, estimates, and an asset or a cash generating unit involves use assumptions can materially affect the results of significant estimates and assumptions which of operations. include turnover, growth rates and net margins e) Defined benefit plans and compensated used to calculate projected future cash flows, absences: The cost of the defined benefit plans, risk-adjusted discount rate, future economic and compensated absences and the present value market conditions. of the defined benefit obligations are based c) Income taxes: The major tax jurisdictions for the on actuarial valuation using the projected unit Company are India and the United States. credit method. An actuarial valuation involves Significant judgements are involved in making various assumptions that may differ determining the provision for income taxes from actual developments in the future. These including judgement on whether tax positions are include the determination of the discount rate, probable of being sustained in tax assessments. future salary increases and mortality rates. Due A tax assessment can involve complex issues, to the complexities involved in the valuation which can only be resolved over extended and its long-term nature, a defined benefit time periods. obligation is highly sensitive to changes in these assumptions. All assumptions are reviewed at Deferred tax is recorded on temporary each reporting date. differences between the tax bases of assets f) Expected credit losses on financial assets: and liabilities and their carrying amounts, at the The impairment provisions of financial assets rates that have been enacted or substantively are based on assumptions about risk of enacted at the reporting date. The ultimate default and expected timing of collection. The realisation of deferred tax assets is dependent Company uses judgement in making these upon the generation of future taxable profits assumptions and selecting the inputs to the during the periods in which those temporary expected credit loss calculation based on the differences and tax loss carry-forwards become Company’s history of collections, customer’s REPORT 2025-26 deductible. The Company considers expected creditworthiness, existing market conditions as ANNUAL reversal of deferred tax liabilities and projected well as forward-looking estimates at the end of future taxable income in making this assessment. each reporting period. INTEGRATED The amount of deferred tax assets considered realisable, however, could reduce in the near g) Useful lives of property, plant and equipment: term if estimates of future taxable income during The Company depreciates property, plant and the carry-forward period are reduced. equipment on a straight-line basis over estimated useful lives of the assets. The charge in respect WIPRO


LOGO

321 Notes to the Consolidated Financial Statements (I in millions, except share and per share data, unless otherwise stated) of periodic depreciation is derived based on an The financial statements of the Group companies are estimate of an asset’s expected useful life and the consolidated on a line-by-line basis and all intra-Group expected residual value at the end of its life. The lives balances, transactions, income and expenses are are based on historical experience with similar assets eliminated in full on consolidation. as well as anticipation of future events, which may impact their life, such as changes in technology. The Non-controlling interests estimated useful life is reviewed at least annually. Non-controlling interests in the net assets (excluding h) Provisions and contingent liabilities: The Company goodwill) of consolidated subsidiaries are identified estimates the provisions that have present separately from the Company’s equity. The interest of obligations as a result of past events, and it is non-controlling shareholders may be initially measured probable that outflow of resources will be required to either at fair value or at the non-controlling interest’s settle the obligations. These provisions are reviewed proportionate share of the fair value of the acquiree’s at the end of each reporting date and are adjusted to identifiable net assets. The choice of measurement reflect the current best estimates. basis is made on an acquisition to acquisition basis. The Company uses significant judgement to Subsequent to acquisition, the carrying amount of non-disclose contingent liabilities. Contingent liabilities controlling interests is the amount of those interests at are disclosed when there is a possible obligation initial recognition plus the non-controlling interest’s share arising from past events, the existence of which of subsequent changes in equity. Total comprehensive will be confirmed only by the occurrence or non- income is attributed to non-controlling interests even occurrence of one or more uncertain future events if it results in the non-controlling interests having a not wholly within the control of the Company or a deficit balance. present obligation that arises from past events where it is either not probable that an outflow of resources Liability for written put options to will be required to settle the obligation or a reliable non-controlling interests estimate of the amount cannot be made. Contingent assets are neither recognised nor disclosed in the At initial recognition, the liability for put options issued financial statements. to non-controlling interests, to be settled in cash by the Company, which do not grant present access to 3. MATERIAL ACCOUNTING POLICY ownership interest to the Company is recognised as financial liability at present value of the redemption INFORMATION amount with a corresponding debit in other components of equity. (i) Basis of consolidation Subsidiaries and controlled trusts The liability is subsequently remeasured at the end of each period and accreted through financial expenses up The Company determines the basis of control in line to the redemption amount that is payable at the date at with the requirements of Ind AS 110, Consolidated which the option first becomes exercisable. In the event Financial Statements. Subsidiaries and controlled trusts that the option expires unexercised, the liabilities is are entities controlled by the Group. The Group controls derecognised with a corresponding adjustment to equity. an entity when the parent has power over the entity, it is exposed to, or has rights to, variable returns from its Investments accounted for using the involvement with the entity and has the ability to affect those returns through its power over the entity. The HTXLW¥bPHWKRG financial statements of subsidiaries and controlled trusts Investments accounted for using the equity method are are included in the consolidated financial statements entities in respect of which, the Company has significant from the date on which control commences until the date influence, but not control, over the financial and operating on which control ceases. policies. Generally, a company has a significant influence 


LOGO

322 STATUTORY REPORTS AND FINANCIAL STATEMENTS CONSOLIDATED FINANCIAL STATEMENT UNDER IND AS Notes to the Consolidated Financial Statements (I in millions, except share and per share data, unless otherwise stated) if it holds between 20% and 50% of the voting power equities classified as financial instruments measured of another entity. Investments in such entities are at fair value through other comprehensive income accounted for using the equity method and are are included in other comprehensive income, net initially recognised at cost. The carrying amount of of taxes. investment is increased/ decreased to recognise investors share of profit or loss of the investee after b) Foreign operations the acquisition date. For the purpose of presenting consolidated financial statements, the assets and liabilities of the (ii) Functional and presentation currency Company’s foreign operations that have a functional Items included in the financial statements of each currency other than Indian Rupees are translated of the Company’s entities are measured using the into Indian Rupees using exchange rates prevailing currency of the primary economic environment in at the reporting date. Income and expense items which these entities operate (i.e. the “functional are translated at the average exchange rates for currency”). These consolidated financial statements the period. Exchange differences arising, if any, are are presented in Indian Rupees, which is the recognised in other comprehensive income and held functional currency of the Parent Company. in foreign currency translation reserve (“FCTR”), a component of equity, except to the extent that the (iii) Foreign currency transactions and translation difference is allocated to non-controlling interest. When a foreign operation is disposed of, the translation relevant amount recognised in FCTR is transferred a) Transactions and balances to the consolidated statement of profit and loss as part of the profit or loss on disposal. Goodwill and Transactions in foreign currency are translated fair value adjustments arising on the acquisition into the respective functional currencies using of a foreign operation are treated as assets and the exchange rates prevailing at the date of the liabilities of the foreign operation and translated at transaction. Foreign exchange gains and losses the exchange rate prevailing at the reporting date. resulting from the settlement of such transactions and from translation at the exchange rates prevailing c) Others at the reporting date of monetary assets and liabilities denominated in foreign currencies are recognised Foreign currency differences arising on the translation in the consolidated statement of profit and loss and or settlement of a financial liability designated as reported within foreign exchange gains/(losses), a hedge of a net investment in a foreign operation net, within results of operating activities except are recognised in other comprehensive income and when deferred in other comprehensive income presented within equity in the FCTR to the extent as qualifying cash flow hedges and qualifying net the hedge is effective. To the extent the hedge is investment hedges. Net loss relating to translation ineffective, such differences are recognised in the or settlement of borrowings denominated in foreign consolidated statement of profit and loss. currency are reported within finance costs. Net gain When the hedged part of a net investment is relating to translation or settlement of borrowings disposed of, the relevant amount recognised in REPORT 2025-26 denominated in foreign currency are reported within FCTR is transferred to the consolidated statement of ANNUAL other income. Non-monetary assets and liabilities profit and loss as part of the profit or loss on disposal. denominated in foreign currency and measured at Foreign currency differences arising from translation historical cost are translated at the exchange rate INTEGRATED prevalent at the date of transaction. Translation of intercompany receivables or payables relating differences on non-monetary financial assets to foreign operations, the settlement of which is measured at fair value at the reporting date, such as neither planned nor likely in the foreseeable future, WIPRO


LOGO

323 Notes to the Consolidated Financial Statements (I in millions, except share and per share data, unless otherwise stated) are considered to form part of net investment in foreign • the asset is held within a business model whose operation and are recognised in FCTR. objective is to hold assets in order to collect contractual cash flows; and (iv) Financial instruments • the contractual terms of the instrument give rise $__ 1RQ_GHULYDWLYH_ŮQDQFLDO_LQVWUXPHQWV_ on specified dates to cash flows that are solely Non-derivative financial instruments consist of: payment of principal and interest on the principal amount outstanding. • financial assets, which include cash and cash Financial instruments measured at fair value through equivalents, trade receivables, unbilled receivables, other comprehensive income (“FVTOCI”): finance lease receivables, employee and other advances, investments in equity and debt securities Debt instruments that meet the following criteria are and eligible current and non-current assets; and measured at FVTOCI (except for debt instruments • financial liabilities, which include long-term and short- that are designated at fair value through profit or loss term borrowings, trade payables, lease liabilities and on initial recognition): eligible current and non-current liabilities. • the asset is held within a business model Non-derivative financial instruments other than trade whose objective is achieved both by collecting receivables and unbilled receivables are recognised contractual cash flows and selling the financial initially at fair value. Trade receivables and unbilled asset; and receivables that do not contain a significant financing • the contractual terms of the instrument give rise component are measured at the Transaction Price. on specified dates to cash flows that are solely Subsequent to initial recognition, non-derivative financial payment of principal and interest on the principal instruments are measured as described below: amount outstanding. Interest income is recognised in the consolidated a. Cash and cash equivalents statement of profit and loss for FVTOCI debt The Company’s cash and cash equivalents consist instruments. Other changes in fair value of of cash on hand and in banks and demand deposits FVTOCI financial assets are recognised in other with banks, which can be withdrawn at any time, comprehensive income. When the investment is without prior notice or penalty on the principal. disposed of, the cumulative gain or loss previously For the purposes of the consolidated statement accumulated in reserves is transferred to the of cash flows, cash and cash equivalents include consolidated statement of profit and loss. cash on hand, in banks and demand deposits with Financial instruments measured at fair value through banks, net of outstanding bank overdrafts that are profit or loss (“FVTPL”): repayable on demand and are considered part Instruments that do not meet the amortised cost or of the Company’s cash management system. In FVTOCI criteria are measured at FVTPL. Financial the consolidated balance sheet, bank overdrafts assets at FVTPL are measured at fair value at the are presented under borrowings within current end of each reporting period, with any gains or financial liabilities. losses arising on re-measurement recognised in consolidated statement of profit and loss. The gain b. Investments or loss on disposal is recognised in the consolidated Financial instruments measured at amortised statement of profit and loss. FRVW_ Interest income is recognised in the consolidated Debt instruments that meet the following criteria statement of profit and loss for FVTPL debt are measured at amortised cost (except for debt instruments. Dividends on financial assets at FVTPL instruments that are designated at fair value through is recognised when the Company’s right to receive profit or loss on initial recognition): dividends is established.


LOGO

324 STATUTORY REPORTS AND FINANCIAL STATEMENTS CONSOLIDATED FINANCIAL STATEMENT UNDER IND AS Notes to the Consolidated Financial Statements (I in millions, except share and per share data, unless otherwise stated) _ _ ,QYHVWPHQWV_LQ_HTXLW¥_LQVWUXPHQWV_ _ G__7UDGH_SD¥DEOHV_DQG_RWKHU_OLDELOLWLHV_ The Company carries certain equity instruments Trade payables and other liabilities are initially which are not held for trading. At initial recognised at the transaction price, and recognition, the Company may make an subsequently carried at amortised cost using irrevocable election to present subsequent the effective interest method. For these financial changes in the fair value of an investment in instruments, the carrying amounts approximate an equity instrument in other comprehensive fair value due to the short-term maturity of income (FVTOCI) or through statement of profit these instruments. Contingent consideration and loss (FVTPL). For investments designated recognised in a business combination is initially to be classified as FVTOCI, movements in fair recognised at fair value and subsequently value of investments are recognised in other measured at fair value through profit or loss. comprehensive income and the gain or loss is not transferred to consolidated statement %__ ‘HULYDWLYH_ÙQDQFLDO_LQVWUXPHQWV of profit and loss on disposal of investments. For investments designated to be classified The Company is exposed to foreign currency as FVTPL, both movements in fair value of fluctuations on foreign currency assets, liabilities, investments and gain or loss on disposal of net investment in foreign operations and forecasted investments are recognised in the consolidated cash flows denominated in foreign currency. statement of profit and loss. The Company limits the effect of foreign exchange Dividends from these investments are recognised rate fluctuations by following established risk in the consolidated statement of profit and loss management policies including the use of when the Company’s right to receive dividends derivatives. The Company enters into derivative is established. financial instruments where the counterparty is When the investment in equity instruments is primarily a bank. derecognised, the cumulative gain or loss in Derivative financial instruments are recognised other comprehensive income is transferred to and measured at fair value. Attributable transaction retained earnings. costs are recognised in the consolidated statement of profit and loss as cost. _ F__2WKHU_ÙQDQFLDO_DVVHWV_ Subsequent to initial recognition, derivative financial Other financial assets are non-derivative financial instruments are measured as described below: assets with fixed or determinable payments that are not quoted in an active market. These _ D__&DVK_ùRZ_KHGJHV comprise trade receivables, unbilled receivables, Changes in the fair value of the derivative finance lease receivables, employee and other hedging instruments designated as a cash flow advances and eligible current and non-current hedge are recognised in other comprehensive assets. They are presented as current assets, income and held in cash flow hedging reserve, except for those expected to be realised later net of taxes, a component of equity, to the extent than twelve months after the reporting date that the hedge is effective. To the extent that REPORT 2025-26 which are presented as non-current assets. All the hedge is ineffective, changes in fair value ANNUAL financial assets are initially recognised at fair value and subsequently measured at amortised are recognised in the consolidated statement INTEGRATED cost using the effective interest method, less any of profit and loss and reported within foreign impairment losses. However, trade receivables exchange gains/(losses), net within results from and unbilled receivables that do not contain a operating activities. If the hedging instrument no significant financing component are measured longer meets the criteria for hedge accounting, then hedge accounting is discontinued WIPRO at the Transaction Price.


LOGO

325 Notes to the Consolidated Financial Statements (I in millions, except share and per share data, unless otherwise stated) prospectively. If the hedging instrument expires or &__ ‘HUHFRJQLWLRQ_RI_ÙQDQFLDO_LQVWUXPHQWV is sold, terminated or exercised, the cumulative gain The Company derecognises a financial asset when the or loss on the hedging instrument recognised in cash contractual rights to the cash flows from the financial flow hedging reserve till the period the hedge was asset expire or it transfers the financial asset and the effective remains in cash flow hedging reserve until transfer qualifies for derecognition under Ind AS 109. the forecasted transaction occurs. The cumulative If the Company retains substantially all the risks and gain or loss previously recognised in the cash flow rewards of a transferred financial asset, the Company hedging reserve is transferred to the consolidated continues to recognise the financial asset and recognises statement of profit and loss upon the occurrence of a borrowing for the proceeds received. A financial the related forecasted transaction. If the forecasted liability (or a part of a financial liability) is derecognised transaction is no longer expected to occur, such from the Company’s consolidated balance sheet when cumulative balance is immediately recognised in the the obligation specified in the contract is discharged or consolidated statement of profit and loss. cancelled or expires. b. Hedges of net investment in foreign operations (v) Equity and share capital The Company designates derivative financial instruments as hedges of net investments in foreign a) Share capital and Securities premium operations. The Company also designates foreign The authorised share capital of the Company as at currency denominated borrowing as a hedge of net investment in foreign operations. Changes in the March 31, 2026 is I 25,352 divided into 12,543,500,000 fair value of the derivative hedging instruments and equity shares of I 2 each, 25,000,000 preference shares gains/(losses) on translation or settlement of foreign of I 10 each and 150,000 10% optionally convertible currency denominated borrowings designated as a cumulative preference shares of I 100 each. Par value hedge of net investment in foreign operations are of the equity shares is recorded as share capital and the recognised in other comprehensive income and amount received in excess of par value is classified as presented within equity in the FCTR to the extent that Securities premium. the hedge is effective. To the extent that the hedge Every holder of equity shares, as reflected in the records is ineffective, changes in fair value are recognised of the Company as at the date of the shareholder meeting in the consolidated statement of profit and loss and shall have one vote in respect of each share held for all reported within foreign exchange gains/(losses), net matters submitted to vote in the shareholder meeting. within results from operating activities. c. Others b) Shares held by controlled trust (Treasury shares) Changes in fair value of foreign currency derivative The Company’s equity shares held by the controlled trust, instruments neither designated as cash flow hedges which is consolidated as part of the Group are classified nor hedges of net investment in foreign operations as treasury shares. The Company has 11,905,480 and are recognised in the consolidated statement of 11,905,480 treasury shares as at March 31, 2026 and profit and loss and reported within foreign exchange 2025, respectively. Treasury shares are recorded at gains/(losses), net within results from operating acquisition cost. activities. Changes in fair value and gains/(losses), net, on settlement of foreign currency derivative instruments relating to borrowings, which have not been designated as hedges are recorded in finance costs.


LOGO

326 STATUTORY REPORTS AND FINANCIAL STATEMENTS CONSOLIDATED FINANCIAL STATEMENT UNDER IND AS Notes to the Consolidated Financial Statements (I in millions, except share and per share data, unless otherwise stated) c) Retained earnings h) Foreign currency translation reserve Retained earnings is comprised of the Company’s The exchange differences arising from the translation undistributed earnings after taxes and is freely of financial statements of foreign subsidiaries, available for distribution. differences arising from translation of long-term inter-company receivables or payables relating to d) Capital Reserve foreign operations, settlement of which is neither planned nor likely in the foreseeable future, changes Capital reserve amounting to I 1,139 and I 1,139 as of in fair value of the derivative hedging instruments and March 31, 2026 and 2025, respectively is not freely gains/losses on translation or settlement of foreign available for distribution. currency denominated borrowings designated as hedge of net investment in foreign operations are e) Capital Redemption Reserve recognised in other comprehensive income, net of As per the Companies Act, 2013, capital redemption taxes and presented within equity in the FCTR. reserve is created when a company purchases its own shares out of free reserves or securities premium. L__ &DVK_ùRZ_KHGJLQJ_UHVHUYH A sum equal to the nominal value of the shares so Changes in fair value of derivative hedging purchased is transferred to capital redemption instruments designated and effective as a cash reserve. The reserve can be utilised in accordance flow hedge are recognised in other comprehensive with the provisions of Section 69 of the Companies income, net of taxes, and presented within equity as Act, 2013. Capital redemption reserve amounting cash flow hedging reserve. to I 13 and I 13 as of March 31, 2026 and 2025, respectively is not freely available for distribution. j) Others f) Share options outstanding account Changes in the fair value of financial instruments (debt or equity) measured at fair value through The Share options outstanding account is used other comprehensive income is recognised in other to record the value of equity-settled share-based comprehensive income, net of taxes and presented payment transactions with employees. The amounts within investment in debt instruments measured recorded in share options outstanding account are at fair value through OCI or investment in equity transferred to securities premium upon exercise instruments measured at fair value through OCI. of stock options and restricted stock unit options by employees. Actuarial gains and losses on remeasurements of the defined benefit plans are recognised in other g) Special Economic Zone re-investment comprehensive income, net of taxes and presented within equity in remeasurement of the defined reserve benefit plans. The Special Economic Zone (“SEZ”) re-investment reserve has been created out of profit of eligible k) Dividend Special Economic Zone units as per provisions of A final dividend on equity shares is recorded as a REPORT 2025-26 section 10AA(1)(ii) of the Income–tax Act, 1961 for liability on the date of approval by the shareholders. ANNUAL acquiring new plant and machinery. The said reserve should be utilised by the Company for acquiring plant An interim dividend is recorded as a liability on INTEGRATED and machinery as per the terms of Section 10AA(2) the date of declaration by the Company’s Board of the Income-tax Act, 1961. This reserve is not freely of Directors. available for distribution. WIPRO


LOGO

327 Notes to the Consolidated Financial Statements (I in millions, except share and per share data, unless otherwise stated) l) Buyback of equity shares appropriate are adjusted, annually. The estimated useful lives of assets are as follows: The buyback of equity shares, including tax thereon and related transaction costs are recorded as a reduction of Category Useful life securities premium and retained earnings. Further, capital Buildings 28 to 40 years redemption reserve is created as an apportionment from Plant and equipment 5 to 21 years retained earnings. Computer equipment and software 2 to 7 years m) Bonus issue )XUQLWXUH__Ù[WXUHV_DQG_HTXLSPHQW 5 years Vehicles 4 to 5 years For the purpose of bonus issue, the amount is transferred from capital redemption reserves, securities premium The Company believes that the technically evaluated and retained earnings to the share capital. useful lives, different from Schedule II of the Companies Act, 2013, best represent the period over which these (vi) Property, plant and equipment assets are expected to be used. When parts of an item of property, plant and equipment a) Recognition, measurement and de-recognition have different useful lives, they are accounted for as separate items (major components) of property, plant and equipment. Subsequent expenditure relating to Property, plant and equipment are measured at cost property, plant and equipment is capitalised only when less accumulated depreciation and impairment losses, it is probable that future economic benefits associated if any. Cost includes expenditures directly attributable with these will flow to the Company and the cost of the to the acquisition of the asset. General and specific item can be measured reliably. borrowing costs directly attributable to the construction of a qualifying asset are capitalised as part of the cost till Deposits and advances paid towards the acquisition of all the activities necessary to prepare the qualifying asset property, plant and equipment outstanding as at each for its intended use or sale are substantially completed. reporting date is classified as capital advances under The cost and related accumulated depreciation are other non-current assets and the cost of property, plant derecognised upon sale and disposition of the asset and equipment not available for use before such date are and the resultant gains or losses are recognised in the disclosed under capital work-in-progress. consolidated statement of profit and loss. Capital work-in-progress are measured at cost less (vii) Business combinations, Goodwill and accumulated impairment losses, if any. Intangible assets b) Depreciation a) Business combinations The Company depreciates property, plant and Business combinations are accounted for using the equipment over the estimated useful life on a straight- purchase (acquisition) method. The cost of an acquisition line basis from the date the assets are available for use. is measured as the fair value of the assets transferred, Leasehold improvements are amortised over the shorter liabilities incurred or assumed, and equity instruments of estimated useful life of the asset or the related lease issued at the date of exchange by the Company. term. Term licenses are amortised over their respective Identifiable assets acquired and liabilities and contingent contract term. Freehold land is not depreciated. The liabilities assumed in a business combination are estimated useful life of assets is reviewed and where measured initially at fair value at the date of acquisition. 


LOGO

328 STATUTORY REPORTS AND FINANCIAL STATEMENTS CONSOLIDATED FINANCIAL STATEMENT UNDER IND AS Notes to the Consolidated Financial Statements (I in millions, except share and per share data, unless otherwise stated) Transaction costs incurred in connection with a Customer-related intangibles includes customer business acquisition are expensed as incurred. contracts and customer relationships acquired The cost of an acquisition also includes the fair value as a part of business combinations. Marketing-of any contingent consideration measured as at the related intangibles includes vendor relationships, date of acquisition. Any subsequent changes to non-competes and brands acquired as a part of the fair value of contingent consideration classified business combinations. as liabilities, other than measurement period adjustments, are recognised in the consolidated (viii) Leases statement of profit and loss. The Company evaluates each contract or arrangement, whether it qualifies as lease as defined b) Goodwill under Ind AS 116. The excess of the cost of an acquisition over the Company’s share in the fair value of the acquiree’s The Company as a lessee identifiable assets and liabilities is recognised The Company enters into an arrangement for as goodwill. If the excess is negative, a bargain lease of land, buildings, plant and equipment purchase gain is recognised immediately in equity including computer equipment and vehicles. Such as capital reserve. Goodwill is measured at cost less arrangements are generally for a fixed period but accumulated impairment (if any). may have extension or termination options. The Goodwill associated with disposal of an operation Company assesses, whether the contract is, or that is part of a cash-generating unit is measured contains, a lease, at its inception. A contract is based on the relative values of the operation considered to contain a lease if it conveys the right disposed of and the portion of the cash-generating to control the use of an identified asset for a period unit retained, unless some other method better of time in exchange for consideration. reflects the goodwill associated with the operation A contract conveys the right to control the use of an disposed of. identified asset if the Company has the right to: c) Intangible assets (a) control use of an identified asset, Intangible assets acquired separately are measured (b) obtain substantially all the economic benefits at cost of acquisition. Intangible assets acquired in a from use of the identified asset, and business combination are measured at fair value as at (c) direct the use of the identified asset. the date of acquisition. Following initial recognition, The Company determines the lease term as the non-intangible assets are carried at cost less accumulated cancellable period of a lease, together with periods amortisation and impairment losses, if any. covered by an option to extend the lease, where The amortisation of an intangible asset with a finite the Company is reasonably certain to exercise that useful life reflects the manner in which the economic option. The Company makes an assessment on the benefit is expected to be generated. expected lease term on a lease-by-lease basis and REPORT 2025-26 The estimated useful life of amortisable intangibles thereby assesses whether it is reasonably certain is reviewed and where appropriate is adjusted, that any options to extend or terminate the contract ANNUAL annually. The estimated useful lives of the amortisable will be exercised. INTEGRATED intangible assets are as follows: At the commencement of the lease, the Company recognises a right of use (“RoU”) asset at cost and Category Useful life corresponding lease liability, except for leases with Customer-related intangibles 1 to 10 years term of twelve months or less (“Short-term leases”) and low-value assets. For these Short-term leases Marketing-related intangibles 2.5 to 10 years WIPRO and low-value assets, the Company recognises the 


LOGO

329 Notes to the Consolidated Financial Statements (I in millions, except share and per share data, unless otherwise stated) lease payments as an operating expense on a straight- there is a further reduction in the measurement of the line basis over the lease term. lease liability, the Company recognises any remaining The cost of the RoU assets comprises the amount of amount of the re-measurement in the consolidated the initial measurement of the lease liability, any lease statement of profit and loss. payments made at or before the inception date of the Payment of lease liabilities including interests are lease plus any initial direct costs plus an estimate of classified as cash used in financing activities in the costs to be incurred by the lessee in dismantling and consolidated statement of cash flows. removing the underlying asset or restoring the site on which it is located, less any lease incentives received. The Company as a lessor Subsequently, the RoU assets are measured at cost less any accumulated depreciation and accumulated Leases under which the Company is a lessor are classified impairment losses, if any. The RoU assets are depreciated as a finance or operating lease. Lease contracts where all using the straight-line method from the commencement the risks and rewards are substantially transferred to the date over the shorter of lease term or useful life of RoU lessee, are classified as a finance lease. All other leases assets. The estimated useful lives of RoU assets are are classified as operating lease. determined on the same basis as those of property, plant For leases under which the Company is an intermediate and equipment. lessor, the Company accounts for the head-lease and the The Company applies Ind AS 36 to determine whether sub-lease as two separate contracts. The sub-lease is a RoU asset is impaired and accounts for any identified further classified either as a finance lease or an operating impairment loss as described in the impairment of non- lease by reference to the RoU asset arising from the financial assets below. head-lease. For lease liabilities at the commencement of the lease, (ix) Inventories the Company measures the lease liability at the present value of the lease payments that are not paid at that Inventories are valued at lower of cost and net realisable date. The lease payments are discounted using the value, including necessary provision for obsolescence. interest rate implicit in the lease, if that rate is readily Cost is determined using the weighted average method. determined, if that rate is not readily determined, the lease payments are discounted using the incremental (x) Impairment borrowing rate that the Company would have to pay to borrow funds, including the consideration of factors a) Financial assets such as the nature of the asset and location, collateral, The Company applies the expected credit loss model for market terms and conditions, as applicable in a similar recognising impairment loss on financial assets measured economic environment. at amortised cost, debt instruments classified as FVTOCI, After the commencement date, the amount of lease trade receivables, unbilled receivables, finance lease liabilities is increased to reflect the accretion of interest receivables and other financial assets. Expected credit and reduced for the lease payments made. loss is the difference between the contractual cash flows and the cash flows that the entity expects to receive, The lease liability is subsequently remeasured by discounted using the effective interest rate. increasing the carrying amount to reflect interest on the lease liability, reducing the carrying amount to reflect Loss allowances for trade receivables, unbilled the lease payments made and remeasuring the carrying receivables and finance lease receivables are measured amount to reflect any lease modifications. The Company at an amount equal to lifetime expected credit loss. recognises the amount of the re-measurement of lease Lifetime expected credit losses are the expected credit liability due to modification as an adjustment to the RoU losses that result from all possible default events over the asset or in consolidated statement of profit and loss, expected life of a financial instrument. Lifetime expected depending upon the nature of modification. Where the credit loss is computed based on a provision matrix carrying amount of the RoU asset is reduced to zero and which takes into account, risk profiling of customers and 


LOGO

330 STATUTORY REPORTS AND FINANCIAL STATEMENTS CONSOLIDATED FINANCIAL STATEMENT UNDER IND AS Notes to the Consolidated Financial Statements (I in millions, except share and per share data, unless otherwise stated) historical credit loss experience adjusted for forward- exceeding written down value which would have looking information. For other financial assets, been reported if the impairment losses had not been expected credit loss is measured at the amount equal recognised initially. An impairment loss in respect of to twelve months expected credit loss unless there goodwill is not reversed subsequently. has been a significant increase in credit risk from initial recognition, in which case those are measured (xi) Employee benefits at lifetime expected credit loss. a) Post-employment plans E__ 1RQ_ÙQDQFLDO_DVVHWV The Group participates in various employee benefit plans. Pensions and other post- The Company assesses long-lived assets such as employment benefits are classified as either property, plant and equipment, RoU assets and defined contribution plans or defined benefit intangible assets for impairment whenever events plans. Under a defined contribution plan, the or changes in circumstances indicate that the Company’s sole obligation is to pay a fixed carrying amount of an asset or group of assets may amount with no obligation to pay further not be recoverable. If any such indication exists, the contributions if the fund does not hold sufficient Company estimates the recoverable amount of the assets to pay all employee benefits. The related asset or group of assets. actuarial and investment risks are borne by Goodwill is tested for impairment at least annually at the employee. The expenditure for defined the same time and when events occur or changes in contribution plans is recognised as an expense circumstances indicate that the recoverable amount during the period when the employee provides of the cash generating unit is less than its carrying service. Under a defined benefit plan, it is the value. The goodwill impairment test is performed Company’s obligation to provide agreed benefits at the level of cash-generating unit or groups of to the employees. The related actuarial and cash-generating units which represents the lowest investment risks are borne by the Company. The level at which goodwill is monitored for internal present value of the defined benefit obligations management purposes. is calculated by an independent actuary using the projected unit credit method. The recoverable amount of an asset or cash generating unit is the higher of its fair value less Remeasurements of the defined benefit plans, cost of disposal (“FVLCD”) and its value-in-use comprising actuarial gains or losses, the effect (“VIU”). The VIU of long-lived assets is calculated of changes to the asset ceiling, and the return on using projected future cash flows. FVLCD of a cash plan assets (excluding interest) are immediately generating unit is computed using turnover and recognised in other comprehensive income, net earnings multiples. If the recoverable amount of of taxes and not reclassified to profit or loss in the asset or the recoverable amount of the cash subsequent period. generating unit to which the asset belongs is less Net interest recognised in profit or loss is than its carrying amount, the carrying amount is calculated by applying the discount rate used to reduced to its recoverable amount. The reduction is measure the defined benefit obligation to the net treated as an impairment loss and is recognised in defined benefit liability or asset. The actual return REPORT 2025-26 the consolidated statement of profit and loss. on the plan assets above or below the discount ANNUAL If at the reporting date, there is an indication that a rate, is recognised as part of remeasurements previously assessed impairment loss on property, of the defined benefit plans through other INTEGRATED plant and equipment, RoU assets and intangible comprehensive income, net of taxes. assets, no longer exists, the recoverable amount is Past service cost, both vested and unvested, is reassessed and the impairment losses previously recognised as an expense at the earlier of (a) when recognised are reversed such that the asset is the plan amendment or curtailment occurs; and WIPRO recognised at its recoverable amount but not 


LOGO

331 Notes to the Consolidated Financial Statements (I in millions, except share and per share data, unless otherwise stated) (b) when the entity recognises related restructuring The Company’s obligations in respect of these costs or termination benefits. plans, which are defined benefit plans, are The Company has the following employee provided for based on actuarial valuation using benefit plans: the projected unit credit method. A. Provident fund C. Superannuation Eligible employees receive benefits under the Superannuation plan, a defined contribution Company’s provident fund plan, into which both scheme is administered by third party fund the employer and employees make periodic managers. The Company makes annual contributions to the approved provident fund contributions based on a specified percentage trust managed by the Company. A portion of of each eligible employee’s salary. the employer’s contribution is made to the government administered pension fund. _ E__7HUPLQDWLRQ_EHQHÙWV The contributions to the provident fund trust managed by the Company is accounted for as Termination benefits are expensed when the a defined benefit plan as the Company is liable Company can no longer withdraw the offer of for any shortfall in the fund assets based on the those benefits. government specified minimum rates of return. Certain employees receive benefits under the _ F__6KRUW_WHUP_EHQHÙWV provident fund plan in which both the employer Short-term employee benefit obligations such as and employees make periodic contributions to cash bonus, management incentive plans or profit-the government administered provident fund. A sharing plans are measured on an undiscounted portion of the employer’s contribution is made basis and are recorded as expense as the related to the government administered pension fund. service is provided. A liability is recognised for the This is accounted as a defined contribution plan amount expected to be paid under short-term cash as the obligation of the Company is limited to bonus or management incentive plans or profit-the contributions made to the fund. sharing plans, if the Company has a present legal or constructive obligation to pay this amount as a result B. Gratuity and foreign pension of past service provided by the employee and the In accordance with the Code on Social Security, obligation can be estimated reliably. 2020, applicable for Indian companies, the Company provides for a lump sum payment to d) Compensated absences eligible employees, at retirement or termination The employees of the Company are entitled to of employment based on the last drawn salary compensated absences. The employees can carry and years of employment with the Company. forward a portion of the unutilised accumulating The gratuity fund is managed by third party compensated absences and utilise it in future fund managers. periods or receive cash at retirement or termination The Company also maintains pension and of employment. The Company records an obligation similar plans for employees outside India, based for compensated absences in the period in which the on country specific regulations. These plans are employee renders the services that increases this partially funded, and the funds are managed by entitlement. The Company measures the expected third party fund managers. The plans provide cost of compensated absences as the additional for monthly payout after retirement as per amount that the Company expects to pay as a result salary drawn and service period or for a lump of the unused entitlement that has accumulated sum payment as set out in rules of each fund. at the end of the reporting period. The Company 


LOGO

332 STATUTORY REPORTS AND FINANCIAL STATEMENTS CONSOLIDATED FINANCIAL STATEMENT UNDER IND AS Notes to the Consolidated Financial Statements (I in millions, except share and per share data, unless otherwise stated) recognises accumulated compensated The amount recognised as a provision is the best absences based on actuarial valuation using the estimate of the consideration required to settle the projected unit credit method. Non-accumulating present obligation at the end of the reporting period, compensated absences are recognised in the considering the risks and uncertainties surrounding period in which the absences occur. the obligation. When some or all of the economic benefits required (xii) Share-based payment transactions to settle a provision are expected to be recovered from a third party, the receivable is recognised as an Selected employees of the Company receive asset, if it is virtually certain that reimbursement will remuneration in the form of equity settled instruments be received and the amount of the receivable can be or cash settled instruments, for rendering services measured reliably. over a defined vesting period and for Company’s performance-based stock options over the defined Provisions for onerous contracts are recognised period. Equity instruments granted are measured when the expected benefits to be derived by by reference to the fair value of the instrument at the the Company from a contract are lower than the date of grant. In cases, where equity instruments are unavoidable costs of meeting the future obligations granted at a nominal exercise price, the intrinsic value under the contract. Provisions for onerous contracts on the date of grant approximates the fair value. The are measured at the present value of lower of the expense is recognised in the consolidated statement expected net cost of fulfilling the contract and the of profit and loss with a corresponding increase to expected cost of terminating the contract. the share options outstanding account, a component of equity. (xiv) Revenue The equity instruments or cash settled instruments The Company derives revenue primarily from generally vest in a graded manner over the vesting software development, maintenance of software/ period. The fair value determined at the grant hardware and related services, consulting services, date is expensed over the vesting period of the business process services and sale of IT products. respective tranches of such grants (accelerated amortisation). The stock compensation expense is Revenues from customer contracts are considered determined based on the Company’s estimate of for recognition and measurement when the contract equity instruments or cash settled instruments that has been approved by the parties to the contract, will eventually vest. the parties to contract are committed to perform their Cash settled instruments granted are re-measured respective obligations under the contract, and the by reference to the fair value at the end of each contract is legally enforceable. Revenue is recognised reporting period and at the time of vesting. The upon transfer of control of promised products or expense is recognised in the consolidated statement services to customers in an amount that reflects the of profit and loss with a corresponding increase to consideration the Company expects to receive (the financial liability. “Transaction Price”). Revenue towards satisfaction of a performance obligation is measured at the amount (xiii) Provisions of the Transaction Price (net of variable consideration REPORT 2025-26 on account of discounts and allowances) allocated to ANNUAL Provisions are recognised when the Company has that performance obligation. To recognise revenues, a present obligation (legal or constructive), as a the Company applies the following five step INTEGRATED result of a past event, it is probable that an outflow approach: (1) identify the contract with a customer, (2) of economic benefits will be required to settle the identify the performance obligations in the contract, obligation and a reliable estimate can be made of the (3) determine the Transaction Price, (4) allocate the amount of the obligation. Transaction Price to the performance obligations in the contract, and (5) recognise revenues when a WIPRO performance obligation is satisfied. When there is 


LOGO

333 Notes to the Consolidated Financial Statements (I in millions, except share and per share data, unless otherwise stated) uncertainty as to collectability, revenue recognition is obligations are satisfied as and when the postponed until such uncertainty is resolved. services are rendered since the customer At contract inception, the Company assesses its promise generally obtains control of the work as it to transfer products or services to a customer to identify progresses. Percentage of completion is separate performance obligations. The Company determined based on project costs incurred to applies judgement to determine whether each product date as a percentage of total estimated project or service promised to a customer is capable of being costs required to complete the project. The distinct, and are distinct in the context of the contract, cost expended (or input) method has been if not, the promised products or services are combined used to measure progress towards completion and accounted as a single performance obligation. The as there is a direct relationship between input Company allocates the Transaction Price to separately and productivity. This method is followed identifiable performance obligations based on their when reasonably dependable estimates of relative stand-alone selling price or residual method. the revenues and costs applicable to various Stand-alone selling prices are determined based on elements of the contract can be made. Key sale prices for the components when they are regularly factors that are reviewed in estimating the sold separately, in cases where the Company is unable future costs to complete include estimates of to determine the stand-alone selling price, the Company future labor costs and productivity efficiencies. uses third-party prices for similar deliverables or the Because the financial reporting of these Company uses expected cost-plus margin approach in contracts depends on estimates that are estimating the stand-alone selling price. assessed continually during the term of these contracts, revenue recognised, profit and For performance obligations where control is transferred timing of revenue for remaining performance over time, revenues are recognised by measuring obligations are subject to revisions as the progress towards completion of the performance contract progresses to completion. If the obligation. The selection of the method to measure Company is not able to reasonably measure the progress towards completion requires judgement and is progress of completion, revenue is recognised based on the nature of the promised products or services only to the extent of costs incurred for which to be provided. recoverability is probable. When total cost The method for recognising revenues and costs depends estimates exceed revenues in an arrangement, on the nature of contracts with customers as given below: the estimated losses are recognised in the consolidated statement of profit and loss in the period in which such losses become probable A. Time and materials contracts based on the current contract estimates as an onerous contract provision. Revenues and costs relating to time and materials contracts are recognised as the related services A contract asset is a right to consideration are rendered. that is conditional upon factors other than the passage of time. Contract assets primarily B. Fixed-price contracts relate to unbilled amounts on fixed-price development contracts and are classified as i. Fixed-price development contracts non-financial asset as the contractual right to Revenues from fixed-price development consideration is dependent on completion of contracts, including software development, contractual milestones. and integration contracts, where the A contract liability is an entity’s obligation to performance obligations are satisfied over transfer goods or services to a customer for time, are recognised using the “percentage-which the entity has received consideration (or of-completion” method. The performance the amount is due) from the customer.


LOGO

334 STATUTORY REPORTS AND FINANCIAL STATEMENTS CONSOLIDATED FINANCIAL STATEMENT UNDER IND AS Notes to the Consolidated Financial Statements (I in millions, except share and per share data, unless otherwise stated) ii. Maintenance contracts the stand-alone selling price. Services added Revenues related to fixed-price that are not distinct are accounted for on a maintenance contracts are recognised cumulative catch up basis, while those that on a straight-line basis when services are are distinct are accounted for prospectively, performed through an indefinite number either as a separate contract if the additional of repetitive acts over a specified period services are priced at the stand-alone selling or ratably using percentage of completion price, or as a termination of the existing method when the pattern of benefits from contract and creation of a new contract if not the services rendered to the customers priced at the stand-alone selling price. and the cost to fulfil the contract is not even • The Company accounts for variable through the period of contract because the considerations like, volume discounts, services are generally discrete in nature rebates and pricing incentives to customers and not repetitive. and penalties as reduction of revenue on a Revenue for contracts in which the invoicing systematic and rational basis over the period is representative of the value being of the contract. The Company estimates delivered is recognised based on our right to an amount of such variable consideration invoice. If our invoicing is not consistent with using expected value method or the single value delivered, revenues are recognised most likely amount in a range of possible as the service is performed using the consideration depending on which method percentage of completion method. better predicts the amount of consideration to which the Company may be entitled and In certain projects, a fixed quantum of when it is probable that a significant reversal service or output units is agreed at a fixed of cumulative revenue recognised will not price for a fixed term. In such contracts, occur when the uncertainty associated with revenue is recognised with respect to the variable consideration is resolved. the actual output achieved till date as a • Revenues are shown net of allowances/ percentage of total contractual output. Any returns, sales tax, value added tax, goods and residual service unutilised by the customer services tax and applicable discounts. is recognised as revenue on completion of the term. • The Company may enter into arrangements with third party suppliers to resell products iii. Element or volume based contracts or services. In such cases, the Company Revenues and costs are recognised as the evaluates whether the Company is the related services are rendered. principal (i.e. report revenues on a gross basis) or agent (i.e. report revenues on a net basis). In doing so, the Company first C. Products evaluates whether the Company controls the Revenue on product sales are recognised good or service before it is transferred to the when the customer obtains control of the customer. The Company considers whether it REPORT 2025-26 specified product. has the primary obligation to fulfil the contract, ANNUAL inventory risk, pricing discretion and other D. Others factors to determine whether it controls the INTEGRATED goods or services and therefore, is acting as • Any change in scope or price is considered a principal or agent. If the Company controls to be a contract modification. The Company the good or service before it is transferred to accounts for modifications to existing the customer, the Company is the principal; if contracts by assessing whether the services not, the Company is the agent. WIPRO added are distinct and whether the pricing is at 


LOGO

335 Notes to the Consolidated Financial Statements (I in millions, except share and per share data, unless otherwise stated) • Estimates of the Transaction Price and total costs (xv) Finance costs or efforts are continuously monitored over the term of the contract and are recognised in net Finance costs comprise interest on borrowings, interest profit in the period when these estimates change on lease liabilities, interest on tax matters, interest on or when the estimates are revised. Revenues and net defined benefit liability, net loss on translation or the estimated total costs or efforts are subject to settlement of foreign currency borrowings, changes revision as the contract progresses. in fair value of derivative instruments, gains/(losses) of settlement of borrowing related derivative instruments • The Company accrues the estimated cost of and interest on liability on written put options. Borrowing warranties at the time when the revenue is costs that are not directly attributable to a qualifying recognised. The accruals are based on the asset are recognised in the consolidated statement of Company’s historical experience of material profit and loss using the effective interest method. usage and service delivery costs. • Incremental costs that relate directly to a (xvi) Finance and other income contract and incurred in securing a contract with Finance and other income comprise interest income on a customer are recognised as an asset when the deposits, dividend income, gains/(losses) on disposal of Company expects to recover these costs. investments, gains/(losses) on investments classified as • The Company recognises contract fulfilment cost FVTPL, net gain on translation or settlement of foreign as an asset if those costs specifically relate to a currency borrowings, changes in fair value and gains/ contract or to an anticipated contract, the costs (losses) on settlement of related derivative instruments generate or enhance resources that will be used and net gains/(losses) on sale of property, plant and in satisfying performance obligations in future; equipment. Interest income is recognised using the and the costs are expected to be recovered. effective interest method. Dividend income is recognised • Costs to obtain contracts relating to upfront when the right to receive payment is established. payments to customers are amortised to revenue (xvii) Income tax and other costs to obtain contracts and costs to fulfill contracts are amortised to expenses over Income tax comprises current and deferred tax. Income the respective contract life on a systematic basis tax expense is recognised in the consolidated statement consistent with the transfer of goods or services of profit and loss except to the extent it relates to a to customer to which the asset relates. business combination, or items directly recognised in • The Company assesses the timing of the transfer equity or in other comprehensive income. of goods or services to the customer as compared to the timing of payments to determine whether a) Current income tax a significant financing component exists. As Current income tax for the current and prior periods a practical expedient, the Company does not are measured at the amount expected to be assess the existence of a significant financing recovered from or paid to the taxation authorities component when the difference between based on the taxable income for the period. The tax payment and transfer of deliverables is twelve rates and tax laws used to compute the current tax months or less. If the difference in timing arises amounts are those that are enacted or substantively for reasons other than the provision of finance to enacted as at the reporting date and applicable for either the customer or us, no financing component the period. While determining the tax provisions, is deemed to exist. the Company assesses whether each uncertain • Unbilled receivables are classified as a financial tax position is to be considered separately or asset where the right to consideration is together with one or more uncertain tax positions unconditional and only the passage of time is depending upon the nature and circumstances of required before the payment is due. each uncertain tax position. The Company offsets current tax assets and current tax liabilities, where 


LOGO

336 STATUTORY REPORTS AND FINANCIAL STATEMENTS CONSOLIDATED FINANCIAL STATEMENT UNDER IND AS Notes to the Consolidated Financial Statements (I in millions, except share and per share data, unless otherwise stated) it has a legally enforceable right to set off the The Company offsets deferred income tax assets recognised amounts and where it intends either and liabilities, where it has a legally enforceable to settle on a net basis, or to realise the asset and right to offset current tax assets against current liability simultaneously. tax liabilities, and they relate to taxes levied by the same taxation authority on either the same b) Deferred income tax taxable entity, or on different taxable entities where there is a right and an intention to settle Deferred income tax is recognised using the the current tax liabilities and assets on a net balance sheet approach. Deferred income basis or their tax assets and liabilities will be tax assets and liabilities are recognised for realised simultaneously. deductible and taxable temporary differences arising between the tax base of assets and liabilities and their carrying amount in these (xviii) Earnings per share consolidated financial statements, except when Basic earnings per share is computed using the deferred income tax arises from the initial the weighted average number of equity shares recognition of goodwill or an asset or liability in outstanding during the period adjusted for treasury a transaction that is not a business combination shares held. Diluted earnings per share is computed and affects neither accounting nor taxable profits using the weighted average number of equity and or loss at the time of the transaction. dilutive equivalent shares outstanding during the Deferred income tax assets are recognised to period, using the treasury stock method for options, the extent it is probable that taxable profit will be except where the results would be anti-dilutive. available against which the deductible temporary The number of equity shares and potentially dilutive differences and the carry forward of unused tax equity shares are adjusted retrospectively for all credits and unused tax losses can be utilised. periods presented for any splits and bonus shares Deferred income tax liabilities are recognised issues including for change effected prior to the for all taxable temporary differences except in approval of the consolidated financial statements by respect of taxable temporary differences that is the Company’s Board of Directors. expected to reverse within the tax holiday period, (xix) Statement of cash flows taxable temporary differences associated with investments in subsidiaries, associates and Cash flows are reported using the indirect method, foreign branches where the timing of the reversal whereby profit for the period is adjusted for the effects of the temporary difference can be controlled of transactions of a non-cash nature, any deferrals or and it is probable that the temporary difference accruals of past or future operating cash receipts or will not reverse in the foreseeable future. payments and item of income or expenses associated The carrying amount of deferred income tax with investing or financing cash flows. The cash assets is reviewed at each reporting date and generated from/(used in) operating, investing and reduced to the extent that it is no longer probable financing activities of the Company are segregated. that sufficient taxable profit will be available to REPORT 2025-26 allow all or part of the deferred income tax asset New accounting standards, amendments ANNUAL to be utilised. and interpretations adopted by the Deferred income tax assets and liabilities are &RPSDQ¥_HIIHFWLYH_IURP_$SULO_________ INTEGRATED measured at the tax rates that are expected to apply in the period when the asset is realised or Amendments to Ind AS 21 – The Effects of changes the liability is settled, based on tax rates (and tax in foreign exchange rates laws) that have been enacted or substantively The amendment clarifies how an entity should assess WIPRO enacted at the reporting date. whether a currency is exchangeable and how it should determine a spot exchange rate when exchangeability 


LOGO

337 Notes to the Consolidated Financial Statements (I in millions, except share and per share data, unless otherwise stated) is lacking, as well as require the disclosure of information arrangements on the companies liabilities and cash flows that enables users of financial statements to understand and on the companies exposure to liquidity risk. These the impact of a currency not being exchangeable. These amendments are effective for annual reporting periods amendments are effective for annual reporting periods beginning on or after April 1, 2025 and are to be applied beginning on or after April 1, 2025. The adoption of retrospectively. The adoption of these amendments to Ind amendments to Ind AS 21 did not have any material impact AS 7 and Ind AS 107 did not have any material impact on on the consolidated financial statements. the consolidated financial statements. Amendments to Ind AS 1 – Presentation of Financial Amendments to Ind AS 12 – Income taxes statements On August 13, 2025, the MCA issued International Tax On August 13, 2025, the MCA has issued “Classification Reform—Pillar Two Model Rules—Amendments to Ind AS of liabilities as current or non -current and non-current 12 “Income Taxes” to clarify the application of Ind AS 12 to liabilities with covenants (Amendments to Ind AS 1)” The income taxes arising from tax law enacted or substantively amendments aim to promote consistency in applying enacted to implement the Organisation for Economic Co-the requirements by helping companies to determine operation and Development (OECD), including tax law whether, in the statement of financial position, debt and that implements qualified domestic minimum top-up taxes other liabilities with an uncertain settlement date should described in those rules. be classified as current (due or potentially due to be The Company has applied the temporary exception from settled within one year) or non-current. The amendments the accounting requirements for deferred taxes in Ind also clarified the classification requirements for debt a AS 12. Accordingly, the Company neither recognised, company might settle by converting it into equity. These nor disclosed information about deferred tax assets and amendments are effective for annual reporting periods liabilities related to Pillar Two income taxes. beginning on or after April 1, 2025, and are to be applied retrospectively. The adoption of these amendments to Ind AS 1 did not have any material impact on the consolidated New accounting standards, amendments and financial statements. LQWHUSUHWDWLRQV_QRW_¥HW_DGRSWHG_ Ministry of Corporate Affairs (“MCA”) notifies new _ _$PHQGPHQWV_WR_,QG_$6_____6WDWHPHQW_RI_FDVK_ůRZV_ standards or amendments to the existing standards and ind AS 107—Financial instruments under Companies (Indian Accounting Standards) On August 13, 2025, MCA issued ‘Supplier Finance Rules as issued from time to time. For the year ended Arrangements (Amendments to Ind AS 7 and Ind AS March 31, 2026, MCA has not notified any new standards 107)’, that require companies to disclose information or amendments to the existing standards applicable to about its supplier finance arrangements that enables the Company. users of financial statements to assess the effects of those 


LOGO

338 STATUTORY REPORTS AND FINANCIAL STATEMENTS CONSOLIDATED FINANCIAL STATEMENT UNDER IND AS Notes to the Consolidated Financial Statements (I in millions, except share and per share data, unless otherwise stated) 4. PROPERTY, PLANT AND EQUIPMENT Furniture Plant and 2IÙFH_ Land Buildings (1) and Vehicles Total equipment equipment Ù[WXUHV *URVV_FDUU¥LQJ_YDOXH_ As at April 1, 2025 H 4,373 H 52,360 H 99,474 H 19,479 H 7,663 H 34 H 183,383 Additions—923 9,253 1,795 737 3 12,711 Additions through Business —131 109 22 99 1 362 combination (Refer to Note 8) Disposals—(821) (14,979) (1,449) (720) (2) (17,971) Translation adjustment 31 440 3,182 270 147 1 4,071 As at March 31, 2026 K 4,404 K 53,033 K 97,039 K 20,117 K 7,926 K 37 K 182,556 $FFXPXODWHG_GHSUHFLDWLRQ__ LPSDLUPHQW_ As at April 1, 2025 H—H 12,801 H 73,379 H 12,890 H 5,823 H 17 H 104,910 Depreciation and impairment—1,848 9,669 2,387 686 5 14,595 Disposals—(695) (14,730) (1,245) (697) (1) (17,368) Translation adjustment—211 2,670 197 116 1 3,195 As at March 31, 2026 K—K 14,165 K 70,988 K 14,229 K 5,928 K 22 K 105,332 Net carrying value as at K 4,404 K 38,868 K 26,051 K 5,888 K 1,998 K 15 K 77,224 March 31, 2026 *URVV_FDUU¥LQJ_YDOXH_ As at April 1, 2024 H 4,375 H 46,828 H 102,433 H 18,136 H 7,514 H 34 H 179,320 Additions—6,215 10,623 3,143 943 10 20,934 Additions through Business — 9 ——9 combinations (Refer to Note 8) Disposals (6) (680) (13,668) (1,803) (793) (9) (16,959) Translation adjustment 4 (3) 77 3 (1) (1) 79 As at March 31, 2025 K 4,373 K 52,360 K 99,474 K 19,479 K 7,663 K 34 K 183,383 $FFXPXODWHG_GHSUHFLDWLRQ__ 2025-26 LPSDLUPHQW_ As at April 1, 2024 I—H11,579 H 75,469 H 12,188 H 5,934 H 22 H105,192 REPORT Depreciation and impairment—1,662 11,050 2,229 623 4 15,568 ANNUAL Disposals—(410) (13,189) (1,526) (730) (8) (15,863) Translation adjustment—(30) 49 (1) (4) (1) 13 INTEGRATED As at March 31, 2025 K—K 12,801 K 73,379 K 12,890 K 5,823 K 17 K 104,910 Net carrying value as at K 4,373 K 39,559 K 26,095 K 6,589 K 1,840 K 17 K 78,473 March 31, 2025 (1) Including net carrying value of computer equipment and software amounting to I 16,719 and I 16,003 as at March 31, 2026 and 2025 respectively. WIPRO


LOGO

339 Notes to the Consolidated Financial Statements (I in millions, except share and per share data, unless otherwise stated) 5. RIGHT-OF-USE ASSETS Category of Right-of-Use asset Plant and Land Buildings Vehicles Total equipment *URVV_FDUU¥LQJ_YDOXH_ As at April 1, 2025 I 1,122 I 35,038 I 5,445 I 740 I 42,345 Additions—7,697—233 7,930 Additions through Business combination (Refer to Note 8)—1,062 — 1,062 Disposals—(5,385) (959) (204) (6,548) Translation adjustment—2,062 593 135 2,790 As at March 31, 2026 K 1,122 K 40,474 K 5,079 K 904 K 47,579 $FFXPXODWHG_GHSUHFLDWLRQ_ As at April 1, 2025 I 106 I 14,904 I 1,356 I 381 I 16,747 Depreciation 19 5,611 875 220 6,725 Disposals—(4,421) (936) (156) (5,513) Translation adjustment—1,054 207 72 1,333 As at March 31, 2026 K 125 K 17,148 K 1,502 K 517 K 19,292 Net carrying value as at March 31, 2026 K 997 K 23,326 K 3,577 K 387 K 28,287 *URVV_FDUU¥LQJ_YDOXH_ As at April 1, 2024 H 1,343 H 28,453 H 2,242 H 849 H 32,887 Additions—10,822 3,735 228 14,785 Disposals (221) (4,389) (632) (354) (5,596) Translation adjustment—152 100 17 269 As at March 31, 2025 K 1,122 K 35,038 K 5,445 K 740 K 42,345 $FFXPXODWHG_GHSUHFLDWLRQ_ As at April 1, 2024 H 98 H 13,237 H 1,086 H 511 H 14,932 Depreciation 21 5,362 539 180 6,102 Disposals (13) (3,776) (303) (319) (4,411) Translation adjustment—81 34 9 124 As at March 31, 2025 K 106 K 14,904 K 1,356 K 381 K 16,747 Net carrying value as at March 31, 2025 K 1,016 K 20,134 K 4,089 K 359 K 25,598 The Company recognised the following expenses in the consolidated statement of profit and loss: Year ended Year ended March 31, 2026 March 31, 2025 Rent expense recognised under facility expenses pertaining to: Leases of low-value assets I 309 I 232 Short-term leases 3,304 3,842 K 3,613 K 4,074


LOGO

340 STATUTORY REPORTS AND FINANCIAL STATEMENTS CONSOLIDATED FINANCIAL STATEMENT UNDER IND AS Notes to the Consolidated Financial Statements (I in millions, except share and per share data, unless otherwise stated) Payments toward leases of low-value assets and Short-term leases are disclosed under operating activities in the consolidated statement of cash flows. All other lease payments during the period are disclosed under financing activities in the consolidated statement of cash flows. Income from subleasing RoU assets for the years ended March 31, 2026 and 2025 is not material. The Company is committed to certain leases amounting to H 999 which have not commenced as of March 31, 2026. The term of such leases ranges from 1 to 5 years. Lease liability Year ended Year ended March 31, 2026 March 31, 2025 Balance at the beginning of the year I 30,218 I 22,728 Additions 11,680 16,649 Additions through Business combinations 1,062 —Deletions (1,268) (967) Finance cost accrued during the period 1,956 1,593 Payment of lease liabilities (11,561) (10,474) Translation adjustment 2,949 689 Balance at the end of the year K 35,036 K 30,218 Included in the balance sheet as follows: Non-current K 26,327 K 22,193 Current 8,709 8,025 Refer to Note 10 for remaining contractual maturities of lease liabilities. 6. CAPITAL WORK-IN-PROGRESS (“CWIP”) The following table represents ageing of CWIP as on March 31, 2026: Amount in CWIP for a period of Less than More than 1-2 years 2-3 years Total 1 year 3 years Projects in progress I 3,322 I 450 I 350—I 4,122 Total K 3,322 K 450 K 350 K—K 4,122 The following table represents ageing of CWIP as on March 31, 2025: Amount in CWIP for a period of REPORT 2025-26 Less than More than 1-2 years 2-3 years Total ANNUAL 1 year 3 years Projects in progress I 1,575 I 389 I— I— I 1,964 INTEGRATED Total K 1,575 K 389 K— K— K 1,964 As on March 31, 2026 and 2025, there are no projects under CWIP whose completion is overdue compared to its original plan. As on March 31, 2026 and 2025, there are no projects under CWIP where the project costs has exceeded as compared WIPRO to its original plan.


LOGO

341 Notes to the Consolidated Financial Statements (I in millions, except share and per share data, unless otherwise stated) 7. GOODWILL AND OTHER INTANGIBLE ASSETS The movement in goodwill balance is given below: Year ended Year ended March 31, 2026 March 31, 2025 Balance at the beginning of the year I 320,346 H 311,449 Acquisition through Business combinations (Refer to Note 8)(1) 24,772 1,324 Translation adjustment 37,096 7,573 Balance at the end of the year K 382,214 K 320,346 (1) Acquisition through business combinations for the year ended March 31, 2026 is after considering the impact of H 7 towards measurement period changes in the purchase price allocation of acquisitions made during the year ended March 31, 2025. The Company is organised into two operating segments: IT Services and IT Products (Refer to Note 35). Goodwill as at March 31, 2026 and 2025 has been allocated to the IT Services operating segment. Goodwill recognised on business combinations is allocated to Cash Generating Units (“CGUs”), within the IT Services operating segment, which are expected to benefit from the synergies of the acquisitions. As at As at March 31, 2026 March 31, 2025 CGUs Americas 1 I 132,734 H 107,989 Americas 2 120,053 104,347 Europe 94,192 79,982 $VLD_3DFLŮF__0LGGOH_(DVW_DQG_$IULFD 35,235 28,028 K 382,214 K 320,346 For impairment testing, goodwill is allocated to a CGU representing the lowest level within the Group at which goodwill is monitored for internal management purposes, and which is not higher than the Company’s operating segment. Goodwill is tested for impairment at least annually in accordance with the Company’s procedure for determining the recoverable value of each CGU. The recoverable amount of the CGU is determined based on FVLCD. The FVLCD of the CGU is determined based on the market capitalisation approach, using the turnover and earnings multiples derived from observable market data. The fair value measurement is categorised as a level 2 fair value based on the inputs in the valuation techniques used. Based on the above testing, no impairment was identified as at March 31, 2026 and 2025, as the recoverable value of the CGUs exceeded the carrying value. A sensitivity analysis to the change in the key parameters (turnover and earnings multiples) did not identify any probable scenarios where the CGU’s recoverable amount would fall below its carrying amount.


LOGO

342 STATUTORY REPORTS AND FINANCIAL STATEMENTS CONSOLIDATED FINANCIAL STATEMENT UNDER IND AS Notes to the Consolidated Financial Statements (I in millions, except share and per share data, unless otherwise stated) The movement in other intangible assets is given below: Other intangible assets Customer-related Marketing-related Total *URVV_FDUU¥LQJ_YDOXH_ As at April 1, 2025 I 42,461 I 9,722 I 52,183 Acquisition through Business combination (Refer to Note 8) 5,644 1,109 6,753 Deductions/adjustments (4,420)— (4,420) Translation adjustment 4,387 1,122 5,509 As at March 31, 2026 K 48,072 K 11,953 K 60,025 $FFXPXODWHG_DPRUWLVDWLRQ__LPSDLUPHQW_ As at April 1, 2025 I 20,950 I 3,783 I 24,733 Amortisation and impairment (1) 6,599 1,188 7,787 Deductions/adjustments (4,420)— (4,420) Translation adjustment 2,252 497 2,749 As at March 31, 2026 K 25,381 K 5,468 K 30,849 Net carrying value as at March 31, 2026 K 22,691 K 6,485 K 29,176 *URVV_FDUU¥LQJ_YDOXH_ As at April 1, 2024 H 43,672 H 11,972 H 55,644 Acquisition through Business combinations (Refer to Note 8) 1,896 — 1,896 Deductions/adjustments (4,101) (2,518) (6,619) Translation adjustment 994 268 1,262 As at March 31, 2025 K 42,461 K 9,722 K 52,183 $FFXPXODWHG_DPRUWLVDWLRQ__LPSDLUPHQW_ 2025-26 As at April 1, 2024 H 18,281 H 4,615 H 22,896 REPORT Amortisation and impairment(1) 6,327 1,582 7,909 Deductions/adjustments (4,101) (2,518) (6,619) ANNUAL Translation adjustment 443 104 547 INTEGRATED As at March 31, 2025 K 20,950 K 3,783 K 24,733 Net carrying value as at March 31, 2025 K 21,511 K 5,939 K 27,450 (1) During the years ended March 31, 2026 and 2025, a decline in the revenue and earnings estimates led to a revision of recoverable value of customer- relationship intangible assets and marketing related intangible assets recognised on business combinations. Consequently, the Company has WIPRO recognised impairment charge H 851 and H 1,155 for the years ended March 31, 2026 and 2025, respectively, as part of amortisation and impairment.


LOGO

343 Notes to the Consolidated Financial Statements (I in millions, except share and per share data, unless otherwise stated) As at March 31, 2026, the net carrying value and the estimated remaining amortisation period for intangible assets acquired on acquisition are as follows: Estimated Net carrying remaining Acquisition value amortisation period Capco—customer-related intangible I 14,013 4.08 years Capco—marketing-related intangible 5,230 5.08 years DTS—customer-related intangible 5,650 5.67 years DTS—marketing-related intangible 1,045 2.67 years AVT 1,602 0.21—4.72 years Vara Infotech Private Limited 430 0.50—3.50 years Aggne 392 0.87—1.87 years Rational Interaction, Inc. 318 0.89 years Eximius Design, LLC 371 1.40 years Convergence Acceleration Solutions, LLC 125 2.03 years Total K 29,176 8. BUSINESS COMBINATIONS Summary of acquisitions during the year ended March 31, 2026: During the year ended March 31, 2026, the Company completed a business combination by acquiring 100% equity interest in Digital Transformation Solutions unit of Harman International Inc. which is Harman Connected Services Inc. and its subsidiaries and certain other assets (together, “DTS”), a global provider of Engineering, Research and Development (“ER&D”) services and IT services. The acquisition was consummated on December 1, 2025, for total cash consideration of I 34,044. Net assets I 3,017 Fair value of property, plant and equipment 362 Fair value of right-of-use assets 1,062 Fair value of customer-related intangibles 5,644 Fair value of marketing-related intangibles 1,109 Deferred tax liabilities on intangible assets (1,915) 7RWDO_LGHQWLÙDEOH_DVVHWV K 9,279 Goodwill 24,765 Total purchase price K 34,044 1HW_$VVHWV_LQFOXGH_ Cash and cash equivalents I 8,011 Fair value of acquired trade receivables included in net assets 3,066 Gross contractual amount of acquired trade receivables 3,225 Less: Allowance for lifetime expected credit loss (159) $PRXQW_LQFOXGHG_LQ_OHJDO_DQG_SURIHVVLRQDO_FKDUJHV_ Transaction costs I 230 The above purchase price allocation for DTS is provisional and will be finalised as soon as practicable within the measurement period, but in no event later than one year following the date of acquisition. The goodwill of H 24,765 comprises value of acquired workforce and expected synergies arising from the business combinations. Goodwill is allocated to IT Services segment and is not deductible for income tax purposes.


LOGO

344 STATUTORY REPORTS AND FINANCIAL STATEMENTS CONSOLIDATED FINANCIAL STATEMENT UNDER IND AS Notes to the Consolidated Financial Statements (I in millions, except share and per share data, unless otherwise stated) The pro-forma effects of acquisition of DTS for the year ended March 31, 2026, on the Company’s results were not material. Summary of acquisition during the year ended March 31, 2025: During the year ended March 31, 2025, the Company completed a business combination by acquiring a 100% equity interest in Applied Value Technologies, Inc. and Applied Value Technologies B.V., which was consummated on December 16, 2024. The Company has also acquired a 100% equity interest in Applied Value Technologies Pte Limited (together with Applied Value Technologies, Inc. and Applied Value Technologies B.V., “AVT”), which was consummated on January 3, 2025. AVT helps enterprises transform IT operations through a highly customised and data-driven approach. AVT will augment Wipro’s existing application services capabilities, helping drive new growth opportunities. The total consideration (upfront cash to acquire control, deferred consideration and contingent consideration) for the acquisition is H 2,836. During the year ended March 31, 2026, the Company finalised the purchase price allocation as set for the below: The following table presents the purchase price allocation: Net assets H 166 Fair value of property, plant and equipment 9 Fair value of customer-related intangibles 1,896 Deferred tax liabilities on intangible assets (566) 7RWDO_LGHQWLÙDEOH_DVVHWV K 1,505 Goodwill 1,331 Total purchase price K 2,836 1HW_$VVHWV_LQFOXGH_ Cash and cash equivalents H 113 Fair value of acquired trade receivables included in net assets 215 Gross contractual amount of acquired trade receivables 215 Less: Allowance for lifetime expected credit loss -$PRXQW_LQFOXGHG_LQ_OHJDO_DQG_SURIHVVLRQDO_FKDUJHV_ Transaction costs H 45 The goodwill of I 1,331 comprises value of acquired workforce and expected synergies arising from the business combinations. Goodwill is allocated to IT Services segment and is not deductible for income tax purposes. The total consideration for AVT included a deferred consideration of I 264, which was payable within six months from the consummation date and was subsequently settled. The total consideration of AVT includes a contingent consideration linked to achievement of revenues and earnings over a period of 3 years ending December 31, 2027, and range of contingent consideration payable is between I Nil and I 2,122. The fair value of the contingent consideration is estimated by applying the discounted cash-flow approach considering REPORT 2025-26 probability adjusted revenue and earnings estimates. The undiscounted fair value of contingent consideration is I 2,122 as ANNUAL at the date of acquisition. The discounted fair value of contingent consideration of I 1,537 is recorded as part of purchase price allocation. INTEGRATED The pro-forma effects of the acquisition of AVT for the year ended March 31, 2025 on the Company’s revenues and profits were not material. WIPRO


LOGO

345 Notes to the Consolidated Financial Statements (I in millions, except share and per share data, unless otherwise stated) 9. INVESTMENTS As at As at March 31, 2026 March 31, 2025 Non-current Financial instruments at FVTPL Equity instruments—unquoted (1) I 7,336 H 4,955 Fixed maturity plan mutual funds—unquoted—1,203 Financial instruments at FVTOCI Equity instruments—unquoted (1) 12,107 12,436 Equity instruments—quoted 36 57 Financial instruments at amortised cost Inter corporate and term deposits—unquoted (3) 8,574 7,807 K 28,053 K 26,458 Aggregate amount of quoted investments and aggregate market value thereof I 36 H 57 Aggregate amount of unquoted investments 28,017 26,401 Current Financial instruments at FVTPL Short-term mutual funds—unquoted (2) I 79,719 I 88,776 Fixed maturity plan mutual funds—unquoted 1,281 300 Financial instruments at FVTOCI Non-convertible debentures—quoted 210,328 219,389 Government securities—quoted 8,948 10,651 Commercial papers—quoted 14,227 2,858 Bonds—quoted 10,385 21,138 Financial instruments at amortised cost Inter corporate and term deposits—unquoted (3) 112,792 68,362 K 437,680 K 411,474 Aggregate amount of quoted investments and aggregate market value thereof I 243,888 I 254,036 Aggregate amount of unquoted investments 193,792 157,138 Financial instruments at FVTPL I 88,336 I 95,234 Financial instruments at FVTOCI 256,031 266,529 Financial instruments at amortised cost 121,366 76,169 Total Investment K 465,733 K 437,932 (1) Uncalled capital commitments outstanding as at March 31, 2026 and 2025, was I 2,577 and I 1,576, respectively. (2) As at March 31, 2026 and 2025, short-term mutual funds include units placed on lien with bank on account of margin money for currency derivatives amounting to I Nil and I 233, respectively. (3) These deposits earn a fixed rate of interest. As at March 31, 2026 and 2025, term deposits include deposits in lien with banks, held as margin money deposits against guarantees amounting to I 961 and I 953, respectively.


LOGO

346 STATUTORY REPORTS AND FINANCIAL STATEMENTS CONSOLIDATED FINANCIAL STATEMENT UNDER IND AS Notes to the Consolidated Financial Statements (I in millions, except share and per share data, unless otherwise stated) Investments accounted for using the equity method During the year ended March 31, 2026, the Company invested H 352 being equity contribution in Drivestream Inc, an associate. The Company’s share of equity in the associate is 43.7% . The Company had no material associate and joint venture as at March 31, 2026 and 2025. The aggregate summarised financial information in respect of the Company’s immaterial associate and joint venture that are accounted for using the equity method is set forth below: As at As at March 31, 2026 March 31, 2025 &DUU¥LQJ_DPRXQW_RI_WKH_&RPSDQ¥ńV_LQWHUHVW_LQ_ An associate accounted for using the equity method (Unquoted: Series A Preferred Stock—94,527; Common stock—27,865 and Series B I 1,716 H 933 Preferred Stock—190,525 and Series C Preferred stock—400) A joint venture accounted for using the equity method 410 394 (Unquoted: Class A units—5,850,000) Total K 2,126 K 1,327 For the year ended For the year ended March 31, 2026 March 31, 2025 &RPSDQ¥ńV_VKDUH_RI_QHW_SURŮW__ORVV__LQ_WKH_FRQVROLGDWHG_VWDWHPHQW_RI_SURŮW_DQG_ ORVV_SHUWDLQLQJ_WR_ An associate accounted for using the equity method I 282 H 129 A joint venture accounted for using the equity method (25) 125 Total K 257 K 254 10. Financial instruments The carrying value of financial instruments by categories as at March 31, 2026 is as follows: Fair value through other Fair value comprehensive income Amortised through Designated Total cost SURÙW_RU_ORVV Mandatory upon initial recognition Financial assets 2025-26 Cash and cash equivalents (Refer to Note 15) I— I— I— I 105,555 I 105,555 Investments (Refer to Note 9) REPORT Equity Instruments 7,336 — 12,143 — 19,479 ANNUAL Fixed maturity plan mutual funds 1,281 ——— 1,281 Short-term mutual funds 79,719 ——— 79,719 INTEGRATED Non-convertible debentures— 210,328 —— 210,328 Government securities— 8,948 —— 8,948 Commercial papers— 14,227 —— 14,227 Bonds— 10,385 —— 10,385 WIPRO Inter corporate and term deposits——— 121,366 121,366 


LOGO

347 Notes to the Consolidated Financial Statements (I in millions, except share and per share data, unless otherwise stated) Fair value through other Fair value comprehensive income Amortised through Designated Total cost SURÙW_RU_ORVV Mandatory upon initial recognition 2WKHU_ÙQDQFLDO_DVVHWV Trade receivables (Refer to Note 11)——— 136,250 136,250 Unbilled receivables——— 84,256 84,256 2WKHU_ÙQDQFLDO_DVVHWV__5HIHU_WR_1RWH____——— 16,504 16,504 Derivative assets (Refer to Note 10) 295 — 593 — 888 K 88,631 K 243,888 K 12,736 K 463,931 K 809,186 Financial liabilities 7UDGH_SD¥DEOHV_DQG_RWKHU_ŮQDQFLDO_OLDELOLWLHV Trade payables (Refer to Note 21) I- I— I— I 67,288 I 67,288 _ 2WKHU_ÙQDQFLDO_OLDELOLWLHV__5HIHU_WR_1RWH____ 1,634 —— 48,496 50,130 Borrowings (Refer to Note 17)——— 167,874 167,874 Lease liabilities——— 35,036 35,036 Derivative liabilities (Refer to Note 10) 1,453 — 9,525 — 10,978 K 3,087 K— K 9,525 K 318,694 K 331,306 The carrying value of financial instruments by categories as at March 31, 2025 is as follows: Fair value through other Fair value comprehensive income Amortised through Designated Total cost SURÙW_RU_ORVV Mandatory upon initial recognition Financial assets Cash and cash equivalents (Refer to Note 15) H—H—H—H 121,974 H 121,974 Investments (Refer to Note 9) Equity Instruments 4,955—12,493—17,448 Fixed maturity plan mutual funds 1,503 ——1,503 Short-term mutual funds 88,776 ——88,776 Non-convertible debentures—219,389 — 219,389 Government securities—10,651 — 10,651 Commercial papers—2,858 — 2,858 Bonds—21,138 — 21,138 Inter corporate and term deposits ——76,169 76,169 2WKHU_ÙQDQFLDO_DVVHWV Trade receivables (Refer to Note 11) ——118,044 118,044 Unbilled receivables ——64,280 64,280 2WKHU_ÙQDQFLDO_DVVHWV__5HIHU_WR_1RWH____ ——13,112 13,112 Derivative assets (Refer to Note 10) 1,105—715—1,820 K 96,339 K 254,036 K 13,208 K 393,579 K 757,162 Financial liabilities 7UDGH_SD¥DEOHV_DQG_RWKHU_ŮQDQFLDO_OLDELOLWLHV Trade payables (Refer to Note 21) H—H—H—H 58,667 H 58,667 2WKHU_ÙQDQFLDO_OLDELOLWLHV__5HIHU_WR_1RWH____ 1,864 — 39,392 41,256 Borrowings (Refer to Note 17) ——161,817 161,817 Lease liabilities ——30,218 30,218 Derivative liabilities (Refer to Note 10) 75—893—968 H 1,939 H—H 893 H 290,094 H 292,926


LOGO

348 STATUTORY REPORTS AND FINANCIAL STATEMENTS CONSOLIDATED FINANCIAL STATEMENT UNDER IND AS Notes to the Consolidated Financial Statements (I in millions, except share and per share data, unless otherwise stated) Offsetting financial assets and financial liabilities The following table contains information on financial assets and financial liabilities subject to offsetting: As at March 31, 2026 As at March 31, 2025 Gross Gross amounts of amounts of Financial assets Gross Net Gross Net recognised recognised amounts amounts amounts amounts ÙQDQFLDO_ ÙQDQFLDO_ recognised recognised recognised recognised liabilities liabilities set off set off Trade receivables—non-current I 349 I—I 349 I 299 H—H 299 Trade receivables—current 147,371 (11,470) 135,901 126,512 (8,767) 117,745 2WKHU_ÙQDQFLDO_DVVHWV___QRQ_FXUUHQW 6,259—6,259 4,664—4,664 2WKHU_ÙQDQFLDO_DVVHWV___FXUUHQW 10,245—10,245 8,448—8,448 Unbilled receivables—non-current 7,433—7,433 Unbilled receivables—current 77,802 (979) 76,823 66,194 (1,914) 64,280 K 249,459 K (12,449) K 237,010 K 206,117 K (10,681) K 195,436 As at March 31, 2026 As at March 31, 2025 Gross Gross amounts of amounts of Financial liabilities Gross Net Gross Net recognised recognised amounts amounts amounts amounts ÙQDQFLDO_ ÙQDQFLDO_ recognised recognised recognised recognised assets set assets set off off Trade payables—non-current I 4,394 I—I 4,394 H—H—H -Trade payables—current I 75,343 I (12,449) 62,894 69,348 (10,681) 58,667 2WKHU_ÙQDQFLDO_OLDELOLWLHV___QRQ_FXUUHQW 6,743 I—6,743 7,793—7,793 2WKHU_ÙQDQFLDO_OLDELOLWLHV___FXUUHQW 43,387—43,387 33,463—33,463 K 129,867 K (12,449) K 117,418 K 110,604 K (10,681) K 99,923 For the financial assets and liabilities subject to offsetting or similar arrangements, each agreement between the Company and the counterparty allows for net settlement of the relevant financial assets and liabilities when both elect to settle on a net basis. In the absence of such an election, financial assets and liabilities will be settled on a gross basis and hence are not offset. Fair value Financial assets and liabilities include cash and cash equivalents, trade receivables, unbilled receivables, finance lease receivables, employee and other advances, eligible current and non-current assets, borrowings, lease liabilities, trade REPORT 2025-26 payables, eligible current and non-current liabilities. ANNUAL The fair value of cash and cash equivalents, trade receivables, unbilled receivables, short-term borrowings, lease liabilities, INTEGRATED trade payables, other current financial assets and liabilities approximate their carrying amount largely due to the short-term nature of these instruments. Finance lease receivables are periodically evaluated based on individual credit worthiness of customers. Based on this evaluation, the Company records allowance for estimated credit losses on these receivables. As at March 31, 2026 and 2025, the carrying value of such financial assets, net of allowances, and liabilities approximates the fair value. WIPRO The Company’s Unsecured Notes 2026 are contracted at fixed coupon rate of 1.50% and market yield on these loans as of March 31, 2026, was 4.48% .


LOGO

349 Notes to the Consolidated Financial Statements (I in millions, except share and per share data, unless otherwise stated) Investments in short-term mutual funds and fixed maturity plan mutual funds, which are classified as FVTPL are measured using net asset values at the reporting date multiplied by the quantity held. Fair value of investments in non-convertible debentures, government securities, commercial papers and bonds classified as FVTOCI is determined based on the indicative quotes of price and yields prevailing in the market at the reporting date. Fair value of investments in equity instruments classified as FVTOCI or FVTPL is determined using market approach primarily based on market multiples method. The fair value of derivative financial instruments is determined based on observable market inputs including currency spot and forward rates, yield curves and currency volatility. Fair value hierarchy The table below analyses financial instruments carried at fair value, by valuation method. The different levels have been defined as follows: Level 1 – Quoted prices (unadjusted) in active markets for identical assets or liabilities. Level 2 – Inputs other than quoted prices included within Level 1 that are observable for the asset or liability, either directly (i.e. as prices) or indirectly (i.e. derived from prices). Level 3 – Inputs for the assets or liabilities that are not based on observable market data (unobservable inputs). There were no transfers between Levels 1, 2 and 3 during the years ended March 31, 2026 and 2025. The following table presents fair value hierarchy of assets and liabilities measured at fair value on a recurring basis: As at March 31, 2026 As at March 31, 2025 Fair value measurements at reporting date Fair value measurements at reporting date Total Level 1 Level 2 Level 3 Total Level 1 Level 2 Level 3 Assets ‘HULYDWLYH_LQVWUXPHQWV_ &DVK_ùRZ_KHGJHV K 593 I- I 593 I- K 715 I- I 715 I-Others 295—295—1,105—1,105—,QYHVWPHQWV_ Short-term mutual funds 79,719 79,719 — 88,776 88,776 —Fixed maturity plan mutual funds 1,281—1,281—1,503—1,503 -Equity instruments 19,479 36—19,443 17,448 57—17,391 Non-convertible debentures, government securities, commercial 243,888 8,854 235,034—254,036 10,550 243,486 -papers and bonds Liabilities ‘HULYDWLYH_LQVWUXPHQWV_ _ &DVK_ùRZ_KHGJHV K (9,525) I- I (9,525) I- K (893) H- H (893) H- Others (1,453)—(1,453)—(75)—(75)—Liability on written put options to non- (5,699) — (5,699) (4,945) — (4,945) controlling interests Contingent consideration (1,634) — (1,634) (1,864) — (1,864)


LOGO

350 STATUTORY REPORTS AND FINANCIAL STATEMENTS CONSOLIDATED FINANCIAL STATEMENT UNDER IND AS Notes to the Consolidated Financial Statements (I in millions, except share and per share data, unless otherwise stated) The following methods and assumptions were used to estimate the fair value of the Level 2 financial instruments included in the above table. Financial Instrument Method and assumptions 7KH_&RPSDQ¥_HQWHUV_LQWR_GHULYDWLYH_ŮQDQFLDO_LQVWUXPHQWV_ZLWK_YDULRXV_ counterparties, primarily banks with investment grade credit ratings. Derivatives valued using valuation techniques with market observable inputs are mainly interest rate swaps, foreign exchange forward contracts and foreign exchange option contracts. The most frequently applied valuation techniques include forward pricing, swap models and Black Scholes models (for option valuation), using present value Derivative instruments (assets and liabilities) calculations. The models incorporate various inputs including the credit quality of counterparties, foreign exchange spot and forward rates, interest rate curves and forward rate curves of the underlying. As at March 31, 2026, the changes in counterparty credit risk had no material effect on the hedge effectiveness assessment for derivatives GHVLJQDWHG_LQ_KHGJH_UHODWLRQVKLSV_DQG_RWKHU_ÙQDQFLDO_LQVWUXPHQWV_ recognised at fair value. Investment in non-convertible debentures, Fair value of these instruments is derived based on the indicative government securities, commercial papers and bonds quotes of price and yields prevailing in the market as at reporting date. ,QYHVWPHQW_LQ_Ů[HG_PDWXULW¥_SODQ_PXWXDO_IXQGV Fair value of these instruments is derived based on indicative quotes of price prevailing in the market as at reporting date. The following methods and assumptions were used to estimate the fair value of the Level 3 financial instruments included in the above table. Financial instrument Method and assumptions Fair value of these instruments is determined using market approach primarily Investment in equity instruments based on market multiples method. Contingent consideration and liability on Fair value of these instruments is determined using valuation techniques which written put options to non-controlling interest LQFOXGHV_LQSXWV_UHODWLQJ_WR_ULVN_DGMXVWHG_UHYHQXH_DQG_RSHUDWLQJ_SURÙW_IRUHFDVW_ The following table presents the changes in Level 3 assets and liabilities for the year ended March 31, 2026 and 2025: As at As at March 31, 2026 March 31, 2025 Investment in equity instruments Balance at the beginning of the year I 17,391 H 20,126 Additions 2,038 1,925 2025-26 Disposals(1)(2) (1,199) (1,828) REPORT *DLQ__ORVV__UHFRJQLVHG_LQ_FRQVROLGDWHG_VWDWHPHQW_RI_SURÙW_DQG_ORVV 768 321 Gain/(loss) recognised in other comprehensive income (1,431) (3,609) ANNUAL Translation adjustment 1,876 456 Balance at the end of the year K 19,443 K 17,391 (1) INTEGRATED During the year ended March 31, 2026, as a result of an acquisition by another investors, the Company sold its shares of equity instruments in three companies at a fair value of H 585 and recognised a cumulative gain of H 389 in other comprehensive income and cumulative loss of H 138 in consolidated statement of profit and loss. (2) During the year ended March 31, 2025, as a result of an acquisition by another investors, the Company sold its shares of equity instruments in six companies at a fair value of 152 in H 1,281 and recognised a cumulative loss of H 175 in other comprehensive income and cumulative gain of H WIPRO consolidated statement of profit and loss.


LOGO

351 Notes to the Consolidated Financial Statements (I in millions, except share and per share data, unless otherwise stated) As at As at March 31, 2026 March 31, 2025 Contingent consideration Balance at the beginning of the year I (1,864) I (429) (Addition)/Reversals (1) (49) 169 Addition through Business combination (Refer to Note 8)—(1,537) Payouts 648—)LQDQFH_FRVWV_UHFRJQLVHG_LQ_FRQVROLGDWHG_VWDWHPHQW_RI_SURÙW_DQG_ORVV (195) (47) Translation adjustment (174) (20) Balance at the end of the year K (1,634) K (1,864) (1) Towards change in fair value of earn-out liability as a result of changes in estimates of revenue and earnings over the earn-out period. As at As at March 31, 2026 March 31, 2025 Liability on written put options to non-controlling interests Balance at the beginning of the year I (4,945) H (4,303) )LQDQFH_FRVWV_UHFRJQLVHG_LQ_FRQVROLGDWHG_VWDWHPHQW_RI_SURÙW_DQG_ORVV (585) (530) Changes in fair value of written put options 385 -Translation adjustment (554) (112) Balance at the end of the year K (5,699) K (4,945) As at March 2026 and 2025, every 1% increase/decrease in the unobservable inputs used to estimate the fair value of investment in equity instruments, fair value of contingent consideration and liability on written put options to non-controlling interests, does not have a material impact on its fair value. Derivative assets and liabilities: The Company is exposed to currency fluctuations on foreign currency assets/liabilities, forecasted cash flows denominated in foreign currency and net investment in foreign operations. The Company is also exposed to interest rate fluctuations on investments in floating rate financial assets and floating rate borrowings. The Company follows established risk management policies, including the use of derivatives to hedge foreign currency assets/liabilities, interest rates, foreign currency forecasted cash flows and net investment in foreign operations. The counterparties in these derivative instruments are primarily banks and the Company considers the risks of non-performance by the counterparty as immaterial.


LOGO

352 STATUTORY REPORTS AND FINANCIAL STATEMENTS CONSOLIDATED FINANCIAL STATEMENT UNDER IND AS Notes to the Consolidated Financial Statements (I in millions, except share and per share data, unless otherwise stated) The following table presents the aggregate contracted principal amounts of the Company’s derivative contracts outstanding: (in million) As at March 31, 2026 As at March 31, 2025 Notional Fair value Notional Fair value Designated derivative instruments Sell: Forward contracts U.S.$ 2,475 I (8,574) U.S.$ 1,008 H (608) € 118 H 347 € 46 H 78 £66 H 169 £ 43 H 30 AUD 31 H (20) AUD 23 H 79 Buy: Forward contracts U.S.$ 750 H 500 U.S.$—H— Range forward option U.S.$ 400 H (1,497) U.S.$ 764 H 333 contracts €41 H 108 € 36 H (55) £41 H 67 £ 43 H (89) AUD 76 H (32) AUD 31 H 5 Interest rate swaps U.S.$—H—U.S.$ 225 H 24 Non-designated derivative instruments Sell: Forward contractsb___ U.S.$ 944 H (1,581) U.S.$ 752 H 975 € 237 H 299 € 94 H (27) £79 H 176 £ 12 H (14) AUD 47 H 74 AUD 65 H 12 SGD 45 H 55 SGD 34 H 4 ZAR 55 H 8 ZAR 162 H (13) CAD 95 H 47 CAD 142 H 71 SAR 30 H ^ SAR 179 H (4) QAR 5 H ^ QAR 13 H ^ TRY 90 H 1 TRY 90 H 2 NOK 12 H 1 NOK—H -OMR 1 H ^ OMR 2 H ^ JPY 1,220 H 32 JPY 705 H (13) 2025-26 DKK—H—DKK 31 H (11) REPORT CNH—H—CNH 7 H (1) COP 8,120 H (3) COP 8,120 H 1 ANNUAL MYR 24 H 20 MYR 32 H 1 RON—H—RON 8 H (1) HKD 42 H ^ HKD 39 H ^ INTEGRATED TWD 57 H 1 TWD 40 H ^ CHF 6 H 13 CHF 9 H (3) PHP—H—PHP 150 H (4) THB 52 H (2) THB 43 H 2 PLN 8 H 1 PLN 10 H 1 WIPRO BRL 106 H (18) BRL 17 H (2)


LOGO

353 Notes to the Consolidated Financial Statements (I in millions, except share and per share data, unless otherwise stated) (in million) As at March 31, 2026 As at March 31, 2025 Notional Fair value Notional Fair value Buy: Forward contracts U.S.$ 20 H 15 U.S.$ 18 H (25) € 193 H (162) € 10 H 23 £16 H (16) £ 24 H 37 AUD—H—AUD 3 H (2) CAD 20 H (11) CAD 19 H (40) QAR 9 H ^ QAR 4 H ^ CNH 208 H (7) CNH 137 H (1) RON 51 H (12) RON 67 H 11 PLN 76 H (43) PLN 99 H 56 SEK 19 H (7) SEK 34 H 18 BRL 10 H 8 BRL 66 H 18 JPY 347 H (1) JPY 306 H 3 DKK 9 H ^ DKK 9 H (1) THB 30 H (6) THB 178 H (5) CRC 2,300 H (7) CRC 1,871 H ^ PHP 90 H (2) PHP 168 H 2 PEN—H—PEN 5 H ^ LKR 1,693 H (2) LKR 1,100 H (1) CLP 2,900 H (3) CLP 2,900 H (5) BHD 1 H ^ BHD 1 H ^ OMR ^ H ^ OMR ^ H ^ HKD—H—HKD 38 H (5) SGD—H—SGD 2 H (3) MYR 9 H (4) MYR 7 H ^ MXN 178 H (14) MXN 81 H (1) AED 16 H ^ AED—H -SAR 11 H ^ SAR—H -KRW 6,400 H (8) KRW—H—K (10,090) K 852 ^ Value is less than 0.5 (1) U.S.$ 944 and U.S.$ 752 includes U.S.$/PHP sell forward of U.S.$ 242 and U.S.$ 197 as at March 31, 2026 and 2025, respectively.


LOGO

354 STATUTORY REPORTS AND FINANCIAL STATEMENTS CONSOLIDATED FINANCIAL STATEMENT UNDER IND AS Notes to the Consolidated Financial Statements (I in millions, except share and per share data, unless otherwise stated) The Company determines the existence of an economic relationship between the hedging instrument and the hedged item based on the currency, amount and timing of its forecasted cash flows. Hedge effectiveness is determined at the inception of the hedge relationship, and through periodic prospective effectiveness assessments to ensure that an economic relationship exists between the hedged item and hedging instrument, including whether the hedging instrument is expected to offset changes in cash flows of hedged items. If the hedge ratio for risk management purposes is no longer optimal but the risk management objective remains unchanged and the hedge continues to qualify for hedge accounting, the hedge relationship will be rebalanced by adjusting either the volume of the hedging instrument or the volume of the hedged item so that the hedge ratio aligns with the ratio used for risk management purposes. Any hedge ineffectiveness is calculated and accounted for in consolidated statement of profit and loss at the time of the hedge relationship rebalancing. The following table summaries activity in the cash flow hedging reserve within equity related to all derivative instruments classified as cash flow hedges: As at As at March 31, 2026 March 31,2025 Balance as at the beginning of the year I (275) H 773 Changes in fair value of effective portion of derivatives (13,440) (1,185) Deferred cancellation gain/(loss), net (1,174) (91) _ 1HW__JDLQ__ORVV_UHFODVVLÙHG_WR_FRQVROLGDWHG_VWDWHPHQW_RI_SURÙW_DQG_ORVV_RQ_ (1) 5,163 203 occurrence of hedged transactions _ ,QHIIHFWLYH_SRUWLRQ_RI_GHULYDWLYH_LQVWUXPHQWV_FODVVLÙHG_WR_FRQVROLGDWHG_VWDWHPHQW_RI_—25 SURÙW_DQG_ORVV _ ,QHIIHFWLYH_SRUWLRQ_RI_GHULYDWLYH_LQVWUXPHQWV_FODVVLÙHG_WR_FRQVROLGDWHG_VWDWHPHQW_RI_ 7—SURÙW_DQG_ORVV *DLQ__ORVV__RQ_FDVK_ùRZ_KHGJLQJ_GHULYDWLYHV__QHW K (9,444) K (1,048) Balance as at the end of the year K (9,719) K (275) Deferred tax asset/(liability) thereon 2,320 65 Balance as at the end of the year, net of deferred taxes K (7,399) K (210) (1) Includes net (gain)/loss reclassified to revenue of H 6,093 and H 394 for the years ended March 31, 2026 and 2025, respectively; net (gain)/loss reclassified to employee benefits expense of H (877) and H (51) for the years ended March 31, 2026 and 2025, respectively; net (gain)/loss reclassified to finance costs of H (53) and H (213) for the years ended March 31, 2026 and 2025, respectively and net (gain)/loss reclassified to other income of H Nil and H 73 for the years ended March 31, 2026 and 2025, respectively. The related hedge transactions for balance in cash flow hedging reserves as at March 31, 2026 are expected to occur and be reclassified to the consolidated statement of profit and loss over a period of 12 months. As at March 31, 2026 and 2025, there were no material gains or losses on derivative transactions or portions thereof that have become ineffective as hedges or associated with an underlying exposure that did not occur. REPORT 2025-26 Sale of financial assets ANNUAL From time to time, in the normal course of business, the Company transfers accounts receivables, unbilled receivables, net investment in finance lease receivables (financial assets) to banks. Under the terms of the arrangements, the Company INTEGRATED either substantially transfers its risks and rewards or surrenders control over the financial assets and transfer is without recourse. Accordingly, on such transfers the financial assets are derecognised and considered as sale of financial assets. Gains and losses on sale of the financial assets without recourse are recorded in finance costs, at the time of sale based on the carrying value of the financial assets and fair value of servicing liability. The incremental impact of such transactions WIPRO on our cash flow and liquidity for the years ended March 31, 2026 and 2025 is not material.


LOGO

355 Notes to the Consolidated Financial Statements (I in millions, except share and per share data, unless otherwise stated) Financial risk management Market Risk Market risk is the risk of loss of future earnings, to fair values or to future cash flows that may result from a change in the price of a financial instrument. The value of a financial instrument may change as a result of changes in the interest rates, foreign currency exchange rates and other market changes that affect market risk sensitive instruments. Market risk is attributable to all market risk sensitive financial instruments including investments, foreign currency receivables, payables and borrowings. The Company’s exposure to market risk is a function of investment and borrowing activities and revenue generating activities in foreign currency. The objective of market risk management is to avoid excessive exposure of the Company’s earnings and equity to losses. Risk Management Procedures The Company manages market risk through a corporate treasury department, which evaluates and exercises independent control over the entire process of market risk management. The corporate treasury department recommends risk management objectives and policies, which are approved by our senior management and the Company’s Audit, Risk and Compliance Committee. The activities of this department include management of cash resources, implementing hedging strategies for foreign currency exposures, borrowing strategies, and ensuring compliance with market risk limits and policies. Foreign currency risk The Company operates internationally, and a major portion of its business is transacted in several currencies. Consequently, the Company is exposed to foreign exchange risk through receiving payment for sales and services in the United States and elsewhere and making purchases from overseas suppliers in various foreign currencies. The exchange rate risk primarily arises from foreign exchange revenue, receivables, cash balances, forecasted cash flows, payables and foreign currency borrowings. A significant portion of the Company’s revenue is in the U.S. Dollars, Pound Sterling, Euro, Indian Rupee, Australian Dollars and Canadian Dollars, while a large portion of costs are in Indian Rupees. The exchange rate between the Indian Rupee and these currencies has fluctuated significantly in recent years and may continue to fluctuate in the future. Appreciation of the Indian Rupee against these currencies can adversely affect the Company’s results of operations. The Company evaluates exchange rate exposure arising from these transactions and enters into foreign currency derivative instruments to mitigate such exposure. The Company follows established risk management policies, including the use of derivatives like foreign exchange forward/option contracts to hedge forecasted cash flows denominated in foreign currency. The Company has designated certain derivative instruments as cash flow hedges to mitigate the foreign exchange exposure of forecasted highly probable cash flows. As at March 31, 2026, a H 1 increase in the spot exchange rate of the Indian Rupee with the U.S. Dollar would result in an approximately H 2,756 (including consolidated statement of profit and loss of H 683 and other comprehensive income of H 2,073) decrease in the fair value, and a H 1 decrease would result in an approximately H 2,743 (including consolidated statement of profit and loss of H 683 and other comprehensive income of H 2,060) increase in the fair value of foreign currency dollar denominated derivative instruments (forward and option contracts).


LOGO

356 STATUTORY REPORTS AND FINANCIAL STATEMENTS CONSOLIDATED FINANCIAL STATEMENT UNDER IND AS Notes to the Consolidated Financial Statements (I in millions, except share and per share data, unless otherwise stated) The below table presents foreign currency risk from non-derivative financial assets/(liabilities) as at March 31, 2026 and 2025: As at March 31, 2026 Pound Australian Canadian Other U.S.$ Euro (1) Total Sterling Dollar Dollar currencies Trade receivables I 51,190 I 13,487 I 9,294 I 2,680 I 577 I 4,851 I 82,079 Unbilled receivables 31,242 5,721 7,329 2,091 1,027 3,217 50,627 Cash and cash equivalents 13,500 7,233 3,029 1,687 7,333 3,268 36,050 2WKHU_ÙQDQFLDO_DVVHWV 8,960 1,591 390 93 156 907 12,097 Lease liabilities (4,057) (3,278) (2,828) (80) (25) (998) (11,266) Trade payables and other (43,925) (16,064) (16,144) (2,875) (3,203) (7,169) (89,380) ÙQDQFLDO_OLDELOLWLHV 1RQ_GHULYDWLYH_ÙQDQFLDOV_ DVVHWV___OLDELOLWLHV___QHW K 56,910 K 8,690 K 1,070 K 3,596 K 5,865 K 4,076 K 80,207 (1) Other currencies reflect currencies such as Singapore Dollar, Swiss Franc, Polish Zloty, United Arab Emirates Dirham and Swedish Krona. As at March 31, 2025 Pound Australian Canadian Other U.S.$ Euro (1) Total Sterling Dollar Dollar currencies Trade receivables H 39,306 H 12,470 H 7,611 H 1,942 H 629 H 4,195 H 66,153 Unbilled receivables 23,341 4,383 4,227 1,622 583 2,179 36,335 Cash and cash equivalents 28,719 5,871 1,357 1,007 4,392 2,575 43,921 2WKHU_ÙQDQFLDO_DVVHWV 785 1,187 353 537 101 1,504 4,467 Lease liabilities (2,625) (2,894) (2,402) (259) (72) (1,104) (9,356) Trade payables and other (32,507) (12,735) (10,683) (1,220) (1,068) (4,435) (62,648) ÙQDQFLDO_OLDELOLWLHV 1RQ_GHULYDWLYH_ÙQDQFLDOV_ DVVHWV___OLDELOLWLHV___QHW K 57,019 K 8,282 K 463 K 3,629 K 4,565 K 4,914 K 78,872 (1) Other currencies reflect currencies such as Saudi Riyal, Swiss Franc, Singapore Dollar, United Arab Emirates Dirham and Polish Zloty. As at March 31, 2026 and 2025, respectively, every 1% increase/decrease in the respective foreign currencies compared to functional currency of the Company would increase/decrease the Company’s profit before taxes by approximately H 802 and H 789, respectively. Interest rate risk Interest rate risk primarily arises from floating rate borrowings, including various revolving and other lines of credit. REPORT 2025-26 The Company’s investments are primarily in short-term investments, which do not expose it to significant interest rate risk. ANNUAL Interest rate risk primarily arises from floating rate borrowing, including various revolving and other lines of credit. If interest rates were to increase by 100 bps as on March 31, 2026, additional net annual interest expense on floating rate borrowing INTEGRATED would amount to approximately H 799. Certain borrowings are also transacted at fixed interest rates. WIPRO


LOGO

357 Notes to the Consolidated Financial Statements (I in millions, except share and per share data, unless otherwise stated) Credit risk Credit risk arises from the possibility that customers may not be able to settle their obligations as agreed. To manage this, the Company periodically assesses the credit rating and financial reliability of customers, considering the financial condition, current economic trends, forward-looking macroeconomic information, analysis of historical bad debts and ageing of accounts receivable. No single customer accounted for more than 10% of the accounts receivable as of March 31, 2026 and 2025, and revenues for the years ended March 31, 2026 and 2025. There is no significant concentration of credit risk. Trade receivables and unbilled receivables are written off where there is no reasonable expectation of recovery. Indicators that there is no reasonable expectation of recovery include, amongst others, the failure of a customer to engage in a repayment plan with the Company. Refer to Note 11 for changes in the allowances for lifetime expected credit loss. Counterparty risk Counterparty risk encompasses issuer risk on marketable securities, settlement risk on derivative and money market contracts and credit risk on cash and time deposits. Issuer risk is minimised by only buying securities in India which are at least AA rated by Indian rating agencies. Settlement and credit risk is reduced by the policy of entering into transactions with counterparties that are usually banks or financial institutions with acceptable credit ratings. Exposure to these risks is closely monitored and maintained within predetermined parameters. There are limits on credit exposure to any financial institution. The limits are regularly assessed and determined based upon credit analysis including financial statements and capital adequacy ratio reviews. Cash and cash equivalents include demand deposits of H 3,546 and bank balances of H 83,236 held with two banks having high credit ratings, which are individually in excess of 10% or more of the Company’s total cash and cash equivalents as at March 31, 2026. Refer to Note 15. We did not have any significant concentration of investment risk, as no investments with any single counterparty exceeded 10% of our total investments as of March 31, 2026. Refer to Note 9. Liquidity risk Liquidity risk is defined as the risk that the Company will not be able to settle or meet its obligations on time or at a reasonable price. The Company’s corporate treasury department is responsible for liquidity and funding as well as settlement management. In addition, processes and policies related to such risks are overseen by senior management. Management monitors the Company’s net liquidity position through rolling forecasts based on the expected cash flows. As of March 31, 2026, cash and cash equivalents are held with major banks and financial institutions.


LOGO

358 STATUTORY REPORTS AND FINANCIAL STATEMENTS CONSOLIDATED FINANCIAL STATEMENT UNDER IND AS Notes to the Consolidated Financial Statements (I in millions, except share and per share data, unless otherwise stated) The table below provides details regarding the remaining contractual maturities of financial liabilities at the reporting date. The amounts include estimated interest payments and exclude the impact of netting agreements, if any. As at March 31, 2026 Interest Less than Beyond Total cash included in Carrying 1-2 years 2-4 years 1 year 4 years ùRZV total cash value ùRZV Borrowings(1) I 167,648 I 2,076 I—I—K 169,724 I (1,850) K 167,874 Lease liabilities(1) 10,492 8,315 10,152 12,855 41,814 (6,778) 35,036 Trade payables 62,894 1,929 1,920 545 67,288—67,288 Derivative liabilities 10,978 ——10,978—10,978 2WKHU_ÙQDQFLDO_OLDELOLWLHV Salary Payable 32,030 ——32,030—32,030 Contingent consideration(2) 467 1,553 — 2,020 (386) 1,634 Liability on written put options to non-controlling 2,689—3,375—6,064 (365) 5,699 interests(2) Rent Deposit 477 12 — 489—489 Liabilities towards customer 721 359 360—1,440—1,440 contracts Advance from customers 329 ——329—329 Capital creditors 689 ——689—689 Others 6,057 297 439 1,027 7,820—7,820 K 295,471 K 14,541 K 16,246 K 14,427 K 340,685 K (9,379) K 331,306 As at March 31, 2025 Interest Less than Beyond Total cash included in Carrying 1-2 years 2-4 years 1 year 4 years ùRZV total cash value ùRZV Borrowings(1) H 99,884 H 64,576 H—H—K 164,460 I (2,643) K 161,817 Lease liabilities(1) 9,563 6,950 8,426 11,379 36,318 (6,100) 30,218 Trade payables 58,667 ——58,667—58,667 Derivative liabilities 968 ——968—968 2WKHU_ÙQDQFLDO_OLDELOLWLHV Salary Payable 29,585 ——29,585—29,585 Contingent consideration(2) 580 420 1,401—2,401 (537) 1,864 2025-26 Liability on written put options to non-controlling—2,686 3,819—6,505 (1,560) 4,945 REPORT (2) interests Rent Deposit 475 4 22—501—501 ANNUAL Liabilities towards customer 342 342 684—1,368—1,368 contracts INTEGRATED Advance from customers 167 ——167—167 Capital creditors 1,255 ——1,255—1,255 Others 1,082 303 195—1,580 (9) 1,571 K 202,568 K 75,281 K 14,547 K 11,379 K 303,775 K(10,849) K 292,926 (1) Includes future cash outflow towards estimated interest on borrowings and lease liabilities. WIPRO (2) Includes future cash outflow towards estimated interest on contingent consideration and liability on written put options to non-controlling interests.


LOGO

359 Notes to the Consolidated Financial Statements (I in millions, except share and per share data, unless otherwise stated) The balanced view of liquidity and financial indebtedness is stated in the table below. The management for external communication with investors, analysts and rating agencies uses this calculation of the net cash position: As at As at March 31, 2026 March 31, 2025 Cash and cash equivalents I 105,555 I 121,974 Investments—current 437,680 411,474 Borrowings (167,874) (161,817) K 375,361 K 371,631 11. TRADE RECEIVABLES The following table represent ageing of Trade receivables as on March 31, 2026: Outstanding for following periods from due date of payment Less than 6 months More than Not Due 1-2 years 2-3 years Total 6 months—1 year 3 years Unsecured—Non-current Undisputed Trade receivables – considered good I 349 I—I—I—I—I—I 349 K 349 K—K—K—K—K—K 349 Unsecured—Current Undisputed Trade receivables – considered good I 93,788 I 39,040 I 1,727 I 671 I 447 I 1,280 I 136,953 Undisputed Trade receivables – credit impaired 1,059 274 1,746 136 73 1,544 4,832 Disputed Trade receivables – considered good 5 95—223 100 1,409 1,832 K 94,852 K 39,409 K 3,473 K 1,030 K 620 K 4,233 K 143,617 Gross Trade receivables K 143,966 Less: Allowance for lifetime expected credit loss (7,716) Net Trade receivables K 136,250 The following table represent ageing of Trade receivables as on March 31, 2025: 2XWVWDQGLQJ_IRU_IROORZLQJ_SHULRGV_IURP_GXH_GDWH_RI_SD¥PHQW Less than 6 months More than Not Due 1-2 years 2-3 years Total 6 months—1 year 3 years Unsecured—Non-current Undisputed Trade receivables – considered good I 299 I—I—I—I—I—I 299 K 299 K—K—K—K—K—K 299 Unsecured—Current Undisputed Trade receivables – considered good H 84,626 H 29,877 H 1,318 H 599 H 653 H 1,014 H 118,087 Undisputed Trade receivables – credit impaired 935 303 13 12 53 1,508 2,824 Disputed Trade receivables–considered good 97 592 123 100 40 1,631 2,583 Disputed Trade receivables – credit impaired — — 181 241 422 K 85,658 K 30,772 K 1,454 K 711 K 927 K 4,394 K 123,916 Gross Trade receivables K 124,215 Less: Allowance for lifetime expected credit loss (6,171) Net Trade receivables K 118,044


LOGO

360 STATUTORY REPORTS AND FINANCIAL STATEMENTS CONSOLIDATED FINANCIAL STATEMENT UNDER IND AS Notes to the Consolidated Financial Statements (I in millions, except share and per share data, unless otherwise stated) The activity in the allowance for lifetime expected credit loss is given below: As at As at March 31, 2026 March 31, 2025 Balance at the beginning of the year I 6,171 I 6,316 Additions due to Acquisitions (Refer to Note 8) 159 -Additions, net 2,838 324 Additions on account of Unbilled receivables (698) -Charged against allowance (1,288) (512) Translation adjustment 534 43 Balance at the end of the year K 7,716 K 6,171 12. OTHER FINANCIAL ASSETS As at As at March 31, 2026 March 31, 2025 Non-current Finance lease receivables I 3,922 H 3,090 Security deposits 1,812 1,318 Advance to customer 509 225 ‘XHV_IURP_RIŮFHUV_DQG_HPSOR¥HHV 16 30 Other receivables ^ 1 K 6,259 K 4,664 Current Finance lease receivables I 4,189 H 5,144 Security deposits 2,235 1,827 Receivables from redemption of mutual funds 800 -Advance to customer 494 70 ‘XHV_IURP_RIŮFHUV_DQG_HPSOR¥HHV 435 505 Claims receivables 384 195 Interest receivables 357 596 2025-26 Other receivables 1,351 111 REPORT K 10,245 K 8,448 K 16,504 K 13,112 ANNUAL ^ Value is than H 0.5 INTEGRATED WIPRO


LOGO

361 Notes to the Consolidated Financial Statements (I in millions, except share and per share data, unless otherwise stated) Finance lease receivables Finance lease receivables consist of assets that are leased for a contract term normally ranging 1 to 5 years, with lease payments due in monthly or quarterly installments. Details of finance lease receivables are given below: As at As at March 31, 2026 March 31, 2025 Year 1 I 4,554 H 5,489 Year 2 2,573 1,908 Year 3 1,225 945 Year 4 290 380 Year 5 112 145 Gross investment in lease K 8,754 K 8,867 /HVV__8QHDUQHG_ÙQDQFH_LQFRPH (643) (633) Present value of minimum lease payment receivables K 8,111 K 8,234 Included in the consolidated balance sheet as follows: Non-current I 3,922 H 3,090 Current 4,189 5,144 13. OTHER ASSETS As at As at March 31, 2026 March 31, 2025 Non-current Unsecured, considered good H 441 H 247 Capital advances Others Prepaid expenses 4,356 2,657 Deferred contract cost Costs to obtain contracts (1) 2,592 3,277 _ _ &RVWV_WR_IXOÙO_FRQWUDFWV (2) 1,000 378 Interest receivable from statutory authorities 1,062 1,148 K 9,451 K 7,707 Current Unsecured, considered goods Advances other than capital advances Advances to suppliers H 2,369 H 2,323 _ ‘XHV_IURP_RIŮFHUV_DQG_HPSOR¥HHV 415 453 Others Prepaid expenses 18,929 16,917 Balance with GST and other authorities 7,969 6,760 Deferred contract cost Costs to obtain contracts (1) 1,903 1,407 _ _ &RVWV_WR_IXOÙO_FRQWUDFWV (2) 151 131 Withholding taxes 975 542 _ ‘HÙQHG_EHQHÙW_SODQ_DVVHW__QHW 204 472 Other receivables 249 123 K 33,164 K 29,128 K 42,615 K 36,835 (1) Costs to obtain contracts amortisation of H 2,558 and H 1,333 during the years ended March 31, 2026 and 2025, respectively. (2) Costs to fulfil contracts amortisation of H 150 and H 83 during the years ended March 31, 2026 and 2025, respectively.


LOGO


362 STATUTORY REPORTS AND FINANCIAL STATEMENTS CONSOLIDATED FINANCIAL STATEMENT UNDER IND AS Notes to the Consolidated Financial Statements (I in millions, except share and per share data, unless otherwise stated) 14. INVENTORIES As at As at March 31, 2026 March 31, 2025 Stock-in-trade I 514 H 685 Stores and spare parts 3 9 K 517 K 694 15. CASH AND CASH EQUIVALENTS As at As at March 31, 2026 March 31, 2025 Balances with banks Current accounts I 95,959 H 74,387 Demand deposits(1) 9,410 47,518 Unclaimed dividends 177 64 Cheques and drafts on hand 9 5 K 105,555 K 121,974 (1) These deposits can be withdrawn by the Company at any time without prior notice and without any penalty on the principal. Cash and cash equivalents consist of the following for the purpose of the consolidated statement of cash flows: As at As at March 31, 2026 March 31, 2025 Cash and cash equivalents I 105,555 H 121,974 Bank overdrafts— ^ K 105,555 K 121,974 ^ Value is less than H 0.5 16. EQUITY SHARE CAPITAL As at As at March 31, 2026 March 31, 2025 2025-26 Authorised capital REPORT 12,543,500,000 equity shares, par value of H 2 per share (March 31, 2025: I 25,087 H 25,009 12,504,500,000 equity shares) ANNUAL 25,000,000 preference shares, par value of H 10 per share (March 31, 2025: 25,000,000 250 250 preference shares) 150,000 10% optionally convertible cumulative preference shares, par value of H 100 per 15 15 INTEGRATED share (March 31, 2025: 150,000 10% optionally convertible cumulative preference shares) K 25,352 K 25,274 Issued, subscribed and fully paid-up capital 10,488,412,458 equity shares of H 2 each (March 31, 2025: 10,472,136,049 equity shares) I 20,977 H 20,944 WIPRO K 20,977 K 20,944


LOGO


363 Notes to the Consolidated Financial Statements (I in millions, except share and per share data, unless otherwise stated) Terms and rights attached to equity shares The Company has only one class of equity shares having a par value of H 2 per share. Each shareholder of equity shares is entitled to one vote per share. The Company declares and pays dividend in Indian Rupees. The final dividend proposed by the Board of Directors is subject to shareholders approval in the ensuing Annual General Meeting. Following is the summary of per share dividends recognised as distributions to equity shareholders: For the year ended For the year ended March 31, 2026 March 31, 2025 ,QWHULP_GLYLGHQG__%RDUG_UHFRPPHQGHG_WKH_DGRSWLRQ_RI_WKH_LQWHULP_GLYLGHQG_DV_WKH_ÙQDO_GLYLGHQG__ K 11 per share K 6 per share (Refer to Note 32) In the event of liquidation of the Company, the equity shareholders will be entitled to receive the remaining assets of the Company, after distribution of all preferential amounts, if any, in proportion to the number of equity shares held by the shareholders. i. Reconciliation of number of equity shares Equity shares/American Depository Receipts (ADRs) As at March 31, 2026 As at March 31, 2025 Number of shares I Million Number of shares I Million Balance at the beginning of the year 10,472,136,049 I20,944 5,225,138,246 H 10,450 Issue of equity shares on exercise of options 16,276,409 33 13,628,596 27 Bonus issue of equity shares (Refer to Note 32)—— 5,233,369,207 10,467 Balance at the end of the year 10,488,412,458 H20,977 10,472,136,049 K 20,944 ii. Reconciliation of number of treasury shares held by controlled trust As at As at Equity shares March 31, 2026 March 31, 2025 Number of shares Number of shares Balance at the beginning of the year 11,905,480 5,952,740 Bonus issue of equity shares (Refer to Note 32)— 5,952,740 Balance at the end of the year 11,905,480 11,905,480 iii. Details of shareholders holding more than 5% of the total equity shares of the Company Name of the Shareholder As at March 31, 2026 As at March 31, 2025 Number of shares % held Number of shares % held Mr. Azim Hasham Premji Partner representing 1,886,826,730 17.99 1,767,826,730 16.88 Hasham Traders Mr. Azim Hasham Premji Partner representing 2,160,297,946 20.60 2,041,297,946 19.49 Prazim Traders Mr. Azim Hasham Premji Partner representing 2,202,133,582 21.00 2,081,133,582 19.87 Zash Traders Azim Premji Trust 680,385,966 6.49 1,063,185,966 10.15 


LOGO

364 STATUTORY REPORTS AND FINANCIAL STATEMENTS CONSOLIDATED FINANCIAL STATEMENT UNDER IND AS Notes to the Consolidated Financial Statements (I in millions, except share and per share data, unless otherwise stated) iv. Other details of equity shares for a period of five years immediately preceding March 31, 2026 and 2025 As at As at March 31, 2026 March 31, 2025 Number of shares Number of shares Aggregate number and class of shares allotted as fully paid up pursuant to Nil Nil contract(s) without payment being received in cash During the year ended March 31, 2025 5,233,369,207 — Aggregate number and class of shares allotted as fully paid up by way of bonus shares 5,233,369,207 — During the year ended March 31, 2024 269,662,921 269,662,921 During the year ended March 31, 2021 237,500,000 237,500,000 During the year ended March 31, 2020— 323,076,923 Aggregate number and class of shares bought back 507,162,921 830,239,844 v. Shares reserved for issue under the employee stock incentive plans For details of shares reserved for issue under the employee stock incentive plans of the Company, refer to Note 31. vi. Details of Shareholding of Promoter and Promoter Group are as under As at March 31, 2026 As at March 31, 2025 Name of the Promoter and Promoter Number of % of total % change Number of % of total % change Group shares shares during the shares shares during the year year Azim H. Premji 431,156,714 4.11% (0.01)% 431,156,714 4.12% (0.01)% Yasmeen A. Premji 5,118,756 0.05% 0.00% 5,118,756 0.05% (0.00)% Rishad A. Premji 13,537,782 0.13% 0.00% 13,537,782 0.13% 0.00% Tariq A. Premji 13,238,430 0.13% 0.00% 13,238,430 0.13% 0.00% Mr. Azim Hasham Premji Partner 1,886,826,730 17.99% 1.11% 1,767,826,730 16.88% (0.04)% representing Hasham Traders Mr. Azim Hasham Premji Partner 2,160,297,946 20.60% 1.11% 2,041,297,946 19.49% (0.90)% representing Prazim Traders Mr. Azim Hasham Premji Partner 2,202,133,582 21.00% 1.13% 2,081,133,582 19.87% (0.81)% 2025-26 representing Zash Traders Hasham Investment And Trading Co. REPORT 2,711,906 0.03% 0.00% 2,711,906 0.03% (0.00)% Pvt. Ltd. Prazim Trading And Investment 193,708,256 1.85% 0.23% 169,908,256 1.62% 1.62% ANNUAL Company Pvt Ltd. Azim Premji Trust (1) 680,385,966 6.49% (3.66)% 1,063,185,966 10.15% (0.02)% Azim Premji Philanthropic Initiatives 27,724,830 0.26% 0.00% 27,724,830 0.26% (0.01)% INTEGRATED Private Limited (1) (1) Mr. Azim H. Premji disclaims the beneficial ownership of 680,385,966 shares held by Azim Premji Trust and 27,724,830 shares held by Azim Premji Philanthropic Initiatives Private Limited. WIPRO


LOGO


365 Notes to the Consolidated Financial Statements (I in millions, except share and per share data, unless otherwise stated) 17. BORROWINGS As at As at March 31, 2026 March 31, 2025 Non-current Unsecured Unsecured Notes 2026(1) I—H 63,954 Loans from institutions other than banks 1,962—K 1,962 K 63,954 Current Unsecured Unsecured Notes 2026 (1) I 71,052 H—Borrowings from banks 94,860 97,863 Bank overdrafts—^ K 165,912 K 97,863 K 167,874 K 161,817 ^ Value is less than H 0.5 (1) On June 23, 2021, Wipro IT Services LLC, a wholly owned step-down subsidiary of the Company, issued U.S.$ 750 million in unsecured notes 2026 (the “Notes”). The Notes bear interest at a rate of 1.50% per annum and will mature on June 23, 2026. Interest on the Notes is payable semi-annually on June 23 and December 23 of each year, commencing from December 23, 2021. The Notes are listed on Singapore Exchange Securities Trading Limited (SGX-ST). Short-term borrowings The Company had borrowings amounting to I 94,860 and I 97,863, as at March 31, 2026 and 2025, respectively. The principal source of borrowings from banks as at March 31, 2026 primarily consists of lines of credit of approximately I 89,024, U.S. Dollar (“U.S.$”) 432 million, Saudi Riyal (“SAR”) 120 million, Pound Sterling (“GBP”) 7 million, Bahraini Dinar (“BHD”) 1 million, Thai Baht (“THB”) 5 million, Brazilian Real (“BRL”) 8 million, Indonesian Rupiah (“IDR”) 13,000 million, Qatari Riyal (“QAR”) 10 million Mexican Peso (“MXN”) 35 million, Canadian Dollar (“CAD”) 14 million, Bangladeshi Taka (“BDT”) 175 million and Japanese Yen (“JPY”) 300 million from bankers for working capital requirements and other short-term needs As at March 31, 2026, the Company has unutilised lines of credit aggregating I 27,524, U.S.$ 92 million, SAR 75 million, GBP 7 million, BHD 1 million, THB 5 million, BRL 8 million, IDR 13,000 million, QAR 10 million, MXN 35 million, CAD 14 million, BDT 175 million and JPY 300 million. To utilise these unused lines of credit, the Company requires consent of the lender and compliance with certain financial covenants. Significant portion of these lines of credit are revolving credit facilities and floating rate foreign currency loans, renewable on a periodic basis. Significant portion of these facilities bear floating rates of interest, referenced to country specific official benchmark interest rates and a spread, determined based on market conditions.


LOGO

366 STATUTORY REPORTS AND FINANCIAL STATEMENTS CONSOLIDATED FINANCIAL STATEMENT UNDER IND AS Notes to the Consolidated Financial Statements (I in millions, except share and per share data, unless otherwise stated) Long-term borrowings A summary of long- term borrowings is as follows: As at March 31, 2026 As at March 31, 2025 Currency Foreign Foreign Indian Final Indian currency in currency in Rupee maturity Rupee millions millions Unsecured Notes 2026 U.S.$ 749 I 71,052 June-26 U.S.$ 748 I 63,954 Loans from institutions other than banks U.S.$ 21 I 1,962 June-27 — K 73,014 K 63,954 Non-current portion of long-term borrowings I 1,962 I 63,954 Current portion of long-term borrowings 71,052—Refer to Note 26 for interest expense on borrowings Cash and non-cash changes in liabilities arising from financing activities: b1RQ_FDVK_FKDQJHV b1HW_DGGLWLRQV_ to Lease b(IIHFWLYH_ b)RUHLJQ_ b$SULO________b b&DVK_ůRZb Liabilities/ interest rate H[FKDQJH_ b0DUFK_________b additions due to DGMXVWPHQWb PRYHPHQWVb DFTXLVLWLRQVb Borrowings H 161,817 H (6,752) H 1,852 H 119 H 10,838 I 167,874 Lease liabilities 30,218 (11,561) 13,430—2,949 35,036 K 192,035 Kb________ Kb______ K 119 K 13,787 K 202,910 b1RQ_FDVK_FKDQJHV b1HW_DGGLWLRQV_ to Lease b(IIHFWLYH_ b)RUHLJQ_ April 1, 2024 b&DVK_ùRZb Liabilities/ interest rate H[FKDQJH_ March 31, 2025 additions due to DGMXVWPHQWb PRYHPHQWVb DFTXLVLWLRQVb Borrowings H 141,464 H 17,923 H—H 114 H 2,316 H 161,817 Lease liabilities 23,183 (10,474) 17,270—239 30,218 2025-26 K 164,647 K 7,449 K 17,270 K 114 K 2,555 K 192,035 REPORT Non-fund based The Company has non-fund based revolving credit facilities in various currencies equivalent to I 49,747 and I 49,634 as of ANNUAL March 31, 2026 and 2025, respectively, towards operational requirements that can be used for the issuance of letters of credit and bank guarantees. As of March 31, 2026 and 2025, an amount of I 36,389 and I 36,524, respectively, was INTEGRATED unutilised out of these non-fund based facilities. WIPRO


LOGO

367 Notes to the Consolidated Financial Statements (I in millions, except share and per share data, unless otherwise stated) 18. OTHER FINANCIAL LIABILITIES As at As at March 31, 2026 March 31, 2025 Non-current Liability on written put options to non-controlling interests (Refer to Note 10) I 3,071 H 4,945 Contingent consideration (Refer to Note 10) 1,178 1,307 Liabilities towards customer contracts 719 1,026 Long-term incentive payable 376 387 Deferred consideration for Business combination 34 61 Rent deposit 12 26 Other liabilities(1) 1,353 41 K 6,743 K 7,793 Current Salary payable I 32,030 H 29,585 Liability on written put options to non-controlling interests (Refer to Note 10) 2,628 -Liabilities towards customer contracts 721 342 Capital creditors 689 1,255 Interest accrued but not due on borrowing 541 489 Rent deposit 477 475 Contingent consideration (Refer to Note 10) 456 557 Advance from customers 329 167 Unclaimed dividends 177 64 Deferred consideration for Business combination 118 295 Other liabilities(2) 5,221 234 K 43,387 K 33,463 K 50,130 K 41,256 (1) Includes payable to selling shareholders (2) Includes liability on non-designated hedges 19. PROVISIONS As at As at March 31, 2026 March 31, 2025 Non-current 3URYLVLRQ_IRU_HPSOR¥HH_EHQHŮWV Compensated absences I 652 H 563 _ ‘HŮQHG_EHQHŮW_SODQV___JUDWXLW¥_DQG_IRUHLJQ_SHQVLRQ_ 3,626 2,974 _ 2WKHU_HPSOR¥HH_EHQHŮW_REOLJDWLRQV_ 887 825 Provision for onerous contracts 224 294 K 5,389 K 4,656 Current 3URYLVLRQ_IRU_HPSOR¥HH_EHQHŮWV Compensated absences I 17,699 H 15,767 _ 2WKHU_HPSOR¥HH_EHQHŮW_REOLJDWLRQV_ 268 234 Provision for onerous contracts 1,184 1,288 Provision for warranty 214 207 Others 98 142 K 19,463 K 17,638 K 24,852 K 22,294


LOGO


368 STATUTORY REPORTS AND FINANCIAL STATEMENTS CONSOLIDATED FINANCIAL STATEMENT UNDER IND AS Notes to the Consolidated Financial Statements (I in millions, except share and per share data, unless otherwise stated) A summary of activity in provision for warranty, onerous contracts and other provisions is as follows: Year ended March 31, 2026 Year ended March 31, 2025 Provision Provision Provision Provision for for for Others Total for Others Total onerous onerous warranty ZDUUDQW¥ contracts contracts Provision at the beginning of the year I 207 I 1,582 I 142 I 1,931 H 217 H 1,599 H 155 H 1,971 Additions during the year, net 214 582—796 207 597—804 Utilised/written-back during the year (207) (826) (44) (1,077) (217) (624) (13) (854) Translation adjustment -70—70—10—10 Provision at the end of the year K 214 K 1,408 K 98 K 1,720 K 207 K 1,582 K 142 K 1,931 Included in the consolidated balance sheet as follows: Non-current K—I 224 I—I 224 H—H 294 H—H 294 Current 214 1,184 98 1,496 207 1,288 142 1,637 Provision for warranty represents cost associated with providing sales support services, which are accrued at the time of recognition of revenues and are expected to be utilised over a period of 1 year. Provision for onerous contracts is recognised when the expected benefit by the company from a contract are lower than the unavoidable costs of meeting the future obligations under the contract. Other provisions primarily include provisions for compliance related contingencies. The timing of cash outflows in respect of such provision cannot be reasonably determined. 20. OTHER LIABILITIES As at As at March 31, 2026 March 31, 2025 Non-current Statutory and other liabilities I 17,877 I 12,757 K 17,877 K 12,757 Current Statutory and other liabilities I 16,012 I 14,295 2025-26 Advance from customers 822 790 REPORT K 16,834 K 15,085 ANNUAL K 34,711 K 27,842 INTEGRATED WIPRO


LOGO


369 Notes to the Consolidated Financial Statements (I in millions, except share and per share data, unless otherwise stated) 21. TRADE PAYABLES The following table represent ageing of Trade payables as on March 31, 2026: Outstanding for following periods from due date of payment Less More Unbilled Not Due than 1-2 years 2-3 years than Total 1 year 3 years Non-current Others I 4,394 I—I—I—I—I—I 4,394 K 4,394 K—K—K—K—K—K 4,394 Current MSME I 1,267 I 1,051 I 22 ——I 2,340 Others 39,338 18,676 2,244 22 4 15 60,299 Disputed dues—Others 143 112 — — 255 K 40,748 K 19,839 K 2,266 K 22 K 4 K 15 K 62,894 Total Trade payables K 45,142 K 19,839 K 2,266 K 22 K 4 K 15 K 67,288 The following table represent ageing of Trade payables as on March 31, 2025: 2XWVWDQGLQJ_IRU_IROORZLQJ_SHULRGV_IURP_GXH_GDWH_RI_SD¥PHQW Less More Unbilled Not Due than 1-2 years 2-3 years than Total 1 year 3 years Current MSME H 781 H 495 H 10 H— H— H— H 1,286 Others 35,768 19,527 1,782 7 8 23 57,115 Disputed dues—Others 133 133 ———— 266 K 36,682 K 20,155 K 1,792 K 7 K 8 K 23 K 58,667 Relationship with the struck off companies The Company had nil transactions and outstanding balance with struck off companies for the year ended March 31, 2026. Transactions with struck off companies for the year ended March 31, 2025 is as follows: Relationship Transactions for Balance Nature of Name of struck off company ZLWK_VWUXFN_RII_ the year ended outstanding as at transaction company March 31, 2025 March 31, 2025 Sabre Technologies India Private Limited Vendor Payable H 11 H— Ibis Marcom Limited Vendor Payable ^ — ^ Value is less than I 0.5


LOGO

370 STATUTORY REPORTS AND FINANCIAL STATEMENTS CONSOLIDATED FINANCIAL STATEMENT UNDER IND AS Notes to the Consolidated Financial Statements (I in millions, except share and per share data, unless otherwise stated) 22. REVENUE FROM OPERATIONS A. Contract assets and Contract liabilities The following table presents the changes in contact assets balance: As at As at March 31, 2026 March 31, 2025 Balance at the beginning of the year I 15,795 H 19,854 $PRXQW_UHFODVVLŮHG_WR_UHFHLYDEOHV_SHUWDLQLQJ_WR_Ů[HG_SULFH_GHYHORSPHQW_ (14,073) (14,730) contracts on completion of milestones Increase due to revenue recognised during the year 12,233 10,617 Translation adjustment 864 54 Balance at the end of the year H 14,819 K 15,795 The following table presents the changes in contact liabilities balance: As at As at March 31, 2026 March 31, 2025 Balance at the beginning of the year I 20,063 H 17,653 Revenue recognised from opening balance of contract liabilities (15,724) (14,695) Increase due to invoicing during the year 20,262 17,036 Translation adjustment 833 69 Balance at the end of the year 20,063 K 25,434 K Contract assets and liabilities are reported in a net position on a contract-by-contract basis at the end of each reporting period. B. Reconciliation of revenue Reconciliation of revenue recognised with the contracted price as follows: As at As at March 31, 2026 March 31, 2025 Contracted price K 946,444 H 905,652 Reductions towards variable consideration components (1) (20,204) (14,768) 2025-26 5HYHQXH_UHFRJQLVHG_LQ_WKH_FRQVROLGDWHG_VWDWHPHQW_RI_SURÙW_DQG_ORVV K 926,240 K 890,884 (1) Variable consideration comprises of volume discount, service level credits and liquidated damages. REPORT ANNUAL INTEGRATED WIPRO


LOGO

371 Notes to the Consolidated Financial Statements (I in millions, except share and per share data, unless otherwise stated) C. Remaining performance obligations Revenue allocated to remaining performance obligations represents contracted revenue that has not yet been recognised, which includes contract liabilities and amounts that will be invoiced and recognised as revenue in future periods. Applying the practical expedient, the Company has not disclosed its right to consideration from customers in an amount that corresponds directly with the value to the customer of the Company’s performance completed to date, which are contracts invoiced on time and material basis and volume based. As at March 31, 2026 and 2025, the aggregate amount of the Transaction Price allocated to remaining performance obligations, other than those meeting the exclusion criteria above, were H 373,976 and H 364,937, respectively, of which approximately 63% and 66%, respectively, is expected to be recognised as revenues within two years, and the remainder thereafter. This includes contracts with a substantive enforceable termination penalty if the contract is terminated without cause by the customer, based on an overall assessment of the contract carried out at the time of inception. Historically, customers have not terminated contracts without cause. D. Disaggregation of revenue The tables below present disaggregated revenue from contracts with customers by business segment (refer to Note 35 “Segment Information”), sector and nature of contract. The Company believes that the below disaggregation best depicts the nature, amount, timing and uncertainty of revenue and cash flows from economic factors. Information on disaggregation of revenues for the year ended March 31, 2026 is as follows: IT Services IT Total Americas 1 Americas 2 Europe APMEA Total Products A. Revenue Rendering of services I305,036 I268,532 I243,645 I102,087 I919,300 I—I919,300 Sale of products — ——6,940 6,940 K 305,036 K 268,532 K 243,645 K 102,087 K 919,300 Kb_____ K 926,240 B. Revenue by sector Banking, Financial Services and I 842 I170,299 Ib_______ Ib_______ I314,011 Insurance Health 116,104 1,408 12,944 3,392 133,848 Consumer 107,075 3,772 44,537 13,586 168,970 Technology and Communications 74,591 22,195 35,329 14,438 146,553 Energy, Manufacturing and 6,424 70,858 54,248 24,388 155,918 Resources K 305,036 K 268,532 K 243,645 K 102,087 K 919,300 K 6,940 K 926,240 C. Revenue by nature of contract Fixed price and volume based I153,658 I126,105 I139,795 Ib_______ I481,768 I—I481,768 Time and materials 151,378 142,427 103,850 39,877 437,532—437,532 Products — ——6,940 6,940 K 305,036 K 268,532 K 243,645 K 102,087 K 919,300 Kb_____ K 926,240


LOGO

372 STATUTORY REPORTS AND FINANCIAL STATEMENTS CONSOLIDATED FINANCIAL STATEMENT UNDER IND AS Notes to the Consolidated Financial Statements (I in millions, except share and per share data, unless otherwise stated) Information on disaggregation of revenues for the year ended March 31, 2025 is as follows: IT Services IT Total Americas 1 Americas 2 Europe APMEA Total Products A. Revenue Rendering of services H281,806 H271,965 H240,187 H 94,234 H888,192 H—H888,192 Sale of products — ——2,692 2,692 K 281,806 K 271,965 K 240,187 K 94,234 K 888,192 K 2,692 K 890,884 B. Revenue by sector Banking, Financial H 1,240 H172,817 H 91,965 H 38,231 H304,253 Services and Insurance Health 108,305 236 13,982 3,272 125,795 Consumer 103,875 6,659 43,435 15,344 169,313 Technology and (1) 64,907 24,255 31,804 14,933 135,899 Communications Energy, Manufacturing (1) 3,479 67,998 59,001 22,454 152,932 and Resources K 281,806 K 271,965 K 240,187 K 94,234 K 888,192 K 2,692 K 890,884 C. Revenue by nature of contract Fixed price and volume based H144,904 H137,385 H142,241 H 56,390 H480,920 H—H480,920 Time and materials 136,902 134,580 97,946 37,844 407,272—407,272 Products — ——2,692 2,692 890,884 K 281,806 K 271,965 K 240,187 K 94,234 K 888,192 K 2,692 K (1) Effective October 1, 2024, the Company has reorganised its sectors by merging “Technology” and “Communications” into “Technology and Communications” sector, and by merging “Energy, Natural Resources and Utilities” and “Manufacturing” into “Energy, Manufacturing and Resources” sector. Comparative period disaggregation of revenue has been restated to give effect to this change. 23. OTHER INCOME Year ended Year ended March 31, 2026 March 31, 2025 Interest Income I 28,367 H 27,210 Dividend income from equity investments designated as FVTOCI 3 2,299 1HW_JDLQ_IURP_LQYHVWPHQWV_FODVVLÙHG_DV_)973/ 7,763 8,765 2025-26 1HW_ORVV_IURP_LQYHVWPHQWV_FODVVLÙHG_DV_)972&, 358 (72) REPORT Finance and other income K 36,491 K 38,202 ANNUAL )RUHLJQ_H[FKDQJH_JDLQV__ORVVHV___QHW_RQ_ÙQDQFLDO_LQVWUXPHQWV_PHDVXUHG_DW_)973/ K (5,867) H (398) Other foreign exchange gains/(losses), net 7,720 430 Foreign exchange gains, net K 1,853 K 32 INTEGRATED Gain on sale of property, plant and equipment, net (1) I 393 H 606 K 38,737 K 38,840 (1) Gain/(loss) on sale of property, plant and equipment for the year ended March 31, 2026, includes gain on transfer of building of I 405 and for the WIPRO year ended March 31, 2025, includes gain on relinquishment of the lease hold rights of land, and transfer of building along with other assets of I885.


LOGO


373 Notes to the Consolidated Financial Statements (I in millions, except share and per share data, unless otherwise stated) 24. CHANGES IN INVENTORIES OF STOCK-IN-TRADE Year ended Year ended March 31, 2026 March 31, 2025 Stock at the beginning of the year I 685 H 880 Less: Stock at the end of the year 514 685 Decrease during the year K 171 K 195 25. EMPLOYEE BENEFITS a) Employee costs includes Year ended Year ended March 31, 2026 March 31, 2025 Salaries and bonus I 525,825 H 507,629 Contribution to provident and other funds 25,565 20,306 Share-based compensation (1) 4,465 5,542 K 555,855 K 533,477 (1) Includes I Nil and I (9) for the years ended March 31, 2026 and 2025, respectively, towards cash settled ADSs and RSUs. Defined benefit plan actuarial (gains)/losses recognised in other comprehensive income include: Year ended Year ended March 31, 2026 March 31, 2025 Return on plan assets excluding interest income—loss/(gain) I 384 H (416) $FWXDULDO_ORVV__JDLQ__DULVLQJ_IURP_ŮQDQFLDO_DVVXPSWLRQV 730 146 Actuarial loss/(gain) arising from demographic assumptions 28 (115) Actuarial loss/(gain) arising from experience adjustments (1,290) (12) Change in the effect of asset ceiling—loss/(gain) 6 74 _*DLQ__ORVV_RQ_UHPHDVXUHPHQW_RI_GHÙQHG_EHQHÙW_SODQV__QHW K (142) K (323) b) Gratuity and foreign pension Defined benefit plans include gratuity for employees drawing salary in Indian Rupees, pension and certain benefits plans in foreign jurisdictions. Amount recognised in the consolidated statement of profit and loss in respect of defined benefit plans is as follows: Year ended Year ended March 31, 2026 March 31, 2025 Current service cost I 3,795 H 3,205 Past service cost 3,566—1HW_LQWHUHVW_H[SHQVH_RQ_QHW_GHŮQHG_EHQHŮW_OLDELOLW¥ 268 95 1HW_FKDUJH_WR_WKH_FRQVROLGDWHG_VWDWHPHQW_RI_SURÙW_DQG_ORVV K 7,629 K 3,300 Actual return on plan assets K 879 K 1,646


LOGO

374 STATUTORY REPORTS AND FINANCIAL STATEMENTS CONSOLIDATED FINANCIAL STATEMENT UNDER IND AS Notes to the Consolidated Financial Statements (I in millions, except share and per share data, unless otherwise stated) Change in present value of defined benefit obligation is summarised below: As at As at March 31, 2026 March 31, 2025 ‘HŮQHG_EHQHŮW_REOLJDWLRQ_DW_WKH_EHJLQQLQJ_RI_WKH_¥HDU I 24,188 H 21,516 Addition through Business combination 1,311 -Current service cost 3,795 3,205 Past service cost 3,566 -Interest expense on obligation 1,506 1,308 %HQHÙWV_SDLG (2,631) (2,627) Contributions from plan participants and due to transfer 87 558 Remeasurement loss/(gain) _ $FWXDULDO_ORVV__JDLQ__DULVLQJ_IURP_ŮQDQFLDO_DVVXPSWLRQV 730 146 Actuarial loss/(gain) arising from demographic assumptions 28 (115) Actuarial loss/(gain) arising from experience adjustments (1,290) (12) Translation adjustment 1,291 209 ‘HŮQHG_EHQHŮW_REOLJDWLRQ_DW_WKH_HQG_RI_WKH_¥HDU K 32,581 K 24,188 Change in plan assets is summarised below: As at As at March 31, 2026 March 31, 2025 Fair value of plan assets at the beginning of the year I 22,231 H 20,022 Addition through Business combination 211 -Expected return on plan assets 1,263 1,230 Employer contributions 5,417 141 %HQHÙWV_SDLG (188) (313) Contributions from plan participants and due to transfer 87 558 Remeasurement (loss)/gain Return on plan assets excluding interest income—(loss)/gain (384) 416 Translation adjustment 1,200 177 Fair value of plan assets at the end of the year K 29,837 K 22,231 As at As at 2025-26 March 31, 2026 March 31, 2025 REPORT ‘HÙQHG_EHQHÙW_REOLJDWLRQ I 32,581 H 24,188 ANNUAL Fair value of plan assets 29,837 22,231 Present value of unfunded obligation K (2,744) K (1,957) INTEGRATED Change in the effect of asset ceiling (678) (545) Recognised liability K (3,422) K (2,502) WIPRO


LOGO

375 Notes to the Consolidated Financial Statements (I in millions, except share and per share data, unless otherwise stated) Change in effect of asset ceiling is summarised below: As at As at March 31, 2026 March 31, 2025 Effect of asset ceiling at the beginning of the year I 545 H 442 Interest expense on effect of asset ceiling 25 17 Changes in the effect of limiting the surplus to the asset ceiling 6 74 Translation adjustment 102 12 Effect of asset ceiling at the end of the year K 678 K 545 As at March 31, 2026 and 2025, plan assets were primarily invested in insurer managed funds. The Company has established an income tax approved irrevocable trust fund to which it regularly contributes to finance the liabilities of the gratuity plan. The fund’s investments are managed by certain insurance companies as per the selection made by the trustees among the fund plan available. The principal assumptions used for the purpose of actuarial valuation of these defined benefit plans are as follows: As at As at March 31, 2026 March 31, 2025 Discount rate 5.70% 5.75% Expected return on plan assets 5.70% 5.75% Expected rate of salary increase 6.44% 6.40% :HLJKWHG_DYHUDJH_GXUDWLRQ_RI_GHÙQHG_EHQHÙW_REOLJDWLRQV years 6.53 years 7.03 The discount rate is primarily based on the prevailing market yields of government securities for the estimated term of the obligations. The estimates of future salary increase considered takes into account the inflation, seniority, promotion and other relevant factors. Attrition rate considered is the management’s estimate, based on previous years’ employee turnover of the Company. The expected return on plan assets is based on expectation of the average long-term rate of return expected on investments of the fund during the estimated term of the obligations. Expected future contribution and estimated future benefit payments from the fund are as follows: For the year ended March 31,2026 Expected contribution to the fund during the year ending March 31, 2027 I 3,515 (VWLPDWHG_EHQHŮW_SD¥PHQWV_IURP_WKH_IXQG_IRU_WKH_¥HDU_HQGLQJ_0DUFK____ 2027 I 5,493 2028 4,518 2029 4,134 2030 3,748 2031 3,493 Thereafter 21,690 Total K 43,076 


LOGO

376 STATUTORY REPORTS AND FINANCIAL STATEMENTS CONSOLIDATED FINANCIAL STATEMENT UNDER IND AS Notes to the Consolidated Financial Statements (I in millions, except share and per share data, unless otherwise stated) For the year ended March 31,2025 Expected contribution to the fund during the year ending March 31, 2026 H 3,545 (VWLPDWHG_EHQHŮW_SD¥PHQWV_IURP_WKH_IXQG_IRU_WKH_¥HDU_HQGLQJ_0DUFK____ 2026 H 3,565 2027 3,218 2028 2,953 2029 2,736 2030 2,412 Thereafter 17,692 Total K 32,576 TheexpectedbenefitsarebasedonthesameassumptionsusedtomeasuretheCompany’sbenefitobligationsasof March 31, 2026. Sensitivity for significant actuarial assumptions is computed to show the movement in defined benefit obligation by 1 percentage. As of March 31, 2026, every 1 percentage point increase/ (decrease) in discount rate will result in (decrease)/ increase of defined benefit obligation by approximately I (1,914) and I 2,228, respectively (March 31, 2025: I (1,565) and I 1,807, respectively). As of March 31, 2026, every 1 percentage point increase/ (decrease) in expected rate of salary will result in increase/ (decrease) of defined benefit obligation by approximately H 1,620 and H (1,512), respectively (March 31, 2025: H 1,189 and H (1,129), respectively). The sensitivity analysis to significant actuarial assumptions may not be representative of the actual change in the defined benefit obligations as the change in assumptions may not occur in isolation since some of the assumptions may be correlated. Furthermore, in presenting the sensitivity analysis, the present value of the defined benefit obligations has been calculated using the projected unit credit method at the end of the reporting period, which is the same as that applied in calculating the defined benefit obligation liability recognised in the consolidated balance sheet. c) Provident fund: The details of fund and plan assets are given below: As at As at March 31, 2026 March 31, 2025 Fair value of plan assets I 133,417 H 121,067 3UHVHQW_YDOXH_RI_GHÙQHG_EHQHÙW_REOLJDWLRQ (133,417) (121,067) REPORT 2025-26 Net shortfall K—K—ANNUAL The total expense for the years ended March 31, 2026 and 2025 is H 7,058 and H 6,517, respectively. INTEGRATED The plan assets have been invested as per the regulations of Employees’ Provident Fund Organisation (EPFO). WIPRO


LOGO

377 Notes to the Consolidated Financial Statements in millions, except share and per share data, unless otherwise stated) (I The principal assumptions used in determining the present value obligation of interest guarantee under the deterministic approach are as follows: As at As at March 31, 2026 March 31, 2025 Discount rate for the term of the obligation 6.50% 6.55% Weighted Average remaining tenure of investment portfolio 13.81 years 6.71 years Guaranteed rate of return 8.25% 8.25% d) Defined contribution plans: The total expense for the years ended March 31, 2026 and 2025 was H 11,146 and H 10,584 respectively. 26. FINANCE COSTS Year ended Year ended March 31, 2026 March 31, 2025 Interest on borrowings I 5,368 H 7,124 Interest on lease liability 1,956 1,593 Interest on liability on written put options to non-controlling interests 585 530 2WKHU_ÙQDQFH_FRVW_(1) 6,668 5,523 K 14,577 K 14,770 (1) Includes gain on remeasurement of written put options amounting to H 385 for the year ended March 31, 2026. 27. OTHER EXPENSES Year ended Year ended March 31, 2026 March 31, 2025 Rates, taxes and insurance I 5,858 H 5,804 Miscellaneous expenses/(income), net (1)(2) 1,402 (446) K 7,260 K 5,358 (1) Miscellaneous expense/(income), net includes reversals of contingent consideration of H (49) and H 169 for the years ended March 31, 2026 and 2025, respectively. (Refer to Note 10). (2) Other expenses are net of insurance claim received of H 1,805 during the year ended March 31, 2025.


LOGO

378 STATUTORY REPORTS AND FINANCIAL STATEMENTS CONSOLIDATED FINANCIAL STATEMENT UNDER IND AS Notes to the Consolidated Financial Statements (I in millions, except share and per share data, unless otherwise stated) 28. INCOME TAX Income tax expense has been allocated as follows: Year ended Year ended March 31, 2026 March 31, 2025 _,QFRPH_WD[_H[SHQVH_DV_SHU_WKH_FRQVROLGDWHG_VWDWHPHQW_RI_SURÙW_DQG_ORVV__ Current tax expense I 42,665 H 45,405 Deferred tax expense/(reversal) (1,898) (2,628) K 40,767 K 42,777 Income tax included in other comprehensive income on: Gains/(losses) on investment securities (323) 83 *DLQV__ORVVHV__RQ_FDVK_ùRZ_KHGJLQJ_GHULYDWLYHV (2,257) (260) 5HPHDVXUHPHQWV_RI_WKH_GHÙQHG_EHQHÙW_SODQV 10 49 K (2,570) K (128) K 38,197 K 42,649 The reconciliation between the provision of income tax and amounts computed by applying the Indian statutory income tax rate to profit before tax is as follows: Year ended Year ended March 31, 2026 March 31, 2025 3URÙW_EHIRUH_WD[ I 173,422 H 174,957 Enacted income tax rate in India 34.94% 34.94% Computed expected tax expense K 60,594 K 61,130 Effect of: Income exempt from tax (13,755) (12,960) Basis differences that will reverse during a tax holiday period 66 (332) Income taxed at higher/ (lower) rates (7,393) (7,736) Taxes related to prior years (4,141) (2,306) Changes in unrecognised deferred tax assets 123 (17) Expenses disallowed for tax purpose 4,803 4,460 Others, net 470 538 Income tax expense K 40,767 K 42,777 2025-26 Effective tax rate 23.51% 24.45% REPORT ANNUAL INTEGRATED WIPRO


LOGO

379 Notes to the Consolidated Financial Statements (I in millions, except share and per share data, unless otherwise stated) The components of deferred tax assets and liabilities are as follows: As at As at March 31, 2026 March 31, 2025 Deferred tax assets Carry-forward losses (1) I 784 H 898 Trade payables and other liabilities 7,886 7,106 Allowance for lifetime expected credit losses 2,016 1,428 &DVK_ùRZ_KHGJHV 2,234 65 Contract Assets 151 -Others 147 144 K 13,218 K 9,641 Deferred tax liabilities Property, plant and equipment (650) (536) Amortisable goodwill (6,906) (5,449) Intangible assets (8,407) (7,931) Interest Income and fair value movement of investments (2,687) (2,912) Contract liabilities— (209) Special Economic Zone re-investment reserve (2,627) (3,485) Undistributed earnings of subsidiaries (3,965) (3,001) K (25,242) K (23,523) Deferred tax liabilities, net K (12,024) K (13,882) Amounts presented in the consolidated balance sheet: Deferred tax assets I 5,242 H 2,561 Deferred tax liabilities (17,266) (16,443) (1) Includes deferred tax asset recognised on carry-forward losses pertaining to business combinations. Movement in deferred tax assets and liabilities Movement during the year ended March 31, 2026 &UHGLW__ (charge) &UHGLW__ On account in the (charge) As at of Business Translation As at consolidated in other April 1, 2025 combination adjustment March 31, 2026 statement comprehensive and others RI_SURÙW_DQG_ income loss Carry-forward losses I 898 I (239) I—I 9 I 116 784 Trade payables and other liabilities 7,106 (142) (10) 590 342 7,886 Allowance for lifetime expected credit losses 1,428 519—33 36 2,016 Property, plant and equipment (536) (392)—248 30 (650) Amortisable goodwill (5,449) (873) — (584) (6,906) Intangible assets (7,931) 2,277—(1,915) (838) (8,407) Interest Income and fair value movement of (2,912) 346 323 (369) (75) (2,687) investment


LOGO

380 STATUTORY REPORTS AND FINANCIAL STATEMENTS CONSOLIDATED FINANCIAL STATEMENT UNDER IND AS Notes to the Consolidated Financial Statements (I in millions, except share and per share data, unless otherwise stated) &UHGLW__ (charge) &UHGLW__ On account in the (charge) Movement during the year ended As at of Business Translation As at consolidated in other March 31, 2026 April 1, 2025 combination adjustment March 31, 2026 statement comprehensive and others RI_SURÙW_DQG_ income loss &DVK_ùRZ_KHGJHV 65 (87) 2,257—(1) 2,234 Contract asset / (Contract liabilities) (209) 124—230 6 151 Special Economic Zone re-investment (3,485) 858 ——(2,627) reserve Undistributed earnings of subsidiaries (3,001) (587) — (377) (3,965) Others 144 94—(57) (34) 147 Deferred tax liabilities, net K(13,882) K 1,898 K 2,570 K (1,231) K (1,379) K(12,024) Credit/ (charge) Credit/ (charge) On account Movement during the year ended in the As at in other of Business Translation As at March 31, 2025 consolidated April 1, 2024 comprehensive combination adjustment March 31, 2025 statement income and others RI_SURÙW_DQG_ loss Carry-forward losses H 1,254 H (357) H—H—H 1 H 898 Trade payables and other liabilities 5,793 1,362 (49) — 7,106 Allowance for lifetime expected credit 1,618 (190) ——1,428 losses Property, plant and equipment (912) 371 — 5 (536) Amortisable goodwill (4,909) (422) — (118) (5,449) Intangible assets (8,601) 1,446—(566) (210) (7,931) Interest Income and fair value (1,347) (1,482) (83) — (2,912) movement of investment &DVK_ùRZ_KHGJHV (195)—260 — 65 Contract asset / (Contract liabilities) (625) 428 — (12) (209) Special Economic Zone re-investment (7,820) 4,335 ——(3,485) reserve Undistributed earnings of subsidiaries—(2,941) — (60) (3,001) Others 94 78 — (28) 144 2025-26 Deferred tax liabilities, net K(15,650) K 2,628 K 128 K (566) K (422) K(13,882) REPORT Deferred taxes on unrealised foreign exchange gain/loss relating to cash flow hedges, fair value movements in investments and remeasurements of the defined benefit plans are recognised in other comprehensive income. Deferred tax liability ANNUAL on the intangible assets identified and carry forward losses on acquisitions is recorded by an adjustment to goodwill. Other than these, the change in deferred tax assets and liabilities is primarily recorded in the consolidated statement of INTEGRATED profit and loss. WIPRO


LOGO

381 Notes to the Consolidated Financial Statements (I in millions, except share and per share data, unless otherwise stated) In assessing the realisability of deferred tax assets, the Company considers the extent to which it is probable that the deferred tax asset will be realised. The ultimate realisation of deferred tax assets is dependent upon the generation of future taxable profits during the periods in which those temporary differences and tax loss carry-forwards become deductible. The Company considers the expected reversal of deferred tax liabilities, projected future taxable income and tax planning strategies in making this assessment. Based on this, the Company believes that it is probable that the Company will realise the benefits of these deductible differences. The amount of deferred tax asset considered realisable, however, could be reduced in the near term if the estimates of future taxable income during the carry-forward period are reduced. Deferred tax asset amounting to I 13,613 and I 10,816 as at March 31, 2026 and 2025, respectively in respect of unused tax losses have not been recognised by the Company. The tax loss carry-forwards of I 56,119 and I 44,274 as at March 31, 2026 and 2025, respectively, on which deferred tax asset has not been recognised by the Company, because it is probable that future taxable profits will not be available against which the unused tax losses can be utilised in the foreseeable future. Approximately, I 51,505 and I 40,292 as at March 31, 2026 and 2025, respectively, of these tax loss carry-forwards is not currently subject to expiration dates. The remaining tax loss carry-forwards of approximately I 4,614 and I 3,982 as at March 31, 2026 and 2025, respectively, expires in various years through fiscal year 2046. The Company has recognised deferred tax assets of I 784 and I 898 primarily in respect of carry forward losses including certain subsidiaries as at March 31, 2026 and 2025, respectively. Management’s projections of future taxable income and tax planning strategies support the assumption that it is probable that sufficient taxable income will be available to utilise these deferred tax assets. A substantial portion of the profits of the Company’s India operations are exempt from Indian income taxes being profits attributable to export operations and profits from units established under the Special Economic Zone Act, 2005 scheme. Units in designated SEZs providing service on or after April 1, 2005 will be eligible for a deduction of 100% of profits or gains derived from the export of services for the first five years from commencement of provision of services and 50% of such profits and gains for a further five years. A 50% tax deduction is available for a further five years subject to the unit meeting certain defined conditions. Profits from certain other undertakings are also eligible for preferential tax treatment. New SEZ units set up on or after April 1, 2021 are not eligible for the aforesaid deduction. The tax holiday period being currently available to the Company expires in various years through fiscal years 2034-35. The impact of tax holidays has resulted in a decrease of current tax expense of I 13,092 and I 11,798 for the years ended March 31, 2026 and 2025, respectively, compared to the effective tax amounts that the Company estimates it would have been required to pay if these incentives had not been available. The per equity share effect of these tax incentives for the years ended March 31, 2026 and 2025 is I 1.25 and I 1.13, respectively. Deferred income tax liabilities are recognised for all taxable temporary differences except in respect of taxable temporary differences associated with investments in certain subsidiaries where the timing of the reversal of the temporary difference can be controlled and it is probable that the temporary difference will not reverse in the foreseeable future. Accordingly, deferred income tax liabilities on cumulative earnings of certain subsidiaries amounting to I 69,693 and I 86,937 as at March 31, 2026 and 2025, respectively and branch profit tax at 15% of the U.S. branch profit have not been recognised. Further, it is not practicable to estimate the amount of the unrecognised deferred tax liabilities for these undistributed earnings. The Pillar Two legislations are neither enacted nor substantively enacted by Government of India, where the parent company is incorporated. Pillar Two legislation has been enacted, or substantively enacted, in certain other jurisdictions where the Company operates. However, the Company does not expect any material financial impact for the year ended March 31, 2026. In line with amended Ind AS 12, the Company has not recognised deferred taxes related to Pillar Two income taxes and accordingly has applied the mandatory exception as per the said standard.


LOGO

382 STATUTORY REPORTS AND FINANCIAL STATEMENTS CONSOLIDATED FINANCIAL STATEMENT UNDER IND AS Notes to the Consolidated Financial Statements (I in millions, except share and per share data, unless otherwise stated) 29. FOREIGN CURRENCY TRANSLATION RESERVE The movement in foreign currency translation reserve attributable to equity holders of the Company is summarised below: As at As at March 31, 2026 March 31, 2025 Balance at the beginning of the year I 52,393 H 45,269 Translation difference related to foreign operations, net 45,860 7,179 Transfer of shares pertaining to Non-controlling interests of subsidiary—(14) 5HFODVVLŮFDWLRQ_RI_IRUHLJQ_FXUUHQF¥_WUDQVODWLRQ_GLIIHUHQFHV_RQ_OLTXLGDWLRQ_RI_—(41) VXEVLGLDULHV_WR_FRQVROLGDWHG_VWDWHPHQW_RI_SURÙW_DQG_ORVV Others (5)—Balance at the end of the year K 98,248 K 52,393 30. EARNINGS PER EQUITY SHARE A reconciliation of profit for the year and equity shares used in the computation of basic and diluted earnings per equity share is set out below: Basic: Basic earnings per equity share is calculated by dividing the profit attributable to equity shareholders of the Company by the weighted average number of equity shares outstanding during the year, excluding equity shares purchased by the Company and held as treasury shares. Year ended Year ended March 31, 2026 March 31, 2025 _3URŮW_DWWULEXWDEOH_WR_HTXLW¥_KROGHUV_RI_WKH_&RPSDQ¥_ I 131,974 H 131,354 Weighted average number of equity shares outstanding 10,476,247,846 10,456,741,552 Basic earnings per equity share K 12.60 K 12.56 Diluted: Diluted earnings per equity share is calculated by adjusting the weighted average number of equity shares outstanding during the year for assumed conversion of all dilutive potential equity shares. Employee share options are dilutive potential equity shares for the Company. The calculation is performed in respect of share options to determine the number of equity shares that could have been acquired at fair value (determined as the average market price of the Company’s equity shares during the year). The number of equity shares calculated as above is compared with the number of equity shares that would have been issued assuming the exercise of the share options. Year ended Year ended March 31, 2026 March 31, 2025 REPORT 2025-26 _3URŮW_DWWULEXWDEOH_WR_HTXLW¥_KROGHUV_RI_WKH_&RPSDQ¥_ I 131,974 H 131,354 ANNUAL Weighted average number of equity shares outstanding 10,476,247,846 10,456,741,552 Effect of dilutive equivalent share options 27,175,090 32,197,840 INTEGRATED Weighted average number of equity shares for diluted earnings per share 10,503,422,936 10,488,939,392 Diluted earnings per equity share K 12.56 K 12.52 For the years ended March 31, 2026 and 2025, 1,586,275 and 1,294,623 options, respectively, were excluded from diluted weighted-average number of equity shares calculation because their effect would have been anti-dilutive. WIPRO


LOGO

383 Notes to the Consolidated Financial Statements (I in millions, except share and per share data, unless otherwise stated) 31. EMPLOYEE STOCK INCENTIVE PLANS The stock compensation expense recognised for employee services received during the years ended March 31, 2026 and 2025 were I 4,465 and I 5,542, respectively. Wipro Equity Reward Trust (“WERT”) In 1984, the Company established a controlled trust called WERT. In the previous years, WERT purchased shares of the Company out of funds borrowed from the Company. The Company’s Nomination and Remuneration Committee recommends to WERT certain officers and key employees, to whom WERT issues shares from its holdings at nominal price subject to vesting conditions. WERT held 11,905,480 and 11,905,480 treasury shares as of March 31, 2026 and 2025, respectively. Wipro Employee Restricted Stock Unit Option Plans A summary of the general terms of grants under restricted stock unit (“RSU”) option plans are as follows: Number of options Range of Name of Plan reserved under H[HUFLVH_SULFH_ the plan Wipro ADS Restricted Stock Unit Plan (WARSUP 2004 plan) (1) 174,595,958 U.S.$ 0.03 Wipro Employee Restricted Stock Unit Plan 2005 (WSRUP 2005 plan) (1) 96,595,958 H 2 Wipro Employee Restricted Stock Unit Plan 2007 (WSRUP 2007 plan) (1) 67,663,302 H 2 Wipro Limited Employee Stock Options, Performance Stock Unit and/or Restricted 400,000,000 U.S.$ 0.03/ H 2 Stock Unit Scheme 2024 (Wipro 2024 Scheme) (1) (1) The maximum contractual term of these RSU option plans is perpetual until the options are available for grant under the plan. Employees covered under RSU option plans are granted an option to purchase shares of the Company at the respective exercise prices, subject to requirements of vesting conditions. These options generally vest in tranches over a period of one to three years from the date of grant. Upon vesting, the employees can acquire one equity share for every option and can exercise within a period of twelve months from the vesting date of last tranche under the grant. The activity in equity-settled RSU option plans is summarised below: 5DQJH_RI_H[HUFLVH_SULFH_ Year ended Year ended DQG_ZHLJKWHG_DYHUDJH_ March 31, 2026 March 31, 2025 H[HUFLVH_SULFH Number of Number of options options H 2 18,634,747 7,735,669 Outstanding at the beginning of the year 36,956,579 18,851,226 U.S.$ 0.03 H 2 — 10,749,111 Bonus on outstanding (Refer to Note 32)— 22,882,839 U.S.$ 0.03 H 2 10,617,130 5,513,469 Granted 23,259,750 15,030,302 U.S.$ 0.03 Adjustment of Performance based stock options on completion of H 2 (1,841,526) (331,920) performance measurement period U.S.$ 0.03 (3,986,719) (499,875) H 2 (5,293,789) (3,731,212) Exercised (10,982,620) (9,897,384) U.S.$ 0.03 H 2 (2,771,279) (1,300,370) Forfeited and expired (8,303,933) (9,410,529) U.S.$ 0.03 H 2 19,345,283 18,634,747 Outstanding at the end of the year 36,943,057 36,956,579 U.S.$ 0.03 H 2 2,010,308 1,996,731 Exercisable at the end of the year 1,283,137 1,007,466 U.S.$ 0.03


LOGO

384 STATUTORY REPORTS AND FINANCIAL STATEMENTS CONSOLIDATED FINANCIAL STATEMENT UNDER IND AS Notes to the Consolidated Financial Statements (I in millions, except share and per share data, unless otherwise stated) The Company has granted below options under RSU and ADS option plans(1): Year ended Year ended March 31, 2026 March 31, 2025 Restricted Stock Units (RSU) 6,743,031 3,498,476 Performance based stock options (RSUs) 3,874,099 2,014,993 Total 10,617,130 5,513,469 ADS RSU 14,834,924 9,707,235 Performance based stock options (ADS) 8,424,826 5,323,067 Total 23,259,750 15,030,302 (1) Numbers in above table are not given effect of bonus shares issued during the year ended March 31, 2025. During the year ended March 31, 2026, RSU and ADS grants were issued under Wipro 2024 Scheme. Performance-based stock options will vest based on the performance parameters of the Company. The activity in cash-settled RSU option plans is summarised below: Year ended Year ended March 31, 2026 March 31, 2025 Number of Number of options options Outstanding at the beginning of the year—7,000 Exercised —Forfeited and expired—(7,000) Outstanding at the end of the year —Exercisable at the end of the year — The following table summarises information about outstanding RSU option plans: Year ended March 31, 2026 Year ended March 31, 2025 5DQJH_RI_H[HUFLVH_SULFH_DQG_ZHLJKWHG_ Number of Weighted average Number of Weighted average DYHUDJH_H[HUFLVH_SULFH options remaining life options remaining life (months) (months) C 2 19,345,283 16 18,634,747 18 U.S.$ 0.03 36,943,057 18 36,956,579 19 The weighted average grant date fair value of options granted during the years ended March 31, 2026 and 2025 was I 249.40 and I 454.58 for each option, respectively. The weighted average share price of options exercised during the years ended March 31, 2026 and 2025 was I 246.01 and I 389.52 for each option, respectively. 32. DIVIDENDS, BONUS ISSUES AND BUYBACK OF EQUITY SHARES The Company declares and pays dividends in Indian Rupees. According to the Companies Act, 2013 any dividend should be declared out of accumulated distributable profits. A company may, before the declaration of any dividend, transfer a REPORT 2025-26 percentage of its profits for that financial year as it may consider appropriate to the reserves. ANNUAL The cash dividends paid per equity share were I 11 (I 5 declared on July 17, 2025 and I 6 declared on January 16, 2026) and I 6, during the years ended March 31, 2026 and 2025, respectively. INTEGRATED During the year ended March 31, 2025, the Company concluded bonus issue in the ratio of 1:1 i.e. 1 (one) bonus equity share of I 2 each for every 1 (one) fully paid-up equity shares held (including ADS holders) was approved by the shareholders of the Company on November 21, 2024. Subsequently, on December 4, 2024, the Company allotted 5,232,094,402 equity shares (including ADS) to shareholders who held equity shares as on the record date of December 3, 2024. The Company also allotted 1:1 bonus equity share on 1,274,805 equity shares (including ADS) under allotment as on the record date. Consequently, I 10,467 (representing par value of I 2 per share) was transferred from capital redemption reserve, securities WIPRO premium and retained earnings to the share capital.


LOGO

385 Notes to the Consolidated Financial Statements (I in millions, except share and per share data, unless otherwise stated) 33. ADDITIONAL CAPITAL DISCLOSURES The key objective of the Company’s capital management is to ensure that it maintains a stable capital structure with the focus on total equity to uphold investor, creditor, and customer confidence and to ensure future development of its business. The Company’s focus is to keep strong total equity base to ensure independence, security, as well as a high financial flexibility for potential future borrowings, if required without impacting the risk profile of the Company. The Company’s goal is to continue to be able to return excess liquidity to shareholders by continuing to distribute annual dividends in future periods. The amount of future dividends/ buyback of equity shares will be balanced with efforts to continue to maintain an adequate liquidity status. The capital structure as of March 31, 2026 and 2025 was as follows: As at As at % Change March 31, 2026 March 31, 2025 Equity attributable to the equity shareholders of the Company I 880,183 H 823,641 7% As percentage of total capital 81% 81% Current borrowings 165,912 97,863 Non-current borrowings 1,962 63,954 Current and non-current lease liabilities 35,036 30,218 Total borrowings and lease liabilities I 202,910 H 192,035 6% As percentage of total capital 19% 19% Total capital K 1,083,093 K 1,015,676 7% Borrowings represents 15% and 16% of total capital as of March 31, 2026 and 2025, respectively. The Company is not subjected to any externally imposed capital requirements. 34. COMMITMENTS AND CONTINGENCIES Capital commitments: As at March 31, 2026 and 2025 the Company had committed to spend approximately I 9,416 and I 8,719 respectively, under agreements to purchase/construct property and equipment. These amounts are net of capital advances paid in respect of these purchases. Refer to Note 9 for uncalled capital commitments on investment in equity instruments. Guarantees: As at March 31, 2026 and 2025, guarantees provided by banks on behalf of the Company to the Indian Government, customers and certain other agencies amount to approximately I 13,358 and I 13,110 respectively, as part of the bank line of credit. Contingencies and lawsuits: The Company is subject to legal proceedings and claims resulting from tax assessment orders/ penalty notices issued under the Income tax Act, 1961, which have arisen in the ordinary course of its business. Some of the claims involve complex issues and it is not possible to make a reasonable estimate of the expected financial effect, if any, that will result from ultimate resolution of such proceedings. However, the resolution of these legal proceedings is not likely to have a material and adverse effect on the results of operations or the financial position of the Company. The Company’s assessments in India are completed for the years up to March 31, 2022. The Company has received demands on multiple tax issues. These claims are primarily arising out of denial of deduction under section 10A of the Income Tax Act, 1961 in respect of profit earned by the Company’s undertaking in Software Technology Park in Bengaluru, the appeals filed against the said demand before the appellate authorities have been allowed in favor of the Company by the second Appellate authority for the years up to March 31, 2008 which either has been or may be contested by the Income tax authorities before the Hon’ble Supreme Court of India. Other claims relate to disallowance of tax benefits on profits earned from Software Technology Park and special economic zone units, capitalisation of research and development expenses, transfer pricing adjustments on intercompany/ inter unit transactions and other issues.


LOGO

386 STATUTORY REPORTS AND FINANCIAL STATEMENTS CONSOLIDATED FINANCIAL STATEMENT UNDER IND AS Notes to the Consolidated Financial Statements (I in millions, except share and per share data, unless otherwise stated) Income tax claims against the Company amounting to I 104,613 and I 99,431 are not acknowledged as debt as at March 31, 2026 and 2025, respectively. These matters are pending before various appellate authorities and the management expects its position will likely be upheld on ultimate resolution and will not have a material adverse effect on the Company’s financial position and results of operations. The contingent liability in respect of disputed demands for excise duty, custom duty, sales tax and other matters amounting to I 20,733 and I 19,292 as of March 31, 2026 and 2025, respectively. However, the resolution of these disputed demands is not likely to have a material and adverse effect on the results of operations or the financial position of the Company. 35. SEGMENT INFORMATION The Company is now organised into the following operating segments: IT Services and IT Products. IT Services: The IT Services segment primarily consists of IT services offerings to customers organised by four Strategic Market Units (“SMUs”)—Americas 1, Americas 2, Europe and Asia Pacific, Middle East and Africa (“APMEA”). Americas 1 and Americas 2 are primarily organised by industry sector, while Europe and APMEA are organised by countries. Americas 1 includes the entire business of Latin America (“LATAM”) and the following industry sectors in the United States of America: Communication, Media and Networks, Technology Software and Gaming, Technology New Age, Health and Consumer. Americas 2 includes the entire business in Canada and the following industry sectors in the United States of America: Banking and Financial services, Energy, Manufacturing and Resources, Capital markets and Insurance and Hi-tech. Europe consists of the United Kingdom and Ireland, Switzerland, Germany and Western Europe. APMEA consists of Australia and New Zealand, Southeast Asia, Japan, India, the Middle East and Africa. Revenue from each customer is attributed to the respective SMUs based on the location of the customer’s primary buying center of such services. With respect to certain strategic global customers, revenue may be generated from multiple countries based on such customer’s buying centers, but the total revenue related to these strategic global customers are attributed to a single SMU based on the geographical location of key decision makers. Our IT Services segment provides a range of AI-powered IT and IT-enabled services including AI advisory, industry & functional consulting, AI native development, customer centric design, modernization, custom application development, infrastructure services, cybersecurity services, data and analytics services, business process services, research and development, and hardware and software design. Through AI-powered, consulting-led solutions, we help our clients transform their businesses to drive better efficiencies and generate new growth opportunities. IT Products: The Company is a value-added reseller of security, packaged and SaaS software for leading international brands. In certain total outsourcing contracts of the IT Services segment, the Company delivers hardware, software products and other related deliverables. Revenue relating to these items is reported as revenue from the sale of IT Products. The Chief Executive Officer (“CEO”) and managing director of the Company has been identified as the Chief Operating Decision Maker as defined by Ind AS 108, “Operating Segments”. The CEO evaluates the segments based on their revenue growth and operating income. REPORT 2025-26 Assets and liabilities used in the Company’s business are not identified to any of the operating segments, as these are ANNUAL used interchangeably between segments. Management believes that it is currently not practicable to provide segment disclosures relating to total assets and liabilities since a meaningful segregation of the available data is onerous. INTEGRATED WIPRO


LOGO

387 Notes to the Consolidated Financial Statements (I in millions, except share and per share data, unless otherwise stated) Information on reportable segments for the year ended March 31, 2026 is as follows: IT Services IT Products Reconciling Total Americas 1 Americas 2 Europe APMEA Total Items Revenue I 305,571 I 269,077 I 244,165 I 102,340 K 921,153 Ib_____ I—I 928,093 Segment result 62,896 53,138 31,083 14,955 162,072 559 (7,954) 154,677 Unallocated (3,426) — (3,426) Segment result total K 158,646 K 559 K (7,954) K 151,251 Finance costs (14,577) Finance and other income 36,491 6KDUH_RI_QHW_SURÙW___ORVV__RI_ 257 associate and joint venture accounted for using the equity method 3URÙW_EHIRUH_WD[ K 173,422 Income tax expense (40,767) 3URŮW_IRU_WKH_¥HDU K 132,655 Depreciation, amortisation and I 29,107 impairment Information on reportable segments for the year ended March 31, 2025 is as follows: IT Services IT Products Reconciling Total Americas 1 Americas 2 Europe APMEA Total Items Revenue H 281,824 H 271,972 H 240,077 H 94,351 K 888,224 H 2,692 H—H 890,916 Segment result 58,186 61,326 29,434 12,850 161,796 (173) (195) 161,428 Unallocated (10,157) — (10,157) Segment result total K 151,639 K (173) K (195) K 151,271 Finance costs (14,770) Finance and other income 38,202 6KDUH_RI_QHW_SURÙW___ORVV__RI_ 254 associate accounted for using the equity method 3URÙW_EHIRUH_WD[ K 174,957 Income tax expense (42,777) 3URŮW_IRU_WKH_¥HDU K 132,180 Depreciation, amortisation and H 29,579 impairment Revenues from India, being the Company’s country of domicile, were I 23,446 and I 20,699 for years ended March 31, 2026 and 2025, respectively.


LOGO

388 STATUTORY REPORTS AND FINANCIAL STATEMENTS CONSOLIDATED FINANCIAL STATEMENT UNDER IND AS Notes to the Consolidated Financial Statements (I in millions, except share and per share data, unless otherwise stated) Revenues from the United States of America and United Kingdom contributed more than 10% of Company’s total revenues as per table below: Year ended Year ended March 31, 2026 March 31, 2025 United States of America I 553,186 H 529,943 United Kingdom 97,041 95,241 Total K 650,227 K 625,184 No customer individually accounted for more than 10% of the revenues during the years ended March 31, 2026 and 2025. Management believes that it is currently not practicable to provide disclosure of geographical location wise assets, since the meaningful segregation of the available information is onerous. Notes: a) “Reconciling Items” includes elimination of inter-segment transactions and other corporate activities. b) Revenue from sale of Company owned Intellectual Properties is reported as a part of IT Services revenues. c) For the purpose of segment reporting, the Company has included the impact of “Foreign exchange gains/(losses), net” amounting to I 1,853 and I 32 for the fiscal years ended March 31, 2026 and 2025, respectively, in revenues, which is reported as a part of ‘Other income’ in the consolidated statement of profit and loss. d) Restructuring cost of I 5,139 and I Nil is included under Reconciling items for the years ended March 31, 2026 and 2025, respectively. e) Impact of past service cost on gratuity and remeasurement of leave encashment due to implementation of new labour code amounting to I 2,756 for the year ended March 31, 2026, is included under Reconciling items. f) “Unallocated” within IT Services segment results is after recognition of the below: Year ended Year ended March 31, 2026 March 31, 2025 Amortisation and impairment expenses on intangible assets (Refer to Note 7) I 7,787 H 7,909 Change in fair value of contingent consideration (Refer to Note 10) 49 (169) g) Segment results of IT Services segment are after recognition of gain/(loss) on sale of property, plant and equipment of I 393 and I 606 for the years ended March 31, 2026 and 2025, respectively. h) Segment results of IT Services segment are after recognition of share-based compensation expense I 4,465 and REPORT 2025-26 I 5,542 for the years ended March 31, 2026 and 2025, respectively. ANNUAL INTEGRATED WIPRO


LOGO

389 Notes to the Consolidated Financial Statements (I in millions, except share and per share data, unless otherwise stated) 36. RELATED PARTY RELATIONSHIP AND TRANSACTIONS The list of subsidiaries, associate and joint venture as of March 31, 2026 are provided in the table below: Subsidiaries Subsidiaries Subsidiaries Country of Holding Incorporation Attune Consulting India Private India 100.00% Limited Capco Technologies Private India 100.00% Limited Wipro Chengdu Limited b b China 8.96% Wipro Holdings (UK) Limited b U.K. 100.00% Wipro Technologies SRL Romania ^ Wipro IT Services Bangladesh Bangladesh 100.00% Limited Wipro IT Services UK Societas U.K. 100.00% Capco Consulting Middle East FZE(2) UAE 100.00% b Designit A/S Denmark 100.00% Designit Denmark A/S Denmark 100.00% Designit Germany GmbH Germany 100.00% Designit Oslo A/S Norway 100.00% Designit Spain Digital, S.L.U Spain 100.00% Designit T.L.V Ltd. Israel 100.00% Wipro Bahrain Limited Co. W.L.L b Bahrain 100.00% Wipro Czech Republic IT Services Czech 100.00% s.r.o. Republic Wipro CRM Services Belgium 100.00% Wipro 4C Consulting France SAS France 100.00% Wipro CRM Services B.V. Netherlands 100.00% Wipro CRM Services ApS Denmark 100.00% Wipro CRM Services UK Limited U.K. 100.00% Grove Holdings 2 S.á.r.l Luxembourg 100.00% Capco Solution Services GmbH Germany 100.00% The Capital Markets Company Italy 100.00% Italy Srl Capco Brasil Serviços E Brazil 99.99% Consultoria Ltda The Capital Markets Company (1) Belgium 100.00% BV


LOGO

390 STATUTORY REPORTS AND FINANCIAL STATEMENTS CONSOLIDATED FINANCIAL STATEMENT UNDER IND AS Notes to the Consolidated Financial Statements (I in millions, except share and per share data, unless otherwise stated) Subsidiaries Subsidiaries Subsidiaries Country of Holding Incorporation b PT. WT Indonesia b Indonesia 99.60% Rainbow Software LLC Iraq 100.00% Wipro Arabia Limited b Saudi Arabia 66.67% Women’s Business Park Saudi Arabia 100.00% Technologies Limited Wipro Doha LLC Qatar 100.00% Wipro Financial Outsourcing b U.K. 100.00% Services Limited Wipro UK Limited U.K. 100.00% Sultanate of b Wipro Gulf LLC b 99.98% Oman Wipro Information Technology Netherlands 100.00% Netherlands BV. Sultanate of Wipro Gulf LLC 0.02% Oman Wipro Technologies SA Argentina 2.62% Wipro (Thailand) Co. Limited Thailand 0.03% Wipro Technologies GmbH Germany 14.87% Wipro Do Brasil Sistemas De Brazil 0.07% Informatica Ltda Wipro do Brasil Technologia b (1) Brazil 99.44% Ltda Wipro Information Technology b Kazakhstan 100.00% Kazakhstan LLP Wipro Outsourcing Services b Ireland 100.00% (Ireland) Limited b Wipro Portugal S.A.(1) Portugal 100.00% b Wipro Solutions Canada Limited Canada 100.00% b Wipro Technologies Limited Russia 99.99% b b Wipro Technologies Peru SAC Peru 99.98% Wipro Technologies W.T. b b Costa Rica 100.00% Sociedad Anonima Wipro Technology Chile SPA Chile 100.00% 2025-26 Applied Value Technologies B.V. Netherlands 100.00% REPORT Wipro IT Service Ukraine, LLC Ukraine 100.00% Wipro IT Services Poland SP Z.O.O Poland 100.00% ANNUAL Wipro IT Services S.R.L. Romania 100.00% Wipro Regional Headquarter Saudi Arabia 100.00% INTEGRATED Wipro Technologies Australia Pty Ltd b Australia 100.00% WIPRO


LOGO

391 Notes to the Consolidated Financial Statements (I in millions, except share and per share data, unless otherwise stated) Subsidiaries Subsidiaries Subsidiaries Country of Holding Incorporation Wipro Ampion Holdings Pty Ltd(1) Australia 100.00% Wipro Technologies SA Argentina 97.38% Wipro Technologies SA DE CV Mexico 91.08% Wipro Technologies South Africa South Africa 69.42% (Proprietary) Limited Wipro Technologies Nigeria Nigeria 99.84% Limited b Wipro Technologies SRL b Romania 100.00% b Wipro (Thailand) Co. Limited b Thailand 99.97% Wipro Shanghai Limited China 84.63% Wipro Technologies Nigeria Limited Nigeria 0.16% Wipro Technologies Limited Russia 0.01% Wipro Technologies Peru SAC Peru 0.02% Wipro Japan KK b Japan 100.00% Wipro Networks Pte Limited b b Singapore 100.00% Applied Value Technologies Pte. Singapore 100.00% Limited Wipro Chengdu Limited China 91.04% PT. WT Indonesia b Indonesia 0.40% Wipro (Thailand) Co. Limited b Thailand ^ b Wipro (Dalian) Limited b China 100.00% Wipro Technologies SDN BHD Malaysia 100.00% Wipro (Tianjin) Limited(3) China 100.00% :LSUR_3KLOLSSLQHV__,QF_b Philippines 100.00% Wipro Shanghai Limited b b China 15.37% Wipro Travel Services Limited b b India 100.00% Wipro, LLC USA 100.00% Wipro Technologies SA DE CV Mexico 8.92% Wipro Gallagher Solutions, LLC USA 100.00% Wipro Insurance Solutions, LLC USA 100.00% Wipro IT Services, LLC(8) USA 100.00% Aggne Global Inc. USA 60.00% Edgile, LLC USA 100.00% HealthPlan Services, Inc.(1) USA 100.00% Infocrossing, LLC USA 100.00% International TechneGroup (1) USA 100.00% Incorporated Wipro NextGen Enterprise Inc.(1) USA 100.00%


LOGO

392 STATUTORY REPORTS AND FINANCIAL STATEMENTS CONSOLIDATED FINANCIAL STATEMENT UNDER IND AS Notes to the Consolidated Financial Statements (I in millions, except share and per share data, unless otherwise stated) Subsidiaries Subsidiaries Subsidiaries Country of Holding Incorporation Rizing Intermediate Holdings, (1) USA 100.00% Inc. Wipro Appirio, Inc.(1) USA 100.00% Wipro Designit Services, Inc.(1) USA 100.00% Wipro Telecom Consulting LLC USA 100.00% Wipro VLSI Design Services, LLC USA 100.00% Applied Value Technologies, Inc. USA 100.00% Wipro Business Services LLC(10) USA 100.00% The Capital Markets Company, ___b___ USA 100.00% LLC Aggne Global IT India 60.00% Services Private Limited Wipro, Inc. USA 100.00% :LSUR_/LIH_6FLHQFH_6ROXWLRQV__//&b USA 100.00% Wipro Connected Services, Inc. (Formerly known as Harman USA 100.00% Connected Services, Inc.)(4) (5) Wipro Connected Services Mauritius Pvt Ltd (Formerly known as Harman Mauritius 100.00% Connected Services Mauritius 3YWb/WG_b Connected Services Corporation Wipro India Private Limited (Formerly known as Harman India 98.40% Connected Services Corporation India Pvt. Ltd.) Connected Services Corporation Wipro India Private Limited (Formerly known as Harman India 1.60% Connected Services Corporation India Pvt. Ltd.) Wipro Connected Services Engineering Corp. (Formerly known USA 100.00% as Harman Connected Services 2025-26 Engineering Corp.) REPORT Wipro Connected Services UK Limited (Formerly known as Harman UK 100.00% &RQQHFWHG_6HUYLFHV_8._/LPLWHG_b ANNUAL INTEGRATED WIPRO


LOGO

393 Notes to the Consolidated Financial Statements (I in millions, except share and per share data, unless otherwise stated) Subsidiaries Subsidiaries Subsidiaries Country of Holding Incorporation Harman Connected Services Morocco 100.00% Morocco Wipro Connected Services US Midco LLC (Formerly known as Harman USA 100.00% Connected Services US Midco LLC) Harman Connected Services (1) Sweden 100.00% $%b The Wipro SA Broad Based Ownership Scheme Trust Wipro SA Broad Based Ownership 100.00% Scheme SPV (RF) (PTY) LTD Wipro Technologies South Africa South Africa 30.58% (Proprietary) Limited ^ Value is less than 0.01% The Company controls ‘The Wipro SA Broad Based Ownership Scheme Trust’, ‘Wipro SA Broad Based Ownership Scheme SPV (RF) (PTY) LTD’ incorporated in South Africa and Wipro Foundation in India. (2) Grove Holdings 2 S.á.r.l. has transferred its entire shareholding in Capco Consulting Middle East FZE to Wipro IT Services UK Societas, effective September 19, 2025. (3) Wipro (Tianjin) Limited has been incorporated with effect from May 23, 2025, which is 100% held by Wipro Networks Pte Limited. (4) The Company, through its subsidiaries, has acquired 100% shareholding in Wipro Connected Services, Inc. (Formerly known as Harman Connected Services, Inc.) and its subsidiaries, effective December 1, 2025. (5) Wipro Digital Inc., a wholly owned subsidiary, has merged with Wipro Connected Services, Inc. (Formerly known as Harman Connected Services, Inc.), a step-down subsidiary, effective December 1, 2025. (6) Cardinal US Holdings, Inc transferred its entire ownership in Capco Consulting Services LLC to The Capital Markets Company, LLC effective March 30, 2026. (7) Capco RISC Consulting LLC merged with The Capital Markets Company, LLC effective March 30, 2026. (8) Cardinal US Holdings, Inc. merged with Wipro IT Services, LLC effective March 31, 2026. (9) Rizing Consulting USA, LLC (Formerly known as Rizing Consulting USA, Inc.) merged with Rizing LLC effective March 31, 2026. (10) Wipro Business Services LLC has been incorporated as a step down subsidiary of the Company with effect from January 20, 2026, which is 100% held by Wipro, LLC. (1) Step Subsidiary details of The Capital Markets Company LLC, HealthPlan Services, Inc., International TechneGroup Incorporated, Wipro NextGen Enterprise Inc., Rizing Intermediate Holdings, Inc., The Capital Markets Company BV, Wipro Ampion Holdings Pty Ltd, Wipro Appirio, Inc., Wipro Designit Services, Inc., Wipro do Brasil Technologia Ltda, Wipro Portugal S.A. and Harman Connected Services AB are as follows:


LOGO

394 STATUTORY REPORTS AND FINANCIAL STATEMENTS CONSOLIDATED FINANCIAL STATEMENT UNDER IND AS Notes to the Consolidated Financial Statements (I in millions, except share and per share data, unless otherwise stated) Country of Subsidiaries Subsidiaries Subsidiaries Holding Incorporation The Capital Markets USA Company, LLC Capco Consulting Services LLC(6) USA 100.00% HealthPlan Services, USA Inc. HealthPlan Services Insurance USA 100.00% Agency, LLC International TechneGroup USA Incorporated International TechneGroup Ltd. U.K. 100.00% ,7,_3URŮFLHQF¥_/WG Israel 100.00% MechWorks S.R.L. Italy 100.00% Wipro NextGen USA Enterprise Inc. LeanSwift AB Sweden 100.00% Rizing Intermediate USA Holdings, Inc. Rizing Lanka (Private) Ltd Sri Lanka 100.00% Attune Netherlands B.V.(11) Netherlands 100.00% Rizing Solutions Canada Inc. Canada 100.00% Rizing LLC(9) USA 100.00% 5L]LQJ_%_9_b Netherlands 100.00% Rizing Consulting Ireland Ireland 100.00% Limited Rizing Consulting Pty Ltd. Australia 100.00% Rizing Geospatial LLC USA 100.00% Rizing GmbH Germany 100.00% Rizing Limited U.K. 100.00% Rizing Pte Ltd.(11) Singapore 100.00% The Capital Markets b b Belgium Company BV CapAfric Consulting (Pty) Ltd South Africa 100.00% 2025-26 b Capco Belgium BV b Belgium 100.00% REPORT The Capital Markets Company Slovakia 15.00% s.r.o ANNUAL Capco Consultancy (Thailand) Thailand 0.04% Ltd Capco Consultancy (Malaysia) Sdn. Bhd Malaysia 100.00% INTEGRATED Capco Consultancy (Thailand) Ltd Thailand 99.92% Capco Consulting Singapore Pte. Ltd Singapore 100.00% Capco Greece Single Member P.C Greece 100.00% Capco Poland sp. z.o.o Poland 100.00% WIPRO The Capital Markets Company (UK) Ltd U.K. 100.00%


LOGO

395 Notes to the Consolidated Financial Statements (I in millions, except share and per share data, unless otherwise stated) Country of Subsidiaries Subsidiaries Subsidiaries Holding Incorporation Capco Consultancy Thailand 0.04% (Thailand) Ltd The Capital Markets Company Hong Kong 0.01% Limited The Capital Markets Company GmbH Germany 100.00% Capco Austria GmbH Austria 100.00% The Capital Markets Company Limited Hong Kong 99.99% The Capital Markets Company Limited Canada 100.00% Capco Brasil Serviços E b Brazil 0.01% &RQVXOWRULD_/WGDb The Capital Markets Company S.á.r.l Switzerland 100.00% Andrion AG Switzerland 100.00% The Capital Markets Company S.A.S France 100.00% The Capital Markets Company s.r.o Slovakia 85.00% Wipro Ampion Australia Holdings Pty Ltd Wipro Revolution IT Pty Ltd Australia 100.00% :LSUR_6KHOGH_$XVWUDOLD_3W¥_/WGb Australia 100.00% Wipro Appirio, Inc. USA Wipro Appirio (Ireland) Limited Ireland 100.00% Wipro Appirio UK Limited U.K. 100.00% Topcoder, LLC USA 100.00% Wipro Designit Services, Inc. USA Wipro Designit Services Limited Ireland 100.00% Wipro do Brasil Technologia Ltda Brazil Wipro do Brasil Servicos Ltda Brazil 100.00% Wipro Do Brasil Sistemas De Brazil 96.84% Informatica Ltda Wipro Portugal S.A. b b Portugal Wipro do Brasil Technologia Ltda Brazil 0.56% Wipro Do Brasil Sistemas De Brazil 3.09% Informatica Ltda b Wipro Technologies GmbH b Germany 85.13% Wipro Business Solutions (11) Germany 100.00% GmbH Wipro IT Services Austria GmbH Austria 100.00% Harman Connected Services AB Sweden Harman Connected Services China 100.00% Solutions (Chengdu) Co. Ltd.


LOGO

396 STATUTORY REPORTS AND FINANCIAL STATEMENTS CONSOLIDATED FINANCIAL STATEMENT UNDER IND AS Notes to the Consolidated Financial Statements (I in millions, except share and per share data, unless otherwise stated) (11) Step Subsidiary details of Attune Netherlands B.V., Rizing Pte Ltd. and Wipro Business Solutions GmbH are as follows: Subsidiaries Subsidiaries Subsidiaries Country of Holding Incorporation Attune Netherlands B.V. Netherlands Rizing Germany GmbH Germany 100.00% Attune Italia S.R.L Italy 100.00% Attune UK Ltd. U.K. 100.00% Rizing Pte Ltd. Singapore Rizing New Zealand Ltd. New Zealand 100.00% Rizing Philippines Inc. Philippines 100.00% Rizing SDN BHD Malaysia 100.00% Rizing Solutions Pty Ltd Australia 100.00% Wipro Business Solutions GmbH Germany Wipro Technology Solutions S.R.L Romania 100.00% As at March 31, 2026, Wipro, LLC held 43.7% interest in Drivestream Inc., incorporated in the USA, and Wipro IT Services LLC held 27% interest in SDVerse LLC, incorporated in the USA, accounted for using the equity method. The list of controlled trusts are: Name of the entity Country of incorporation Wipro Equity Reward Trust India Wipro Foundation India Vide the order dated June 06, 2025, the Hon’ble National Company Law Tribunal, Bengaluru bench, approved the scheme of amalgamation for the merger of wholly owned subsidiaries Wipro HR Services India Private Limited, Wipro Overseas IT Services Private Limited, Wipro Technology Product Services Private Limited, Wipro Trademarks Holding Limited and Wipro VLSI Design Services India Private Limited with Wipro Limited. As per the said scheme, the appointed date is April 1, 2025. The other related parties are: Name of the related parties: Nature Azim Premji Foundation Entity controlled by Promoters Azim Premji Foundation for Development Entity controlled by Promoters Hasham Traders Entity controlled by Promoters 2025-26 Prazim Traders Entity controlled by Promoters REPORT Zash Traders Entity controlled by Promoters Hasham Investment and Trading Co. Pvt. Ltd Entity controlled by Promoters ANNUAL Azim Premji Philanthropic Initiatives Pvt. Ltd Entity controlled by Promoters Azim Premji Trust Entity controlled by Promoters INTEGRATED Azim Premji Trustee Company Pvt Ltd Entity controlled by Promoters Azim Premji Safe Deposit Pvt Ltd Entity controlled by Promoters Hasham Premji Pvt Ltd Entity controlled by Promoters PI Opportunities Fund I Entity controlled by Promoters WIPRO PI Opportunities Fund II Entity controlled by Promoters


LOGO

397 Notes to the Consolidated Financial Statements (I in millions, except share and per share data, unless otherwise stated) Name of the related parties: Nature Apex Trust Entity controlled by Promoters Napean Trading and Investment Company (Singapore) Pte Ltd Entity controlled by Promoters Pioneer Private Trust Entity controlled by Promoters Pioneer Investment Fund Entity controlled by Promoters Azim Premji Trust Services Pvt Ltd Entity controlled by Promoters Pl International Holdings LLC Entity controlled by Promoters Azim Premji Custodial & Management Service Private Limited Entity controlled by Promoters Azim Premji Education Trust Entity controlled by Promoters Prazim Trading & Investment Company Private Limited Entity controlled by Promoters Nina Investment & Estates Pvt. Ltd. Entity controlled by Promoters Varsha Investment & Estates Pvt. Ltd. Entity controlled by Promoters Bharti Investment & Estates Pvt. Ltd. Entity controlled by Promoters Napean Opportunities LLP Entity controlled by Promoters Best Value Chem Private Limited Entity controlled by Promoters PI Investment Advisory LLP Entity controlled by Promoters WEPL Family Trust Entity controlled by Promoters Hygienic Research Institute Private Limited Entity controlled by Promoters Wipro Enterprises (P) Limited and its subsidiaries Entity controlled by Promoters Azim Premji University Entity controlled by Promoters PI Opportunities Fund I Scheme II Entity controlled by Promoters PI Opportunities AIF V LLP Entity controlled by Promoters Vidyaniti LLP Entity controlled by Promoters Pioneer Investment Fund Scheme II Entity controlled by Promoters Tariq Azim Premji Trust Entity controlled by Promoters Pioneer Independent Trust Entity controlled by Promoters Central Camera Co. Pvt. Ltd. Entity controlled by Promoters Gem Photographic (India) Pvt. Ltd. Entity controlled by Promoters Wipro GE Healthcare Private Limited Joint Venture between Wipro Enterprises (P) Limited and General Electric S.B. Packagings Private Limited (QWLW¥_ZLWK_VLJQLŮFDQW_LQůXHQFH_RI_3URPRWHUV Financial Software and Systems Private Limited (QWLW¥_ZLWK_VLJQLŮFDQW_LQůXHQFH_RI_3URPRWHUV Fab India Limited (QWLW¥_ZLWK_VLJQLŮFDQW_LQůXHQFH_RI_3URPRWHUV Amagi Media Labs Private Limited (QWLW¥_ZLWK_VLJQLŮFDQW_LQůXHQFH_RI_3URPRWHUV Finnovation Tech Solutions Private Limited (QWLW¥_ZLWK_VLJQLŮFDQW_LQůXHQFH_RI_3URPRWHUV Shubham Housing Development Finance Company Limited (QWLW¥_ZLWK_VLJQLŮFDQW_LQůXHQFH_RI_3URPRWHUV Microplastics Private Limited (QWLW¥_ZLWK_VLJQLŮFDQW_LQůXHQFH_RI_3URPRWHUV Comfort Grid Technologies Private Limited (QWLW¥_ZLWK_VLJQLŮFDQW_LQůXHQFH_RI_3URPRWHUV TI Medical Private Limited (QWLW¥_ZLWK_VLJQLŮFDQW_LQůXHQFH_RI_3URPRWHUV Indiejewel Fashions Private Limited (QWLW¥_ZLWK_VLJQLŮFDQW_LQůXHQFH_RI_3URPRWHUV The Woodenstreet Furnitures Private Limited (QWLW¥_ZLWK_VLJQLŮFDQW_LQůXHQFH_RI_3URPRWHUV SBI General Insurance Company Limited (QWLW¥_ZLWK_VLJQLŮFDQW_LQůXHQFH_RI_3URPRWHUV


LOGO

398 STATUTORY REPORTS AND FINANCIAL STATEMENTS CONSOLIDATED FINANCIAL STATEMENT UNDER IND AS Notes to the Consolidated Financial Statements (I in millions, except share and per share data, unless otherwise stated) Name of the related parties: Nature Weaver Services Private Limited (QWLW¥_ZLWK_VLJQLŮFDQW_LQůXHQFH_RI_3URPRWHUV Krazybee Services Private Limited (QWLW¥_ZLWK_VLJQLŮFDQW_LQůXHQFH_RI_3URPRWHUV 3RVW_HPSOR¥PHQW_EHQHŮW_SODQV Wipro Information Technology Limited Provident Fund Trust 3RVW_HPSOR¥PHQW_EHQHŮW_SODQV Wipro Systems Provident Fund Trust 3RVW_HPSOR¥PHQW_EHQHŮW_SODQV Wipro Limited Management Employees Pension Fund 3RVW_HPSOR¥PHQW_EHQHŮW_SODQV Wipro Limited BPO Division Employees Superannuation Trust 3RVW_HPSOR¥PHQW_EHQHŮW_SODQV Wipro Infotech Limited Management Employees Pension Fund 3RVW_HPSOR¥PHQW_EHQHŮW_SODQV Wipro Limited Employees Superannuation Fund 3RVW_HPSOR¥PHQW_EHQHŮW_SODQV Wipro Limited Employees Gratuity Fund 3RVW_HPSOR¥PHQW_EHQHŮW_SODQV Wipro Limited BPO Division Employees Gratuity Trust 3RVW_HPSOR¥PHQW_EHQHŮW_SODQV Key management personnel Azim H. Premji Non-Executive, Non-Independent Director (designated as “Founder Chairman”)(1) Rishad A. Premji Chairman of the Board (designated as “Executive Chairman”) Srinivas Pallia &KLHI_([HFXWLYH_2IÙFHU_DQG_0DQDJLQJ_‘LUHFWRU Aparna C. Iyer &KLHI_)LQDQFLDO_2IÙFHU Päivi Rekonen Independent Director N. S. Kannan Independent Director Dr. Patrick J. Ennis Independent Director(2) Patrick Dupuis Independent Director(2) Laura Marie Miller Independent Director(3) Deepak M. Satwalekar Independent Director Tulsi Naidu Independent Director M. Sanaulla Khan Company Secretary (1) Mr. Azim H. Premji is the ultimate controlling party. (2) Dr. Patrick J. Ennis and Mr. Patrick Dupuis retired from their positions as Independent Directors of the Company with effect from the close of business hours on March 31, 2026. (3) On March 5, 2026, the Board of Directors approved the appointment of Ms. Laura Marie Miller as an Additional Director in the capacity of Independent Director for a term of five years, with effect from April 1, 2026 to March 31, 2031, subject to the approval of the Members of the Company. The 2025-26 appointment was approved by the Members of the Company vide special resolution dated May 21, 2026, passed through postal ballot by e-voting. REPORT Close members of Key management personnel:—Yasmeen A. Premji ANNUAL —Tariq A. Premji INTEGRATED —Aditi Mehta Premji—Avita Hazarika WIPRO


LOGO

399 Notes to the Consolidated Financial Statements (I in millions, except share and per share data, unless otherwise stated) The Company has the following related party transactions: Entities FRQWUROOHG_E¥_ Key $VVRFLDWH_-RLQW_ Other related ZLWK_VLJQLÙFDQW_ management Venture parties LQùXHQFH_RI_ personnel Promoters Transactions for the year ended March 31, 2026 Sale of goods and services I 358 I—I 7 I -Purchase of goods/services 169 — -Items of property, plant and equipments purchased 145 — -Ticketing and hospitality 418-— Dividend (1) 78,692 5,097 — Rental income 11-—Rent paid 1 12--Sale of investment — 181 -Advance paid to supplier 46-— &RQWULEXWLRQ_WR_SRVW_HPSOR¥PHQW_EHQHŮW_SODQV ——7,058 Contribution to Gratuity trust ——5,220 Investment — 348 -Others 20-— Key management personnel(2) 5HPXQHUDWLRQ_DQG_VKRUW_WHUP_EHQHÙWV(3) I—I 525 I—I -2WKHU_EHQHÙWV(4)—278 — Balance as at March 31, 2026 Receivables I 371 I—I—I -Payables—139 — Entities controlled by/ Key Associate/Joint Other related ZLWK_VLJQLÙFDQW_ management Venture parties LQùXHQFH_RI_ personnel Promoters Transactions for the year ended March 31, 2025 Sale of goods and services H 305 H—H—H -Purchase of goods/services 423 — -Items of property, plant and equipments purchased 155 — -Ticketing and hospitality 448 — -Dividend(1) 42,923 2,780 —Rental income 31 — -Rent paid 1 12 — &RQWULEXWLRQ_WR_SRVW_HPSOR¥PHQW_EHQHŮW_SODQV ——6,517 Others 70 ——Key management personnel(2)(5) 5HPXQHUDWLRQ_DQG_VKRUW_WHUP_EHQHÙWV(3) H—H 619 H—H -2WKHU_EHQHÙWV(4)—290 — Balance as at March 31, 2025 Receivables H 255 H—H—H -Payables—256 — (1) Includes close members of key management personnel. (2) Post employment benefit and other long-term benefits including compensated absences are not disclosed, as these are determined for the Company as a whole based on actuarial valuation. (3) Remuneration and short-term benefits includes sitting fees and commission paid to non-executive directors, non-independent directors, and independent directors. (4) Other benefits include I 272 and I 284, for the years ended March 31, 2026 and 2025, respectively towards amortisation of RSUs granted to key management personnel, which vest over a period of time. This also includes RSU’s that will vest based on performance parameters of the Company. (5) Remuneration, short-term benefits and other benefits for Mr. Srinivas Pallia is for the period from April 7, 2024 to March 31, 2025.


LOGO

400 STATUTORY REPORTS AND FINANCIAL STATEMENTS CONSOLIDATED FINANCIAL STATEMENT UNDER IND AS Notes to the Consolidated Financial Statements (I in millions, except share and per share data, unless otherwise stated) The following are the significant related party transactions during the years ended March 31, 2026 and 2025: Year ended Year ended March 31, 2026 March 31, 2025 6DOHV_RI_JRRGV_DQG_VHUYLFHV_WR_HQWLWLHV_FRQWUROOHG_E¥_ZLWK_VLJQLŮFDQW_LQůXHQFH_RI_ Promoters Wipro Enterprises (P) Limited I 348 H 269 Wipro GE Healthcare Private Limited 10 36 6DOH_RI_JRRGV_DQG_VHUYLFHV_WR_$VVRFLDWH_-RLQW_YHQWXUH SDVerse LLC Ib_b_ H—,WHPV_RI_SURSHUW¥__SODQW_DQG_HTXLSPHQWV_SXUFKDVHG_IURP_HQWLWLHV_FRQWUROOHG_E¥_ ZLWK_VLJQLŮFDQW_LQůXHQFH_RI_3URPRWHUV Wipro Enterprises (P) Limited I 142 H 155 Wipro Pari Private Limited 3—3XUFKDVH_RI_JRRGV_DQG_VHUYLFH_IURP_HQWLWLHV_FRQWUROOHG_E¥_ZLWK_VLJQLŮFDQW_LQůXHQFH_ of Promoters Wipro Pari GmBH I 88 H 409 SBI General Insurance Company Limited 81 -Wipro Pari Private limited—11 Wipro Enterprises (P) Limited—3 7LFNHWLQJ_DQG_+RVSLWDOLW¥_IRU_HQWLWLHV_FRQWUROOHG_E¥_ZLWK_VLJQLŮFDQW_LQůXHQFH_RI_ Promoters Wipro Enterprises (P) Limited I 240 H 283 PI Investment Advisory LLP 56 56 Azim Premji Foundation for Development 42 35 Azim Premji University 39 33 Azim Premji Philanthropic Initiatives Pvt. Ltd 28 26 Azim Premji Trust 3 3 Best Value Chem Private Limited 3 3 Azim Premji Education Trust 4 3 Azim Premji Foundation 2 1 Vidyaniti LLP 1 -PI International Holdings LLC—5 2025-26 Napean Trading and Investment Company (Singapore) Pte Ltd—^ Hasham Traders—^ REPORT ‘LYLGHQG_SDLG_WR_HQWLWLHV_FRQWUROOHG_E¥_ZLWK_VLJQLŮFDQW_LQůXHQFH_RI_3URPRWHUV ANNUAL Zash Traders I 24,224 H 12,487 Prazim Traders 23,763 12,248 INTEGRATED Hasham Traders 20,755 10,607 Azim Premji Trust 7,484 6,379 Prazim Trading & Investment Company Private Limited 2,131 1,020 Azim Premji Philanthropic Initiatives Pvt. Ltd 305 166 WIPRO Hasham Investment And Trading Co Pvt Ltd 30 16


LOGO

401 Notes to the Consolidated Financial Statements (I in millions, except share and per share data, unless otherwise stated) Year ended Year ended March 31, 2026 March 31, 2025 Dividend paid to Key management personnel Azim H. Premji I 4,743 H 2,587 Rishad A. Premji 149 81 Tariq A. Premji 146 80 Yasmeen A. Premji 55 31 Srinivas Pallia 2 1 Aparna C. Iyer 1 ^ M. Sanaulla Khan 1 ^ 5HQWDO_LQFRPH_IURP_HQWLWLHV_FRQWUROOHG_E¥_ZLWK_VLJQLŮFDQW_LQůXHQFH_RI_3URPRWHUV Wipro Enterprises (P) Limited I 11 H 7 PI Investment Advisory LLP—24 Rent paid to Key management personnel Azim H. Premji I 12 H 12 5HQW_SDLG_WR_HQWLWLHV_FRQWUROOHG_E¥_ZLWK_VLJQLŮFDQW_LQůXHQFH_RI_3URPRWHUV Wipro Enterprises (P) Limited I 1 H 1 $GYDQFHV_3DLG_WR_HQWLWLHV_FRQWUROOHG_E¥_ZLWK_VLJQLŮFDQW_LQůXHQFH_RI_3URPRWHUV SBI General Insurance Company Limited I 46 H—6DOH_RI_LQYHVWPHQW_ZLWK_$VVRFLDWH_-RLQW_YHQWXUH Drivestream Inc. I 181 H—&RQWULEXWLRQ_WR_SRVW_HPSOR¥PHQW_EHQHŮW_SODQV Wipro Systems Provident Fund Trust I 7,058 H 6,517 Contribution to Gratuity trust Wipro Limited Employees Gratuity Fund I 5,220 H—,QYHVWPHQW_ZLWK_$VVRFLDWH_-RLQW_YHQWXUH Drivestream Inc. I 348 H—2WKHUV_WUDQVDFWLRQV_ZLWK_HQWLWLHV_FRQWUROOHG_E¥_ZLWK_VLJQLŮFDQW_LQůXHQFH_RI_3URPRWHUV Wipro Enterprises (P) Limited I 8 H 9 Wipro Pari Private limited 6 2 Azim Premji Foundation 5 2 Azim Premji Philanthropic Initiatives Pvt. Ltd 1 1 Azim Premji Education Trust ^ ^ PI Investment Advisory LLP—^ Remuneration paid to Key management personnel Azim H. Premji(1) I 11 H 11 Rishad A. Premji 73 138 Srinivas Pallia 496 536 Aparna C. Iyer 67 72 Patrick Dupuis(2) 26 27 Tulsi Naidu(2) 26 22 M. Sanaulla Khan 25 30 Dr. Patrick J. Ennis(2) 25 24 Deepak M. Satwalekar(2) 20 18 Paivi Rekonen(2) 20 18 N. S. Kannan(2) 14 13


LOGO

402 STATUTORY REPORTS AND FINANCIAL STATEMENTS CONSOLIDATED FINANCIAL STATEMENT UNDER IND AS Notes to the Consolidated Financial Statements (I in millions, except share and per share data, unless otherwise stated) Year ended Year ended March 31, 2026 March 31, 2025 5HFHLYDEOHV_IURP_HQWLWLHV_FRQWUROOHG_E¥_ZLWK_VLJQLŮFDQW_LQůXHQFH_RI_3URPRWHUV Wipro Enterprises (P) Limited I 253 H 148 Wipro PARI Private Limited 79 70 SBI General Insurance Company Limited 17 -Azim Premji Foundation 8 11 Wipro Pari Inc 7 -PI Investment Advisory LLP 3 4 Wipro Linecraft AI Private Limited 2 -Wipro PARI High Speed Automation Private Limited 1 -Vidyaniti LLP 1 -Wipro GE Healthcare Private Limited—21 Azim Premji Philanthropic Initiatives Pvt. Ltd—1 Payable to Key management personnel Azim H. Premji I 3 H 3 Rishad A. Premji 2 70 Srinivas Pallia 99 149 Aparna C. Iyer 1 3 M. Sanaulla Khan 1 2 Paivi Rekonen 5 4 Dr. Patrick J. Ennis 6 6 Patrick Dupuis 7 7 Deepak M. Satwalekar 5 4 Tulsi Naidu 7 5 N. S. Kannan 3 3 1XPEHU_RI_%RQXV_VKDUHV_LVVXHG_WR_HQWLWLHV_FRQWUROOHG_E¥_ZLWK_VLJQLŮFDQW_LQůXHQFH_RI_ Promoters Zash Traders—1,040,566,791 Hasham Traders—883,913,365 Prazim Traders—1,020,648,973 Azim Premji Trust—531,592,983 Hasham Investment and Trading Co. Pvt. Ltd—1,355,953 Prazim Trading & Investment Company Private Limited—84,954,128 Azim Premji Philanthropic Initiatives Pvt. Ltd—13,862,415 Number of Bonus shares issued to Key management personnel 2025-26 Azim H. Premji—215,578,357 Rishad A. Premji—6,768,891 REPORT Tariq A. Premji—6,619,215 Yasmeen A. Premji—2,559,378 ANNUAL Srinivas Pallia—100,000 Aparna C. Iyer—16,751 INTEGRATED M. Sanaulla Khan—20,200 ^ Value is less than I 0.5 (1) Includes sitting fees and commission paid to Non-Executive, Non-Independent Director. (2) Includes sitting fees and commission paid to Independent Directors. All related party transactions were entered at an arm’s length basis and in the ordinary course of business. There are no WIPRO materially significant related party transactions made by the Company with promoters, directors or key management personnel, which may have a potential conflict with the interests of the Company at large.


LOGO

403 Notes to the Consolidated Financial Statements (I in millions, except share and per share data, unless otherwise stated) 37. ADDITIONAL INFORMATION AS REQUIRED UNDER SCHEDULE III TO THE COMPANIES ACT, 2013 PURSUANT TO PARA 2 OF GENERAL INSTRUCTIONS FOR THE PREPARATION OF CONSOLIDATED FINANCIAL STATEMENTS Share in Other Share in total Share in Net Asset comprehensive comprehensive 3URÙW_RU_/RVV Name of the entity income income As % of Amount As % of Amount As % of Amount As % of Amount total in I total in I total in I total in I Parent Wipro Limited(3) 72.1% H 634,938 91.9% H121,270 (24.6)% H (8,665) 67.3% H 112,605 Indian Subsidiaries Aggne Global IT Services Private Limited 0.0% 233 0.1% 87 0.0% 4 0.1% 91 Attune Consulting India Private Limited 0.0% 69 0.0% 11 0.0%—0.0% 11 Capco Technologies Private Limited 0.3% 2,644 0.6% 752 (0.0)% (4) 0.4% 748 Connected Services Corporation Wipro India Private 0.6% 5,460 0.3% 334 (0.8)% (281) 0.0% 53 Limited(1) Wipro Travel Services Limited 0.0% 181 0.0% 30 0.0%—0.0% 30 Foreign Subsidiaries Wipro Appirio (Ireland) Limited 0.1% 618 (0.0)% (9) 0.0% 10 0.0% 1 Wipro Appirio UK Limited 0.0% 64 0.0% 4 0.0% 7 0.0% 11 Wipro Appirio, Inc. 0.4% 3,490 0.1% 183 0.2% 82 0.2% 265 Wipro IT Services Austria GmbH 0.0% 266 0.0% 35 0.1% 42 0.0% 77 Cardinal US Holdings, Inc.(8)(9) 2.4% 21,506 (0.0)% (1) 0.2% 72 0.0% 71 Andrion AG 0.0% 148 0.0% 18 0.1% 25 0.0% 43 Capco Austria GmbH 0.0% 57 (0.0)% (29) 0.0% 12 (0.0)% (17) Capco Belgium BV 0.0% 140 0.0% 1 0.1% 21 0.0% 22 The Capital Markets Company (UK) Ltd 0.3% 2,258 (0.2)% (295) 0.8% 289 (0.0)% (6) The Capital Markets Company Italy Srl 0.0% 99 0.0% 29 0.0% 12 0.0% 41 The Capital Markets Company Limited(5) 0.4% 3,541 0.2% 302 1.3% 464 0.5% 766 The Capital Markets Company s.r.o 0.0% 204 0.0% 23 0.1% 29 0.0% 52 The Capital Markets Company Limited(4) (0.0)% (283) (0.3)% (382) (0.0)% (16) (0.2)% (398) The Capital Markets Company S.A.S 0.0% 97 (0.2)% (288) 0.1% 40 (0.1)% (248) Capco Poland sp. z.o.o 0.1% 563 0.2% 262 0.2% 53 0.2% 315 The Capital Markets Company S.á.r.l 0.1% 462 0.1% 104 0.3% 104 0.1% 208 CapAfric Consulting (Pty) Ltd (0.0)% (10) (0.0)% (1) (0.0)% (1) (0.0)% (2) Capco Consulting Singapore Pte. Ltd 0.0% 80 0.0% 38 0.0% 8 0.0% 46 The Capital Markets Company GmbH (0.1)% (750) (0.4)% (501) (0.2)% (74) (0.3)% (575) Capco Consultancy (Malaysia) Sdn. Bhd 0.0% 59 (0.0)% (20) 0.0% 12 (0.0)% (8) Capco Greece Single Member P.C 0.1% 1,069 0.3% 335 0.4% 132 0.3% 467 Capco Consultancy (Thailand) Ltd 0.1% 541 (0.0)% (46) 0.2% 73 0.0% 27 Wipro NextGen Enterprise Inc. 0.1% 505 0.1% 112 0.1% 34 0.1% 146 LeanSwift AB 0.0% 7 0.0% 2 0.0% 2 0.0% 4 Edgile, LLC 0.1% 508 (0.1)% (114) 0.2% 59 (0.0)% (55)


LOGO

404 STATUTORY REPORTS AND FINANCIAL STATEMENTS CONSOLIDATED FINANCIAL STATEMENT UNDER IND AS Notes to the Consolidated Financial Statements (I in millions, except share and per share data, unless otherwise stated) Share in Other Share in total Share in Net Asset comprehensive comprehensive 3URÙW_RU_/RVV Name of the entity income income As % of Amount As % of Amount As % of Amount As % of Amount total in I total in I total in I total in I Designit A/S 0.0% 283 (0.4)% (566) 0.1% 39 (0.3)% (527) Designit Denmark A/S 0.0% 295 0.0% 28 0.1% 44 0.0% 72 Designit Germany GmbH (0.1)% (490) 0.0% 14 (0.2)% (77) (0.0)% (63) Designit Oslo A/S 0.0% 49 0.0% 12 0.0% 7 0.0% 19 Designit Spain Digital, S.L.U 0.0% 75 0.0% 17 0.0% 10 0.0% 27 Designit T.L.V Ltd. 0.0% 118 0.0% 9 0.1% 18 0.0% 27 HealthPlan Services Insurance Agency, LLC 0.1% 1,090 (0.1)% (142) 0.3% 112 (0.0)% (30) HealthPlan Services, Inc. 0.2% 2,049 1.3% 1,702 1.0% 336 1.2% 2,038 Infocrossing, LLC 0.2% 1,488 2.4% 3,197 0.4% 146 2.0% 3,343 International TechneGroup Incorporated 0.1% 1,137 0.6% 752 0.1% 50 0.5% 802 International TechneGroup Ltd. 0.0% 62 0.0% 55 0.0% 4 0.0% 59 ,7,_3URŮFLHQF¥_/WG 0.0% 64 0.0% 7 0.0% 13 0.0% 20 MechWorks S.R.L. 0.0% 224 0.1% 119 0.2% 73 0.1% 192 PT. WT Indonesia 0.0% 262 0.0% 65 0.1% 21 0.1% 86 Rainbow Software LLC — — — —Grove Holdings 2 S.á.r.l 0.7% 5,980 1.8% 2,314 0.1% 26 1.4% 2,340 The Capital Markets Company BV 0.8% 7,410 (2.2)% (2,910) 1.9% 685 (1.3)% (2,225) The Capital Markets Company LLC(9)(10) 0.5% 4,809 0.1% 76 1.3% 470 0.3% 546 Capco RISC Consulting LLC(10) (0.0)% (237) (0.0)% (36) (0.1)% (22) (0.0)% (58) Capco Consulting Services LLC(9) 0.4% 3,848 1.1% 1,419 0.9% 334 1.0% 1,753 Capco Brasil Serviços E Consultoria Ltda 0.1% 1,256 0.3% 379 0.4% 150 0.3% 529 Capco Solution Services Gmbh 0.0% 87 (0.0)% (1) 0.0% 14 0.0% 13 Wipro Ampion Holdings Pty Ltd 0.1% 508 — 0.2% 88 0.1% 88 Wipro Revolution IT Pty Ltd 0.2% 1,652 0.2% 198 0.8% 270 0.3% 468 Wipro Shelde Australia Pty Ltd 0.0% 62 0.0% 9 0.0% 10 0.0% 19 Wipro Designit Services Limited 0.0% 16 0.0% 5 0.0% 8 0.0% 13 Wipro Designit Services, Inc. 0.0% 25 0.1% 179 (0.0)% (3) 0.1% 176 Topcoder, LLC (0.0)% (17) 0.1% 98 (0.0)% (5) 0.1% 93 Wipro (Dalian) Limited 0.2% 1,498 0.3% 461 0.6% 223 0.4% 684 Wipro (Thailand) Co. Limited 0.0% 376 0.0% 42 0.1% 48 0.1% 90 2025-26 Wipro Arabia Limited 0.5% 4,827 0.8% 1,097 1.2% 424 0.9% 1,521 REPORT Wipro Bahrain Limited Co. W.L.L 0.0% 325 (0.1)% (73) 0.1% 34 (0.0)% (39) Wipro Chengdu Limited 0.2% 1,829 0.5% 683 0.8% 290 0.6% 973 ANNUAL Wipro Do Brasil Sistemas De Informatica 0.0% 242 0.0% 23 0.1% 42 0.0% 65 Ltda Wipro do Brasil Technologia Ltda 0.4% 3,622 (0.2)% (243) 2.1% 749 0.3% 506 INTEGRATED Wipro Doha LLC 0.1% 514 0.1% 142 0.1% 45 0.1% 187 Wipro Financial Outsourcing Services Limited 0.5% 4,158 (0.9)% (1,169) 0.5% 167 (0.6)% (1,002) Wipro Gallagher Solutions, LLC 0.0% 236 0.4% 557 0.1% 21 0.3% 578 WIPRO


LOGO

405 Notes to the Consolidated Financial Statements (I in millions, except share and per share data, unless otherwise stated) Share in Other Share in total Share in Net Asset comprehensive comprehensive 3URÙW_RU_/RVV Name of the entity income income As % of Amount As % of Amount As % of Amount As % of Amount total in I total in I total in I total in I Wipro Gulf LLC 0.0% 142 (0.1)% (102) 0.0% 16 (0.1)% (86) Wipro Holdings (UK) Limited 0.4% 3,868 0.1% 135 1.3% 453 0.4% 588 :LSUR_+ROGLQJV_+XQJDU¥_.RUO£WROW_)HOHOăVV«Jğ_ (2) — 1.6% 2,111 — 1.3% 2,111 Társaság Wipro Information Technology Kazakhstan LLP 0.0% 70 (0.0)% (7) 0.0% 10 0.0% 3 Wipro Information Technology Netherlands BV. 1.2% 10,701 0.2% 263 0.9% 322 0.3% 585 Wipro Insurance Solutions, LLC 0.2% 1,968 0.2% 267 0.6% 199 0.3% 466 Wipro IT Service Ukraine, LLC 0.0% 7 — — —Wipro IT Services Bangladesh Limited (0.1)% (892) (0.2)% (228) (0.2)% (66) (0.2)% (294) Wipro IT Services Poland SP Z.O.O 0.4% 3,205 0.2% 303 1.1% 401 0.4% 704 Wipro IT Services S.R.L. 0.0% 286 0.0% 60 0.1% 33 0.1% 93 Wipro IT Services UK Societas 5.5% 48,677 0.7% 947 (6.0)% (2,103) (0.7)% (1,156) Wipro IT Services, LLC(8) 0.6% 5,648 (16.7)% (22,098) (8.9)% (3,154) (15.1)% (25,252) Wipro Japan KK 0.1% 507 (0.1)% (81) 0.1% 28 (0.0)% (53) Wipro Networks Pte Limited 0.4% 3,099 1.3% 1,723 0.5% 164 1.1% 1,887 Wipro Outsourcing Services (Ireland) Limited 0.0% 20 (0.0)% (5) 0.0% 4 (0.0)% (1) Wipro Philippines, Inc. 2.7% 23,976 3.8% 5,068 2.8% 975 3.6% 6,043 Wipro Portugal S.A. 0.8% 7,447 0.0% 60 0.2% 63 0.1% 123 Wipro Shanghai Limited 0.0% 261 0.0% 56 0.1% 34 0.1% 90 Wipro Solutions Canada Limited 0.3% 2,804 0.6% 796 0.8% 295 0.7% 1,091 Wipro Technologies Australia Pty Ltd 0.3% 2,570 0.0% 27 (0.9)% (312) (0.2)% (285) Wipro Technologies GmbH 0.9% 7,553 1.1% 1,444 0.8% 284 1.0% 1,728 Wipro Technologies Limited 0.0% 27 0.0% 7 0.0% 3 0.0% 10 Wipro Technologies Nigeria Limited (0.0)% (162) 0.0% 6 (0.1)% (31) (0.0)% (25) Wipro Technologies Peru SAC 0.0% 93 (0.0)% (14) 0.0% 14 —Wipro Business Solutions GmbH 0.7% 5,765 0.2% 310 2.6% 927 0.7% 1,237 Wipro Technology Solutions S.R.L 0.1% 631 0.1% 79 0.3% 90 0.1% 169 Wipro Technologies SA 0.0% 39 (0.0)% (10) (0.0)% (8) (0.0)% (18) Wipro Technologies SRL 0.2% 1,681 0.2% 206 0.6% 208 0.2% 414 Wipro Technologies SA DE CV 0.3% 2,231 (0.1)% (117) 1.3% 454 0.2% 337 Wipro Technologies SDN BHD 0.0% 73 0.0% 12 0.0% 12 0.0% 24 Wipro (Tianjin) Limited 0.0% 245 0.0% 1 0.1% 24 0.0% 25 Wipro Technologies South Africa (Proprietary) Limited 0.0% 393 (0.1)% (104) 0.2% 78 (0.0)% (26) Wipro Technologies W.T. Sociedad Anonima 0.0% 414 (0.0)% (11) 0.2% 69 0.0% 58 Wipro Technology Chile SPA 0.0% 405 0.0% 19 0.1% 44 0.0% 63 Wipro UK Limited 0.0% 199 0.0% 23 — 0.0% 23 Wipro, LLC 14.7% 128,972 (4.7)% (6,210) 18.4% 6,501 0.2% 291 Wipro Telecom Consulting LLC 0.0% 339 0.0% 46 0.1% 32 0.0% 78


LOGO

406 STATUTORY REPORTS AND FINANCIAL STATEMENTS CONSOLIDATED FINANCIAL STATEMENT UNDER IND AS Notes to the Consolidated Financial Statements (I in millions, except share and per share data, unless otherwise stated) Share in Other Share in total Share in Net Asset comprehensive comprehensive 3URÙW_RU_/RVV Name of the entity income income As % of Amount As % of Amount As % of Amount As % of Amount total in I total in I total in I total in I Rizing Intermediate Holdings, Inc. 1.4% 12,115 0.0% 1 — 0.0% 1 Rizing Lanka (Private) Ltd 0.2% 1,330 0.0% 9 (0.1)% (25) (0.0)% (16) Attune Netherlands B.V. 0.4% 3,708 0.1% 131 0.9% 329 0.3% 460 Rizing Solutions Canada Inc. 0.0% 230 (0.1)% (104) 0.1% 35 (0.0)% (69) Rizing LLC(7) 0.9% 8,048 1.3% 1,725 0.1% 31 1.0% 1,756 Aasonn Philippines Inc.(2) — — ——-Rizing B.V. 0.0% 179 0.0% 29 0.0% 16 0.0% 45 Rizing Consulting Ireland Limited 0.0% 128 0.0% 15 0.1% 38 0.0% 53 Rizing Consulting Pty Ltd. 0.1% 689 (0.1)% (138) 0.4% 130 (0.0)% (8) Rizing Geospatial LLC 0.0% 121 (0.2)% (283) 0.1% 20 (0.2)% (263) Rizing GmbH 0.0% 124 0.0% 42 0.0% 10 0.0% 52 Rizing Limited (0.1)% (738) (0.7)% (977) (0.1)% (40) (0.6)% (1,017) Rizing Pte Ltd. 0.1% 570 0.1% 76 0.0% 8 0.1% 84 Rizing Consulting USA, LLC(7) 0.1% 589 0.1% 196 0.3% 93 0.2% 289 Rizing Germany GmbH 0.5% 4,055 0.1% 167 1.7% 610 0.5% 777 Attune Italia S.R.L 0.0% 103 0.0% 14 0.0% 15 0.0% 29 Attune UK Ltd. 0.0% 76 (0.0)% (37) 0.0% 11 (0.0)% (26) Rizing New Zealand Ltd. (0.0)% (14) (0.0)% (8) (0.0)% (1) (0.0)% (9) Rizing Philippines Inc. (0.0)% (10) (0.0)% (2) (0.0)% (4) (0.0)% (6) Rizing SDN BHD 0.0% 246 0.0% 36 0.1% 41 0.0% 77 Rizing Solutions Pty Ltd 0.0% 77 0.0% 57 0.0% 8 0.0% 65 Wipro do Brasil Servicos Ltda 0.0% 257 (0.0)% (20) 0.2% 54 0.0% 34 Wipro CRM Services 0.1% 921 (0.2)% (231) 0.1% 44 (0.1)% (187) Wipro CRM Services UK Limited 0.0% 266 0.1% 121 0.1% 24 0.1% 145 Wipro 4C Consulting France SAS 0.0% 73 0.0% 12 (0.0)% (3) 0.0% 9 Wipro CRM Services ApS 0.0% 76 0.0% 4 0.0% 11 0.0% 15 Wipro CRM Services B.V. 0.0% 10 0.0% 9 — 0.0% 9 Wipro VLSI Design Services, LLC 0.0% 68 0.0% 2 0.0% 7 0.0% 9 Women’s Business Park Technologies 0.1% 463 0.4% 481 0.1% 26 0.3% 507 Limited 2025-26 Wipro SA Broad Based Ownership Scheme 0.1% 455 (0.1)% (102) (0.0)% (12) (0.1)% (114) SPV (RF) (PTY) Ltd REPORT The Wipro SA Broad Based Ownership 0.0% 251 0.1% 165 (0.2)% (64) 0.1% 101 6FKHPHb7UXVW ANNUAL Wipro Czech Republic IT Services s.r.o. 0.0% 32 0.0% 12 0.0% 4 0.0% 16 Wipro Regional Headquarter 0.0% 32 0.0% 32 (0.0)% (3) 0.0% 29 INTEGRATED Aggne Global Inc. 0.2% 1,545 0.4% 462 0.4% 137 0.4% 599 Capco Consulting Middle East FZE 0.0% 70 (0.0)% (24) 0.0% 4 (0.0)% (20) Applied Value Technologies B.V. — (0.0)% (20) 0.0% 2 (0.0)% (18) Wipro Connected Services, Inc.(1)(6) (4.0)% (35,213) (0.3)% (461) (9.0)% (3,191) (2.2)% (3,652) WIPRO 


LOGO

407 Notes to the Consolidated Financial Statements (I in millions, except share and per share data, unless otherwise stated) Share in Other Share in total Share in Net Asset comprehensive comprehensive 3URÙW_RU_/RVV Name of the entity income income As % of Amount As % of Amount As % of Amount As % of Amount total in I total in I total in I total in I Wipro Connected Services Mauritius Pvt Ltd(1) 0.4% 3,259 (0.0)% (2) — (0.0)% (2) Wipro Connected Services Engineering Corp.(1) — — — —Wipro Connected Services UK Limited(1) 0.0% 281 0.1% 66 0.0% 10 0.0% 76 Harman Connected Services Solutions (Chengdu) 0.2% 2,044 0.0% 47 0.5% 161 0.1% 208 Co. Ltd.(1) Wipro Connected Services US Midco LLC(1) — — — —Harman Connected Services Morocco(1) — — — —Harman Connected Services AB(1) 1.1% 9,696 0.1% 117 1.7% 597 0.4% 714 Wipro Business Services LLC — — — —Applied Value Technologies Pte. Limited 0.0% 42 0.0% 18 0.0% 4 0.0% 22 Applied Value Technologies, Inc. 0.1% 460 0.1% 95 0.1% 42 0.1% 137 Wipro, Inc. 0.0% 51 — — —Wipro Life Science Solutions, LLC (0.0)% (4) (0.0)% (49) 0.0% 1 (0.0)% (48) Associates Drivestream Inc. 0.2% H 1,716 0.2% H 282 0.0% Hbbbbbbb_ 0.2% H 282 -RLQW_9HQWXUHV SDVerse LLC 0.0% H 410 (0.0)% H (25) 0.0% Hbbbbbbb_ (0.0)% H (25) Trusts Wipro Equity Reward Trust 0.2% H 1,859 0.1% H 157 0.0% Hbbbbbb_ 0.1% H 157 Wipro Foundation 0.0% 8 (0.0)% (3) (0.0)% (1) (0.0)% (4) Non-controlling interest (0.3)% H (2,509) (0.5)% H (680) (0.7)% H (246) (0.6)% H (926) Adjustment arising out of consolidation (14.7)% (129,820) 11.2% 14,813 93.2% 32,871 28.5% 47,684 Grand Total 100% K 880,183 100% K 131,974 100% K 35,276 100% K 167,250 ^ Value is less than I 0.5 (1) These entities are acquired during the year ended March 31, 2026 (2) Liquidated during the year ended March 31, 2026. (3) Wipro HR Services India Private Limited,Wipro Overseas IT Services Private Limited,Wipro Technology Product Services Private Limited,Wipro Trademarks Holding Limited and Wipro VLSI Design Services India Private Limited are merged with Wipro Limited during the year ended March 31, 2026. (4) The Capital Markets Company Limited incorporated in Hong Kong. (5) The Capital Markets Company Limited is incorporated in Canada. (6) Wipro Digital Inc. has been reverse merged with Wipro Connected Services, Inc. during the year ended March 31,2026. (7) Rizing Consulting USA, LLC (Formerly known as Rizing Consulting USA, Inc.) merged with Rizing LLC during the year ended March 31,2026. (8) Cardinal US Holdings, Inc. merged with Wipro IT Services, LLC during the year ended March 31,2026. (9) Cardinal US Holdings, Inc transferred its entire ownership in Capco Consulting Services LLC to The Capital Markets Company, LLC during the year ended March 31,2026. (10) Capco RISC Consulting LLC merged with The Capital Markets Company, LLC during the year ended March 31,2026.


LOGO

408 STATUTORY REPORTS AND FINANCIAL STATEMENTS CONSOLIDATED FINANCIAL STATEMENT UNDER IND AS Notes to the Consolidated Financial Statements (I in millions, except share and per share data, unless otherwise stated) 38. On November 21, 2025, the Government of India notified four labour codes (the “Labour Codes”), effective immediately, replacing the existing 29 labour laws. In accordance with Ind AS 19, employee benefits and changes to employee benefit plans arising from legislative amendments are treated as plan amendments, requiring immediate recognition of past service cost in the Statement of profit and loss. This approach is consistent with the guidance issued by the Institute of Chartered Accountants of India. The Company has concluded the salary restructuring exercise in compliance with the Labour Codes. The implementation of the Labour Codes has resulted in a net increase of I 2,756 in the provision for gratuity and remeasurement of leave encashment, which has been recognised as employee benefit expense in the current year. The Company continues to monitor the finalisation of Central and State Rules, as well as Government clarifications on other aspects of the Labour Codes. 39. EVENTS AFTER THE REPORTING PERIOD a) The Company completed its acquisition of Mindsprint, Olam Group’s IT services arm, a provider of technology and digital transformation services in May 2026 for a total consideration of U.S.$ 375 million. b) On April 14, 2026, the Company signed a definitive agreement to acquire select customer contracts of Alpha Net Consulting, a provider of enterprise software development, data engineering, and managed services for a total consideration (including earnouts) of U.S.$ 70.8 million. The acquisition is subject to customary closing conditions and is expected to be concluded by quarter ending June 30, 2026. c) On April 16, 2026, the Company’s Board of Directors approved a proposal to buyback of equity shares, subject to the approval of shareholders, for purchase by the Company of up to 600,000,000 equity shares of I 2 each (being 5.7% of total number of equity shares) from the shareholders of the Company on a proportionate basis by way of a tender offer at a price of I 250 per equity share for an aggregate amount not exceeding I 150,000, in accordance with the provisions contained in the SEBI (Buy-back of Securities) Regulations, 2018, as amended and the Companies Act, 2013 and rules made thereunder. This proposal was approved by the shareholders of the Company by way of a special resolution dated May 21, 2026, passed through postal ballot by e-voting. d) On June 1, 2026, the Company acquired additional 20% equity interest in Aggne Global Inc. for a consideration of U.S. $ 28.5 million. 7KH_DFFRPSDQ¥LQJ_QRWHV_IRUP_DQ_LQWHJUDO_SDUW_RI_WKHVH_FRQVROLGDWHG_ŮQDQFLDO_VWDWHPHQWV As per our report of even date attached For and on behalf of the Board of Directors for Deloitte Haskins & Sells LLP Rishad A. Premji Deepak M. Satwalekar Srinivas Pallia Chartered Accountants Chairman Director Chief Executive Officer and Firm’s Registration No.: 117366W/W—100018 (DIN: 02983899) (DIN: 00009627) Managing Director (DIN: 10574442) Anand Subramanian Aparna C. Iyer M. Sanaulla Khan REPORT 2025-26 Partner Chief Financial Officer Company Secretary ANNUAL Membership No.: 110815 Membership No.: F4129 INTEGRATED Bengaluru June 2, 2026 WIPRO


LOGO

AOC -1 Information relating to Subsidiaries/Associate Companies/Joint Ventures as at March 31, 2026/January 31, 2026/December 31, 2025 [Pursuant to first proviso to sub -section (3) of Section 129 of the Companies Act, 2013, read with Rule 5 of Companies (Accounts) Rules, 2014] Part A: Subsidiaries [as per Section 2(87) of the Companies Act, 2013] 1. List of Subsidiaries (C in Millions, except % of shareholding and exchange rate) Sl. Name of the Subsidiary CIN/any other registration Date of Start End date of Reporting ([FKDQJH_ Share Reserves Total Total Investments % of Turnover 3URÙW_ Provision 3URÙW_ Proposed No. number of becoming date of accounting Currency rate as on capital and Surplus Assets Liabilities (a) & (b) Shareholding (b) before for after Dividend subsidiary company the accounting period of Mar 31, 2026/ (b) includes other (b) H[FOXGLQJ WD[DWLRQ WD[DWLRQ_ WD[DWLRQ (incl. subsidiary/ period of subsidiary Dec 31, 2025/ comprehensive (8) & (9) (b) (b) (b) dividend acquisition subsidiary Jan 31, 2026 income and (b) WD[___E_ securities premium (b) (1) (2) (3) (4) (5) (6) (7) (8) (9) (10) (11) (12) (13) (14) (15) (16) (17) (18) 1 Wipro, LLC 2917922 07-Jul-98 01-Apr-25 31-Mar-26 USD 94.78 185,564 (41,893) 164,211 20,539 31,907 100% 122,963 (6,309) 361 (6,671)—2 Wipro Gallagher Solutions, LLC L18000079425 01-Jul-08 01-Apr-25 31-Mar-26 USD 94.78 4,678 (4,444) 2,468 2,234—100% 4,944 817 219 598—3 Wipro Insurance Solutions, LLC 5250331 30-Nov-12 01-Apr-25 31-Mar-26 USD 94.78 1,052 916 2,708 739—100% 5,677 343 42 302—4 Wipro IT Services, LLC 5722867 06-Apr-15 01-Apr-25 31-Mar-26 USD 94.78 201,245 (170,788) 107,225 76,769—100% 9,833 (10,288) (300) (9,987)—5 HealthPlan Services, Inc. 406663 29-Feb-16 01-Jan-25 31-Dec-25 USD 89.87 9,526 (3,234) 16,059 9,767—100% 16,221 3,142 955 2,187—6 Wipro Appirio, Inc. 4208882 23-Nov-16 01-Apr-25 31-Mar-26 USD 94.78 * 1,731 2,358 627—100% 1,830 232 42 191—7 Infocrossing, LLC 3046613 20-Sep-07 01-Apr-25 31-Mar-26 USD 94.78 14,444 (12,956) 6,336 4,848—100% 14,891 4,696 1,262 3,434—8 Wipro Designit Services, Inc. 602 942 224 21-Feb-20 01-Apr-25 31-Mar-26 USD 94.78 * 25 1,091 1,066—100% 3,292 294 102 193—9 Wipro VLSI Design Services, LLC 201323510229 24-Feb-21 01-Apr-25 31-Mar-26 USD 94.78 * 72 93 21—100% 99 9 3 5—10 Wipro NextGen Enterprise Inc. 4949087 31-Dec-21 01-Apr-25 31-Mar-26 USD 94.78 237 287 873 350—100% 1,744 172 51 120—11 Edgile, LLC 3483366 31-Dec-21 01-Apr-25 31-Mar-26 USD 94.78 * 508 740 232—100% 2,472 (134) (11) (123)—12 Wipro Telecom Consulting LLC 06103579 11-Apr-22 01-Apr-25 31-Mar-26 USD 94.78 152 187 448 109—100% 1,537 70 21 50—13 Wipro Holdings (UK) Limited 04611828 09-Dec-02 01-Apr-25 31-Mar-26 GBP 125.43 19,111 (15,231) 4,019 139—100% 502 155 11 144—14 Designit A/S 35398910 06-Aug-15 01-Apr-25 31-Mar-26 DKK 14.57 146 274 723 303—100% * 24 * 25—15 Designit Denmark A/S 14650091 06-Aug-15 01-Apr-25 31-Mar-26 DKK 14.57 18 278 383 88—100% 629 35 5 30—16 Designit Germany GmbH 171246 06-Aug-15 01-Apr-25 31-Mar-26 EUR 108.87 3 (505) 148 650—100% 290 14 * 14—17 Designit Oslo AS 990 679 614 06-Aug-15 01-Apr-25 31-Mar-26 NOK 9.71 35 17 82 30—100% 248 22 * 22—18 Designit T.L.V Ltd. 513660654 06-Aug-15 01-Apr-25 31-Mar-26 ILS 29.99 * 116 169 53—100% 334 11 * 11—19 Designit Spain Digital, S.L.U B86084233 06-Aug-15 01-Apr-25 31-Mar-26 EUR 108.87 * 75 138 63—100% 373 18 * 18—20 Wipro Financial Outsourcing 02422306 01-Jun-11 01-Apr-25 31-Mar-26 GBP 125.43 5,491 (1,267) 9,122 4,897—100% 9,653 (1,670) (413) (1,257)—6HUYLFHVb/LPLWHG 21 Wipro UK Limited 01396396 01-Jun-11 01-Apr-25 31-Mar-26 GBP 125.43 89 111 199 *—100% * * * *—22 Wipro IT Services S.R.L. 40088240 01-Nov-18 01-Apr-25 31-Mar-26 RON 21.35 * 285 360 74—100% 420 72 9 63—23 Wipro IT Services UK Societas SE000134 29-Feb-16 01-Apr-25 31-Mar-26 USD 94.78 13 64,169 96,278 32,096 9,892 100% 6,794 (371) (355) (16)—24 Wipro Technologies SA DE CV N-2020043923 13-Jun-07 01-Jan-25 31-Dec-25 MXN 5.00 * 2,243 4,184 1,940—100% 7,553 (839) 18 (857)—25 Wipro IT Services Poland Sp. z o.o. 0000416942 06-Apr-12 01-Apr-25 31-Mar-26 PLN 25.38 * 3,205 4,668 1,463—100% 4,964 399 80 319—26 Wipro IT Services Ukraine, LLC 39426332 06-Oct-14 01-Apr-25 31-Mar-26 UAH 2.16 4 3 7 *—100% * * * *—27 Wipro Information Technology 34167218 30-Jun-06 01-Apr-25 31-Mar-26 EUR 108.87 9,772 4,617 15,098 708—100% 192 (412) (172) (240) -Netherlands B.V. 28 Wipro Portugal S.A. 503961175 30-Jun-06 01-Apr-25 31-Mar-26 EUR 108.87 4,818 3,681 8,767 269—100% 1,397 1,414 11 1,403—409


LOGO

WIPRO INTEGRATED ANNUAL REPORT 2025 -26 410 (C in Millions, except % of shareholding and exchange rate) Sl. Name of the Subsidiary CIN/any other registration Date of Start End date of Reporting ([FKDQJH_ Share Reserves Total Total Investments % of Turnover 3URÙW_ Provision 3URÙW_ Proposed No. number of becoming date of accounting Currency rate as on capital and Surplus Assets Liabilities (a) & (b) Shareholding (b) before for after Dividend subsidiary company the accounting period of Mar 31, 2026/ (b) includes other (b) H[FOXGLQJ WD[DWLRQ WD[DWLRQ_ WD[DWLRQ (incl. subsidiary/ period of subsidiary Dec 31, 2025/ comprehensive (8) & (9) (b) (b) (b) dividend acquisition subsidiary Jan 31, 2026 income and (b) WD[___E_ securities STATUTORY premium (b) 29 Wipro Technologies Limited 1087746189926 08-Feb-08 01-Apr-25 31-Mar-26 RUB 1.17 12 15 28 1—100% (3) 6 (3) 9—30 Wipro Technology Chile SPA 115784 19-Dec-11 01-Apr-25 31-Mar-26 CLP 0.10 290 116 466 60—100% 101 31 10 21—REPORTS 31 Wipro Solutions Canada Limited 1938438 16-Aug-14 01-Apr-25 31-Mar-26 CAD 68.09 2,179 625 5,799 2,995—100% 9,390 1,144 295 849— 32 Wipro Technologies W.T. Sociedad 3-101-620693 15-Oct-10 01-Apr-25 31-Mar-26 CRC 0.20 * 414 492 78—100% 924 (13) * (13)—AND Anonima 33 Wipro Outsourcing Services (Ireland) 513129 14-May-12 01-Apr-25 31-Mar-26 EUR 108.87 * 20 22 1—100% * 4 * 3 -Limited 34 Wipro Technologies Peru SAC 12339816 15-Aug-12 01-Apr-25 31-Mar-26 PEN 27.16 51 42 113 20—100% 56 (9) 6 (15)—35 Wipro do Brasil Technologia Ltda 41204577652 29-May-01 01-Jan-25 31-Dec-25 BRL 16.41 3,046 * 4,633 1,587—100% 8,513 179 (32) 211—FINANCIAL 36 Wipro Technologies SA 1799686 22-Apr-08 01-Jan-25 31-Dec-25 ARS 0.06 2 170 415 243—100% 130 (52) 23 (75)—37 Wipro Technologies SRL 18944060 17-Aug-06 01-Apr-25 31-Mar-26 RON 21.35 230 1,450 2,774 1,094—100% 5,784 262 44 218—38 Wipro Technologies SDN. BHD. 505909 -H 16-Nov-06 01-Apr-25 31-Mar-26 MYR 23.49 2 70 128 55—100% 231 18 5 13—39 Wipro Technologies GmbH 108590 30-Jun-06 01-Apr-25 31-Mar-26 EUR 108.87 9,203 (152) 15,253 6,202—100% 16,543 1,809 269 1,540—40 Wipro IT Services Austria GmbH 208229 w 15-Jun-16 01-Apr-25 31-Mar-26 EUR 108.87 8 258 542 276—100% 1,149 66 15 52—STATEMENTS 41 Wipro Business Solutions GmbH 18232 01-Apr-21 01-Apr-25 31-Mar-26 EUR 108.87 67 5,705 6,380 608—100% 4,033 424 93 330—42 Wipro Do Brasil Sistemas De Informatica 35228602938 22-Aug-14 01-Jan-25 31-Dec-25 BRL 16.41 204 5 327 118—100% 67 5 * 5 -Ltda. 43 Wipro do Brasil Servicos Ltda 2320069402 -1 14-Aug-20 01-Jan-25 31-Dec-25 BRL 16.41 202 31 238 4—100% 68 (49) * (49)—44 HealthPlan Services Insurance L18000079235 29-Feb-16 01-Jan-25 31-Dec-25 USD 89.87 * 1,059 1,289 230—100% 1,359 (95) (36) (59) -Agency, LLC 45 Topcoder, LLC 3275809 23-Nov-16 01-Apr-25 31-Mar-26 USD 94.78 2,218 (2,236) 170 187—100% 1,719 146 33 113—46 Wipro Appirio (Ireland) Limited 403374 23-Nov-16 01-Apr-25 31-Mar-26 EUR 108.87 535 199 736 2—100% 7 (8) (1) (7)—CONSOLIDATED 47 Wipro Appirio UK Limited 06767474 23-Nov-16 01-Apr-25 31-Mar-26 GBP 125.43 690 (626) 84 20—100% 75 5 * 5— 48 Wipro Designit Services Limited 587457 21-Feb-20 01-Apr-25 31-Mar-26 EUR 108.87 * 19 27 9—100% 71 5 * 5—49 LeanSwift AB 556815 -7316 31-Dec-21 01-Jan-25 31-Dec-25 SEK 9.78 150 (147) 7 4—100% * (3) * (3)—50 Wipro Technology Solutions S.R.L 17056464 01-Apr-21 01-Apr-25 31-Mar-26 RON 21.35 26 605 902 271—100% 1,562 93 9 84—FINANCIAL 51 Wipro Ampion Holdings Pty Ltd 626522852 06-Aug-21 01-Apr-25 31-Mar-26 AUD 65.01 4,045 (465) 4,249 668—100% 3,370 330 99 231— 52 Wipro Revolution IT Pty Ltd 107 913 342 06-Aug-21 01-Apr-25 31-Mar-26 AUD 65.01 * * * *—100% * * * *—53 Wipro Shelde Australia Pty Ltd 147 342 621 06-Aug-21 01-Apr-25 31-Mar-26 AUD 65.01 * * * *—100% * * * *—54 Wipro CRM Services NV (Formerly 0460.598.857 10-Aug-20 01-Apr-25 31-Mar-26 EUR 108.87 3,407 (2,336) 1,114 42—100% 218 (75) 2 (77) -known as Wipro 4C NV) STATEMENT 55 Wipro CRM Services ApS 32 56 18 53 10-Aug-20 01-Apr-25 31-Mar-26 DKK 14.57 177 (107) 79 9—100% 73 4 6 (2)— 56 Wipro 4C Consulting France S.A.S ___b___b___ 10-Aug-20 01-Feb-25 31-Jan-26 EUR 109.78 820 (709) 135 25—100% 71 4 * 4—57 Rainbow Software LLC 000000309 -02 10-Jan-16 01-Apr-25 31-Mar-26 IQD 0.07 * * * *—100% * * * *—UNDER 58 MechWorks S.R.L. 01858241209 03-Oct-19 01-Apr-25 31-Mar-26 EUR 108.87 1 223 375 151—100% 335 171 44 126 -IND 59 Wipro Information Technology Kazakhstan LLP 120940014046 27-Sep-06 01-Apr-25 31-Mar-26 KZT 0.20 102 (32) 86 16—100% 1 (9) * (9) -AS


LOGO

(C in Millions, except % of shareholding and exchange rate) Sl. Name of the Subsidiary CIN/any other registration Date of Start End date of Reporting ([FKDQJH_ Share Reserves Total Total Investments % of Turnover 3URÙW_ Provision 3URÙW_ Proposed No. number of becoming date of accounting Currency rate as on capital and Surplus Assets Liabilities (a) & (b) Shareholding (b) before for after Dividend subsidiary company the accounting period of Mar 31, 2026/ (b) includes other (b) H[FOXGLQJ WD[DWLRQ WD[DWLRQ_ WD[DWLRQ (incl. subsidiary/ period of subsidiary Dec 31, 2025/ comprehensive (8) & (9) (b) (b) (b) dividend acquisition subsidiary Jan 31, 2026 income and (b) WD[___E_ securities premium (b) 60 Wipro CRM Services B.V. (Formerly 75010135 10-Aug-20 01-Apr-25 31-Mar-26 EUR 108.87 2 8 11 1—100% 14 9 * 9 -known as Wipro 4C NEDERLAND B.V.) 61 Wipro Doha LLC 64483 26-Feb-14 01-Apr-25 31-Mar-26 QAR 25.99 5 510 699 184—100% 903 167 15 151—62 Wipro SA Broad Based Ownership 201400986907 17-Jan-14 01-Apr-25 31-Mar-26 ZAR 5.52 760 (313) 447 *—100% * (32) * (32) -Scheme SPV (RF) (PTY) LTD 63 International TechneGroup Limited 01364362 03-Oct-19 01-Apr-25 31-Mar-26 GBP 125.43 * 70 176 106—100% 321 69 14 55—64 Wipro CRM Services UK Limited 08010708 10-Aug-20 01-Apr-25 31-Mar-26 GBP 125.43 607 (328) 351 72—100% 359 165 37 128—65 International TechneGroup Incorporated 618078 03-Oct-19 01-Apr-25 31-Mar-26 USD 94.78 25 1,242 1,844 577—100% 2,185 936 128 808—66 Wipro Technologies Australia Pty Ltd 003 785 617 30-Apr-12 01-Apr-25 31-Mar-26 AUD 65.01 10,544 (7,582) 5,222 2,260—100% 1,210 40 (12) 52—67 Wipro Bahrain Limited Co. W.L.L 73168 28-Oct-09 01-Apr-25 31-Mar-26 BHD 250.26 106 317 470 47—100% 231 18 * 18—68 Wipro IT Services Bangladesh Limited C-142404/2018 09-Jan-18 01-Apr-25 31-Mar-26 BDT 0.77 327 (1,224) 1,493 2,390—100% 101 (31) 166 (197)—69 Wipro (Dalian) Limited 91210200MA0QCU0E25 25-Dec-15 01-Jan-25 31-Dec-25 RMB 12.86 679 636 1,717 403—100% 2,904 570 89 482—70 Wipro Chengdu Limited 91510100679680363N 21-Oct-08 01-Jan-25 31-Dec-25 RMB 12.86 490 994 2,837 1,353—100% 3,822 896 147 749—71 Wipro Shanghai Limited 91310000761626497X 27-Apr-04 01-Jan-25 31-Dec-25 RMB 12.86 139 78 266 50—100% 178 31 2 29—72 PT. WT Indonesia 9120108362283 24-Jul-09 01-Apr-25 31-Mar-26 IDR 0.01 75 184 298 39—100% 145 4 (64) 68—73 ,7,_3URŮFLHQF¥_/WG 514289040 03-Oct-19 01-Apr-25 31-Mar-26 ILS 29.99 336 (272) 84 20—100% 126 8 * 8—74 Wipro Japan KK 0200-01-041271 01-May-98 01-Apr-25 31-Mar-26 JPY 0.59 256 398 2,089 1,435—100% 3,914 (65) (22) (43)—75 :LSURb7HFKQRORJLHVb1LJHULDb/LPLWHG 1058534 15-Aug-12 01-Apr-25 31-Mar-26 NGN 0.07 7 (170) 179 342—100% * 12 * 12—76 Wipro Philippines, Inc. CS200716308 16-Oct-07 01-Apr-25 31-Mar-26 PHP 1.56 295 23,681 28,351 4,375 17,433 100% 13,082 4,706 421 4,284—77 Wipro Arabia Limited 2051034646 19-Jun-07 01-Jan-25 31-Dec-25 SAR 23.96 719 3,242 9,089 5,127—67% 11,642 1,540 236 1,304—78 Women’s Business Park Technologies 1010612575 26-Oct-17 01-Apr-25 31-Mar-26 SAR 25.25 95 368 1,629 1,166—67% 1,484 519 3 516 -Limited 79 Wipro Networks Pte. Limited 199907933M 15-Dec-99 01-Apr-25 31-Mar-26 USD 94.78 2,120 1,342 3,855 392—100% 2,264 1,970 119 1,850—80 Wipro Technologies South Africa 201001682907 02-Nov-10 01-Apr-25 31-Mar-26 ZAR 5.52 29 524 908 355—100% 1,419 72 16 56 -(Proprietary) Limited 81 Wipro Gulf LLC 1092545 01-Jun-11 01-Apr-25 31-Mar-26 OMR 246.14 226 (92) 145 11—100% (100) (141) (34) (107)—82 Wipro (Thailand) Co. Limited 0105551123447 30-Jul-07 01-Apr-25 31-Mar-26 THB 2.88 297 61 411 53—100% 208 41 10 31—83 The Capital Markets Company Limited 791703 29-Apr-21 01-Jan-25 31-Dec-25 HKD 11.55 1,529 (1,701) 1,064 1,237—100% 1,591 (385) * (385)—84 Capco Consultancy (Thailand) Limited 0105560170762 29-Apr-21 01-Jan-25 31-Dec-25 THB 2.84 390 140 819 290—100% 726 11 3 8—85 The Capital Markets Company BV 0463.785.605 29-Apr-21 01-Apr-25 31-Mar-26 EUR 108.87 220 7,524 9,237 1,494—100% 881 11 39 (28)—86 Capco Belgium BV 0899.013.618 29-Apr-21 01-Apr-25 31-Mar-26 EUR 108.87 5 134 141 2—100% * 2 * 2—87 The Capital Markets Company Limited 1548851 29-Apr-21 01-Apr-25 31-Mar-26 CAD 68.09 * 3,550 4,771 1,221—100% 5,548 471 139 332—88 The Capital Markets Company Sàrl CHE114.474.238 29-Apr-21 01-Jan-25 31-Dec-25 CHF 113.36 2 455 1,381 924—100% 2,404 108 * 107—89 Andrion ag CHE-105.459.487 29-Apr-21 01-Apr-25 31-Mar-26 CHF 118.54 18 130 251 103—100% 160 20 * 20—90 The Capital Markets Company S.A.S 423 059 609 29-Apr-21 01-Jan-25 31-Dec-25 EUR 105.56 4 69 1,086 1,013—100% 2,926 (365) * (365)—91 Capco Poland sp. z o.o. 0000689511 29-Apr-21 01-Jan-25 31-Dec-25 PLN 25.01 * 485 738 252—100% 1,751 227 47 180—92 Capafric Consulting Proprietary Limited 201100405207 29-Apr-21 01-Jan-25 31-Dec-25 ZAR 5.42 * 3 4 *—100% * (1) * (1)—93 The Capital Markets Company GmbH 48367 29-Apr-21 01-Jan-25 31-Dec-25 EUR 105.56 3 (3) 1,150 1,150—100% 3,151 (412) * (412)—94 Capco Austria GmbH 477979 k 29-Apr-21 01-Apr-25 31-Mar-26 EUR 108.87 58 * 121 64—100% 167 (31) * (31)—411


LOGO

WIPRO INTEGRATED ANNUAL REPORT 2025 -26 412 (C in Millions, except % of shareholding and exchange rate) Sl. Name of the Subsidiary CIN/any other registration Date of Start End date of Reporting ([FKDQJH_ Share Reserves Total Total Investments % of Turnover 3URÙW_ Provision 3URÙW_ Proposed No. number of becoming date of accounting Currency rate as on capital and Surplus Assets Liabilities (a) & (b) Shareholding (b) before for after Dividend subsidiary company the accounting period of Mar 31, 2026/ (b) includes other (b) H[FOXGLQJ WD[DWLRQ WD[DWLRQ_ WD[DWLRQ (incl. subsidiary/ period of subsidiary Dec 31, 2025/ comprehensive (8) & (9) (b) (b) (b) dividend acquisition subsidiary Jan 31, 2026 income and (b) WD[___E_ securities STATUTORY premium (b) 95 The Capital Markets Company 46 620362 29-Apr-21 01-Jan-25 31-Dec-25 EUR 105.56 * 191 395 204—100% 883 42 18 24—Slovakia s.r.o. REPORTS 96 Capco Greece Single Member P.C 158079501000 29-Apr-21 01-Apr-25 31-Mar-26 EUR 108.87 499 258 808 51—100% 719 58 13 46— 97 Capco Brasil Serviços E Consultoria Ltda (Formerly known as Capco Brasil AND 35219906717 29-Apr-21 01-Apr-25 31-Mar-26 BRL 18.09 1,151 106 3,348 2,092—100% 8,161 561 138 423—Serviços E Consultoria Em Informática Ltda) 98 The Capital Markets Company, LLC 2957049 29-Apr-21 01-Apr-25 31-Mar-26 USD 94.78 16,569 (8,213) 13,794 5,438—100% 23,808 (106) (129) 22—99 Capco Consulting Services LLC 3461214 29-Apr-21 01-Apr-25 31-Mar-26 USD 94.78 * 3,866 6,277 2,411—100% 8,413 2,051 457 1,594—100 The Capital Markets Company (UK) FINANCIAL 03638404 29-Apr-21 01-Apr-25 31-Mar-26 GBP 125.43 1,856 450 8,724 6,418—100% 24,156 (339) (73) (266) -Limited 101 Grove Holdings 2 S.à.r.l. B120674 29-Apr-21 01-Apr-25 31-Mar-26 USD 94.78 6,879 128 7,034 27—100% * 2,486 8 2,477 -102 Capco Consulting Singapore Pte. Ltd. 201218966M 29-Apr-21 01-Jan-25 31-Dec-25 SGD 69.90 1,028 (956) 943 871—100% 1,725 63 * 63 -103 Capco Consultancy (Malaysia) SDN. 1236354 -T 29-Apr-21 01-Jan-25 31-Dec-25 MYR 22.13 487 (411) 252 176—100% 513 (14) * (14)—BHD. STATEMENTS 104 Rizing Intermediate Holdings Inc. 7015679 20-May-22 01-Apr-25 31-Mar-26 USD 94.78 22,304 (8,666) 13,638 *—100% * * * * -105 Rizing LLC 7775086 20-May-22 01-Apr-25 31-Mar-26 USD 94.78 31,432 (27,996) 5,081 1,645—100% 8,328 51 53 (1) -106 Rizing Solutions Canada Inc. BC1404166 20-May-22 01-Apr-25 31-Mar-26 CAD 68.09 322 (92) 1,128 898—100% 2,784 (58) 53 (111) -107 Rizing GmbH 733189 20-May-22 01-Apr-25 31-Mar-26 EUR 108.87 104 20 169 45—100% 179 42 (3) 45 -108 Rizing Limited 09376752 20-May-22 01-Apr-25 31-Mar-26 GBP 125.43 * (738) 1,529 2,267—100% 1,141 (1,327) (343) (984) -109 Rizing Consulting Ireland Limited 482758 20-May-22 01-Apr-25 31-Mar-26 EUR 108.87 * 346 534 188—100% 250 16 * 16 -110 Rizing Consulting Pty Ltd 154 216 145 20-May-22 01-Apr-25 31-Mar-26 AUD 65.01 13 665 1,140 462—100% 1,588 (130) (42) (88)—111 Rizing SDN. BHD. 1142727 -A 20-May-22 01-Apr-25 31-Mar-26 MYR 23.49 564 (318) 385 139—100% 523 40 * 40—CONSOLIDATED 112 Rizing Pte. Ltd. 201527818H 20-May-22 01-Apr-25 31-Mar-26 SGD 73.47 4,360 (3,799) 696 135—100% 307 82 * 82—113 Rizing Philippines Inc. CS201511871 20-May-22 01-Apr-25 31-Mar-26 PHP 1.56 35 (46) 345 356—100% 558 (2) * (3) -114 Attune Consulting India Private Limited U72200KA2004PTC034093 20-May-22 01-Apr-25 31-Mar-26 INR 1.00 * 77 78 *—100% 25 16 5 11 -115 Rizing Geospatial LLC L10000124484 20-May-22 01-Apr-25 31-Mar-26 USD 94.78 1,488 (1,367) 690 569—100% 522 (419) (115) (304)—FINANCIAL 116 Rizing Lanka (Pvt) Ltd PV11932 20-May-22 01-Apr-25 31-Mar-26 USD 94.78 1,706 (188) 2,336 817—100% 1,636 12 (29) 40—117 Attune Netherlands B.V. 60366397 20-May-22 01-Apr-25 31-Mar-26 USD 94.78 * 3,777 3,778 2—100% * 141 * 141 -118 Rizing Germany GmbH (Formerly known 159991 20-May-22 01-Apr-25 31-Mar-26 EUR 108.87 3 3,893 4,462 567—100% 2,722 213 143 70 -as Attune Germany Gmbh) 119 Attune UK Ltd 05655020 20-May-22 01-Apr-25 31-Mar-26 GBP 125.43 * 76 292 217—100% 757 73 11 62—STATEMENT 120 Rizing Solutions Pty Ltd 606 750 118 20-May-22 01-Apr-25 31-Mar-26 AUD 65.01 1,449 (1,372) 319 242—100% 764 121 57 63—121 Rizing New Zealand Ltd 5850047 20-May-22 01-Apr-25 31-Mar-26 NZD 54.23 106 (120) 13 28—100% 47 (8) * (8) -122 Attune Italia S.r.l. 03600760239 20-May-22 01-Apr-25 31-Mar-26 EUR 108.87 1 102 243 140—100% 240 18 4 15—UNDER 123 Wipro Travel Services Limited U91200KA1996PLC020622 10-Jun-96 01-Apr-25 31-Mar-26 INR 1.00 * 180 467 286—100% 79 40 10 30—IND 124 Capco Technologies Private Limited U72200KA2008PTC046855 29-Apr-21 01-Apr-25 31-Mar-26 INR 1.00 * 2,672 3,485 813 572 100% 6,417 1,022 260 762 -AS 125 Rizing B.V. 30212957 20-May-22 01-Apr-25 31-Mar-26 EUR 108.87 400 (221) 430 251—100% 362 35 5 31—


LOGO

(C in Millions, except % of shareholding and exchange rate) Sl. Name of the Subsidiary CIN/any other registration Date of Start End date of Reporting ([FKDQJH_ Share Reserves Total Total Investments % of Turnover 3URÙW_ Provision 3URÙW_ Proposed No. number of becoming date of accounting Currency rate as on capital and Surplus Assets Liabilities (a) & (b) Shareholding (b) before for after Dividend subsidiary company the accounting period of Mar 31, 2026/ (b) includes other (b) H[FOXGLQJ WD[DWLRQ WD[DWLRQ_ WD[DWLRQ (incl. subsidiary/ period of subsidiary Dec 31, 2025/ comprehensive (8) & (9) (b) (b) (b) dividend acquisition subsidiary Jan 31, 2026 income and (b) WD[___E_ securities premium (b) 126 Capco Solution Services GmbH 43889 08-Dec-22 01-Apr-25 31-Mar-26 EUR 108.87 3 84 87 *—100% * 8 9 (1) -127 The Capital Markets Company Italy SRL 2688087 09-Mar-23 01-Apr-25 31-Mar-26 EUR 108.87 5 93 320 221—100% 625 31 * 31 -128 Wipro Czech Republic IT Services s.r.o. 197 87 448 04-Oct-23 01-Apr-25 31-Mar-26 CZK 4.43 5 27 49 17—100% 62 15 3 12 -129 Wipro Regional Headquarters 2051252011 26-Nov-23 01-Jan-25 31-Dec-25 SAR 23.96 * 18 90 72—100% 446 21 * 21 -130 Aggne Global Inc. P19000068988 13-Feb-24 01-Apr-25 31-Mar-26 USD 94.78 * 1,545 2,223 678—60% 1,813 625 129 496 -131 Aggne Global IT Services Private Limited U72900TG2020PTC145507 13-Feb-24 01-Apr-25 31-Mar-26 INR 1.00 * 233 548 314—60% 792 111 25 87 -132 Wipro, Inc. 5320850 30-Sep-24 01-Apr-25 31-Mar-26 USD 94.78 * 56 57 *—100% * * * * -133 Wipro Life Science Solutions, LLC 5486856 10-Oct-24 01-Apr-25 31-Mar-26 USD 94.78 54 (58) 52 56—100% 7 (74) (21) (53) -134 Applied Value Technologies, Inc. 6308945 16-Dec-24 01-Apr-25 31-Mar-26 USD 94.78 * 462 739 276—100% 1,759 149 31 118 -135 Applied Value Technologies B.V. 87625784 16-Dec-24 01-Apr-25 31-Mar-26 EUR 108.87 * 31 41 11—100% 147 11 2 9 -136 Capco Consulting Middle East FZE 3366 17-Dec-24 01-Apr-25 31-Mar-26 AED 25.80 96 (25) 90 20—100% * (22) * (22) -137 Applied Value Technologies Pte. Ltd. 202143169D 03-Jan-25 01-Jan-25 31-Dec-25 SGD 69.90 * 39 69 30—100% 321 25 3 22 -138 Harman Connected Services Morocco (c) 257567 01-Dec-25 01-Apr-25 31-Mar-26 MAD 10.09 * * 1 2—100% * * * * -139 Wipro Connected Services Mauritius Pvt Ltd (Formerly known as Harman C16039723 01-Dec-25 01-Jan-25 31-Dec-25 USD 89.87 * 185 186 1—100% * 5,327 1,164 4,163 -Connected Services Mauritius Pvt Ltd)(c) 140 Wipro Connected Services Engineering Corp. (Formerly known as Harman 3854172 01-Dec-25 01-Apr-25 31-Mar-26 USD 94.78 * * * *—100% * * * * -Connected Services Engineering Corp.)(c) 141 Harman Connected Services AB(c) 556250 -3515 01-Dec-25 01-Apr-25 31-Mar-26 USD 94.78 1,529 9,067 12,611 2,015—100% * 126 * 126 -142 Wipro Connected Services UK Limited (Formerly known as Harman Connected 60710974 01-Dec-25 01-Apr-25 31-Mar-26 GBP 125.43 * 164 845 681—100% 3,019 240 64 175 -Services UK Limited) (c) 143 Connected Services Corporation Wipro India Private Limited (Formerly U72200KA2002PTC030427 01-Dec-25 01-Apr-25 31-Mar-26 INR 1.00 2 8,740 13,669 4,927 2,554 100% 15,317 1,393 480 912 -known as Harman Connected Services Corporation India Pvt. Ltd.)(c) 144 Harman Connected Services Solutions (c) 915101006630262523 01-Dec-25 01-Jan-25 31-Dec-25 CNY 12.86 107 1,826 2,544 611—100% 2,102 1,874 455 1,418 -(Chengdu) Co. Ltd. 145 Wipro Connected Services, Inc. (Formerly known as Harman Connected Services, 3489342 01-Dec-25 01-Apr-25 31-Mar-26 USD 94.78 2,612 (37,029) 22,646 57,063—100% 8,319 (689) (194) (495) -Inc.) (c) 146 Wipro Connected Services US Midco LLC (Formerly known as Harman Connected 10299117 01-Dec-25 01-Apr-25 31-Mar-26 USD 94.78 * * * *—100% * * * * -Services US Midco LLC) (c) 147 Wipro (Tianjin) Limited (d) 91120116MAEKWKWN1K 23-May-25 01-Apr-25 31-Mar-26 CNY 13.71 244 2 355 109—100% 90 2 * 2 -148 Wipro Business Services LLC (d) 10477684 20-Jan-26 01-Apr-25 31-Mar-26 USD 94.78 * * * *—100% * * * *—a) Investments excludes investments in subsidiaries and associates. b) Indian rupee equivalents of the figures in foreign currencies of the accounts of the subsidiary entities are based on the exchange rates as of the respective reporting period end dates. c) In December 2025, the Company, through its subsidiaries, acquired 100% shareholding in Wipro Connected Services, Inc. (formerly Harman Connected Services, Inc.), together with its subsidiaries as disclosed in Sl. Nos. 138 to 146. d) During the financial year 2025 -26, two subsidiaries of your Company i.e., Wipro (Tianjin) Limited and Wipro Business Services LLC were incorporated. * Value is less than One Million Rupees. 413


LOGO

WIPRO INTEGRATED ANNUAL REPORT 2025-26 414 2. List of Subsidiaries which are yet to commence operations Sl. CIN/any other registration number _1DPHV_RI_VXEVLGLDULHV_ZKLFK_DUH_¥HW_WR_FRPPHQFH_RSHUDWLRQV_ No. STATUTORY 1 10477684 Wipro Business Services LLC 3. List of Subsidiaries which have been liquidated or have ceased to be a Subsidiary during the year REPORTS Sl. CIN/any other registration number Names of subsidiaries AND No. 1 01-09-885951 :LSUR_+ROGLQJV_+XQJDU¥_ .RUO£WROW_)HOHOãVV«Jğ_7 £UVDV£J(1) 2 CS201115785 Aasonn Philippines Inc.(1) FINANCIAL 3 U74999KA2016PTC129059 Wipro HR Services India Private Limited (2) 4 U72200KA2015PTC080266 Wipro Overseas IT Services Private Limited (2) 5 U72200KA2006PTC161048 Wipro Technology Product Services Private Limited (2) 6 U93090KA1982PLC021795 Wipro Trademarks Holding Limited (2) STATEMENTS 7 U72200KA2014PTC161115 Wipro VLSI Design Services India Private Limited (2) 8 10283202 Wipro Digital Inc.(2) 9 10155269 Rizing Consulting USA, LLC(2) 10 6365669 Capco RISC Consulting LLC(2) 11 6419128 Cardinal US Holdings, Inc.(2) CONSOLIDATED (1) During the financial year 2025-26, two subsidiaries of your Company i.e. Wipro Holdings Hungary Korlátolt Felelõsségû Társaság and Aasonn Philippines Inc. were de-registered. (2) During the financial year 2025-26, following subsidiaries of your Company merged: • The Hon’ble National Company Law Tribunal, Bengaluru bench vide its order dated June 6, 2025, approved the scheme of amalgamation for the merger of wholly owned subsidiaries Wipro FINANCIAL HR Services India Private Limited, Wipro Overseas IT Services Private Limited, Wipro Technology Product Services Private Limited, Wipro Trademarks Holding Limited and Wipro VLSI Design Services India Private Limited with Wipro Limited. As per the said scheme, the appointed date is April 1, 2025. • Wipro Digital Inc. was incorporated effective August 4, 2025 and merged with Wipro Connected Services, Inc. (Formerly known as Harman Connected Services, Inc.) effective December 1, 2025. • Rizing Consulting USA, LLC merged with Rizing LLC effective March 31, 2026. STATEMENT • Capco RISC Consulting LLC merged with The Capital Markets Company, LLC effective March 30, 2026. • Cardinal US Holdings, Inc. merged with Wipro IT Services, LLC effective March 31, 2026. UNDER IND AS 


LOGO

Part—B: Associates and Joint Ventures ___ /LVW_RI_ $VVRFLDWHV_DQG_ -RLQW_9HQWXUHV Name of the Latest Date on which Shares of Associate/Joint Ventures Description Reason why the Networth 3URŮW_RU_/RVV_IRU_WKH_¥HDU associates/Joint audited the Associate held by the Company on the year end of how there associate/joint attributable to Ventures Balance or Joint LV_VLJQLÙFDQW_ venture is not shareholding No. of shares Amount of Extent of Considered Not Considered in Sheet date Venture was LQùXHQFH consolidated as per latest held by the investment in Holding (in in Consolidation Consolidation associated or audited Company in Associates percentage) acquired Balance Sheet Associate on the year end Drivestream Inc. 31-Dec-24 12-Jun-17 94,527 Series A USD 13,480,032 43.75 Extent of equity Not Applicable USD 830,357 USD 3,196,579 USD 4,109,888 Preferred Stock holding in 27,865 common the associate stock 190,525 company Series B exceeds 20%. Preferred stock 400 Series C Preferred stock SDVerse LLC 31-Dec-25 05-Mar-24 5,850,000 USD 5,850,000 27.00 Extent of equity Not Applicable USD 1,645,471 (USD 286,467) (USD 774,521) Class A Units holding in the joint venture company exceeds 20%. 5. List of associates or joint ventures which are yet to commence operations—Not Applicable 6. List of associates or joint ventures which have been liquidated or have ceased to be associate or joint venture during the year- Not Applicable Rishad A. Premji Deepak M. Satwalekar Chairman Director (DIN: 02983899) (DIN: 00009627) Srinivas Pallia Aparna Iyer M. Sanaulla Khan Chief Executive Officer and Managing Director Chief Financial Officer Company Secretary (DIN: 10574442) 415


LOGO

416 STATUTORY REPORTS AND FINANCIAL STATEMENTS CONSOLIDATED FINANCIAL STATEMENTS UNDER IFRS To the Shareholders and the Board of Directors of Wipro Limited OPINION ON THE FINANCIAL STATEMENTS We have audited the accompanying consolidated statements of financial position of Wipro Limited and subsidiaries (the “Company”) as of March 31, 2026 and 2025, the related consolidated statements of income, comprehensive income, changes in equity, and cash flows, for each of the three years in the period ended March 31, Public 2026, and the related notes (collectively referred to as the “financial statements”). In our opinion, the financial statements present fairly, in all material respects, the financial position of the Company as of March 31, 2026 and 2025, and the results of its operations and its cash flows for each of the three years in the period ended March 31, 2026, in conformity with IFRS Accounting Standards as issued by the International Accounting Standards Board (IASB). Registered We have also audited, in accordance with the standards of the Public Company Accounting Oversight Board (United States) (PCAOB), the Company’s internal control over financial reporting as of March 31, 2026, based on criteria established in Internal Control — Integrated Framework (2013) issued by the Committee of Sponsoring Organizations of the Treadway Commission and our report dated June 2, 2026, expressed an unqualified opinion on the Company’s internal control over financial reporting. BASIS FOR OPINION These financial statements are the responsibility of the Company’s management. Our responsibility is to express an opinion on the Company’s financial statements based Independent on our audits. We are a public accounting firm registered with the PCAOB and are required to be independent with respect to the Company in accordance with the U.S. federal securities laws and the applicable rules and regulations of the Securities and Exchange Commission and the PCAOB. We conducted our audits in accordance with the standards of the PCAOB. Those standards require that we plan and perform the audit to obtain reasonable assurance Firm about whether the financial statements are free of material misstatement, whether due to error or fraud. Our audits included performing procedures to assess the risks of material misstatement of the financial statements, whether due to error or fraud, and performing procedures that respond to those risks. Such procedures included examining, on a test basis, evidence regarding the amounts and disclosures in the Accounting financial statements. Our audits also included evaluating the accounting principles used and significant estimates made by management, as well as evaluating the REPORT 2025-26 overall presentation of the financial statements. We believe that our audits provide a ANNUAL of reasonable basis for our opinion. Report INTEGRATED WIPRO


LOGO

417 CRITICAL AUDIT MATTER How the Critical Audit Matter Was Addressed in the Audit Our audit procedures related to estimate of efforts to complete The critical audit matter communicated below is a matter arising for fixed-price contracts accounted using the percentage-of-from the current-period audit of the financial statements that completion method included the following, among others: was communicated or required to be communicated to the audit committee and that (1) relates to accounts or disclosures that • We tested the effectiveness of controls relating to (1) are material to the financial statements and (2) involved our recording of efforts incurred and estimation of efforts especially challenging, subjective, or complex judgments. The required to complete the remaining performance obligations, communication of critical audit matters does not alter in any way and (2) access and application controls pertaining to our opinion on the financial statements, taken as a whole, and time recording and allocation systems, which prevents we are not, by communicating the critical audit matter below, unauthorized changes to recording of efforts incurred. providing a separate opinion on the critical audit matter or on the accounts or disclosures to which it relates. • We selected a sample of fixed-price contracts with customers accounted using percentage-of-completion method and Revenue from fixed-price contracts using the percentage-of- performed the following: completion method—Refer Notes 2 (iv)(a), 3(xiv)B(i) and 24 to the financial statements. • Read the contract and based on the terms and conditions evaluated whether recognizing revenue Critical Audit Matter Description over time using percentage-of-completion method Revenue from fixed-price contracts, including software was appropriate, and confirmed that the contract was development, and integration contracts, where the included in management’s calculation of revenue performance obligations are satisfied over time, is recognized over time. using the percentage-of-completion method. • Evaluated the appropriateness of and consistency Use of the percentage-of-completion method requires the in the application of management’s policies and Company to determine the project costs incurred to date as a methodologies to estimate progress towards percentage of total estimated project costs at completion. The satisfying the performance obligation. estimation of total project costs involves significant judgment • Compared efforts incurred to date with Company’s and is assessed throughout the period of the contract to reflect estimate of efforts incurred to date to identify any changes based on the latest available information. In significant variations and evaluate whether those addition, provisions for estimated losses, if any, on uncompleted variations have been considered appropriately contracts are recorded in the period in which such losses in estimating the remaining efforts to complete become probable based on the total estimated project costs. the contract. We identified the revenue recognition for fixed-price contracts • Tested the estimate for consistency with the status where the percentage-of-completion method is used as of delivery of milestones, customer acceptances and a critical audit matter because of the significant judgment other related information to identify possible delays involved in estimating the efforts to complete such contracts. in achieving milestones, which require changes This estimate has a high inherent uncertainty and requires in estimated efforts to complete the remaining consideration of progress of the contract, efforts incurred performance obligations. to-date and estimates of efforts required to complete the remaining performance obligations. This required a high degree of auditor judgment in evaluating /s/ Deloitte Haskins & Sells LLP the audit evidence supporting estimated efforts to complete and Bengaluru, India a higher extent of audit effort to evaluate the reasonableness of the total estimated efforts used to recognize revenue from fixed- June 2, 2026 price contracts using the percentage-of-completion method. We have served as the Company’s auditor since fiscal 2018.


LOGO

418 STATUTORY REPORTS AND FINANCIAL STATEMENTS CONSOLIDATED FINANCIAL STATEMENTS UNDER IFRS To the Shareholders and the Board of Directors of Wipro Limited OPINION ON INTERNAL CONTROL OVER FINANCIAL REPORTING We have audited the internal control over financial reporting of Wipro Limited and subsidiaries (the “Company”) as of March 31, 2026, based on criteria established in Internal Control — Integrated Framework (2013) issued by the Committee of Public Sponsoring Organizations of the Treadway Commission (COSO). In our opinion, the Company maintained, in all material respects, effective internal control over financial reporting as of March 31, 2026, based on criteria established in Internal Control — Integrated Framework (2013) issued by COSO. We have also audited, in accordance with the standards of the Public Company Accounting Oversight Board (United States) (PCAOB), the financial statements as of Registered and for the year ended March 31, 2026, of the Company and our report dated June 2, 2026, expressed an unqualified opinion on those financial statements. BASIS FOR OPINION The Company’s management is responsible for maintaining effective internal control over financial reporting and for its assessment of the effectiveness of internal control over financial reporting, included in the accompanying Management’s Annual Report on Internal Control over Financial Reporting. Our responsibility is to express an opinion on the Company’s internal control over financial reporting based on our audit. We are a public accounting firm registered with the PCAOB and are required to be independent Independent with respect to the Company in accordance with the U.S. federal securities laws and the applicable rules and regulations of the Securities and Exchange Commission and the PCAOB. We conducted our audit in accordance with the standards of the PCAOB. Those standards require that we plan and perform the audit to obtain reasonable assurance about whether effective internal control over financial reporting was maintained in all Firm material respects. Our audit included obtaining an understanding of internal control over financial reporting, assessing the risk that a material weakness exists, testing and evaluating the design and operating effectiveness of internal control based on the assessed risk, and performing such other procedures as we considered necessary in the circumstances. We believe that our audit provides a reasonable basis for REPORT 2025-26 Accounting our opinion. ANNUAL of Report INTEGRATED WIPRO


LOGO

419 DEFINITION AND LIMITATIONS OF INTERNAL directors of the company; and (3) provide reasonable assurance CONTROL OVER FINANCIAL REPORTING regarding prevention or timely detection of unauthorized acquisition, use, or disposition of the company’s assets that A company’s internal control over financial reporting is a could have a material effect on the financial statements. process designed to provide reasonable assurance regarding Because of its inherent limitations, internal control over financial the reliability of financial reporting and the preparation of reporting may not prevent or detect misstatements. Also, financial statements for external purposes in accordance projections of any evaluation of effectiveness to future periods with generally accepted accounting principles. A company’s are subject to the risk that controls may become inadequate internal control over financial reporting includes those policies because of changes in conditions, or that the degree of and procedures that (1) pertain to the maintenance of records compliance with the policies or procedures may deteriorate. that, in reasonable detail, accurately and fairly reflect the transactions and dispositions of the assets of the company; (2) provide reasonable assurance that transactions are recorded as necessary to permit preparation of financial statements in /s/ Deloitte Haskins & Sells LLP accordance with generally accepted accounting principles, and that receipts and expenditures of the company are being made Bengaluru, India only in accordance with authorizations of management and June 2, 2026


LOGO

420 STATUTORY REPORTS AND FINANCIAL STATEMENTS CONSOLIDATED FINANCIAL STATEMENTS UNDER IFRS stated) As at March 31, 2026 otherwise Convenience translation Position As at As at Notes into U.S. Dollar March 31, 2025 March 31, 2026 in millions (unaudited) unless Refer to Note 2(iii) ASSETS Goodwill 6 325,014 387,399 4,129 Intangible assets 6 27,450 29,176 311 Financial Property, plant and equipment 4 80,684 81,787 872 Right-of-Use assets 5 25,598 28,287 301 Financial assets share and per share data, Derivative assets — 19 ^ except Investments 299 8 26,458 28,053 millions, Trade receivables 4 9 299 349 Unbilled receivables—7,433 79 _ _ 2WKHU_ÙQDQFLDO_DVVHWV 12 4,664 6,259 67 I in ( Investments accounted for 8 1,327 2,126 23 ofStatements using the equity method Deferred tax assets 21 2,561 5,242 56 Non-current tax assets 7,230 7,787 83 Other non-current assets 13 7,460 9,010 96 Total non-current assets 508,745 592,908 6,320 Inventories 10 694 517 6 Financial assets Derivative assets 19 1,820 888 9 Investments 4,665 8 411,474 437,680 Cash and cash 1,125 11 121,974 105,555 Consolidated equivalents 2025-26 Trade receivables 1,448 9 117,745 135,901 REPORT Unbilled receivables 64,280 76,823 819 _ _ 2WKHU_ÙQDQFLDO_DVVHWV 12 8,448 10,245 109 ANNUAL Contract assets 15,795 14,819 158 Current tax assets 6,417 10,762 115 INTEGRATED Other current assets 13 29,128 33,164 353 Total current assets 777,775 826,354 8,807 TOTAL ASSETS 1,286,520 1,419,262 15,127 WIPRO


LOGO

421 (I in millions, except share and per share data, unless otherwise stated) As at March 31, 2026 Convenience As at As at translation Notes March 31, 2025 March 31, 2026 into U.S. Dollar in millions (unaudited) Refer to Note 2(iii) EQUITY Share capital 20,944 20,977 224 Share premium 2,628 6,158 66 Retained earnings 716,477 735,057 7,834 Share-based payment reserve 6,985 7,920 84 Special Economic Zone Re-investment reserve 27,778 25,966 277 Other components of equity 53,497 89,290 952 Equity attributable to the equity holders of the Company 828,309 885,368 9,437 Non-controlling interests 2,138 2,509 27 TOTAL EQUITY 830,447 887,877 9,464 LIABILITIES Financial liabilities Loans and borrowings 14 63,954 1,962 21 Lease liabilities 5 22,193 26,327 281 Accrued expenses 15—4,394 47 _ _ 2WKHU_ÙQDQFLDO_OLDELOLWLHV 16 7,793 6,743 72 Deferred tax liabilities 21 16,443 17,266 184 Non-current tax liabilities 42,024 48,195 514 Other non-current liabilities 17 17,119 23,042 246 Provisions 18 294 224 2 Total non-current liabilities 169,820 128,153 1,367 Financial liabilities Loans, borrowings and bank overdrafts 14 97,863 165,912 1,768 Lease liabilities 5 8,025 8,709 92 Derivative liabilities 19 968 10,978 117 Trade payables and accrued expenses 15 88,252 94,924 1,012 _ _ 2WKHU_ÙQDQFLDO_OLDELOLWLHV 16 3,878 11,357 120 Contract liabilities 20,063 25,434 271 Current tax liabilities 34,481 49,621 529 Other current liabilities 17 31,086 34,801 371 Provisions 18 1,637 1,496 16 Total current liabilities 286,253 403,232 4,296 TOTAL LIABILITIES 456,073 531,385 5,663 TOTAL EQUITY AND LIABILITIES 1,286,520 1,419,262 15,127 ^ Value is less than 0.5 The accompanying notes form an integral part of these consolidated financial statements.


LOGO

422 STATUTORY REPORTS AND FINANCIAL STATEMENTS CONSOLIDATED FINANCIAL STATEMENTS UNDER IFRS stated) Year ended March 31, 2026 otherwise Convenience Year ended Year ended Year ended translation Notes into U.S. Dollar March 31, 2024 March 31, 2025 March 31, 2026 in millions (unaudited) Refer to Note unless 2(iii) Revenues 24 897,603 890,884 926,240 9,871 Cost of revenues 25 (631,497) (617,802) (656,192) (6,993) data, *URVV_SURÙW 266,106 273,082 270,048 2,878 share Selling and marketing 25 (69,972) (64,378) (59,216) (631) expenses General and Income administrative 25 (60,375) (57,465) (61,434) (655) and per expenses share Foreign exchange 27 340 32 1,853 20 gains/(losses), net except Results from operating 136,099 151,271 151,251 1,612 activities Finance expenses 26 (12,552) (14,770) (14,577) (156) millions, Finance and other 27 23,896 38,202 36,491 389 income Share of net of SURÙW___ORVV__RI_ I in associate and ( joint venture 8 (233) 254 257 3 accounted for Statements using the equity method 3URÙW_EHIRUH_WD[ 147,210 174,957 173,422 1,848 Income tax 21 (36,089) (42,777) (40,767) (434) expense 3URŮW_IRU_WKH_¥HDU 111,121 132,180 132,655 1,414 3URÙW_DWWULEXWDEOH_WR_ Equity holders of 110,452 131,354 131,974 1,407 the Company Non-controlling 669 826 681 7 interests 3URŮW_IRU_WKH_¥HDU 111,121 132,180 132,655 1,414 Consolidated Earnings per equity 28 2025-26 VKDUH_ REPORT Attributable to equity holders of the Company ANNUAL Basic 10.44 12.56 12.60 0.13 Diluted 10.41 12.52 12.56 0.13 Weighted average INTEGRATED number of equity shares used in computing earnings per equity share Basic 10,576,571,110 10,456,741,552 10,476,247,846 10,476,247,846 WIPRO Diluted 10,611,424,628 10,488,939,392 10,503,422,936 10,503,422,936 The accompanying notes form an integral part of these consolidated financial statements.


LOGO

423 (I in millions, except share and per share data, unless otherwise stated) stated) Year ended March 31, 2026 otherwise Convenience Year ended Year ended Year ended translation Notes into U.S. Dollar March 31, 2024 March 31, 2025 March 31, 2026 in millions Comprehensive (unaudited) unless Refer to Note 2(iii) 3URŮW_IRU_WKH_¥HDU 111,121 132,180 132,655 1,414 data, Other comprehensive income (OCI) share ,WHPV_WKDW_ZLOO_QRW_EH_UHFODVVLÙHG_WR_ SURÙW_RU_ORVV_LQ_VXEVHTXHQW_SHULRGV 5HPHDVXUHPHQWV_RI_WKH_GHÙQHG_ 30 82 274 132 1 EHQHÙW_SODQV__QHW and per Net change in fair value of investment in equity instruments measured at fair (473) (3,476) (1,448) (15) share value through OCI except (391) (3,202) (1,316) (14) ,WHPV_WKDW_ZLOO_EH_UHFODVVLÙHG_WR_ SURÙW_RU_ORVV_LQ_VXEVHTXHQW_SHULRGV millions, Foreign currency translation 4,219 7,331 46,643 497 differences 5HFODVVLŮFDWLRQ_RI_IRUHLJQ_FXUUHQF¥_ of translation differences on sale I in of investment in associates and 20 (198) (41) —( liquidation of subsidiaries to Statements consolidated statement of income Net change in time value of option FRQWUDFWV_GHVLJQDWHG_DV_FDVK_ùRZ_ 19, 21 198 (189) 55 1 hedges, net of taxes Net change in intrinsic value of option FRQWUDFWV_GHVLJQDWHG_DV_FDVK_ùRZ_ 19, 21 128 146 (1,234) (13) hedges, net of taxes Net change in fair value of forward FRQWUDFWV_GHVLJQDWHG_DV_FDVK_ùRZ_ 19, 21 1,655 (745) (6,015) (64) hedges, net of taxes Net change in fair value of investment in debt instruments measured at fair 1,516 963 (2,094) (23) value through OCI, net of taxes 7,518 7,465 37,355 398 Consolidated Total other comprehensive income, 7,127 4,263 36,039 384 net of taxes Total comprehensive income for 118,248 136,443 168,694 1,798 the year Income Total comprehensive income DWWULEXWDEOH_WR_ Equity holders of the Company 117,744 135,595 167,767 1,788 Non-controlling interests 504 848 927 10 118,248 136,443 168,694 1,798 The accompanying notes form an integral part of these consolidated financial statements.


LOGO

WIPRO INTEGRATED ANNUAL REPORT 2025-26 424 Consolidated Statements of Changes in Equity STATUTORY REPORTS (I in millions, except share and per share data, unless otherwise stated) AND Share Share- Special Other components of equity Equity FINANCIAL Number of capital, Share Retained based Economic Foreign attributable Non- Total Zone re- &DVK_ùRZ_ to the equity controlling Shares(1) fully premium earnings payment currency Other equity investment hedging (2) holders of the interests paid-up reserve translation reserves reserve (2) reserve(3) Company reserve As at April 1, 2023 5,487,917,741 10,976 3,689 660,964 5,632 46,803 43,255 (1,403) 11,248 781,164 589 781,753 Comprehensive income for the year STATEMENTS _ 3URŮW_IRU_WKH_¥HDU ——110,452 — ——110,452 669 111,121 Other comprehensive income — — — 4,006 1,981 1,305 7,292 (165) 7,127 Total comprehensive income for the year ——110,452 — 4,006 1,981 1,305 117,744 504 118,248 Issue of equity shares on exercise of options 6,883,426 13 3,370—(3,370) — — 13—13 Issue of shares by controlled trust on exercise of (1) ——1,462 (1,462) — — — -options Compensation cost related to employee share-based ——7 5,584 — — 5,591—5,591 payment Transferred to Special Economic Zone re-investment ——4,674—(4,674) — — — CONSOLIDATED reserve Buyback of equity shares, including tax thereon (4) (269,662,921) (539) (3,768) (141,015) — — 539 (144,783)—(144,783) Transaction cost related to buyback of equity (4) ——(390) — ——(390)—(390) shares Financial liability on written put options (5) — — — — (4,238) (4,238)—(4,238) FINANCIAL Non-controlling interests on acquisition of subsidiary (5) — — — — — 472 472 Dividend (4) ——(5,218) — ——(5,218) (322) (5,540) Others — — — — — 97 97 Other transactions for the year (262,779,495) (526) (398) (140,480) 752 (4,674) — (3,699) (149,025) 247 (148,778) As at March 31, 2024 5,225,138,246 10,450 3,291 630,936 6,384 42,129 47,261 578 8,854 749,883 1,340 751,223 ___b_Includes 5,952,740 treasury shares held as at March 31, 2024 by a controlled trust. 3,943,096 shares have been transferred by the controlled trust to eligible employees on exercise of STATEMENTS options during the year ended March 31, 2024. ___bRefer to Note 20 ___bRefer to Note 19 UNDER ___bRefer to Note 22 ___bRefer to Note 7 IFRS The accompanying notes form an integral part of these consolidated financial statements.


LOGO

(I in millions, except share and per share data, unless otherwise stated) Share Share- Special Other components of equity Equity Economic Foreign attributable Non- Number of capital, Share Retained based &DVK_ùRZ_ Total (1) Zone re- currency Other to the equity controlling Shares fully premium earnings payment hedging equity investment translation reserves (2) holders of the interests paid-up reserve reserve(3) reserve reserve(2) Company As at April 1, 2024 5,225,138,246 10,450 3,291 630,936 6,384 42,129 47,261 578 8,854 749,883 1,340 751,223 Comprehensive income for the year _ 3URŮW_IRU_WKH_¥HDU ——131,354 — ——131,354 826 132,180 Other comprehensive income — — — 7,253 (788) (2,224) 4,241 22 4,263 Total comprehensive income for the year ——131,354 — 7,253 (788) (2,224) 135,595 848 136,443 Issue of equity shares on exercise of options 13,628,596 27 4,950—(4,950) — — 27—27 Bonus issue of equity shares(4) 5,233,369,207 10,467 (5,613) (3,193) — — (1,661) — -Dividend (4) ——(62,750) — ——(62,750)—(62,750) Transfer from Other components of equity(2) ——5,754 — — (5,754) — -Transfer of shares pertaining to Non-controlling ——25 — (14)—(8) 3 (3) -interests of subsidiary Compensation cost related to employee share-based — — 5,551 — — 5,551—5,551 payment Transferred from Special Economic Zone re- ——14,351—(14,351) — — —investment reserve Others — — — — — (47) (47) Other transactions for the year 5,246,997,803 10,494 (663) (45,813) 601 (14,351) (14)—(7,423) (57,169) (50) (57,219) As at March 31, 2025 10,472,136,049 20,944 2,628 716,477 6,985 27,778 54,500 (210) (793) 828,309 2,138 830,447 ___bIncludes 11,905,480 treasury shares held as at March 31, 2025 by a controlled trust. ___bRefer to Note 20 ___bRefer to Note 19 ___bRefer to Note 22 The accompanying notes form an integral part of these consolidated financial statements. 425


LOGO

WIPRO INTEGRATED ANNUAL REPORT 2025-26 426 (I in millions, except share and per share data, unless otherwise stated) Share Share- Special Other components of equity Equity Economic Foreign attributable Non- Number of capital, Share Retained based &DVK_ùRZ_ Total (1) Zone re- currency Other to the equity controlling Shares fully premium earnings payment hedging equity investment translation reserves (2) holders of the interests paid-up reserve reserve(3) STATUTORY reserve reserve(2) Company As at April 1, 2025 10,472,136,049 20,944 2,628 716,477 6,985 27,778 54,500 (210) (793) 828,309 2,138 830,447 Comprehensive income for the year REPORTS _ 3URŮW_IRU_WKH_¥HDU ——131,974 — ——131,974 681 132,655 AND Other comprehensive income — — — 46,377 (7,194) (3,390) 35,793 246 36,039 Total comprehensive income for the year ——131,974 — 46,377 (7,194) (3,390) 167,767 927 168,694 Issue of equity shares on exercise of options 16,276,409 33 3,530—(3,530) — — 33—33 Dividend (4) ——(115,206) — ——(115,206) (569) (115,775) FINANCIAL Compensation cost related to employee share-based — — 4,465 — — 4,465—4,465 payment Transferred from Special Economic Zone ——1,812—(1,812) — ——-re-investment reserve Others — — — (5) 5 — 13 13 STATEMENTS Other transactions for the year 16,276,409 33 3,530 (113,394) 935 (1,812) (5) 5—(110,708) (556) (111,264) As at March 31, 2026 10,488,412,458 20,977 6,158 735,057 7,920 25,966 100,872 (7,399) (4,183) 885,368 2,509 887,877 Convenience translation into U.S. Dollar in millions 224 66 7,834 84 277 1,075 (79) (44) 9,437 27 9,464 (unaudited) Refer to Note 2(iii) ___bIncludes 11,905,480 treasury shares held as at March 31, 2026 by a controlled trust. ___bRefer to Note 20 ___bRefer to Note 19 ___bRefer to Note 22 CONSOLIDATED The accompanying notes form an integral part of these consolidated financial statements FINANCIAL STATEMENTS UNDER IFRS 


LOGO

427 stated) Year ended March 31, 2026 otherwise Convenience Year ended Year ended Year ended translation Notes into U.S. Dollar March 31, 2024 March 31, 2025 March 31, 2026 in millions (unaudited) Refer to unless Note 2(iii) &DVK_ùRZV_IURP_RSHUDWLQJ_ DFWLYLWLHV_ 3URŮW_IRU_WKH_¥HDU 111,121 132,180 132,655 1,414 Flows data, Adjustments to reconcile share SURŮW_IRU_WKH_¥HDU_WR_QHW_FDVK_ generated from operating DFWLYLWLHV_ Gain on sale of property, (2,072) (606) (393) (4) plant and equipment, net and per Depreciation, amortization 25 34,071 29,579 29,107 310 share and impairment expense Cash Unrealized exchange (gain)/ 655 (623) 2,168 23 except loss, net Share-based compensation 5,584 5,551 4,465 48 expense millions, _ _6KDUH_RI_QHW__SURÙW__ORVV_RI_ associate and joint venture 233 (254) (257) (3) accounted for using equity method of Income tax expense 21 36,089 42,777 40,767 434 I in ( Finance and other income, (11,344) (23,432) (21,914) (234) QHW_RI_ÙQDQFH_H[SHQVHV Statements Change in fair value of (1,300) (169) 49 1 contingent consideration Lifetime expected credit 25 640 324 2,838 30 loss/(write-back) Other non-cash items 488 —- Changes in operating assets and liabilities; net of effects from DFTXLVLWLRQV_ (Increase)/Decrease in trade 7,824 1,894 (11,442) (122) receivables (Increase)/Decrease in unbilled receivables and 5,919 (1,331) (14,498) (154) contract assets (Increase)/Decrease in 287 213 184 2 Inventories Consolidated (Increase)/Decrease in other ÙQDQFLDO_DVVHWV_DQG_RWKHU_ 8,869 6,609 (205) (2) assets Increase/(Decrease) in trade payables, accrued H[SHQVHV__RWKHU_ÙQDQFLDO_ (435) 548 8,482 90 liabilities, other liabilities and provisions Increase/(Decrease) in (5,053) 2,341 3,555 38 contract liabilities Cash generated from operating 191,576 195,601 175,561 1,871 DFWLYLWLHV_EHIRUH_WD[HV Income taxes paid, net (15,360) (26,175) (26,245) (280) Net cash generated from 176,216 169,426 149,316 1,591 operating activities


LOGO

428 STATUTORY REPORTS AND FINANCIAL STATEMENTS CONSOLIDATED FINANCIAL STATEMENTS UNDER IFRS (I in millions, except share and per share data, unless otherwise stated) Year ended March 31, 2026 Convenience Year ended Year ended Year ended translation Notes into U.S. Dollar March 31, 2024 March 31, 2025 March 31, 2026 in millions (unaudited) Refer to Note 2(iii) &DVK_ùRZV_IURP_LQYHVWLQJ_DFWLYLWLHV_ Payment for purchase of property, plant and equipment (10,510) (14,737) (15,603) (166) Proceeds from disposal of property, plant and equipment 4,022 1,822 758 8 Investment in associate — (352) (4) Payment for purchase of investments (975,069) (801,582) (837,806) (8,929) Proceeds from sale of investments 978,598 706,520 816,732 8,704 Payment for business acquisitions including deposits and escrow, net of (5,291) (964) (26,033) (277) cash acquired Payment for investment in joint venture (484) —- Proceeds from/(repayment of) security deposit for property, plant and 300 (300) —equipment Interest received 20,111 26,212 28,878 308 Dividend received 27 3 2,299 3^ Net cash generated from/(used in) investing activities 11,680 (80,730) (33,423) (356) &DVK_ùRZV_IURP_ÙQDQFLQJ_DFWLYLWLHV_ Proceeds from issuance of equity shares and shares pending allotment 13 27 33 ^ Repayment of loans and borrowings (130,557) (177,672) (259,841) (2,769) Proceeds from loans and borrowings 120,500 195,595 253,089 2,697 Payment of lease liabilities including interests 5 (10,060) (10,474) (11,561) (123) Payment for buyback of equity shares, including tax and transaction cost (145,173) —- Payment for contingent consideration (1,294)—(648) (7) Payment of deferred consideration on business combination — (221) (2) _ ,QWHUHVW_DQG_ÙQDQFH_H[SHQVHVbSDLG _ (10,456) (8,689) (6,336) (67) Payment of dividend (5,218) (62,750) (115,206) (1,228) Payment of dividend to Non-controlling interests holders (322)—(569) (6) 2025-26 1HW_FDVK_JHQHUDWHG_XVHG_LQ_ÙQDQFLQJ_DFWLYLWLHV (182,567) (63,963) (141,260) (1,505) REPORT Net increase/(decrease) in cash and cash equivalents during the year 5,329 24,733 (25,367) (270) Effect of exchange rate changes on cash and cash equivalents (239) 290 8,948 95 ANNUAL Cash and cash equivalents at the beginning of the year 11 91,861 96,951 121,974 1,300 Cash and cash equivalents at the end of the year 11 96,951 121,974 105,555 1,125 INTEGRATED 5HIHU_WR_1RWH____IRU_VXSSOHPHQWDU¥_LQIRUPDWLRQ_RQ_WKH_FRQVROLGDWHG_VWDWHPHQW_RI_FDVK_ůRZV_ ^ Value is less than 0.5 The accompanying notes form an integral part of these consolidated financial statements. WIPRO


LOGO

429 1. THE COMPANY OVERVIEW stated) Wipro Limited (“Wipro” or the “Parent Company”), together with its subsidiaries Statements otherwise and controlled trusts (collectively, “we”, “us”, “our”, “the Company” or “the Group”) is a leading artificial intelligence (“AI”) powered technology services and consulting company focused on building innovative solutions that address clients’ most complex digital transformation needs. Leveraging our consulting-led approach and the Wipro Intelligence™ unified suite of AI-powered platforms, solutions and transformative offerings, we help clients realize their boldest ambitions to build intelligent and sustainable businesses. Wipro is a public limited company incorporated and domiciled in India. The address of its registered office is Wipro Limited, Doddakannelli, Sarjapur Road, Bengaluru – 560 035, Karnataka, India. The Company has its primary listing with BSE Ltd. and National Stock Exchange of India Limited. The Company’s American Depository Shares (“ADS”) Financial representing equity shares are also listed on the New York Stock Exchange. The Company’s Board of Directors authorized these consolidated financial statements except share and per share data, unless for issue on June 2, 2026. millions, 2. BASIS OF PREPARATION OF CONSOLIDATED FINANCIAL STATEMENTS I in Consolidated ( (i) Statement of compliance and basis of preparation The consolidated financial statements have been prepared in compliance with International Financial Reporting Standards and its interpretations (“IFRS”), as issued by the International Accounting Standards Board (“IASB”). All accounting policies have been applied consistently to all periods presented in these consolidated financial statements, except for new accounting standards adopted by the Company. The consolidated financial statements correspond to the classification provisions contained in IAS 1(revised), “Presentation of Financial Statements”. For clarity, various items are aggregated in the consolidated statement of income, consolidated statement of comprehensive income and consolidated statement of financial position. These items are disaggregated separately in the notes to the consolidated financial statements, where applicable. The assets which are expected to be realized within a period of twelve months from the the end of reporting period are classified as current assets. Similarly, the liabilities which are expected to be settled within a period of twelve months from the end of reporting period are classified as current liabilities. All other assets and liabilities are classified as non-current. to All amounts included in the consolidated financial statements are reported in millions of Notes Indian Rupees (I in millions) except share and per share data, unless otherwise stated. Due to rounding off, the numbers presented throughout the document may not add up precisely to the totals and percentages may not precisely reflect the absolute figures. Previous year figures have been regrouped/rearranged, wherever necessary.


LOGO

430 STATUTORY REPORTS AND FINANCIAL STATEMENTS CONSOLIDATED FINANCIAL STATEMENTS UNDER IFRS Notes to the Consolidated Financial Statements (I in millions, except share and per share data, unless otherwise stated) (ii) Basis of measurement at monetary amounts that cannot be observed directly and must instead be estimated. In such a The consolidated financial statements have been case, management develops an accounting estimate prepared on a historical cost convention and on an to achieve the objective set out by the accounting accrual basis, except for the following material items policy. Developing accounting estimates involves the which have been measured at fair value as required use of judgments or assumptions based on the latest by relevant IFRS: available and reliable information. Actual results may differ from those accounting estimates. a. Derivative financial instruments; Accounting estimates and underlying assumptions b. Financial instruments classified as fair value are reviewed on an ongoing basis. Changes to through other comprehensive income or fair accounting estimates are recognized in the period in value through profit or loss; which the estimates are changed and in any future c. The defined benefit liability/(asset) is recognized periods affected. In particular, information about as the present value of defined benefit obligation material areas of estimation, uncertainty and critical less fair value of plan assets; and judgments in applying accounting policies that have the material effect on the amounts recognized in the d. Contingent consideration and liability on written consolidated financial statements are included in the put options. following notes: (iii) Convenience translation (unaudited) a) Revenue recognition: The Company applies judgment to determine whether each product The accompanying consolidated financial statements or service promised to a customer is capable have been prepared and reported in Indian Rupees, of being distinct, and is distinct in the context the functional currency of the Parent Company. Solely of the contract, if not, the promised product or for the convenience of the readers, the consolidated service is combined and accounted as a single financial statements as at and for the year ended March performance obligation. The Company allocates 31, 2026, have been translated into United States the Transaction Price (as defined below in Note Dollars at the certified foreign exchange rate of U.S.$ 3(xiv)) to separately identifiable performance 1 = I 93.83 as published by Federal Reserve Board obligation deliverables based on their relative of Governors on March 31, 2026. No representation stand-alone selling price. In cases where the is made that the Indian Rupee amounts have been, Company is unable to determine the stand-could have been or could be converted into United alone selling price the Company uses expected States Dollars at such a rate or any other rate. Due cost-plus margin approach in estimating the to rounding off, the translated numbers presented stand-alone selling price. The Company uses throughout the document may not add up precisely the percentage of completion method using to the totals. the input (cost expended) method to measure progress towards completion in respect of (iv) Use of estimates and judgment fixed-price contracts. Percentage of completion method accounting relies on estimates of The preparation of the consolidated financial total expected contract revenue and costs. REPORT 2025-26 statements in conformity with IFRS requires the This method is followed when reasonably ANNUAL management to make judgments, accounting dependable estimates of the revenues and costs estimates and assumptions that affect the application applicable to various elements of the contract of accounting policies and the reported amounts of INTEGRATED can be made. Key factors that are reviewed in assets, liabilities, income, and expenses. Accounting estimating the future costs to complete include estimates are monetary amounts in the consolidated estimates of future labor costs and productivity financial statements that are subject to measurement efficiencies. Because the financial reporting uncertainty. An accounting policy may require items of these contracts depends on estimates that WIPRO in consolidated financial statements to be measured 


LOGO

431 Notes to the Consolidated Financial Statements (I in millions, except share and per share data, unless otherwise stated) are assessed continually during the term of these future taxable income in making this assessment. contracts, revenue recognized, profit and timing of The amount of deferred tax assets considered revenue for remaining performance obligations are realizable, however, could reduce in the near term if subject to revisions as the contract progresses to estimates of future taxable income during the carry-completion. When estimates indicate that a loss will forward period are reduced. be incurred, the loss is provided for in the period in d) Business combinations: In accounting for business which the loss becomes probable. Volume discounts combinations, judgment is required to assess are recorded as a reduction of revenue. When the whether an identifiable intangible asset is to be amount of discount varies with the levels of revenue, recorded separately from goodwill. Additionally, volume discount is recorded based on estimate of estimating the acquisition date fair value of the future revenue from the customer. identifiable assets acquired (including useful life b) Impairment testing: Goodwill recognized on estimates), liabilities assumed, and contingent business combination is tested for impairment at consideration assumed involves management least annually and when events occur or changes judgment. These measurements are based on in circumstances indicate that the recoverable information available at the acquisition date and are amount of goodwill or a cash generating unit to which based on expectations and assumptions that have goodwill pertains, is less than the carrying value. The been deemed reasonable by management. Changes Company assesses acquired intangible assets with in these judgments, estimates, and assumptions can finite useful life for impairment whenever events or materially affect the results of operations. changes in circumstances indicate that the carrying e) Defined benefit plans and compensated absences: amount may not be recoverable. The recoverable The cost of the defined benefit plans, compensated amount of an asset or a cash generating unit is higher absences and the present value of the defined of value-in-use and fair value less cost of disposal. benefit obligations are based on actuarial valuation The calculation of value in use of an asset or a cash using the projected unit credit method. An actuarial generating unit involves use of significant estimates valuation involves making various assumptions that and assumptions which include turnover, growth may differ from actual developments in the future. rates and net margins used to calculate projected These include the determination of the discount future cash flows, risk-adjusted discount rate, future rate, future salary increases and mortality rates. Due economic and market conditions. to the complexities involved in the valuation and c) Income taxes: The major tax jurisdictions for the its long-term nature, a defined benefit obligation is Company are India and the United States. highly sensitive to changes in these assumptions. All Significant judgments are involved in determining assumptions are reviewed at each reporting date. the provision for income taxes including judgment f) Expected credit losses on financial assets: The on whether tax positions are probable of being impairment provisions of financial assets are based sustained in tax assessments. A tax assessment can on assumptions about risk of default and expected involve complex issues, which can only be resolved timing of collection. The Company uses judgment in over extended time periods. making these assumptions and selecting the inputs Deferred tax is recorded on temporary differences to the expected credit loss calculation based on between the tax bases of assets and liabilities and the Company’s history of collections, customer’s their carrying amounts, at the rates that have been creditworthiness, existing market conditions as well enacted or substantively enacted at the reporting as forward-looking estimates at the end of each date. The ultimate realization of deferred tax assets reporting period. is dependent upon the generation of future taxable g) Useful lives of property, plant and equipment: The profits during the periods in which those temporary Company depreciates property, plant and equipment differences and tax loss carry-forwards become on a straight-line basis over estimated useful lives deductible. The Company considers expected of the assets. The charge in respect of periodic reversal of deferred tax liabilities and projected depreciation is derived based on an estimate of an 


LOGO

432 STATUTORY REPORTS AND FINANCIAL STATEMENTS CONSOLIDATED FINANCIAL STATEMENTS UNDER IFRS Notes to the Consolidated Financial Statements (I in millions, except share and per share data, unless otherwise stated) asset’s expected useful life and the expected The financial statements of the Group companies residual value at the end of its life. The lives are consolidated on a line-by-line basis and all intra-are based on historical experience with similar Group balances, transactions, income and expenses assets as well as anticipation of future events, are eliminated in full on consolidation. which may impact their life, such as changes in technology. The estimated useful life is reviewed Non-controlling interests at least annually. Non-controlling interests in the net assets (excluding h) Provisions and contingent liabilities: The goodwill) of consolidated subsidiaries are identified Company estimates the provisions that have separately from the Company’s equity. The interest present obligations as a result of past events of non-controlling shareholders may be initially and it is probable that outflow of resources will measured either at fair value or at the non-controlling be required to settle the obligations. These interest’s proportionate share of the fair value of provisions are reviewed at the end of each the acquiree’s identifiable net assets. The choice reporting date and are adjusted to reflect the of measurement basis is made on an acquisition to current best estimates. acquisition basis. Subsequent to acquisition, the The Company uses significant judgment to carrying amount of non-controlling interests is the disclose contingent liabilities. Contingent amount of those interests at initial recognition plus liabilities are disclosed when there is a possible the non-controlling interest’s share of subsequent obligation arising from past events, the existence changes in equity. Total comprehensive income of which will be confirmed only by the occurrence is attributed to non-controlling interests even if it or non-occurrence of one or more uncertain results in the non-controlling interests having a future events not wholly within the control of deficit balance. the Company or a present obligation that arises from past events where it is either not probable Liability for written put options to that an outflow of resources will be required to non-controlling interests settle the obligation or a reliable estimate of the amount cannot be made. Contingent assets At initial recognition, the liability for put options issued are neither recognized nor disclosed in the to non-controlling interests, to be settled in cash by financial statements. the Company, which do not grant present access to ownership interest to the Company is recognized as 3. MATERIAL ACCOUNTING POLICY financial liability at present value of the redemption amount with a corresponding debit in other reserves INFORMATION within equity. (i) Basis of consolidation The liability is subsequently remeasured at the end of Subsidiaries and controlled trusts each period and accreted through financial expenses The Company determines the basis of control in up to the redemption amount that is payable at the line with the requirements of IFRS 10, Consolidated date at which the option first becomes exercisable. Financial Statements. Subsidiaries and controlled In the event that the option expires unexercised, REPORT 2025-26 trusts are entities controlled by the Group. The Group the liability is derecognized with a corresponding ANNUAL controls an entity when the parent has power over adjustment to equity. the entity, it is exposed to, or has rights to, variable INTEGRATED returns from its involvement with the entity and has the Investments accounted for using the equity ability to affect those returns through its power over method the entity. The financial statements of subsidiaries and controlled trusts are included in the consolidated Investments accounted for using the equity method are entities in respect of which, the Company financial statements from the date on which control WIPRO commences until the date on which control ceases. has significant influence, but not control, over the 


LOGO

433 Notes to the Consolidated Financial Statements (I in millions, except share and per share data, unless otherwise stated) financial and operating policies. Generally, a company at fair value through other comprehensive income has a significant influence if it holds between 20% and are included in other comprehensive income, net 50% of the voting power of another entity. Investments in of taxes. such entities are accounted for using the equity method and are initially recognized at cost. The carrying amount b) Foreign operations of investment is increased/ decreased to recognize investors share of profit or loss of the investee after the For the purpose of presenting consolidated acquisition date. financial statements, the assets and liabilities of the Company’s foreign operations that have a functional currency other than Indian Rupees are translated (ii) Functional and presentation currency into Indian Rupees using exchange rates prevailing Items included in the financial statements of each of the at the reporting date. Income and expense items Company’s entities are measured using the currency of are translated at the average exchange rates for the primary economic environment in which these entities the period. Exchange differences arising, if any, are operate (i.e. the “functional currency”). These consolidated recognized in other comprehensive income and held financial statements are presented in Indian Rupees, in foreign currency translation reserve (“FCTR”), a which is the functional currency of the Parent Company. component of equity, except to the extent that the translation difference is allocated to non-controlling (iii) Foreign currency transactions and interest. When a foreign operation is disposed of, the relevant amount recognized in FCTR is transferred translation to the consolidated statement of income as part of a) Transactions and balances the profit or loss on disposal. Goodwill and fair value Transactions in foreign currency are translated adjustments arising on the acquisition of a foreign into the respective functional currencies using operation are treated as assets and liabilities of the the exchange rates prevailing at the date of the foreign operation and translated at the exchange transaction. Foreign exchange gains and losses rate prevailing at the reporting date. resulting from the settlement of such transactions and from translation at the exchange rates prevailing c) Others at the reporting date of monetary assets and liabilities Foreign currency differences arising on the translation denominated in foreign currencies are recognized in or settlement of a financial liability designated as a the consolidated statement of income and reported hedge of a net investment in a foreign operation are within foreign exchange gains/(losses), net, within recognized in other comprehensive income and results of operating activities except when deferred presented within equity in the FCTR to the extent in other comprehensive income as qualifying cash the hedge is effective. To the extent the hedge is flow hedges and qualifying net investment hedges. ineffective, such differences are recognized in the Net loss relating to translation or settlement of consolidated statement of income. borrowings denominated in foreign currency are reported within finance expense. Net gain relating to When the hedged part of a net investment is translation or settlement of borrowings denominated disposed of, the relevant amount recognized in in foreign currency are reported within finance and FCTR is transferred to the consolidated statement other income. Non-monetary assets and liabilities of income as part of the profit or loss on disposal. denominated in foreign currency and measured at Foreign currency differences arising from translation historical cost are translated at the exchange rate of intercompany receivables or payables relating to prevalent at the date of transaction. Translation foreign operations, the settlement of which is neither differences on non-monetary financial assets planned nor likely in the foreseeable future, are measured at fair value at the reporting date, such as considered to form part of net investment in foreign equities classified as financial instruments measured operation and are recognized in FCTR.


LOGO

434 STATUTORY REPORTS AND FINANCIAL STATEMENTS CONSOLIDATED FINANCIAL STATEMENTS UNDER IFRS Notes to the Consolidated Financial Statements (I in millions, except share and per share data, unless otherwise stated) (iv) Financial Instruments b. Investments _ $___1RQ_GHULYDWLYH_)LQDQFLDO_,QVWUXPHQWV_ Financial instruments measured at Non-derivative Financial Instruments consist of: DPRUWL]HG_FRVW_ • financial assets which include cash and cash Debt instruments that meet the following equivalents, trade receivables, unbilled criteria are measured at amortized cost receivables, finance lease receivables, (except for debt instruments that are employee and other advances, investments in designated at fair value through profit or equity and debt securities and eligible current loss on initial recognition): and non-current assets; and • the asset is held within a business model • financial liabilities which include long and whose objective is to hold assets in order short-term loans and borrowings, bank to collect contractual cash flows; and overdrafts, trade payables and accrued • the contractual terms of the instrument expenses, lease liabilities and eligible current give rise on specified dates to cash and non-current liabilities. flows that are solely payment of Non-derivative financial instruments other than principal and interest on the principal trade receivables and unbilled receivables amount outstanding. are recognized initially at fair value. Trade receivables and unbilled receivables that do not Financial instruments measured at fair contain a significant financing component are value through other comprehensive measured at the Transaction Price. Subsequent LQFRPH__ņ)972&,Ò__ to initial recognition, non-derivative financial Debt instruments that meet the following instruments are measured as described below: criteria are measured at FVTOCI (except for debt instruments that are designated a. Cash and Cash Equivalents at fair value through profit or loss on initial The Company’s cash and cash equivalents recognition): consist of cash on hand and in banks and • the asset is held within a business model demand deposits with banks, which can be whose objective is achieved both by withdrawn at any time, without prior notice collecting contractual cash flows and or penalty on the principal. selling the financial asset; and For the purposes of the consolidated • the contractual terms of the instrument statement of cash flows, cash and cash give rise on specified dates to cash equivalents include cash on hand, in banks flows that are solely payment of and demand deposits with banks, net principal and interest on the principal of outstanding bank overdrafts that are amount outstanding. repayable on demand and are considered part of the Company’s cash management Interest income is recognized in the REPORT 2025-26 system. In the consolidated statement consolidated statement of income for of financial position, bank overdrafts are FVTOCI debt instruments. Other changes ANNUAL presented under loans and borrowings in fair value of FVTOCI financial assets within current financial liabilities. are recognized in other comprehensive INTEGRATED income. When the investment is disposed of, the cumulative gain or loss previously accumulated in reserves is transferred to the consolidated statement of income. WIPRO


LOGO

435 Notes to the Consolidated Financial Statements (I in millions, except share and per share data, unless otherwise stated) Financial instruments Measured at Fair _ _ F__ 2WKHU_)LQDQFLDO_$VVHWV_ 9DOXH_WKURXJK_3URÙW_RU_/RVV__ņ)973/Ò__ Other financial assets are non-derivative Instruments that do not meet the amortized financial assets with fixed or determinable cost or FVTOCI criteria are measured at FVTPL. payments that are not quoted in an active Financial assets at FVTPL are measured at fair market. These comprise trade receivables, value at the end of each reporting period, with unbilled receivables, finance lease receivables, any gains or losses arising on re-measurement employee and other advances and eligible recognized in the consolidated statement current and non-current assets. They are of income. The gain or loss on disposal is presented as current assets, except for those recognized in the consolidated statement expected to be realized later than twelve of income. months after the reporting date which are presented as non-current assets. All financial Interest income is recognized in the assets are initially recognized at fair value and consolidated statement of income for FVTPL subsequently measured at amortized cost debt instruments. Dividends on financial assets using the effective interest method, less any at FVTPL is recognized when the Company’s impairment losses. However, trade receivables right to receive dividends is established. and unbilled receivables that do not contain a significant financing component are measured _ _ _ ,QYHVWPHQWV_LQ_(TXLW¥_,QVWUXPHQWV_ at the Transaction Price. The Company carries certain equity instruments which are not held for trading. At _ _ G__ _7UDGH_SD¥DEOHV__DFFUXHG_([SHQVHV__DQG_ initial recognition, the Company may make an other Liabilities irrevocable election to present subsequent Trade payables, accrued expenses, and changes in the fair value of an investment in other liabilities are initially recognized at the an equity instrument in other comprehensive transaction price, and subsequently carried income (FVTOCI) or through statement of at amortized cost using the effective interest income (FVTPL). For investments designated method. For these financial instruments, the to be classified as FVTOCI, movements in fair carrying amounts approximate fair value due value of investments are recognized in other to the short-term maturity of these instruments. comprehensive income and the gain or loss Contingent consideration recognized in a is not transferred to consolidated statement business combination is initially recognized at of income on disposal of investments. For fair value and subsequently measured at fair investments designated to be classified value through profit or loss. as FVTPL, both movements in fair value of investments and gain or loss on disposal of B) Derivative Financial Instruments investments are recognized in the consolidated The Company is exposed to foreign currency statement of income. fluctuations on foreign currency assets, liabilities, Dividends from these investments are net investment in foreign operations and forecasted recognized in the consolidated statement of cash flows denominated in foreign currency. income when the Company’s right to receive The Company limits the effect of foreign exchange dividends is established. rate fluctuations by following established risk When the investment in equity instruments is management policies including the use of derecognized, the cumulative gain or loss in derivatives. The Company enters into derivative other comprehensive income is transferred to financial instruments where the counterparty is retained earnings. primarily a bank.


LOGO

436 STATUTORY REPORTS AND FINANCIAL STATEMENTS CONSOLIDATED FINANCIAL STATEMENTS UNDER IFRS Notes to the Consolidated Financial Statements (I in millions, except share and per share data, unless otherwise stated) Derivative financial instruments are recognized borrowing as a hedge of net investment in and measured at fair value. Attributable foreign operations. Changes in the fair value of transaction costs are recognized in the the derivative hedging instruments and gains/ consolidated statement of income as cost. (losses) on translation or settlement of foreign Subsequent to initial recognition, derivative currency denominated borrowings designated as financial instruments are measured as a hedge of net investment in foreign operations described below: are recognized in other comprehensive income and presented within equity in the FCTR to the extent that the hedge is effective. To the _ D__ &DVK_ùRZ_KHGJHV extent that the hedge is ineffective, changes Changes in the fair value of the derivative hedging in fair value are recognized in the consolidated instruments designated as a cash flow hedge are statement of income and reported within foreign recognized in other comprehensive income and exchange gains/(losses), net within results from held in cash flow hedging reserve, net of taxes, operating activities. a component of equity, to the extent that the hedge is effective. To the extent that the hedge is c. Others ineffective, changes in fair value are recognized Changes in fair value of foreign currency in the consolidated statement of income and derivative instruments neither designated as reported within foreign exchange gains/(losses), cash flow hedges nor hedges of net investment net, within results from operating activities. If the in foreign operations are recognized in the hedging instrument no longer meets the criteria consolidated statement of income and reported for hedge accounting, then hedge accounting within foreign exchange gains/(losses), net within is discontinued prospectively. If the hedging results from operating activities. Changes in fair instrument expires or is sold, terminated or value and gains/(losses), net, on settlement of exercised, the cumulative gain or loss on the foreign currency derivative instruments relating hedging instrument recognized in cash flow to borrowings, which have not been designated hedging reserve till the period the hedge was as hedges are recorded in finance expenses. effective remains in cash flow hedging reserve until the forecasted transaction occurs. The cumulative gain or loss previously recognized in _ &__‘HUHFRJQLWLRQ_RI_ÙQDQFLDO_LQVWUXPHQWV the cash flow hedging reserve is transferred to The Company derecognizes a financial asset the consolidated statement of income upon the when the contractual rights to the cash flows occurrence of the related forecasted transaction. from the financial asset expire or it transfers If the forecasted transaction is no longer the financial asset and the transfer qualifies for expected to occur, such cumulative balance is derecognition under IFRS 9. If the Company immediately recognized in the consolidated retains substantially all the risks and rewards statement of income. of a transferred financial asset, the Company b. Hedges of net investment in foreign operations continues to recognize the financial asset and recognizes a borrowing for the proceeds REPORT 2025-26 The Company designates derivative financial received. A financial liability (or a part of a ANNUAL instruments as hedges of net investments financial liability) is derecognized from the in foreign operations. The Company also Company’s consolidated statement of financial INTEGRATED designates foreign currency denominated position when the obligation specified in the contract is discharged or cancelled or expires. WIPRO


LOGO

437 Notes to the Consolidated Financial Statements (I in millions, except share and per share data, unless otherwise stated) (v) Equity and share capital as at March 31, 2024, 2025 and 2026 amounting to I 1,139, I 1,139 and I 1,139 respectively, which is not freely available for distribution. a) Share capital and share premium The authorized share capital of the Company d) Special Economic Zone re-investment as at March 31, 2026 is I 25,352 divided into reserve 12,543,500,000 equity shares of I 2 each, 25,000,000 preference shares of I 10 each and The Special Economic Zone (“SEZ”) re-investment 150,000 10% optionally convertible cumulative reserve has been created out of profit of eligible SEZ preference shares of I 100 each. Par value of the units as per provisions of section 10AA(1)(ii) of the equity shares is recorded as share capital and the Income–tax Act, 1961 for acquiring new plant and amount received in excess of par value is classified machinery. The said reserve should be utilized by as share premium. the Company for acquiring plant and machinery as Every holder of equity shares, as reflected in per the terms of Section 10AA(2) of the Income-the records of the Company, as at the date of the tax Act, 1961. This reserve is not freely available shareholder meeting shall have one vote in respect for distribution. of each share held for all matters submitted to vote in the shareholder meeting. e) Share-based payment reserve The share-based payment reserve is used to record b) Shares held by controlled trust (Treasury the value of equity-settled share-based payment shares) transactions with employees. The amounts recorded in share-based payment reserve are transferred to The Company’s equity shares held by the controlled share premium upon exercise of stock options and trust, which is consolidated as part of the Group are restricted stock unit options by employees. classified as treasury shares. Treasury shares are recorded at acquisition cost. Reconciliation of the f) Foreign currency translation reserve number of treasury shares held by controlled trust is as follows: The exchange differences arising from the translation of financial statements of foreign operations, As at As at As at differences arising from translation of long-term inter- March 31, 2024 March 31, 2025 March 31, 2026 company receivables or payables relating to foreign No. of shares No. of shares No. of shares operations, settlement of which is neither planned Opening number of nor likely in the foreseeable future, changes in fair 9,895,836 5,952,740 11,905,480 equity shares value of the derivative hedging instruments and Less: Transferred to eligible employees (3,943,096) — gains/losses on translation or settlement of foreign on exercise of currency denominated borrowings designated as options hedge of net investment in foreign operations are Add: Bonus issue recognized in other comprehensive income, net of of equity shares—5,952,740—(Refer to Note 22) taxes and presented within equity in the FCTR. Closing number of 5,952,740 11,905,480 11,905,480 equity shares _ J__&DVK_ùRZ_KHGJLQJ_UHVHUYH c) Retained earnings Changes in fair value of derivative hedging instruments designated and effective as a cash Retained earnings is comprised of the Company’s flow hedge are recognized in other comprehensive undistributed earnings after taxes and is freely income, net of taxes and presented within equity as available for distribution. This includes capital reserve cash flow hedging reserve.


LOGO

438 STATUTORY REPORTS AND FINANCIAL STATEMENTS CONSOLIDATED FINANCIAL STATEMENTS UNDER IFRS Notes to the Consolidated Financial Statements (I in millions, except share and per share data, unless otherwise stated) h) Other reserves (vi) Property, plant and equipment Changes in the fair value of financial instruments a) Recognition, measurement and measured at fair value through other comprehensive income and actuarial gains and derecognition losses on remeasurements of the defined benefit Property, plant and equipment are measured plans are recognized in other comprehensive at cost less accumulated depreciation and income, net of taxes and presented within equity impairment losses, if any. Cost includes in other reserves. expenditures directly attributable to the Other reserves also include capital redemption acquisition of the asset. General and specific reserve, which is not freely available for borrowing costs directly attributable to the distribution. As per the Companies Act, 2013, construction of a qualifying asset are capitalized capital redemption reserve is created when a as part of the cost till all the activities necessary company purchases its own shares out of free to prepare the qualifying asset for its intended reserves or share premium. A sum equal to the use or sale are substantially completed. The nominal value of the shares so purchased is cost and related accumulated depreciation transferred to capital redemption reserve. The are derecognized upon sale or disposition reserve can be utilized in accordance with the of the asset and the resultant gains or losses provisions of Section 69 of the Companies Act, are recognized in the consolidated statement 2013. As at March 31, 2024, 2025 and 2026, of income. capital redemption reserve amounting to I 1,661, Capital work-in-progress are measured at cost I Nil and I Nil respectively, is not freely available less accumulated impairment losses, if any. for distribution. b) Depreciation i) Dividend The Company depreciates property, plant and A final dividend on common stock is recorded equipment over the estimated useful life on a as a liability on the date of approval by the straight-line basis from the date the assets are shareholders. An interim dividend is recorded available for use. Leasehold improvements are as a liability on the date of declaration by the amortized over the shorter of estimated useful Company’s Board of Directors. life of the asset or the related lease term. Term licenses are amortized over their respective j) Buyback of equity shares contract term. Freehold land is not depreciated. The buyback of equity shares, including tax The estimated useful life of assets is reviewed thereon and related transaction costs are and where appropriate are adjusted, annually. recorded as a reduction of share premium and The estimated useful lives of assets are retained earnings. Further, capital redemption as follows: reserve is created as an apportionment from Category Useful life retained earnings. REPORT 2025-26 Buildings 28 to 40 years ANNUAL k) Bonus issue Plant and equipment 5 to 21 years Computer equipment and 2 to 7 years INTEGRATED For the purpose of bonus issue, the amount is software transferred from capital redemption reserves, )XUQLWXUH__Ù[WXUHV_DQG_ 5 years share premium and retained earnings to the equipment share capital. Vehicles 4 to 5 years WIPRO


LOGO

439 Notes to the Consolidated Financial Statements in millions, except share and per share data, unless otherwise stated) (I Whenpartsofanitemofproperty,plantandequipment Goodwill associated with disposal of an operation have different useful lives, they are accounted for as that is part of a cash-generating unit is measured separate items (major components) of property, plant based on the relative values of the operation and equipment. Subsequent expenditure relating to disposed of and the portion of the cash-generating property, plant and equipment is capitalized only unit retained, unless some other method better when it is probable that future economic benefits reflects the goodwill associated with the operation associated with these will flow to the Company and disposed of. the cost of the item can be measured reliably. Deposits and advances paid towards the acquisition c) Intangible assets of property, plant and equipment outstanding as at Intangible assets acquired separately are measured each reporting date and the cost of property, plant at cost of acquisition. Intangible assets acquired in a and equipment not available for use before such date business combination are measured at fair value as at are disclosed under capital work-in-progress. the date of acquisition. Following initial recognition, intangible assets are carried at cost less accumulated (vii)Business combinations, goodwill, and amortization and impairment losses, if any. intangible assets The amortization of an intangible asset with a finite a) Business combinations useful life reflects the manner in which the economic benefit is expected to be generated and is included in Business combinations are accounted for using selling and marketing expenses in the consolidated the purchase (acquisition) method. The cost of an statement of income. acquisition is measured as the fair value of the assets The estimated useful life of amortizable intangibles transferred, liabilities incurred or assumed, and is reviewed and where appropriate is adjusted, equity instruments issued at the date of exchange annually. The estimated useful lives of the by the Company. Identifiable assets acquired, and amortizable intangible assets are as follows: liabilities and contingent liabilities assumed in a business combination are measured initially at fair Category Useful life value at the date of acquisition. Transaction costs incurred in connection with a business acquisition Customer-related intangibles 1 to 10 years are expensed as incurred. Marketing-related intangibles to 10 years 2.5 The cost of an acquisition also includes the fair value Customer-related intangibles includes customer of any contingent consideration measured as at the contracts and customer relationships acquired date of acquisition. Any subsequent changes to as a part of business combinations. Marketing-the fair value of contingent consideration classified related intangibles includes vendor relationships, as liabilities, other than measurement period non-competes and brands acquired as a part of adjustments, are recognized in the consolidated business combinations. statement of income. (viii) Leases b) Goodwill The Company evaluates each contract or arrangement, The excess of the cost of an acquisition over the whether it qualifies as lease as defined under IFRS 16. Company’s share in the fair value of the acquiree’s identifiable assets and liabilities is recognized as The Company as a lessee goodwill. If the excess is negative, a bargain purchase gain is recognized immediately in the consolidated The Company enters into an arrangement for lease of statement of income. Goodwill is measured at cost land, buildings, plant and equipment including computer less accumulated impairment (if any). equipment and vehicles. Such arrangements are generally for a fixed period but may have extension or termination 


LOGO

440 STATUTORY REPORTS AND FINANCIAL STATEMENTS CONSOLIDATED FINANCIAL STATEMENTS UNDER IFRS Notes to the Consolidated Financial Statements (I in millions, except share and per share data, unless otherwise stated) options. The Company assesses, whether the contract The Company applies IAS 36 to determine whether a is, or contains, a lease, at its inception. A contract is RoU asset is impaired and accounts for any identified considered to contain a lease if it conveys the right to impairment loss as described in the impairment of control the use of an identified asset for a period of non-financial assets below. time in exchange for consideration. For lease liabilities at the commencement of the lease, A contract conveys the right to control the use of an the Company measures the lease liability at the present identified asset if the Company has the right to: value of the lease payments that are not paid at that (a) control use of an identified asset, date. The lease payments are discounted using the interest rate implicit in the lease, if that rate is readily (b) obtain substantially all the economic benefits determined, if that rate is not readily determined, the from use of the identified asset, and lease payments are discounted using the incremental (c) direct the use of the identified asset. borrowing rate that the Company would have to pay to borrow funds, including the consideration of factors The Company determines the lease term as the non- such as the nature of the asset and location, collateral, cancellable period of a lease, together with periods market terms and conditions, as applicable in a similar covered by an option to extend the lease, where economic environment. the Company is reasonably certain to exercise that After the commencement date, the amount of lease option. The Company makes an assessment on the liabilities is increased to reflect the accretion of expected lease term on a lease-by-lease basis and interest and reduced for the lease payments made. thereby assesses whether it is reasonably certain that any options to extend or terminate the contract will The lease liability is subsequently remeasured by be exercised. increasing the carrying amount to reflect interest on At the commencement of the lease, the Company the lease liability, reducing the carrying amount to recognizes a right of use (“RoU”) asset at cost and reflect the lease payments made and remeasuring corresponding lease liability, except for leases with the carrying amount to reflect any lease modifications. term of twelve months or less (“Short-term leases”) and The Company recognizes the amount of the re-low-value assets. For these Short-term leases and measurement of lease liability due to modification low-value assets, the Company recognizes the lease as an adjustment to the RoU asset or in consolidated payments as an operating expense on a straight-line statement of income, depending upon the nature basis over the lease term. of modification. Where the carrying amount of the RoU asset is reduced to zero and there is a further The cost of the RoU assets comprises the amount of reduction in the measurement of the lease liability, the initial measurement of the lease liability, any lease the Company recognizes any remaining amount of payments made at or before the inception date of the the re-measurement in the consolidated statement lease plus any initial direct costs, plus an estimate of of income. costs to be incurred by the lessee in dismantling and Payment of lease liabilities including interests are removing the underlying asset or restoring the site on classified as cash used in financing activities in the which it is located less any lease incentives received. consolidated statement of cash flows. Subsequently, the RoU assets are measured at cost REPORT 2025-26 less any accumulated depreciation and accumulated ANNUAL impairment losses, if any. The RoU assets are The company as a lessor depreciated using the straight-line method from the Leases under which the Company is a lessor are commencement date over the shorter of lease term INTEGRATED classified as a finance or operating lease. Lease or useful life of RoU assets. The estimated useful lives contracts where all the risks and rewards are of RoU assets are determined on the same basis as substantially transferred to the lessee are classified those of property, plant and equipment. as a finance lease. All other leases are classified as WIPRO operating lease.


LOGO

441 Notes to the Consolidated Financial Statements (I in millions, except share and per share data, unless otherwise stated) For leases under which the Company is an intermediate _ E__1RQ_ÙQDQFLDO_DVVHWV lessor, the Company accounts for the head-lease and the The Company assesses long-lived assets such as sub-lease as two separate contracts. The sub-lease is property, plant and equipment, RoU assets and further classified either as a finance lease or an operating intangible assets for impairment whenever events lease by reference to the RoU asset arising from the head-or changes in circumstances indicate that the lease. carrying amount of an asset or group of assets may (ix) Inventories not be recoverable. If any such indication exists, the Company estimates the recoverable amount of the Inventories are valued at lower of cost and net realizable asset or group of assets. value, including necessary provision for obsolescence. Goodwill is tested for impairment at least annually at Cost is determined using the weighted average method. the same time and when events occur or changes in circumstances indicate that the recoverable amount (x) Impairment of the cash generating unit is less than its carrying value. The goodwill impairment test is performed a) Financial assets at the level of cash-generating unit or groups of The Company applies the expected credit loss cash -generating units which represents the lowest model for recognizing impairment loss on financial level at which goodwill is monitored for internal assets measured at amortized cost, debt instruments management purposes. classified as FVTOCI, trade receivables, unbilled The recoverable amount of an asset or cash receivables, finance lease receivables, and other generating unit is the higher of its fair value less financial assets. Expected credit loss is the difference cost of disposal (“FVLCD”) and its value-in-use between the contractual cash flows and the cash (“VIU”). The VIU of long-lived assets is calculated flows that the entity expects to receive, discounted using projected future cash flows. FVLCD of a cash using the effective interest rate. generating unit is computed using turnover and Loss allowances for trade receivables, unbilled earnings multiples. If the recoverable amount of receivables and finance lease receivables are the asset or the recoverable amount of the cash measured at an amount equal to lifetime expected generating unit to which the asset belongs is less credit loss. Lifetime expected credit losses are than its carrying amount, the carrying amount is the expected credit losses that result from all reduced to its recoverable amount. The reduction possible default events over the expected life of a is treated as an impairment loss and is recognized in financial instrument. Lifetime expected credit loss is the consolidated statement of income. computed based on a provision matrix which takes If at the reporting date, there is an indication that a into account, risk profiling of customers and historical previously assessed impairment loss on property, credit loss experience adjusted for forward-looking plant and equipment, RoU assets and intangible information. For other financial assets, expected assets, no longer exists, the recoverable amount is credit loss is measured at the amount equal to reassessed and the impairment losses previously twelve months expected credit loss unless there has recognized are reversed such that the asset is been a significant increase in credit risk from initial recognized at its recoverable amount but not recognition, in which case those are measured at exceeding written down value which would have lifetime expected credit loss. been reported if the impairment losses had not been recognized initially. An impairment loss in respect of goodwill is not reversed subsequently.


LOGO

442 STATUTORY REPORTS AND FINANCIAL STATEMENTS CONSOLIDATED FINANCIAL STATEMENTS UNDER IFRS Notes to the Consolidated Financial Statements (I in millions, except share and per share data, unless otherwise stated) (xi) Employee benefits The Company has the following employee benefit plans: a) Post-employment plans A. Provident fund The Group participates in various employee benefit plans. Pensions and other post- Eligible employees receive benefits employment benefits are classified as either under the Company’s provident fund defined contribution plans or defined benefit plan, into which both the employer and plans. Under a defined contribution plan, the employees make periodic contributions Company’s sole obligation is to pay a fixed to the approved provident fund trust amount with no obligation to pay further managed by the Company. A portion of contributions if the fund does not hold sufficient the employer’s contribution is made to assets to pay all employee benefits. The related the government administered pension actuarial and investment risks are borne by fund. The contributions to the provident the employee. The expenditure for defined fund trust managed by the Company is contribution plans is recognized as an expense accounted for as a defined benefit plan as during the period when the employee provides the Company is liable for any shortfall in service. Under a defined benefit plan, it is the the fund assets based on the government Company’s obligation to provide agreed benefits specified minimum rates of return. to the employees. The related actuarial and Certain employees receive benefits investment risks are borne by the Company. The under the provident fund plan in which present value of the defined benefit obligations both the employer and employees make is calculated by an independent actuary using periodic contributions to the government the projected unit credit method. administered provident fund. A portion of Remeasurements of the defined benefit plans, the employer’s contribution is made to the comprising actuarial gains or losses, the effect government administered pension fund. of changes to the asset ceiling, and the return on This is accounted as a defined contribution plan assets (excluding interest) are immediately plan as the obligation of the Company recognized in other comprehensive income, net is limited to the contributions made to of taxes and not reclassified to profit or loss in the fund. subsequent period. B. Gratuity and foreign pension Net interest recognized in profit or loss is calculated by applying the discount rate used to In accordance with the Code on Social measure the defined benefit obligation to the net Security, 2020, applicable for Indian defined benefit liability or asset. The actual return companies, the Company provides for a on the plan assets above or below the discount lump sum payment to eligible employees, rate, is recognized as part of remeasurements at retirement or termination of employment of the defined benefit plans through other based on the last drawn salary and years comprehensive income, net of taxes. of employment with the Company. The REPORT 2025-26 gratuity fund is managed by third party Past service cost, both vested and unvested, fund managers. ANNUAL is recognized as an expense at the earlier of (a) when the plan amendment or curtailment occurs; The Company also maintains pension and INTEGRATED and (b) when the entity recognizes related similar plans for employees outside India, restructuring costs or termination benefits. based on country specific regulations. These plans are partially funded, and WIPRO


LOGO

443 Notes to the Consolidated Financial Statements (I in millions, except share and per share data, unless otherwise stated) the funds are managed by third party fund cost of compensated absences as the additional managers. The plans provide for monthly amount that the Company expects to pay as a result payout after retirement as per salary drawn and of the unused entitlement that has accumulated service period or for a lump sum payment as set at the end of the reporting period. The Company out in rules of each fund. recognizes accumulated compensated absences The Company’s obligations in respect of these based on actuarial valuation using the projected plans, which are defined benefit plans, are unit credit method. Non-accumulating compensated provided for based on actuarial valuation using absences are recognized in the period in which the the projected unit credit method. absences occur. C. Superannuation (xii) Share-based payment transactions Superannuation plan, a defined contribution scheme Selected employees of the Company receive remuneration is administered by third party fund managers. in the form of equity settled instruments or cash settled The Company makes annual contributions instruments, for rendering services over a defined based on a specified percentage of each eligible vesting period and for Company’s performance-based employee’s salary. stock options over the defined period. Equity instruments granted are measured by reference to the fair value of _E__7HUPLQDWLRQ_EHQHÙWV the instrument at the date of grant. In cases, where equity instruments are granted at a nominal exercise price, the Termination benefits are expensed when the intrinsic value on the date of grant approximates the fair Company can no longer withdraw the offer of value. The expense is recognized in the consolidated those benefits. statement of income with a corresponding increase to the share-based payment reserve, a component of equity. _ F__ 6KRUW_WHUP_EHQHÙWV The equity instruments or cash settled instruments Short-term employee benefit obligations such as generally vest in a graded manner over the vesting period. cash bonus, management incentive plans or profit- The fair value determined at the grant date is expensed sharing plans are measured on an undiscounted over the vesting period of the respective tranches of such basis and are recorded as expense as the related grants (accelerated amortization). The stock compensation service is provided. A liability is recognized for the expense is determined based on the Company’s estimate amount expected to be paid under short-term cash of equity instruments or cash settled instruments that will bonus or management incentive plans or profit- eventually vest. sharing plans, if the Company has a present legal or Cash settled instruments granted are re-measured by constructive obligation to pay this amount as a result reference to the fair value at the end of each reporting of past service provided by the employee and the period and at the time of vesting. The expense is obligation can be estimated reliably. recognized in the consolidated statement of income with a corresponding increase to financial liability. d) Compensated absences The employees of the Company are entitled to (xiii)Provisions compensated absences. The employees can carry Provisions are recognized when the Company has a forward a portion of the unutilized accumulating present obligation (legal or constructive), as a result of compensated absences and utilize it in future a past event, it is probable that an outflow of economic periods or receive cash at retirement or termination benefits will be required to settle the obligation and of employment. The Company records an obligation a reliable estimate can be made of the amount of for compensated absences in the period in which the the obligation. employee renders the services that increases this entitlement. The Company measures the expected The amount recognized as a provision is the best estimate of the consideration required to settle the 


LOGO

444 STATUTORY REPORTS AND FINANCIAL STATEMENTS CONSOLIDATED FINANCIAL STATEMENTS UNDER IFRS Notes to the Consolidated Financial Statements (I in millions, except share and per share data, unless otherwise stated) present obligation at the end of the reporting period, At contract inception, the Company assesses its considering the risks and uncertainties surrounding promise to transfer products or services to a customer the obligation. to identify separate performance obligations. The When some or all of the economic benefits required Company applies judgment to determine whether to settle a provision are expected to be recovered each product or service promised to a customer from a third party, the receivable is recognized as an is capable of being distinct, and are distinct in the asset, if it is virtually certain that reimbursement will context of the contract, if not, the promised products be received, and the amount of the receivable can be or services are combined and accounted as a single measured reliably. performance obligation. The Company allocates the Transaction Price to separately identifiable Provisions for onerous contracts are recognized when performance obligations based on their relative stand-the expected benefits to be derived by the Company alone selling price or residual method. Stand-alone from a contract are lower than the unavoidable costs selling prices are determined based on sale prices of meeting the future obligations under the contract. for the components when they are regularly sold Provisions for onerous contracts are measured at separately, in cases where the Company is unable to the present value of lower of the expected net cost determine the stand-alone selling price, the Company of fulfilling the contract and the expected cost of uses third-party prices for similar deliverables or the terminating the contract. Company uses expected cost-plus margin approach in estimating the stand-alone selling price. (xiv) Revenue For performance obligations where control is transferred over time, revenues are recognized The Company derives revenue primarily from software by measuring progress towards completion of the development, maintenance of software/hardware performance obligation. The selection of the method and related services, consulting services, business to measure progress towards completion requires process services and sale of IT products. judgment and is based on the nature of the promised Revenues from customer contracts are considered products or services to be provided. for recognition and measurement when the contract The method for recognizing revenues and costs has been approved by the parties to the contract, the depends on the nature of contracts with customers parties to contract are committed to perform their as given below: respective obligations under the contract, and the contract is legally enforceable. Revenue is recognized upon transfer of control of promised products or A. Time and materials contracts services to customers in an amount that reflects the Revenues and costs relating to time and materials consideration the Company expects to receive (the contracts are recognized as the related services “Transaction Price”). Revenue towards satisfaction of are rendered. a performance obligation is measured at the amount of the Transaction Price (net of variable consideration _ %__)L[HG_SULFH_FRQWUDFWV on account of discounts and allowances) allocated to that performance obligation. To recognize revenues, _ _ L__ )L[HG_SULFH_GHYHORSPHQW_FRQWUDFWV REPORT 2025-26 the Company applies the following five step approach: Revenues from fixed-price development ANNUAL (1) identify the contract with a customer, (2) identify the contracts, including software development, performance obligations in the contract, (3) determine and integration contracts, where the INTEGRATED the Transaction Price, (4) allocate the Transaction performance obligations are satisfied over Price to the performance obligations in the contract, time, are recognized using the “percentage-and (5) recognize revenues when a performance of-completion” method. The performance obligation is satisfied. When there is uncertainty as to obligations are satisfied as and when the collectability, revenue recognition is postponed until such uncertainty is resolved. services are rendered since the customer WIPRO generally obtains control of the work as 


LOGO

445 Notes to the Consolidated Financial Statements (I in millions, except share and per share data, unless otherwise stated) it progresses. Percentage of completion is basis when services are performed through determined based on project costs incurred to an indefinite number of repetitive acts over a date as a percentage of total estimated project specified period or ratably using percentage costs required to complete the project. The of completion method when the pattern of cost expended (or input) method has been benefits from the services rendered to the used to measure progress towards completion customers and the cost to fulfil the contract as there is a direct relationship between input is not even through the period of contract and productivity. This method is followed because the services are generally discrete in when reasonably dependable estimates of nature and not repetitive. the revenues and costs applicable to various Revenue for contracts in which the invoicing elements of the contract can be made. Key is representative of the value being delivered factors that are reviewed in estimating the is recognized based on our right to invoice. future costs to complete include estimates of If our invoicing is not consistent with value future labor costs and productivity efficiencies. delivered, revenues are recognized as the Because the financial reporting of these service is performed using the percentage of contracts depends on estimates that are completion method. assessed continually during the term of these contracts, revenue recognized, profit and In certain projects, a fixed quantum of service or timing of revenue for remaining performance output units is agreed at a fixed-price for a fixed obligations are subject to revisions as the term. In such contracts, revenue is recognized contract progresses to completion. If the with respect to the actual output achieved till Company is not able to reasonably measure the date as a percentage of total contractual output. progress of completion, revenue is recognized Any residual service unutilized by the customer only to the extent of costs incurred, for which is recognized as revenue on completion of recoverability is probable. When total cost the term. estimates exceed revenues in an arrangement, the estimated losses are recognized in the iii. Element or Volume based contracts consolidated statement of income in the period Revenues and costs are recognized as the in which such losses become probable based related services are rendered. on the current contract estimates as an onerous contract provision. C. Products A contract asset is a right to consideration that is conditional upon factors other than the Revenue on product sales are recognized when the passage of time. Contract assets primarily customer obtains control of the specified product. relate to unbilled amounts on fixed-price development contracts and are classified as D. Others non-financial asset as the contractual right to • Any change in scope or price is considered to be a consideration is dependent on completion of contract modification. The Company accounts for contractual milestones. modifications to existing contracts by assessing A contract liability is an entity’s obligation to whether the services added are distinct and transfer goods or services to a customer for whether the pricing is at the stand-alone selling which the entity has received consideration (or price. Services added that are not distinct are the amount is due) from the customer. accounted for on a cumulative catch up basis, while those that are distinct are accounted for ii. Maintenance contracts prospectively, either as a separate contract if the Revenues related to fixed-price maintenance additional services are priced at the stand-alone contracts are recognized on a straight-line selling price, or as a termination of the existing 


LOGO

446 STATUTORY REPORTS AND FINANCIAL STATEMENTS CONSOLIDATED FINANCIAL STATEMENTS UNDER IFRS Notes to the Consolidated Financial Statements (I in millions, except share and per share data, unless otherwise stated) contract and creation of a new contract if not costs or efforts are subject to revision as the priced at the stand-alone selling price. contract progresses. • The Company accounts for variable • The Company accrues the estimated cost considerations like volume discounts, of warranties at the time when the revenue rebates and pricing incentives to customers is recognized. The accruals are based on the and penalties as reduction of revenue on a Company’s historical experience of material systematic and rational basis over the period usage and service delivery costs. of the contract. The Company estimates • Incremental costs that relate directly to a an amount of such variable consideration contract and incurred in securing a contract using expected value method or the single with a customer are recognized as an asset most likely amount in a range of possible when the Company expects to recover consideration depending on which method these costs. better predicts the amount of consideration to which the Company may be entitled and • The Company recognizes contract fulfilment when it is probable that a significant reversal cost as an asset if those costs specifically of cumulative revenue recognized will not relate to a contract or to an anticipated occur when the uncertainty associated with contract, the costs generate or enhance the variable consideration is resolved. resources that will be used in satisfying • Revenues are shown net of allowances/ performance obligations in future; and the returns, sales tax, value added tax, goods and costs are expected to be recovered. services tax and applicable discounts. • Costs to obtain contracts relating to upfront • The Company may enter into arrangements payments to customers are amortized to with third-party suppliers to resell products revenue and other costs to obtain contracts or services. In such cases, the Company and costs to fulfil contracts are amortized to evaluates whether the Company is the cost of revenues over the respective contract principal (i.e., report revenues on a gross life on a systematic basis consistent with the basis) or agent (i.e., report revenues on a transfer of goods or services to customer to net basis). In doing so, the Company first which the asset relates. evaluates whether the Company controls the • The Company assesses the timing of the good or service before it is transferred to the transfer of goods or services to the customer customer. The Company considers whether it as compared to the timing of payments to has the primary obligation to fulfil the contract, determine whether a significant financing inventory risk, pricing discretion and other component exists. As a practical expedient, factors to determine whether it controls the the Company does not assess the existence goods or services and therefore, is acting as a of a significant financing component when the principal or an agent. If the Company controls difference between payment and transfer of the good or service before it is transferred to deliverables is twelve months or less. If the the customer, the Company is the principal; if difference in timing arises for reasons other REPORT 2025-26 not, the Company is the agent. than the provision of finance to either the ANNUAL • Estimates of the Transaction Price and total customer or us, no financing component is costs or efforts are continuously monitored deemed to exist. INTEGRATED over the term of the contract and are • Unbilled receivables are classified as a recognized in net profit in the period when financial asset where the right to consideration these estimates change or when the estimates is unconditional and only the passage of time are revised. Revenues and the estimated total is required before the payment is due. WIPRO


LOGO

447 Notes to the Consolidated Financial Statements (I in millions, except share and per share data, unless otherwise stated) (xv)Financeexpenses and where it intends either to settle on a net basis, or to realize the asset and liability simultaneously. Finance expenses comprise interest on loans, borrowings and bank overdrafts, interest on lease liabilities, interest on _ E__‘HIHUUHG_LQFRPH_WD[ tax matters, interest on net defined benefit liability, interest on liability on written put options, net loss on translation Deferred income tax is recognized using the balance or settlement of foreign currency borrowings, changes in sheet approach. Deferred income tax assets and fair value of derivative instruments and gains/(losses) of liabilities are recognized for deductible and taxable settlement of borrowing related derivative instruments. temporary differences arising between the tax base Borrowing costs that are not directly attributable to a of assets and liabilities and their carrying amount qualifying asset are recognized in the consolidated in financial statements, except when the deferred statement of income using the effective interest method. income tax arises from the initial recognition of goodwill or an asset or liability in a transaction that (xvi) Finance and other income is not a business combination and affects neither accounting nor taxable profits or loss at the time of Finance and other income comprise interest income on the transaction. deposits, dividend income, gains/(losses) on disposal of investments, gains/(losses) on investments classified as Deferred income tax assets are recognized to FVTPL, net gain on translation or settlement of foreign the extent it is probable that taxable profit will be currency borrowings and changes in fair value and gains/ available against which the deductible temporary (losses) on settlement of related derivative instruments. differences and the carry forward of unused tax Interest income is recognized using the effective interest credits and unused tax losses can be utilized. method. Dividend income is recognized when the right to Deferred income tax liabilities are recognized for receive payment is established. all taxable temporary differences except in respect of taxable temporary differences that is expected (xvii) Income tax to reverse within the tax holiday period, taxable Income tax comprises current and deferred tax. Income temporary differences associated with investments tax expense is recognized in the consolidated statement in subsidiaries, associates and foreign branches of income except to the extent it relates to a business where the timing of the reversal of the temporary combination, or items directly recognized in equity or in difference can be controlled and it is probable that other comprehensive income. the temporary difference will not reverse in the foreseeable future. _ D__&XUUHQW_LQFRPH_WD[ The carrying amount of deferred income tax assets Current income tax for the current and prior periods is reviewed at each reporting date and reduced to are measured at the amount expected to be the extent that it is no longer probable that sufficient recovered from or paid to the taxation authorities taxable profit will be available to allow all or part of based on the taxable income for the period. The tax the deferred income tax asset to be utilized. rates and tax laws used to compute the current tax Deferred income tax assets and liabilities are amounts are those that are enacted or substantively measured at the tax rates that are expected to enacted as at the reporting date and applicable for apply in the period when the asset is realized, or the the period. While determining the tax provisions, liability is settled, based on tax rates (and tax laws) the Company assesses whether each uncertain tax that have been enacted or substantively enacted at position is to be considered separately or together the reporting date. with one or more uncertain tax positions depending The Company offsets deferred income tax assets and upon the nature and circumstances of each uncertain liabilities, where it has a legally enforceable right to tax position. The Company offsets current tax assets offset current tax assets against current tax liabilities, and current tax liabilities, where it has a legally and they relate to taxes levied by the same taxation enforceable right to set off the recognized amounts 


LOGO

448 STATUTORY REPORTS AND FINANCIAL STATEMENTS CONSOLIDATED FINANCIAL STATEMENTS UNDER IFRS Notes to the Consolidated Financial Statements (I in millions, except share and per share data, unless otherwise stated) authority on either the same taxable entity, or on well as require the disclosure of information that different taxable entities where there is a right enables users of financial statements to understand and an intention to settle the current tax liabilities the impact of a currency not being exchangeable. and assets on a net basis or their tax assets and These amendments are effective for annual reporting liabilities will be realized simultaneously. periods beginning on or after January 1, 2025, with earlier application permitted. The adoption of (xviii) Earnings per share amendments to IAS 21 did not have any material impact on the consolidated financial statements. Basic earnings per share is computed using the weighted average number of equity shares New accounting standards, amendments outstanding during the period adjusted for treasury shares held. Diluted earnings per share is computed and interpretations not yet adopted by using the weighted average number of equity and WKHb&RPSDQ¥_ dilutive equivalent shares outstanding during the Certain new standards, amendments to standards period, using the treasury stock method for options, and interpretations are not yet effective for annual except where the results would be anti-dilutive. periods beginning after April 1, 2025 and have The number of equity shares and potentially dilutive not been applied in preparing these consolidated equity shares are adjusted retrospectively for all financial statements. New standards, amendments to periods presented for any splits and bonus shares standards and interpretations that could have potential issues including for change effected prior to the impact on the consolidated financial statements of the approval of the consolidated financial statements by Company are: the Company’s Board of Directors. IFRS 18 – Presentation and Disclosure in Financial (xix) Statement of cash flows Statements Cash flows are reported using the indirect method, On April 9, 2024, IASB issued IFRS 18 ‘Presentation and whereby profit for the period is adjusted for the effects Disclosure in Financial Statements’ which supersedes of transactions of a non-cash nature, any deferrals or IAS 1 ‘Presentation of Financial Statements’, aimed accruals of past or future operating cash receipts or at improving comparability and transparency of payments and item of income or expenses associated communication in financial statements. IFRS 18 with investing or financing cash flows. The cash requires an entity to classify all income and expenses generated from/(used in) operating, investing and within its statement of profit or loss into one of five financing activities of the Company are segregated. categories: operating, investing, financing, income taxes and discontinued operations. These categories New accounting standards, amendments are complemented by the requirement to present specified totals and subtotals for ‘operating profit and interpretations adopted by the or loss’, ‘profit or loss before financing and income &RPSDQ¥_HIIHFWLYH_IURP_$SULO_________ taxes’ and ‘profit or loss’. It also requires disclosure of management-defined performance measures Amendments to IAS 21 – The Effects of Changes in and includes new requirements for aggregation and REPORT 2025-26 )RUHLJQ_([FKDQJH_5DWHV disaggregation of financials information based on the ANNUAL identified ‘roles’ of the primary financial statements On August 15, 2023, IASB issued ‘Lack of and the notes. INTEGRATED Exchangeability (Amendments to IAS 21)’ that clarifies how an entity should assess whether a currency is Consequent to above, a narrow scope of amendments exchangeable and how it should determine a spot have been made to IAS 7 ‘Statement of Cash Flows’, exchange rate when exchangeability is lacking, as which include changing the starting point for WIPRO


LOGO

449 Notes to the Consolidated Financial Statements (I in millions, except share and per share data, unless otherwise stated) determining cash flows from operations under the indirect clarify that a financial liability is derecognized on the method from ‘profit or loss’ to ‘operating profit or loss’. ‘settlement date’ and introduce an accounting policy Further, some requirements previously included within choice to derecognize financial liabilities settled using IAS 1 have been moved to IAS 8 ‘Accounting Policies, an electronic payment system before settlement date. Changes in Accounting Estimates and Errors’ which The classification of financial asset with ESG linked has also been renamed IAS 8 ‘Basis of Preparation of features has been clarified through additional guidance Financial Statements’. IAS 34 ‘Interim Financial Reporting’ on the assessment of contingent features. Additional was amended to require disclosure of management disclosures are introduced for financial instruments with defined performance measures. Minor consequential contingent features and equity instruments classified as amendments to other standards were also made. fair value through OCI. These amendments are effective An entity that prepares condensed interim financial for annual reporting periods beginning on or after January statements in accordance with IAS 34 in the first year 1, 2026, with earlier application permitted. The Company of adoption of IFRS 18, must present the heading and is currently assessing the impact of adopting these mandatory subtotals it expects to use in its annual financial amendments on the consolidated financial statements. statement. Comparative period in both the interim and Amendments to IFRS 9 and IFRS 7—Contracts annual financial statements will need to be restated and a referencing Nature-dependent electricity reconciliation of the statement of profit or loss previously published will be required for the immediately preceding The IASB has published amendments to IFRS 9 and comparative period. IFRS 18 and the amendments to IFRS 7 titled ‘Contracts Referencing Nature-dependent the other standards, is effective for reporting period Electricity’. The IASB has added application guidance to beginning on or after January 1, 2027 and are to be IFRS 9 to address specifically whether a contract to buy applied retrospectively, with earlier application permitted. electricity generated from a source dependent on natural conditions is held for the entity’s own-use expectations. The Company is currently assessing the impact of adopting The amendments also address specifically how an entity IFRS 18 and the amendments to other standards, on the applies the hedge accounting requirements in IFRS 9 when consolidated financial statements. a contract referencing nature-dependent electricity with a variable nominal amount is designated as the hedging _ _$PHQGPHQWV_WR_,)56___DQG_,)56___Ł_&ODVVLŮFDWLRQ_DQG_ instrument. The IASB decided to add complementary Measurement of Financial Instruments disclosure requirements to IFRS 7. The amendments are On May 30, 2024, IASB issued ‘Classification and effective for annual periods beginning on or after January Measurement of Financial Instruments (Amendments to 1, 2026, with earlier application permitted. The Company IFRS 9 and IFRS 7)’ to address matters identified during the is currently assessing the impact of adopting these post-implementation review of IFRS 9. The amendments amendments on the consolidated financial statements.


LOGO

450 STATUTORY REPORTS AND FINANCIAL STATEMENTS CONSOLIDATED FINANCIAL STATEMENTS UNDER IFRS Notes to the Consolidated Financial Statements (I in millions, except share and per share data, unless otherwise stated) 4. PROPERTY, PLANT AND EQUIPMENT Plant and Furniture 2IÙFH Land Buildings (1) Vehicles Total equipment DQG_Ù[WXUHV equipment *URVV_FDUU¥LQJ_YDOXH_ As at April 1, 2024 C 4,375 C 47,024 C 102,513 C 18,233 C 7,514 C 34 C 179,693 Additions—6,215 10,623 3,143 943 10 20,934 Additions through Business — 9 ——9 combinations (Refer to Note 7) Disposals (6) (680) (13,668) (1,803) (793) (9) (16,959) Translation adjustment 4 (3) 77 3 (1) (1) 79 As at March 31, 2025 K 4,373 K 52,556 K 99,554 K 19,576 K 7,663 K 34 K 183,756 Accumulated depreciation/ LPSDLUPHQW_ As at April 1, 2024 C- C 11,775 C 75,549 C 12,287 C 5,932 C 22 C 105,565 Depreciation and impairment—1,662 11,050 2,229 623 4 15,568 Disposals—(410) (13,189) (1,526) (730) (8) (15,863) Translation adjustment—(30) 49 (1) (4) (1) 13 As at March 31, 2025 K—K 12,997 K 73,459 K 12,989 K 5,821 K 17 K 105,283 Net carrying value as at March 31, 2025 K 4,373 K 39,559 K 26,095 K 6,587 K 1,842 K 17 K 78,473 Capital work-in-progress C 2,211 Net carrying value including &DSLWDObZRUN_LQ_SURJUHVV_DV_DW_ K 80,684 March 31, 2025 *URVV_FDUU¥LQJ_YDOXH_ As at April 1, 2025 I 4,373 I 52,556 I 99,554 I 19,576 I 7,663 I 34 I 183,756 Additions—923 9,253 1,795 737 3 12,711 Additions through Business —131 109 22 99 1 362 combination (Refer to Note 7) Disposals—(821) (14,979) (1,449) (720) (2) (17,971) Translation adjustment 31 440 3,182 270 147 1 4,071 As at March 31, 2026 K 4,404 K 53,229 K 97,119 K 20,214 K 7,926 K 37 K 182,929 Accumulated depreciation/ LPSDLUPHQW_ As at April 1, 2025 I—I 12,997 I 73,459 I 12,989 I 5,821 I 17 I 105,283 Depreciation and impairment—1,848 9,669 2,387 686 5 14,595 Disposals—(695) (14,730) (1,245) (697) (1) (17,368) 2025-26 Translation adjustment—211 2,670 197 116 1 3,195 REPORT As at March 31, 2026 K—K 14,361 K 71,068 K 14,328 K 5,926 K 22 K 105,705 Net carrying value as at K 4,404 K 38,868 K 26,051 K 5,886 K 2,000 K 15 K 77,224 March 31, 2026 ANNUAL &DSLWDO_ZRUN_LQ_SURJUHVVb(2) I 4,563 Net carrying value including INTEGRATED &DSLWDObZRUN_LQ_SURJUHVV_DV_DW_ K 81,787 0DUFKb________ (1) Including net carrying value of computer equipment and software amounting to I 16,003 and I 16,719, as at March 31, 2025 and 2026, respectively. (2) Including capital advance of I 15 and Capital work-in-progress of I 6 on account of additions through business combination. (Refer to Note 7) WIPRO


LOGO

451 Notes to the Consolidated Financial Statements (I in millions, except share and per share data, unless otherwise stated) 5. RIGHT-OF-USE ASSETS Category of Right-of-Use asset Plant and Land Buildings Vehicles Total equipment *URVV_FDUU¥LQJ_YDOXH_ As at April 1, 2024 C 1,343 C 28,453 C 2,242 C 849 C 32,887 Additions—10,822 3,735 228 14,785 Disposals (221) (4,389) (632) (354) (5,596) Translation adjustment—152 100 17 269 As at March 31, 2025 K 1,122 K 35,038 K 5,445 K 740 K 42,345 $FFXPXODWHG_GHSUHFLDWLRQ_ As at April 1, 2024 C 98 C 13,237 C 1,086 C 511 C 14,932 Depreciation 21 5,362 539 180 6,102 Disposals (13) (3,776) (303) (319) (4,411) Translation adjustment—81 34 9 124 As at March 31, 2025 K 106 K 14,904 K 1,356 K 381 K 16,747 Net carrying value as at March 31, 2025 K 1,016 K 20,134 K 4,089 K 359 K 25,598 *URVV_FDUU¥LQJ_YDOXH_ As at April 1, 2025 I 1,122 I 35,038 I 5,445 I 740 I 42,345 Additions—7,697—233 7,930 Additions through Business combination (Refer to Note 7)—1,062 — 1,062 Disposals—(5,385) (959) (204) (6,548) Translation adjustment—2,062 593 135 2,790 As at March 31, 2026 K 1,122 K 40,474 K 5,079 K 904 K 47,579 $FFXPXODWHG_GHSUHFLDWLRQ_ As at April 1, 2025 I 106 I 14,904 I 1,356 I 381 I 16,747 Depreciation 19 5,611 875 220 6,725 Disposals—(4,421) (936) (156) (5,513) Translation adjustment—1,054 207 72 1,333 As at March 31, 2026 K 125 K 17,148 K 1,502 K 517 K 19,292 Net carrying value as at March 31, 2026 K 997 K 23,326 K 3,577 K 387 K 28,287 The Company recognized the following expenses in the consolidated statement of income: Year ended Year ended Year ended March 31, 2024 March 31, 2025 March 31, 2026 5HQW_H[SHQVH_UHFRJQL]HGbXQGHU_IDFLOLW¥_H[SHQVHVbSHUWDLQLQJ_WR_ Leases of low-value assets C 245 C 232 I 309 Short-term leases 3,257 3,842 3,304 K 3,502 K 4,074 K 3,613


LOGO

452 STATUTORY REPORTS AND FINANCIAL STATEMENTS CONSOLIDATED FINANCIAL STATEMENTS UNDER IFRS Notes to the Consolidated Financial Statements (I in millions, except share and per share data, unless otherwise stated) Payments toward leases of low-value assets and Short-term leases are disclosed under operating activities in the consolidated statement of cash flows. All other lease payments during the period are disclosed under financing activities in the consolidated statement of cash flows. Income from subleasing RoU assets for the years ended March 31, 2024, 2025 and 2026 is not material. The Company is committed to certain leases amounting to I 999 which have not commenced as of March 31, 2026. The term of such leases ranges from 1 to 5 years. Lease liability Year ended Year ended March 31, 2025 March 31, 2026 Balance at the beginning of the year C 22,728 I 30,218 Additions 16,649 11,680 Additions through Business combinations—1,062 Deletions (967) (1,268) Finance cost accrued during the period 1,593 1,956 Payment of lease liabilities (10,474) (11,561) Translation adjustment 689 2,949 Balance at the end of the year K 30,218 K 35,036 Non-current C 22,193 I 26,327 Current 8,025 8,709 Refer to Note 19 for remaining contractual maturities of lease liabilities. 6. GOODWILL AND INTANGIBLE ASSETS The movement in goodwill balance is given below: Year ended Year ended March 31, 2025 March 31, 2026 Balance at the beginning of the year C 316,002 I 325,014 Acquisition through Business combinations (Refer to Note 7)(1) 1,324 24,772 Translation adjustment 7,688 37,613 Balance at the end of the year K 325,014 K 387,399 (1) Acquisition through business combinations for the year ended March 31, 2026 is after considering the impact of I 7 towards measurement period REPORT 2025-26 changes in the purchase price allocation of acquisitions made during the year ended March 31, 2025. ANNUAL INTEGRATED WIPRO


LOGO

453 Notes to the Consolidated Financial Statements (I in millions, except share and per share data, unless otherwise stated) The Company is organized into two operating segments: IT Services and IT Products (Refer to Note 33). Goodwill as at March 31, 2025 and 2026 has been allocated to the IT Services operating segment. Goodwill recognized on business combinations is allocated to Cash Generating Units (“CGUs”), within the IT Services operating segment, which are expected to benefit from the synergies of the acquisitions. Year ended Year ended March 31, 2025 March 31, 2026 CGUs Americas 1 C 108,111 I 132,869 Americas 2 106,529 122,472 Europe 81,955 96,381 $VLD_3DFLŮF__0LGGOH_(DVW_DQG_$IULFD 28,419 35,677 K 325,014 K 387,399 For impairment testing, goodwill is allocated to a CGU representing the lowest level within the Group at which goodwill is monitored for internal management purposes, and which is not higher than the Company’s operating segment. Goodwill is tested for impairment at least annually in accordance with the Company’s procedure for determining the recoverable value of each CGU. The recoverable amount of the CGU is determined based on FVLCD. The FVLCD of the CGU is determined based on the market capitalization approach, using the turnover and earnings multiples derived from observable market data. The fair value measurement is categorized as a level 2 fair value based on the inputs in the valuation techniques used. Based on the above testing, no impairment was identified as at March 31, 2025 and 2026, as the recoverable value of the CGUs exceeded the carrying value. A sensitivity analysis to the change in the key parameters (turnover and earnings multiples) did not identify any probable scenarios where the CGU’s recoverable amount would fall below its carrying amount. The movement in intangible assets is given below: Intangible assets Customer-related Marketing-related Total *URVV_FDUU¥LQJ_YDOXH_ As at April 1, 2024 C 43,672 C 11,972 C 55,644 Acquisition through Business combinations (Refer to Note 7) 1,896—1,896 Deductions/adjustments (4,101) (2,518) (6,619) Translation adjustment 994 268 1,262 As at March 31, 2025 K 42,461 K 9,722 K 52,183 $FFXPXODWHG_DPRUWL]DWLRQ__LPSDLUPHQW_ As at April 1, 2024 C 18,281 C 4,615 C 22,896 Amortization and impairment(1) 6,327 1,582 7,909 Deductions/adjustments (4,101) (2,518) (6,619) Translation adjustment 443 104 547 As at March 31, 2025 K 20,950 K 3,783 K 24,733 Net carrying value as at March 31, 2025 K 21,511 K 5,939 K 27,450


LOGO

454 STATUTORY REPORTS AND FINANCIAL STATEMENTS CONSOLIDATED FINANCIAL STATEMENTS UNDER IFRS Notes to the Consolidated Financial Statements (I in millions, except share and per share data, unless otherwise stated) Intangible assets Customer-related Marketing-related Total *URVV_FDUU¥LQJ_YDOXH_ As at April 1, 2025 I 42,461 I 9,722 I 52,183 Acquisition through business combinations (Refer to Note 7) 5,644 1,109 6,753 Deductions/adjustments (4,420)—(4,420) Translation adjustment 4,387 1,122 5,509 As at March 31, 2026 K 48,072 K 11,953 K 60,025 $FFXPXODWHG_DPRUWL]DWLRQ__LPSDLUPHQW_ As at April 1, 2025 I 20,950 I 3,783 I 24,733 Amortization and impairmentb___ 6,599 1,188 7,787 Deductions/adjustments (4,420)—(4,420) Translation adjustment 2,252 497 2,749 As at March 31, 2026 K 25,381 K 5,468 K 30,849 Net carrying value as at March 31, 2026 K 22,691 K 6,485 K 29,176 (1) During the years ended March 31, 2025 and 2026, a decline in the revenue and earnings estimates led to a revision of recoverable value of customer-relationship intangible assets and marketing related intangible assets recognized on business combinations. Consequently, the Company has recognized impairment charge I 1,155 and I 851 for the years ended March 31, 2025 and 2026, respectively, as part of amortization and impairment. Amortization expense on intangible assets is included in selling and marketing expenses in the consolidated statement of income. As at March 31, 2026, the net carrying value and the estimated remaining amortization period for intangible assets acquired on acquisition are as follows: Estimated remaining Acquisition Net carrying value amortization period Capco—customer-related intangible I 14,013 4.08 years Capco—marketing-related intangible 5,230 5.08 years DTS—customer-related intangible 5,650 5.67 years DTS—marketing-related intangible 1,045 2.67 years AVT 1,602 0.21—4.72 years Vara Infotech Private Limited 430 0.50—3.50 years 2025-26 Aggne 392 0.87—1.87 years Rational Interaction, Inc. 318 0.89 years REPORT Eximius Design, LLC 371 1.40 years ANNUAL Convergence Acceleration Solutions, LLC 125 2.03 years Total K 29,176 INTEGRATED WIPRO


LOGO

455 Notes to the Consolidated Financial Statements (I in millions, except share and per share data, unless otherwise stated) 7. Business Combinations Summary of acquisitions during the year ended March 31, 2024: During the year ended March 31, 2024, the Company completed a business combination by acquiring a 60% equity interest in Aggne Global Inc. and Aggne Global IT Services Private Limited (“Aggne”), a leading consulting and managed services company serving the insurance and insurtech industries. Aggne is a leading alliance partner of Duck Creek, which is a market-leading platform for property and casualty insurance. The acquisition was consummated on February 13, 2024, for total cash consideration of I 5,525. The following table presents the purchase price allocation: Net assets Ib___ Fair value of property, plant and equipment 374 Fair value of right-of-use assets 33 Fair value of customer-related intangibles 556 Fair value of marketing-related intangibles 390 Deferred tax liabilities on intangible assets (367) 7RWDO_LGHQWLÙDEOH_DVVHWV K 1,180 Goodwill 4,817 Share of non-controlling interests (472) Total purchase price K 5,525 1HW_$VVHWV_LQFOXGH_ Cash and cash equivalents 153 Fair value of acquired trade receivables included in net assets 113 Gross contractual amount of acquired trade receivables 113 Less: Allowance for lifetime expected credit loss -$PRXQW_LQFOXGHG_LQ_JHQHUDO_DQG_DGPLQLVWUDWLYH_H[SHQVHV_ Transaction costs 31 The goodwill of I 4,817 comprises value of acquired workforce and expected synergies arising from the business combination. Goodwill is allocated to IT Services segment and is not deductible for income tax purposes. The interest of non-controlling shareholders is measured at the non-controlling interest’s proportionate share of the fair value of the identifiable net assets of Aggne. The Company has issued put options to non-controlling interests in Aggne in accordance with the terms of underlying shareholders agreement and will be settled in cash. As at the acquisition date, the Company has recorded a financial liability for the estimated present value of its gross obligation to purchase the non-controlling interest with a corresponding adjustment to equity. The fair value of the financial liability is estimated as per the terms of shareholders agreement and the undiscounted fair value of the financial liability is I 5,176 as at the date of acquisition. Considering the discount rate of 5.87%, the discounted fair value of the financial liability is I 4,238. The pro-forma effects of acquisition of Aggne for the year ended March 31, 2024, on the Company’s revenues and profits were not material.


LOGO

456 STATUTORY REPORTS AND FINANCIAL STATEMENTS CONSOLIDATED FINANCIAL STATEMENTS UNDER IFRS Notes to the Consolidated Financial Statements (I in millions, except share and per share data, unless otherwise stated) Summary of acquisitions during the year ended March 31, 2025: During the year ended March 31, 2025, the Company completed a business combination by acquiring a 100% equity interest in Applied Value Technologies, Inc. and Applied Value Technologies B.V., which was consummated on December 16, 2024. The Company has also acquired a 100% equity interest in Applied Value Technologies Pte Limited (together with Applied Value Technologies, Inc. and Applied Value Technologies B.V., “AVT”), which was consummated on January 3, 2025. AVT helps enterprises transform IT operations through a highly customized and data-driven approach. AVT will augment Wipro’s existing application services capabilities, helping drive new growth opportunities. The total consideration (upfront cash to acquire control, deferred consideration and contingent consideration) for the acquisition is I 2,836. During the year ended March 31, 2026, the Company finalized the purchase price allocation as set for the below: The following table presents the purchase price allocation: Net assets I 166 Fair value of property, plant and equipment 9 Fair value of customer-related intangibles 1,896 Deferred tax liabilities on intangible assets (566) 7RWDO_LGHQWLÙDEOH_DVVHWV K 1,505 Goodwill 1,331 Total purchase price K 2,836 1HW_$VVHWV_LQFOXGH_ Cash and cash equivalents I 113 Fair value of acquired trade receivables included in net assets 215 Gross contractual amount of acquired trade receivables 215 Less: Allowance for lifetime expected credit loss -$PRXQW_LQFOXGHG_LQ_JHQHUDO_DQG_DGPLQLVWUDWLYH_H[SHQVHV_ Transaction costs I 45 The goodwill of I 1,331 comprises value of acquired workforce and expected synergies arising from the business combinations. Goodwill is allocated to IT Services segment and is not deductible for income tax purposes. The total consideration for AVT included a deferred consideration of I 264, which was payable within six months from the consummation date and was subsequently settled. The total consideration of AVT includes a contingent consideration linked to achievement of revenues and earnings over a period of 3 years ending December 31, 2027, and range of contingent consideration payable is between I Nil and I 2,122. The fair value of the contingent consideration is estimated by applying the discounted cash- REPORT 2025-26 flow approach considering probability adjusted revenue and earnings estimates. The undiscounted fair value of contingent consideration is I 2,122 as at the date of acquisition. The discounted fair value of contingent consideration ANNUAL of I 1,537 is recorded as part of purchase price allocation. INTEGRATED The pro-forma effects of the acquisition of AVT for the year ended March 31, 2025 on the Company’s revenues and profits were not material. WIPRO


LOGO

457 Notes to the Consolidated Financial Statements (I in millions, except share and per share data, unless otherwise stated) Summary of acquisitions during the year ended March 31, 2026: During the year ended March 31, 2026, the Company completed a business combination by acquiring 100% equity interest in Digital Transformation Solutions unit of Harman International Inc. which is Harman Connected Services Inc. and its subsidiaries and certain other assets (together, “DTS”), a global provider of Engineering, Research and Development (“ER&D”) services and IT services. The acquisition was consummated on December 1, 2025, for total cash consideration of I 34,044. Net assets I 2,996 Fair value of property, plant and equipment 383 Fair value of right-of-use assets 1,062 Fair value of customer-related intangibles 5,644 Fair value of marketing-related intangibles 1,109 Deferred tax liabilities on intangible assets (1,915) 7RWDO_LGHQWLÙDEOH_DVVHWV K 9,279 Goodwill 24,765 Total purchase price K 34,044 1HW_$VVHWV_LQFOXGH_ Cash and cash equivalents I 8,011 Fair value of acquired trade receivables included in net assets 3,066 Gross contractual amount of acquired trade receivables 3,225 Less: Allowance for lifetime expected credit loss (159) $PRXQW_LQFOXGHG_LQ_JHQHUDO_DQG_DGPLQLVWUDWLYH_H[SHQVHV_ Transaction costs K 230 The above purchase price allocation for DTS is provisional and will be finalized as soon as practicable within the measurement period, but in no event later than one year following the date of acquisition. The goodwill of I 24,765 comprises value of acquired workforce and expected synergies arising from the business combinations. Goodwill is allocated to IT Services segment and is not deductible for income tax purposes. The pro-forma effects of acquisition of DTS for the year ended March 31, 2026, on the Company’s results were not material.


LOGO

458 STATUTORY REPORTS AND FINANCIAL STATEMENTS CONSOLIDATED FINANCIAL STATEMENTS UNDER IFRS Notes to the Consolidated Financial Statements (I in millions, except share and per share data, unless otherwise stated) 8. INVESTMENTS As at As at March 31, 2025 March 31, 2026 Non-current Financial instruments at FVTPL Equity instruments(1) 4,955 I I 7,336 Fixed maturity plan mutual funds 1,203—Financial instruments at FVTOCI Equity instruments(1) 12,493 12,143 Financial instruments at amortized cost Inter corporate and term deposits(3) 7,807 8,574 K 26,458 K 28,053 Current Financial instruments at FVTPL Short-term mutual funds(2) 88,776 I I 79,719 Fixed maturity plan mutual funds 300 1,281 Financial instruments at FVTOCI Non-convertible debentures 219,389 210,328 Government securities 10,651 8,948 Commercial papers 2,858 14,227 Bonds 21,138 10,385 Financial instruments at amortized cost Inter corporate and term deposits(3) 68,362 112,792 K 411,474 K 437,680 Total K 437,932 K 465,733 Financial instruments at FVTPL C 95,234 C 88,336 Financial instruments at FVTOCI 266,529 256,031 Financial instruments at amortized cost 76,169 121,366 (1) Uncalled capital commitments outstanding as at March 31, 2025 and 2026, was I 1,576 and I 2,577, respectively. (2) As at March 31, 2025 and 2026, short-term mutual funds include units placed on lien with bank on account of margin money for currency derivatives amounting to I 233 and I Nil, respectively. 2025-26 (3) These deposits earn a fixed rate of interest. As at March 31, 2025 and 2026, term deposits include deposits in lien with banks, held as margin money REPORT deposits against guarantees amounting to I 953 and I 961, respectively. ANNUAL INTEGRATED WIPRO


LOGO

459 Notes to the Consolidated Financial Statements (I in millions, except share and per share data, unless otherwise stated) Investments accounted for using the equity method During the year ended March 31, 2026, the Company invested I 352 being equity contribution in Drivestream Inc., an associate. The Company’s share of equity in the associate is 43.7% . The Company had no material associate and joint venture as at March 31, 2025 and 2026. The aggregate summarized financial information in respect of the Company’s immaterial associate and joint venture that are accounted for using the equity method is set forth below: As at As at March 31, 2025 March 31, 2026 &DUU¥LQJ_DPRXQW_RI_WKH_&RPSDQ¥ńV_LQWHUHVW_LQ_ An associate accounted for using the equity method (Unquoted: Series A Preferred Stock—94,527; Common stock—27,865, Series B Preferred C 933 I 1,716 Stock—190,525 and Series C Preferred stock—400) A joint venture accounted for using the equity method 394 410 (Unquoted: Class A units—5,850,000) Total K 1,327 K 2,126 For the year For the year For the year ended March ended March ended March 31, 2024 31, 2025 31, 2026 &RPSDQ¥ńV_VKDUH_RI_QHW_SURŮW____ORVV__LQ_WKH_FRQVROLGDWHG_VWDWHPHQW_RI_ LQFRPH_SHUWDLQLQJ_WR_ An associate accounted for using the equity method C (8) C 129 I 282 A joint venture accounted for using the equity method (225) 125 (25) Total K (233) K 254 K 257 9. TRADE RECEIVABLES As at As at March 31, 2025 March 31, 2026 Trade receivables C 124,215 I 143,966 Allowance for lifetime expected credit loss (6,171) (7,716) K 118,044 K 136,250 Non-current C 299 I 349 Current 117,745 135,901


LOGO

460 STATUTORY REPORTS AND FINANCIAL STATEMENTS CONSOLIDATED FINANCIAL STATEMENTS UNDER IFRS Notes to the Consolidated Financial Statements (I in millions, except share and per share data, unless otherwise stated) The activity in the allowance for lifetime expected credit loss is given below: As at As at March 31, 2025 March 31, 2026 Balance at the beginning of the year C 6,316 I 6,171 Additions due to Acquisitions (Refer to Note 7)—159 Additions, net (Refer to Note 25) 324 2,838 Additions on account of Unbilled Receivables—(698) Charged against allowance (512) (1,288) Translation adjustment 43 534 Balance at the end of the year K 6,171 K 7,716 10. INVENTORIES As at As at March 31, 2025 March 31, 2026 Traded goods I 685 I 514 Stores and spare parts 9 3 K 694 K 517 During the years ended March 31, 2025 and 2026, changes in inventories recognized as expense is I 195 and I 171, respectively, and purchases of traded goods recognized as expense is I 2,967 and I 5,755, respectively. 11. CASH AND CASH EQUIVALENTS As at As at As at March 31, 2024 March 31, 2025 March 31, 2026 Cash and bank balances C 60,648 C 74,456 I 96,145 Demand deposits with banks(1) 36,305 47,518 9,410 K 96,953 K 121,974 K 105,555 (1) These deposits can be withdrawn by the Company at any time without prior notice and without any penalty on the principal. Cash and cash equivalents consist of the following for the purpose of the consolidated statement of cash flows: As at As at As at 2025-26 March 31, 2024 March 31, 2025 March 31, 2026 Cash and cash equivalents C 96,953 C 121,974 I 105,555 REPORT Bank overdrafts (2) ^—ANNUAL K 96,951 K 121,974 K 105,555 ^ Value is less than 0.5 INTEGRATED WIPRO


LOGO

461 Notes to the Consolidated Financial Statements (I in millions, except share and per share data, unless otherwise stated) 12. OTHER FINANCIAL ASSETS As at As at March 31, 2025 March 31, 2026 Non-current Finance lease receivables C 3,090 I 3,922 Security deposits 1,318 1,812 Advance to customer 225 509 ‘XHV_IURP_RIŮFHUV_DQG_HPSOR¥HHV 30 16 Other receivables 1 ^ K 4,664 K 6,259 Current Finance lease receivables C 5,144 I 4,189 Security deposits 1,827 2,235 Receivables from redemption of mutual funds—800 Advance to customer 70 494 ‘XHV_IURP_RIŮFHUV_DQG_HPSOR¥HHV 505 435 Claims receivables 195 384 Interest receivables 596 357 Other receivables 111 1,351 K 8,448 K 10,245 K 13,112 K 16,504 ^ Value is less than 0.5 Finance lease receivables Finance lease receivables consist of assets that are leased for a contract term normally ranging 1 to 5 years, with lease payments due in monthly or quarterly installments. Details of finance lease receivables are given below: As at As at March 31, 2025 March 31, 2026 Year 1 C 5,489 I 4,554 Year 2 1,908 2,573 Year 3 945 1,225 Year 4 380 290 Year 5 145 112 Gross investment in lease K 8,867 K 8,754 /HVV__8QHDUQHG_ÙQDQFH_LQFRPH (633) (643) Present value of minimum lease payment receivables K 8,234 K 8,111 Non-current C 3,090 I 3,922 Current 5,144 4,189


LOGO

462 STATUTORY REPORTS AND FINANCIAL STATEMENTS CONSOLIDATED FINANCIAL STATEMENTS UNDER IFRS Notes to the Consolidated Financial Statements (I in millions, except share and per share data, unless otherwise stated) 13. OTHER ASSETS As at As at March 31, 2025 March 31, 2026 Non-current Prepaid expenses C 2,657 I 4,356 Interest receivable from statutory authorities 1,148 1,062 Deferred contract cost Costs to obtain contracts(1) 3,277 2,592 _ &RVWV_WR_IXOÙO_FRQWUDFWV(2) 378 1,000 K 7,460 K 9,010 Current Prepaid expenses C 16,917 I 18,929 Balance with GST and other authorities 6,760 7,969 Advance to suppliers 2,323 2,369 Withholding taxes 542 975 ‘XHV_IURP_RIŮFHUV_DQG_HPSOR¥HHV 453 415 ‘HÙQHG_EHQHÙW_SODQ_DVVHW__QHW 472 204 Deferred contract cost Costs to obtain contracts(1) 1,407 1,903 _ &RVWV_WR_IXOÙO_FRQWUDFWV(2) 131 151 Other receivables 123 249 K 29,128 Kb______ K 36,588 Kb______ (1) Costs to obtain contracts amortization of I 1,083, I 1,333 and I 2,558 during the years ended March 31, 2024, 2025 and 2026, respectively. (2) Costs to fulfil contracts amortization of I 60, I 83 and I 150 during the years ended March 31, 2024, 2025 and 2026, respectively. 14. LOANS, BORROWINGS AND BANK OVERDRAFTS As at As at March 31, 2025 March 31, 2026 Non-current Unsecured Notes 2026(1) C 63,954 I -Loans from institutions other than banks—1,962 K 63,954 K 1,962 Current Unsecured Notes 2026(1) 2025-26 C—I 71,052 Borrowings from banks 97,863 94,860 REPORT Bank overdrafts ^—K 97,863 K 165,912 ANNUAL K 161,817 K 167,874 ^ Value is less than 0.5 INTEGRATED (1) On June 23, 2021, Wipro IT Services LLC, a wholly owned step-down subsidiary of the Company, issued U.S.$ 750 million in unsecured notes 2026 (the “Notes”). The Notes bear interest at a rate of 1.50% per annum and will mature on June 23, 2026. Interest on the Notes is payable semi-annually on June 23 and December 23 of each year, commencing from December 23, 2021. The Notes are listed on Singapore Exchange Securities Trading Limited (SGX-ST). WIPRO


LOGO

463 Notes to the Consolidated Financial Statements (I in millions, except share and per share data, unless otherwise stated) Short-term loans, borrowings and bank overdrafts The Company had loans, borrowings and bank overdrafts amounting to I 97,863 and I 94,860, as at March 31, 2025 and 2026, respectively. The principal source of borrowings from banks as at March 31, 2026 primarily consists of lines of credit of approximately I 89,024, U.S. Dollar (“U.S.$”) 432 million, Saudi Riyal (“SAR”) 120 million, Pound Sterling (“GBP”) 7 million, Bahraini Dinar (“BHD”) 1 million, Thai Baht (“THB”) 5 million, Brazilian Real (“BRL”) 8 million, Indonesian Rupiah (“IDR”) 13,000 million, Qatari Riyal (“QAR”) 10 million, Mexican Peso (“MXN”) 35 million, Canadian Dollar (“CAD”) 14 million, Bangladeshi Taka (“BDT”) 175 million and Japanese Yen (“JPY”) 300 million from bankers for working capital requirements and other short-term needs. As at March 31, 2026, the Company has unutilized lines of credit aggregating I 27,524, U.S.$ 92 million, SAR 75 million, GBP 7 million, BHD 1 million, THB 5 million, BRL 8 million, IDR 13,000 million, QAR 10 million, MXN 35 million, CAD 14 million, BDT 175 million and JPY 300 million. To utilize these unused lines of credit, the Company requires consent of the lender and compliance with certain financial covenants. Significant portion of these lines of credit are revolving credit facilities and floating rate foreign currency loans, renewable on a periodic basis. Significant portion of these facilities bear floating rates of interest, referenced to country specific official benchmark interest rates and a spread, determined based on market conditions. Long-term loans and borrowings As at March 31, 2025 As at March 31, 2026 Foreign Foreign Indian Indian Final currency in currency in Rupee Rupee maturity millions millions Unsecured Notes 2026 U.S.$ 748 C 63,954 U.S.$ 749 I 71,052 June-26 Loans from institutions other than banks — U.S.$ 21 1,962 June-27 K 63,954 K 73,014 Non-current portion of long-term loans and borrowings C 63,954 I 1,962 Current portion of long-term loans and borrowings—71,052 Refer to Note 26 for interest expense on loans, borrowings and bank overdrafts. Cash and non-cash changes in liabilities arising from financing activities: Non-cash changes April 1, 2024 &DVK_ùRZ Net additions to Lease Effective Foreign March 31, 2025 Liabilities/additions interest rate H[FKDQJH_ due to acquisitions adjustment movements Borrowings C 141,464 C 17,923 C—C 114 C 2,316 C 161,817 Lease Liabilities 23,183 (10,474) 17,270—239 30,218 K 164,647 K 7,449 K 17,270 K 114 K 2,555 K 192,035 Non-cash changes April 1, 2025 &DVK_ùRZ Net additions to Lease Effective Foreign March 31, 2026 Liabilities/additions interest rate H[FKDQJH_ due to acquisitions adjustment movements Borrowings C 161,817 C (6,752) C 1,852 C 119 C 10,838 I 167,874 Lease Liabilities 30,218 (11,561) 13,430—2,949 35,036 K 192,035 K (18,313) K 15,282 K 119 K 13,787 K 202,910


LOGO

464 STATUTORY REPORTS AND FINANCIAL STATEMENTS CONSOLIDATED FINANCIAL STATEMENTS UNDER IFRS Notes to the Consolidated Financial Statements (I in millions, except share and per share data, unless otherwise stated) Non-fund based The Company has non-fund based revolving credit facilities in various currencies equivalent to I 49,634 and I 49,747, as at March 31, 2025 and 2026, respectively, towards operational requirements that can be used for the issuance of letters of credit and bank guarantees. As at March 31, 2025, and 2026, an amount of I 36,524, and I 36,389, respectively, was unutilized out of these non-fund based facilities. 15. TRADE PAYABLES AND ACCRUED EXPENSES As at As at March 31, 2025 March 31, 2026 Non-current Accrued expenses C—I 4,394 K—K 4,394 Current Trade payables C 21,985 I 22,258 Accrued expenses 66,267 72,666 K 88,252 K 94,924 K 88,252 K 99,318 16. OTHER FINANCIAL LIABILITIES As at As at March 31, 2025 March 31, 2026 Non-current Liability on written put options to non-controlling interests (Refer to Note 19) C 4,945 I 3,071 Contingent consideration (Refer to Note 19) 1,307 1,178 Liabilities towards customer contracts 1,026 719 Long-term incentive payable 387 376 Deferred consideration for Business combination 61 34 Rent deposit 26 12 Other liabilities(1) 41 1,353 K 7,793 K 6,743 Current Liability on written put options to non-controlling interests (Refer to Note 19) C—I 2,628 Liabilities towards customer contracts 342 721 Capital creditors 1,255 689 2025-26 Advance from customers 167 329 REPORT Rent deposit 475 477 Contingent consideration (Refer to Note 19) 557 456 ANNUAL Interest accrued on loans and borrowings 489 541 Deferred consideration for Business combination 295 118 Unclaimed dividend 64 177 INTEGRATED Other liabilities(2) 234 5,221 K 3,878 K 11,357 K 11,671 K 18,100 (1) Includes payable to selling shareholders WIPRO (2) Includes liability on non-designated hedges


LOGO

465 Notes to the Consolidated Financial Statements (I in millions, except share and per share data, unless otherwise stated) 17. OTHER LIABILITIES As at As at March 31, 2025 March 31, 2026 Non-current Statutory and other liabilities C 12,757 I 17,877 (PSOR¥HH_EHQHŮWV_REOLJDWLRQV 4,362 5,165 K 17,119 K 23,042 Current (PSOR¥HH_EHQHŮWV_REOLJDWLRQV C 16,001 I 17,967 Statutory and other liabilities 14,295 16,012 Advance from customers 790 822 K 31,086 K 34,801 K 48,205 K 57,843 18. PROVISIONS As at As at March 31, 2025 March 31, 2026 Non-current Provision for onerous contracts C 294 I 224 K 294 K 224 Current Provision for onerous contracts C 1,288 I 1,184 Provision for warranty 207 214 Others 142 98 K 1,637 K 1,496 K 1,931 K 1,720 A summary of activity in provision for warranty, provision for onerous contracts and other provisions is as follows: Year ended March 31, 2025 Year ended March 31, 2026 Provision Provision Provision Provision for for for Others Total for Others Total onerous onerous ZDUUDQW¥ warranty contracts contracts Balance at the beginning of the year C 217 C 1,599 C 155 C 1,971 I 207 I 1,582 I 142 I 1,931 Additional provision during the year 207 597—804 214 582—796 Utilized/written-back during the year (217) (624) (13) (854) (207) (826) (44) (1,077) Translation adjustment—10—10 -70—70 Balance at the end of the year K 207 K 1,582 K 142 K 1,931 K 214 K 1,408 K 98 K 1,720 Provision for warranty represents cost associated with providing sales support services, which are accrued at the time of recognition of revenues and are expected to be utilized over a period of 1 year. Provision for onerous contracts is recognized when the expected benefit by the company from a contract are lower than the unavoidable costs of meeting the future obligations under the contract. Other provisions primarily include provisions for compliance related contingencies. The timing of cash outflows in respect of such provision cannot be reasonably determined.


LOGO

466 STATUTORY REPORTS AND FINANCIAL STATEMENTS CONSOLIDATED FINANCIAL STATEMENTS UNDER IFRS Notes to the Consolidated Financial Statements (I in millions, except share and per share data, unless otherwise stated) 19. FINANCIAL INSTRUMENTS The carrying value of financial instruments by categories as at March 31, 2025 is as follows: Fair value Fair value through other through comprehensive income Amortized Designated Total SURÙW_RU_ Mandatory upon initial cost loss recognition )LQDQFLDO_$VVHWV_ Cash and cash equivalents (Refer to Note 11) C—C—C—C 121,974 C 121,974 Investments (Refer to Note 8) Equity Instruments 4,955—12,493—17,448 Fixed maturity plan mutual funds 1,503 ——1,503 Short-term mutual funds 88,776 ——88,776 Non-convertible debentures—219,389 — 219,389 Government securities—10,651 — 10,651 Commercial papers—2,858 — 2,858 Bonds—21,138 — 21,138 Inter corporate and term deposits ——76,169 76,169 2WKHU_ÙQDQFLDO_DVVHWV Trade receivables (Refer to Note 9) ——118,044 118,044 Unbilled receivables ——64,280 64,280 _ 2WKHU_ÙQDQFLDO_DVVHWV__5HIHU_WR_1RWH____ ——13,112 13,112 Derivative assets (Refer to Note 19) 1,105—715—1,820 K 96,339 K 254,036 K 13,208 K 393,579 K 757,162 )LQDQFLDO_/LDELOLWLHV_ 7UDGH_SD¥DEOHV_DQG_RWKHU_ŮQDQFLDO_OLDELOLWLHV Trade payables and accrued expenses (Refer to Note 15) C—C—C—C 88,252 C 88,252 _ 2WKHU_ÙQDQFLDO_OLDELOLWLHV__5HIHU_WR_1RWH____ 1,864 — 9,807 11,671 Loans, borrowings and bank overdrafts (Refer to Note 14) ——161,817 161,817 Lease liabilities ——30,218 30,218 Derivative liabilities (Refer to Note 19) 75—893—968 2025-26 K 1,939 K—K 893 K 290,094 K 292,926 REPORT ANNUAL INTEGRATED WIPRO


LOGO

467 Notes to the Consolidated Financial Statements (I in millions, except share and per share data, unless otherwise stated) The carrying value of financial instruments by categories as at March 31, 2026 is as follows: Fair value through other Fair value comprehensive income Amortized WKURXJK_SURÙW_ Designated Total cost or loss Mandatory upon initial recognition )LQDQFLDO_$VVHWV_ Cash and cash equivalents (Refer to Note 11) I—I—I—I 105,555 I 105,555 Investments (Refer to Note 8) Equity Instruments 7,336—12,143—19,479 Fixed maturity plan mutual funds 1,281 ——1,281 Short-term mutual funds 79,719 ——79,719 Non-convertible debentures—210,328 — 210,328 Government securities—8,948 — 8,948 Commercial papers—14,227 — 14,227 Bonds—10,385 — 10,385 Inter corporate and term deposits ——121,366 121,366 2WKHU_ÙQDQFLDO_DVVHWV Trade receivables (Refer to Note 9) ——136,250 136,250 Unbilled receivables ——84,256 84,256 _ 2WKHU_ÙQDQFLDO_DVVHWV__5HIHU_WR_1RWH____ ——16,504 16,504 Derivative assets (Refer to Note 19) 295—593—888 K 88,631 K 243,888 K 12,736 K 463,931 K 809,186 )LQDQFLDO_/LDELOLWLHV_ 7UDGH_SD¥DEOHV_DQG_RWKHU_ŮQDQFLDO_OLDELOLWLHV Trade payables and accrued expenses I—I—I—I 99,318 I 99,318 (Refer to Note 15) _ 2WKHU_ÙQDQFLDO_OLDELOLWLHV__5HIHU_WR_1RWH____ 1,634 — 16,466 18,100 Loans, borrowings and bank overdrafts (Refer to Note 14) ——167,874 167,874 Lease liabilities ——35,036 35,036 Derivative liabilities (Refer to Note 19) 1,453—9,525—10,978 K 3,087 K—K 9,525 K 318,694 K 331,306


LOGO

468 STATUTORY REPORTS AND FINANCIAL STATEMENTS CONSOLIDATED FINANCIAL STATEMENTS UNDER IFRS Notes to the Consolidated Financial Statements (I in millions, except share and per share data, unless otherwise stated) Offsetting Financial assets and liabilities The following table contains information on financial assets and financial liabilities subject to offsetting: As at March 31, 2025 As at March 31, 2026 Gross Gross amounts of amounts of Financial assets Gross Gross recognized Net amounts recognized Net amounts amounts amounts ÙQDQFLDO_ recognized ÙQDQFLDO_ recognized recognized recognized liabilities liabilities set off set off Trade receivables—non-current C 299 C—C 299 I 349 I—I 349 Trade receivables—current 126,512 (8,767) 117,745 147,371 (11,470) 135,901 2WKHU_ÙQDQFLDO_DVVHWV___QRQ_FXUUHQW 4,664—4,664 6,259—6,259 2WKHU_ÙQDQFLDO_DVVHWV___FXUUHQW 8,448—8,448 10,245—10,245 Unbilled receivables—non-current ——7,433—7,433 Unbilled receivables—current 66,194 (1,914) 64,280 77,802 (979) 76,823 K 206,117 K (10,681) K 195,436 K 249,459 K (12,449) K 237,010 As at March 31, 2025 As at March 31, 2026 Gross Gross amounts of amounts of Financial liabilities Gross Gross recognized Net amounts recognized Net amounts amounts amounts ÙQDQFLDO_ recognized ÙQDQFLDO_ recognized recognized recognized assets assets set off set off Accrued expenses—non-current C—C—C—I 4,394—I 4,394 Trade payables and accrued 98,933 (10,681) 88,252 107,373 (12,449) I 94,924 expenses—current 2WKHU_ÙQDQFLDO_OLDELOLWLHV___QRQ_ 7,793—7,793 6,743—6,743 current 2WKHU_ÙQDQFLDO_OLDELOLWLHV___FXUUHQW 3,878—3,878 11,357—11,357 K 110,604 K (10,681) K 99,923 K 129,867 K (12,449) K 117,418 For the financial assets and liabilities subject to offsetting or similar arrangements, each agreement between the Company and the counterparty allows for net settlement of the relevant financial assets and liabilities when both elect to settle on a net basis. In the absence of such an election, financial assets and liabilities will be settled on a gross basis and hence are not offset. Fair value REPORT 2025-26 Financial assets and liabilities include cash and cash equivalents, trade receivables, unbilled receivables, finance lease ANNUAL receivables, employee and other advances, eligible current and non-current assets, loans, borrowings and bank overdrafts, lease liabilities, trade payables and accrued expenses, and eligible current and non-current liabilities. INTEGRATED The fair value of cash and cash equivalents, trade receivables, unbilled receivables, short-term loans, borrowings and bank overdrafts, lease liabilities, trade payables and accrued expenses, other current financial assets and liabilities approximate their carrying amount largely due to the short-term nature of these instruments. Finance lease receivables are periodically evaluated based on individual credit worthiness of customers. Based on this evaluation, the Company records allowance for estimated credit losses on these receivables. As at March 31, 2025 and 2026, the carrying value WIPRO of such financial assets, net of allowances, and liabilities approximates the fair value.


LOGO

469 Notes to the Consolidated Financial Statements (I in millions, except share and per share data, unless otherwise stated) The Company’s Unsecured Notes 2026 are contracted at fixed coupon rate of 1.50% and market yield on these loans as of March 31, 2026 was 4.48% . Investments in short-term mutual funds and fixed maturity plan mutual funds, which are classified as FVTPL are measured using net asset values at the reporting date multiplied by the quantity held. Fair value of investments in non-convertible debentures, government securities, commercial papers and bonds classified as FVTOCI is determined based on the indicative quotes of price and yields prevailing in the market at the reporting date. Fair value of investments in equity instruments classified as FVTOCI or FVTPL is determined using market approach primarily based on market multiples method. The fair value of derivative financial instruments is determined based on observable market inputs including currency spot and forward rates, yield curves and currency volatility. Fair value hierarchy The table below analyses financial instruments carried at fair value, by valuation method. The different levels have been defined as follows: Level 1 – Quoted prices (unadjusted) in active markets for identical assets or liabilities. Level 2 – Inputs other than quoted prices included within Level 1 that are observable for the asset or liability, either directly (i.e. as prices) or indirectly (i.e. derived from prices). Level 3 – Inputs for the assets or liabilities that are not based on observable market data (unobservable inputs). There were no transfers between Levels 1, 2 and 3 during the years ended March 31, 2025 and 2026. The following table presents fair value hierarchy of assets and liabilities measured at fair value on a recurring basis: As at March 31, 2025 As at March 31, 2026 Fair value measurements at reporting date Fair value measurements at reporting date Total Level 1 Level 2 Level 3 Total Level 1 Level 2 Level 3 Assets ‘HULYDWLYH_LQVWUXPHQWV_ _ &DVK_ùRZ_KHGJHV K 715 C—C 715 C—K 593 I—I 593 I— Others 1,105—1,105—295—295—,QYHVWPHQWV_ Short-term mutual funds 88,776 88,776 — 79,719 79,719 — Fixed maturity plan mutual funds 1,503—1,503—1,281—1,281—Equity instruments 17,448 57—17,391 19,479 36—19,443 Non-convertible debentures, government securities, commercial 254,036 10,550 243,486—243,888 8,854 235,034 -papers and bonds Liabilities ‘HULYDWLYH_LQVWUXPHQWV_ _ &DVK_ùRZ_KHGJHV K (893) C—C (893) C—K (9,525) I—I (9,525) I— Others (75)—(75)—(1,453)—(1,453)—Liability on written put options to (4,945) — (4,945) (5,699) — (5,699) non-controlling interests Contingent consideration (1,864) — (1,864) (1,634) — (1,634)


LOGO

470 STATUTORY REPORTS AND FINANCIAL STATEMENTS CONSOLIDATED FINANCIAL STATEMENTS UNDER IFRS Notes to the Consolidated Financial Statements (I in millions, except share and per share data, unless otherwise stated) The following methods and assumptions were used to estimate the fair value of the Level 2 financial instruments included in the above table. Financial instrument Method and assumptions Derivative instruments (assets and liabilities) 7KH_&RPSDQ¥_HQWHUV_LQWR_GHULYDWLYH_ŮQDQFLDO_LQVWUXPHQWV_ZLWK_YDULRXV_ counterparties, primarily banks with investment grade credit ratings. Derivatives valued using valuation techniques with market observable inputs are mainly interest rate swaps, foreign exchange forward contracts and foreign exchange option contracts. The most frequently applied valuation techniques include forward pricing, swap models and Black Scholes models (for option valuation), using present value calculations. The models incorporate various inputs LQFOXGLQJbWKH_FUHGLW_TXDOLW¥_RI_FRXQWHUSDUWLHV__IRUHLJQ_H[FKDQJH_VSRW_DQG_IRUZDUG_ rates, interest rate curves and forward rate curves of the underlying. As at March 31, 2026, the changes in counterparty credit risk had no material effect on the hedge effectiveness assessment for derivatives designated in hedge UHODWLRQVKLSV_DQG_RWKHU_ÙQDQFLDO_LQVWUXPHQWV_UHFRJQL]HG_DW_IDLU_YDOXH_ Investment in non-convertible debentures, Fair value of these instruments is derived based on the indicative quotes of government securities, commercial papers price and yields prevailing in the market as at reporting date. and bonds ,QYHVWPHQW_LQ_Ů[HG_PDWXULW¥_SODQ_PXWXDO_ Fair value of these instruments is derived based on the indicative quotes of funds price prevailing in the market as at reporting date. The following methods and assumptions were used to estimate the fair value of the Level 3 financial instruments included in the above table. Financial instrument Method and assumptions Investment in equity instruments Fair value of these instruments is determined using market approach primarily based on market multiples method. Contingent consideration and liability on Fair value of these instruments is determined using valuation techniques which written put options to non-controlling interest LQFOXGHV_LQSXWV_UHODWLQJ_WR_ULVN_DGMXVWHG_UHYHQXH_DQG_RSHUDWLQJ_SURÙW_IRUHFDVW_ The following table presents changes in Level 3 assets and liabilities for the years ended March 31, 2025 and 2026: As at As at March 31, 2025 March 31, 2026 Investment in equity instruments Balance at the beginning of the year C 20,126 I 17,391 Additions 1,925 2,038 Disposals(1)(2) (1,828) (1,199) Gain/(loss) recognized in consolidated statement of income 321 768 2025-26 Gain/(loss) recognized in other comprehensive income (3,609) (1,431) REPORT Translation adjustment 456 1,876 Balance at the end of the year K 17,391 K 19,443 ANNUAL (1) During the year ended March 31, 2025, as a result of an acquisition by another investors, the Company sold its shares of equity instruments in six companies at a fair value of I 1,281 and recognized a cumulative loss of I 175 in other comprehensive income and cumulative gain of I 152 in INTEGRATED consolidated statement of income. (2) During the year ended March 31, 2026, as a result of an acquisition by another investors, the Company sold its shares of equity instruments in three companies at a fair value of I 585 and recognized a cumulative gain of I 389 in other comprehensive income and cumulative loss of I 138 in consolidated statement of income. WIPRO


LOGO

471 Notes to the Consolidated Financial Statements (I in millions, except share and per share data, unless otherwise stated) As at As at March 31, 2025 March 31, 2026 Contingent consideration Balance at the beginning of the year C (429) I (1,864) (Addition)/Reversals(1) 169 (49) Addition through Business combination (Refer to Note 7) (1,537) -Payouts—648 Finance expense recognized in consolidated statement of income (47) (195) Translation adjustment (20) (174) Balance at the end of the year K (1,864) K (1,634) (1) Towards change in fair value of earn-out liability as a result of changes in estimates of revenue and earnings over the earn-out period. As at As at March 31, 2025 March 31, 2026 Liability on written put options to non-controlling interests Balance at the beginning of the year C (4,303) I (4,945) Finance expense recognized in consolidated statement of income (530) (585) Changes in fair value of written put options—385 Translation adjustment (112) (554) Balance at the end of the year K (4,945) K (5,699) As at March 31, 2025 and 2026, every 1% increase/decrease in the unobservable inputs used to estimate the fair value of investment in equity instruments, fair value of contingent consideration and liability on written put options to non-controlling interests, does not have a material impact on its fair value. Derivative assets and liabilities: The Company is exposed to currency fluctuations on foreign currency assets/liabilities, forecasted cash flows denominated in foreign currency and net investment in foreign operations. The Company is also exposed to interest rate fluctuations on investments in floating rate financial assets and floating rate borrowings. The Company follows established risk management policies, including the use of derivatives to hedge foreign currency assets/liabilities, interest rates, foreign currency forecasted cash flows and net investment in foreign operations. The counterparties in these derivative instruments are primarily banks and the Company considers the risks of non-performance by the counterparty as immaterial.


LOGO

472 STATUTORY REPORTS AND FINANCIAL STATEMENTS CONSOLIDATED FINANCIAL STATEMENTS UNDER IFRS Notes to the Consolidated Financial Statements (I in millions, except share and per share data, unless otherwise stated) The following table presents the aggregate contracted principal amounts of the Company’s derivative contracts outstanding: (in million) As at March 31, 2025 As at March 31, 2026 Notional Fair value Notional Fair value Designated derivative instruments Sell: Forward contracts U.S.$ 1,008 C (608) U.S.$ 2,475 I (8,574) € 46 C 78 € 118 I 347 £ 43 C 30 £66 I 169 AUD 23 C 79 AUD 31 I (20) Buy: Forward contracts U.S.$—C—U.S.$ 750 I 500 Range forward option U.S.$ 764 C 333 U.S.$ 400 I (1,497) contracts € 36 C (55) €41 I 108 £ 43 C (89) £41 I 67 AUD 31 C 5 AUD 76 I (32) Interest rate swaps U.S.$ 225 C 24 U.S.$—I—Non-designated derivative instruments Sell: Forward contracts(1) U.S.$ 752 C 975 U.S.$ 944 I (1,581) € 94 C (27) € 237 I 299 £ 12 C (14) £79 I 176 AUD 65 C 12 AUD 47 I 74 SGD 34 C 4 SGD 45 I 55 ZAR 162 C (13) ZAR 55 I 8 CAD 142 C 71 CAD 95 I 47 SAR 179 C (4) SAR 30 I ^ QAR 13 C ^ QAR 5 I ^ TRY 90 C 2 TRY 90 I 1 NOK—C—NOK 12 I 1 OMR 2 C ^ OMR 1 I ^ JPY 705 C (13) JPY 1,220 I 32 DKK 31 C (11) DKK—I— 2025-26 CNH 7 C (1) CNH—I—REPORT COP 8,120 C 1 COP 8,120 I (3) MYR 32 C 1 MYR 24 I 20 ANNUAL RON 8 C (1) RON—I—HKD 39 C ^ HKD 42 I ^ TWD 40 C ^ TWD 57 I 1 INTEGRATED CHF 9 C (3) CHF 6 I 13 PHP 150 C (4) PHP—I—THB 43 C 2 THB 52 I (2) PLN 10 C 1 PLN 8 I 1 WIPRO BRL 17 C (2) BRL 106 I (18)


LOGO

473 Notes to the Consolidated Financial Statements (I in millions, except share and per share data, unless otherwise stated) (in million) As at March 31, 2025 As at March 31, 2026 Notional Fair value Notional Fair value Buy: Forward contracts U.S.$ 18 C (25) U.S.$ 20 I 15 € 10 C 23 € 193 I (162) £ 24 C 37 £16 I (16) AUD 3 C (2) AUD—I -CAD 19 C (40) CAD 20 I (11) QAR 4 C ^ QAR 9 I ^ CNH 137 C (1) CNH 208 I (7) RON 67 C 11 RON 51 I (12) PLN 99 C 56 PLN 76 I (43) SEK 34 C 18 SEK 19 I (7) BRL 66 C 18 BRL 10 I 8 JPY 306 C 3 JPY 347 I (1) DKK 9 C (1) DKK 9 I ^ THB 178 C (5) THB 30 I (6) CRC 1,871 C ^ CRC 2,300 I (7) PHP 168 C 2 PHP 90 I (2) PEN 5 C ^ PEN—I -LKR 1,100 C (1) LKR 1,693 I (2) CLP 2,900 C (5) CLP 2,900 I (3) BHD 1 C ^ BHD 1 I ^ OMR ^ C ^ OMR ^ I ^ HKD 38 C (5) HKD—I -SGD 2 C (3) SGD—I—MYR 7 C ^ MYR 9 I (4) MXN 81 C (1) MXN 178 I (14) AED—C—AED 16 I ^ SAR—C—SAR 11 I ^ KRW—C—KRW 6,400 I (8) Kb 852 Kb (10,090) ^ Value is less than 0.5 (1) U.S.$ 752 and U.S.$ 944 includes U.S.$/PHP sell forward of U.S.$ 197 and U.S.$ 242 as at March 31, 2025 and 2026, respectively. The Company determines the existence of an economic relationship between the hedging instrument and the hedged item based on the currency, amount and timing of its forecasted cash flows. Hedge effectiveness is determined at the inception of the hedge relationship, and through periodic prospective effectiveness assessments to ensure that an economic relationship exists between the hedged item and hedging instrument, including whether the hedging instrument is expected to offset changes in cash flows of hedged items. If the hedge ratio for risk management purposes is no longer optimal but the risk management objective remains unchanged and the hedge continues to qualify for hedge accounting, the hedge relationship will be rebalanced by adjusting either the volume of the hedging instrument or the volume of the hedged item so that the hedge ratio aligns with the ratio used for risk management purposes. Any hedge ineffectiveness is calculated and accounted for in consolidated statement of income at the time of the hedge relationship rebalancing.


LOGO

474 STATUTORY REPORTS AND FINANCIAL STATEMENTS CONSOLIDATED FINANCIAL STATEMENTS UNDER IFRS Notes to the Consolidated Financial Statements (I in millions, except share and per share data, unless otherwise stated) The following table summarizes activity in the cash flow hedging reserve within equity related to all derivative instruments classified as cash flow hedges: As at As at March 31, 2025 March 31, 2026 Balance as at the beginning of the year C 773 I (275) Changes in fair value of effective portion of derivatives (1,185) (13,440) Deferred cancellation gain/(loss), net (91) (1,174) _ 1HW__JDLQ__ORVV_UHFODVVLÙHG_WR_FRQVROLGDWHG_VWDWHPHQW_RI_LQFRPH_RQ_RFFXUUHQFH_RI_ 203 5,163 hedged transactions(1) _ 1HW__JDLQ__ORVV_RQ_LQHIIHFWLYH_SRUWLRQ_RI_GHULYDWLYH_LQVWUXPHQWV_FODVVLÙHG_WR_ 25 -consolidated statement of income Translation gain—7 *DLQ__ORVV__RQ_FDVK_ùRZ_KHGJLQJ_GHULYDWLYHV__QHW K (1,048) K (9,444) Balance as at the end of the year K (275) K (9,719) Deferred tax asset/(liability) thereon 65 2,320 %DODQFH_DV_DW_WKH_HQG_RI_WKH_¥HDU__QHW_RI_GHIHUUHG_WD[HV K (210) K (7,399) (1) Includes net (gain)/loss reclassified to revenue of I 394 and I 6,093 for the years ended March 31, 2025 and 2026, respectively; net (gain)/loss reclassified to cost of revenues of I (51) and I (877) for the years ended March 31, 2025 and 2026, respectively; net (gain)/loss reclassified to finance expenses of I (213) and I (53) for the years ended March 31, 2025 and 2026, respectively and net (gain)/loss reclassified to finance and other income of I 73 and I Nil for the years ended March 31, 2025 and 2026, respectively. The related hedge transactions for balance in cash flow hedging reserves as at March 31, 2026 are expected to occur and be reclassified to the consolidated statement of income over a period of 12 months. As at March 31, 2025 and 2026, there were no material gains or losses on derivative transactions or portions thereof that have become ineffective as hedges or associated with an underlying exposure that did not occur. Sale of financial assets From time to time, in the normal course of business, the Company transfers accounts receivables, unbilled receivables and net investment in finance lease receivables (financial assets) to banks. Under the terms of the arrangements, the Company either substantially transfers its risks and rewards or surrenders control over the financial assets and transfer is without recourse. Accordingly, on such transfers the financial assets are derecognized and considered as sale of financial assets. Gains and losses on the sale of financial assets without recourse are recorded in finance expenses, at the time of sale based on the carrying value of the financial assets and fair value of servicing liability. The incremental impact of such transactions on our cash flow and liquidity for the years ended March 31, 2024, 2025 and 2026 is not material. Financial risk management REPORT 2025-26 Market Risk ANNUAL Market risk is the risk of loss of future earnings to fair values or to future cash flows that may result from a change in the price of a financial instrument. The value of a financial instrument may change as a result of changes in the interest rates, INTEGRATED foreign currency exchange rates and other market changes that affect market risk sensitive instruments. Market risk is attributable to all market risk sensitive financial instruments including investments, foreign currency receivables, payables and loans and borrowings. The Company’s exposure to market risk is a function of investment and financing activities and revenue generating activities in foreign currency. The objective of market risk management is to avoid excessive exposure of the Company’s WIPRO earnings and equity to losses.


LOGO

475 Notes to the Consolidated Financial Statements (I in millions, except share and per share data, unless otherwise stated) Risk management procedures The Company manages market risk through a corporate treasury department, which evaluates and exercises independent control over the entire process of market risk management. The corporate treasury department recommends risk management objectives and policies, which are approved by senior management and the Company’s Audit, Risk and Compliance Committee. The activities of this department include management of cash resources, implementing hedging strategies for foreign currency exposures, loans and borrowing strategies, and ensuring compliance with market risk limits and policies. Foreign currency risk The Company operates internationally, and a major portion of its business is transacted in several currencies. Consequently, we are exposed to foreign exchange risk through receiving payment for sales and services in the U.S. and elsewhere and we make purchases from overseas suppliers in various foreign currencies. The exchange rate risk primarily arises from foreign exchange revenue, receivables, cash balances, forecasted cash flows, payables and foreign currency loans and borrowings. A significant portion of the Company’s revenue is in the U.S. Dollars, Pound Sterling, Euro, Indian Rupees, Australian Dollars and Canadian Dollars, while a large portion of costs are in Indian Rupees. The exchange rate between the Indian Rupee and these currencies has fluctuated significantly in recent years and may continue to fluctuate in the future. Appreciation of the Indian Rupee against these currencies can adversely affect the Company’s results of operations. The Company evaluates exchange rate exposure arising from these transactions and enters into foreign currency derivative instruments to mitigate such exposure. The Company follows established risk management policies, including the use of derivatives like foreign exchange forward/option contracts to hedge forecasted cash flows denominated in foreign currency. The Company has designated certain derivative instruments as cash flow hedges to mitigate the foreign exchange exposure of forecasted highly probable cash flows. As of March 31, 2026, a I 1 increase in the spot exchange rate of the Indian Rupee with the U.S. Dollar would result in an approximately I 2,756 (including consolidated statement of income of I 683 and other comprehensive income of I 2,073) decrease in the fair value, and a I 1 decrease would result in an approximately I 2,743 (including consolidated statement of income of I 683 and other comprehensive income of I 2,060) increase in the fair value of foreign currency dollar denominated derivative instruments (forward and option contracts). The below table presents foreign currency risk from non-derivative financial assets/(liabilities) as at March 31, 2025 and 2026: As at March 31, 2025 Pound Australian Canadian Other U.S.$ Euro (1) Total Sterling Dollar Dollar Currencies Trade receivables C 39,306 C 12,470 C 7,611 C 1,942 C 629 C 4,195 C 66,153 Unbilled receivables 23,341 4,383 4,227 1,622 583 2,179 36,335 Cash and cash equivalents 28,719 5,871 1,357 1,007 4,392 2,575 43,921 2WKHU_ÙQDQFLDO_DVVHWV 785 1,187 353 537 101 1,504 4,467 Lease Liabilities (2,625) (2,894) (2,402) (259) (72) (1,104) (9,356) Trade payables, accrued expenses and other (32,507) (12,735) (10,683) (1,220) (1,068) (4,435) (62,648) ÙQDQFLDObOLDELOLWLHV 1RQ_GHULYDWLYH_ÙQDQFLDO_DVVHWV__ (liabilities), net K 57,019 K 8,282 K 463 K 3,629 K 4,565 K 4,914 K 78,872 (1) Other currencies reflect currencies such as Saudi Riyal, Swiss Franc, Singapore Dollar, United Arab Emirates Dirham and Polish Zloty.


LOGO

476 STATUTORY REPORTS AND FINANCIAL STATEMENTS CONSOLIDATED FINANCIAL STATEMENTS UNDER IFRS Notes to the Consolidated Financial Statements (I in millions, except share and per share data, unless otherwise stated) As at March 31, 2026 Pound Australian Canadian Other U.S.$ Euro (1) Total Sterling Dollar Dollar Currencies Trade receivables I 51,190 I 13,487 I 9,294 I 2,680 I 577 I 4,851 I 82,079 Unbilled receivables 31,242 5,721 7,329 2,091 1,027 3,217 50,627 Cash and cash equivalents 13,500 7,233 3,029 1,687 7,333 3,268 36,050 2WKHU_ÙQDQFLDO_DVVHWV 8,960 1,591 390 93 156 907 12,097 Lease Liabilities (4,057) (3,278) (2,828) (80) (25) (998) (11,266) Trade payables, accrued expenses and (43,925) (16,064) (16,144) (2,875) (3,203) (7,169) (89,380) RWKHU_ÙQDQFLDO_OLDELOLWLHV 1RQ_GHULYDWLYH_ÙQDQFLDO_DVVHWV__ (liabilities), net K 56,910 K 8,690 K 1,070 K 3,596 K 5,865 K 4,076 K 80,207 (1) Other currencies reflect currencies such as Singapore Dollar, Swiss Franc, Polish Zloty, United Arab Emirates Dirham and Swedish Krona. As at March 31, 2025 and 2026, respectively, every 1% increase/decrease in the respective foreign currencies compared to functional currency of the Company would increase/decrease the Company’s profit before taxes by approximately I 789 and I 802, respectively. Interest rate risk Interest rate risk primarily arises from floating rate borrowings, including various revolving and other lines of credit. Our investments are primarily in short-term investments, which do not expose us to significant interest rate risk. Interest rate risk primarily arises from floating rate borrowing, including various revolving and other lines of credit. If interest rates were to increase by 100 bps as on March 31, 2026, additional net annual interest expense on floating rate borrowing would amount to approximately I 799. Certain borrowings are also transacted at fixed interest rates. Credit risk Credit risk arises from the possibility that customers may not be able to settle their obligations as agreed. To manage this, the Company periodically assesses the credit rating and financial reliability of customers, considering the financial condition, current economic trends, forward-looking macroeconomic information, analysis of historical bad debts and ageing of accounts receivable. No single customer accounted for more than 10% of the accounts receivable as of March 31, 2025 and 2026, or revenues for the years ended March 31, 2024, 2025 and 2026. There is no significant concentration of credit risk. Trade receivables and unbilled receivables are written off where there is no reasonable expectation of recovery. Indicators that there is no reasonable expectation of recovery include, amongst others, the failure of a customer to engage in a repayment plan with the Company. REPORT 2025-26 Refer to Note 9 for changes in the allowance for lifetime expected credit loss. ANNUAL Counterparty risk Counterparty risk encompasses issuer risk on marketable securities, settlement risk on derivative and money market INTEGRATED contracts and credit risk on cash and time deposits. Issuer risk is minimized by only buying securities in India which are at least AA rated by Indian rating agencies. Settlement and credit risk is reduced by the policy of entering into transactions with counterparties that are usually banks or financial institutions with acceptable credit ratings. Exposure to these risks are closely monitored and maintained within predetermined parameters. There are limits on credit exposure to any financial institution. The limits are regularly assessed and determined based upon credit analysis including financial statements WIPRO and capital adequacy ratio reviews.


LOGO

477 Notes to the Consolidated Financial Statements (I in millions, except share and per share data, unless otherwise stated) Cash and cash equivalents include demand deposits of I 3,546 and bank balances of I 83,236 held with two banks having high credit ratings, which are individually in excess of 10% or more of the Company’s total cash and cash equivalents as of March 31, 2026. Refer to Note 11. We did not have any significant concentration of investment risk, as no investments with any single counterparty exceeded 10% of our total investments as of March 31, 2026. Refer to Note 8. Liquidity risk Liquidity risk is defined as the risk that the Company will not be able to settle or meet its obligations on time or at a reasonable price. The Company’s corporate treasury department is responsible for liquidity and funding as well as settlement management. In addition, processes and policies related to such risks are overseen by senior management. Management monitors our net liquidity position through rolling forecasts based on the expected cash flows. As of March 31, 2026, cash and cash equivalents are held with major banks and financial institutions. The table below provides details regarding the remaining contractual maturities of financial liabilities at the reporting date. The amounts include estimated interest payments and exclude the impact of netting agreements, if any. As at March 31, 2025 Interest Less than Beyond Total included Carrying 1-2 years 2-4 years 1 year 4 years &DVKùRZV in total value FDVK_ùRZV Loans, borrowings and bank overdrafts(1) C 99,884 C 64,576 C—C—K 164,460 C (2,643) K 161,817 Lease Liabilities(1) 9,563 6,950 8,426 11,379 36,318 (6,100) 30,218 Trade payables and accrued expenses 88,252 ——88,252—88,252 Derivative liabilities 968 ——968—968 2WKHU_ÙQDQFLDO_OLDELOLWLHV Contingent consideration(2) 580 420 1,401—2,401 (537) 1,864 Liability on written put options to (2)—2,686 3,819—6,505 (1,560) 4,945 non-controlling interests Rent Deposit 475 4 22—501—501 Liabilities towards customer contracts 342 342 684—1,368—1,368 Advance from customers 167 ——167—167 Capital creditors 1,255 ——1,255—1,255 Others 1,082 303 195—1,580 (9) 1,571 K 202,568 K 75,281 K 14,547 K 11,379 K 303,775 K (10,849) K 292,926


LOGO

478 STATUTORY REPORTS AND FINANCIAL STATEMENTS CONSOLIDATED FINANCIAL STATEMENTS UNDER IFRS Notes to the Consolidated Financial Statements (I in millions, except share and per share data, unless otherwise stated) As at March 31, 2026 Interest Less than Beyond Total included in Carrying 1-2 years 2-4 years 1 year 4 years &DVKùRZV total cash value ùRZV Loans, borrowings and bank overdrafts(1) I 167,648 I b______ I bbbbbbb_ I bbbbbbb_ K 169,724 I (1,850) K 167,874 Lease Liabilities(1) 10,492 8,315 10,152 12,855 41,814 (6,778) 35,036 Trade payables and accrued 94,924 1,929 1,920 545 99,318—99,318 expenses Derivative liabilities 10,978-— 10,978—10,978 2WKHU_ÙQDQFLDO_OLDELOLWLHV Contingent consideration(2) 467 1,553 — 2,020 (386) 1,634 Liability on written put options to 2,689—3,375—6,064 (365) 5,699 non-controlling interests(2) Rent Deposit 477 12 — 489—489 Liabilities towards customer 721 359 360—1,440—1,440 contracts Advance from customers 329-— 329—329 Capital creditors 689-— 689—689 Others 6,057 297 439 1,027 7,820—7,820 K 295,471 K 14,541 K 16,246 K 14,427 K 340,685 K (9,379) K 331,306 (1) Includes future cash outflow towards estimated interest on loans, borrowings and bank overdrafts, and lease liabilities. (2) Includes future cash outflow towards estimated interest on contingent consideration and liability on written put options to non-controlling interests. The balanced view of liquidity and financial indebtedness is stated in the table below. The management for external communication with investors, analysts and rating agencies uses this calculation of the net cash position: As at As at March 31, 2025 March 31, 2026 Cash and cash equivalents C 121,974 I 105,555 Investments—current 411,474 437,680 Loans, borrowings and bank overdrafts (161,817) (167,874) K 371,631 K 375,361 REPORT 2025-26 ANNUAL INTEGRATED WIPRO


LOGO

479 Notes to the Consolidated Financial Statements (I in millions, except share and per share data, unless otherwise stated) 20. FOREIGN CURRENCY TRANSLATION RESERVE AND OTHER RESERVES The movement in foreign currency translation reserve attributable to equity holders of the Company is summarized below: As at As at March 31, 2025 March 31, 2026 Balance at the beginning of the year C 47,261 I 54,500 Translation difference related to foreign operations, net 7,294 46,377 Transfer of shares pertaining to Non-controlling interests of subsidiary (14)—5HFODVVLŮFDWLRQ_RI_IRUHLJQ_FXUUHQF¥_WUDQVODWLRQ_GLIIHUHQFHV_RQ_OLTXLGDWLRQ_RI_VXEVLGLDULHV_WR_ (41) -consolidated statement of income Others—(5) Balance at the end of the year K 54,500 K 100,872 The movement in other reserves is summarized below: Other Reserves Investment Investment Gross in debt in equity Particulars Remeasurements Capital obligation to instruments instruments RI_WKH_GHÙQHG_ Redemption non-controlling measured measured EHQHÙW_SODQV Reserve interests under at fair value at fair value put options through OCI through OCI As at April 1, 2023 C (548) C (119) C 10,793 C 1,122 C -Addition through Business combination (Refer to Note 7) — — (4,238) Other comprehensive income 262 1,516 (473) —Buyback of equity shares (Refer to Note 22) ——539—As at March 31, 2024 K (286) K 1,397 K 10,320 K 1,661 K (4,238) As at April 1, 2024 C (286) C 1,397 C 10,320 C 1,661 C (4,238) Other comprehensive income 289 963 (3,476) —Bonus issue of equity shares (Refer to Note 22) ——(1,661) -Transfer of shares pertaining to Non-controlling (8) — —interests of subsidiary Transfer to Retained earnings(1) (130)—(5,624) — As at March 31, 2025 K (135) K 2,360 K 1,220 K—K (4,238) As at April 1, 2025 I (135) I 2,360 I 1,220 I—I (4,238) Other comprehensive income 152 (2,094) (1,448) — As at March 31, 2026 K bbb__ K b___ K (228) K—K (4,238) (1) Towards transfer of cumulative realized (gain)/loss on disposal of investments in equity instruments designated as FVTOCI and towards transfer of cumulative (gain)/loss on remeasurement of defined benefit plans to retained earnings.


LOGO

480 STATUTORY REPORTS AND FINANCIAL STATEMENTS CONSOLIDATED FINANCIAL STATEMENTS UNDER IFRS Notes to the Consolidated Financial Statements (I in millions, except share and per share data, unless otherwise stated) 21. INCOME TAXES Year ended Year ended Year ended March 31, 2024 March 31, 2025 March 31, 2026 Income tax expense as per the consolidated statement of income C 36,089 C 42,777 I 40,767 Income tax included in other comprehensive income on: Gains/(losses) on investment securities 259 83 (323) _ *DLQV__ORVVHV__RQ_FDVK_ùRZ_KHGJLQJ_GHULYDWLYHV 554 (260) (2,257) _ 5HPHDVXUHPHQWV_RI_WKH_GHÙQHG_EHQHÙW_SODQV 111 49 10 K 37,013 K 42,649 K 38,197 Income tax expense consists of the following: Year ended Year ended Year ended March 31, 2024 March 31, 2025 March 31, 2026 Current tax expense C 34,973 C 45,405 I 42,665 Deferred tax expense/(reversal) 1,116 (2,628) (1,898) K 36,089 K 42,777 K 40,767 The reconciliation between the provision of income tax and amounts computed by applying the Indian statutory income tax rate to profit before taxes is as follows: Year ended Year ended Year ended March 31, 2024 March 31, 2025 March 31, 2026 3URÙW_EHIRUH_WD[ C 147,210 C 174,957 I 173,422 Enacted income tax rate in India 34.94% 34.94% 34.94% Computed expected tax expense K 51,435 K 61,130 K 60,594 Effect of: Income exempt from tax C (14,897) C (12,960) I (13,755) Basis differences that will reverse during a tax holiday period (202) (332) 66 Income taxed at higher / (lower) rates (7,497) (7,736) (7,393) Taxes related to prior years 2,567 (2,306) (4,141) Changes in unrecognized deferred tax assets 1,092 (17) 123 Expenses disallowed for tax purpose 3,945 4,460 4,803 Others, net (354) 538 470 2025-26 ,QFRPH_WD[_H[SHQVH K 36,089 K 42,777 K 40,767 REPORT Effective income tax rate 24.52% 24.45% 23.51% ANNUAL INTEGRATED WIPRO


LOGO

481 Notes to the Consolidated Financial Statements (I in millions, except share and per share data, unless otherwise stated) The components of deferred tax assets and liabilities are as follows: As at As at March 31, 2025 March 31, 2026 ‘HIHUUHG_WD[_DVVHWV Carry forward losses(1) 898 C I 784 Trade payables, accrued expenses and other liabilities 7,106 7,886 Allowances for lifetime expected credit loss 1,428 2,016 &DVK_ùRZ_KHGJHV 65 2,234 Contract Assets—151 Others 144 147 K 9,641 K 13,218 ‘HIHUUHG_WD[_OLDELOLWLHV Property, plant and equipment C (536) I (650) Amortizable goodwill (5,449) (6,906) Intangible assets (7,931) (8,407) Interest income and fair value movement of investments (2,912) (2,687) Contract liabilities (209) -Special Economic Zone re-investment reserve (3,485) (2,627) Undistributed earnings of subsidiaries (3,001) (3,965) K (23,523) K (25,242) ‘HIHUUHG_WD[_OLDELOLWLHV__QHW K (13,882) K (12,024) $PRXQWV_SUHVHQWHG_LQ_FRQVROLGDWHG_VWDWHPHQW_RI_ŮQDQFLDO_SRVLWLRQ_ Deferred tax assets C 2,561 I 5,242 Deferred tax liabilities (16,443) (17,266) (1) Includes deferred tax asset recognized on carry forward losses pertaining to business combinations. 


LOGO

482 STATUTORY REPORTS AND FINANCIAL STATEMENTS CONSOLIDATED FINANCIAL STATEMENTS UNDER IFRS Notes to the Consolidated Financial Statements (I in millions, except share and per share data, unless otherwise stated) Movement in deferred tax assets and liabilities Credit/ (charge) Credit/ (charge) On account As at Movement during the year ended As at in the in other of Business Translation March 31, March 31, 2024 April 1, 2023 consolidated comprehensive combinations adjustment 2024 statement of income and others income Carry forward losses C 2,624 C (1,384) C—C—C 14 C 1,254 Trade payables, accrued expenses 6,367 (477) (111) (4) 18 5,793 and other liabilities Allowances for lifetime expected 1,743 (129) — 4 1,618 credit loss Property, plant and equipment (911) (1) ——(912) Amortizable goodwill (3,855) (993) — (61) (4,909) Intangible assets (10,170) 2,067—(367) (131) (8,601) Interest income and fair value (1,170) 82 (259) — (1,347) movement of investments &DVK_ùRZ_KHGJHV 359—(554) — (195) Contract asset / (Contract (370) (257)—5 (3) (625) liabilities) Special Economic Zone re-(7,237) (583) ——(7,820) investment reserve Others (433) 559—(22) (10) 94 ‘HIHUUHG_WD[_OLDELOLWLHV__QHW K (13,053) K (1,116) K (924) K (388) K (169) K (15,650) Credit/ (charge) Credit/ (charge) On account As at Movement during the year ended As at in the in other of Business Translation March 31, March 31, 2025 April 1, 2024 consolidated comprehensive combinations adjustment 2025 statement of income and others income Carry forward losses C 1,254 C (357) C—C—C 1 C 898 Trade payables, accrued expenses 5,793 1,362 (49) — 7,106 and other liabilities Allowances for lifetime expected 1,618 (190) ——1,428 credit loss Property, plant and equipment (912) 371 — 5 (536) Amortizable goodwill (4,909) (422) — (118) (5,449) Intangible assets (8,601) 1,446—(566) (210) (7,931) 2025-26 Interest income and fair value (1,347) (1,482) (83) — (2,912) REPORT movement of investments &DVK_ùRZ_KHGJHV (195)—260 — 65 ANNUAL Contract asset / (Contract (625) 428 — (12) (209) liabilities) Special Economic Zone re- (7,820) 4,335 ——(3,485) INTEGRATED investment reserve Undistributed earnings of —(2,941) — (60) (3,001) subsidiaries Others 94 78 — (28) 144 WIPRO ‘HIHUUHG_WD[_OLDELOLWLHV__QHW K (15,650) K 2,628 K 128 K (566) K (422) K (13,882)


LOGO

483 Notes to the Consolidated Financial Statements (I in millions, except share and per share data, unless otherwise stated) Credit/ Credit/ (charge) On account (charge) As at Movement during the year ended As at in the of Business Translation in other March 31, March 31, 2026 April 1, 2025 consolidated combinations adjustment comprehensive 2026 statement of and others income income Carry forward losses C 898 C (239) C—C 9 C 116 I 784 Trade payables, accrued expenses and 7,106 (142) (10) 590 342 7,886 other liabilities Allowances for lifetime expected credit loss 1,428 519—33 36 2,016 Property, plant and equipment (536) (392)—248 30 (650) Amortizable goodwill (5,449) (873) — (584) (6,906) Intangible assets (7,931) 2,277—(1,915) (838) (8,407) Interest income and fair value movement of (2,912) 346 323 (369) (75) (2,687) investments &DVK_ùRZ_KHGJHV 65 (87) 2,257—(1) 2,234 Contract asset / (Contract liabilities) (209) 124—230 6 151 Special Economic Zone re-investment (3,485) 858 ——(2,627) reserve Undistributed earnings of subsidiaries (3,001) (587) — (377) (3,965) Others 144 94—(57) (34) 147 ‘HIHUUHG_WD[_OLDELOLWLHV__QHW K (13,882) K 1,898 K 2,570 K (1,231) K (1,379) K (12,024) Deferred taxes on unrealized foreign exchange gain/loss relating to cash flow hedges, fair value movements in investments and remeasurements of the defined benefit plans are recognized in other comprehensive income. Deferred tax liability on the intangible assets identified and carry forward losses on acquisitions is recorded by an adjustment to goodwill. Other than these, the change in deferred tax assets and liabilities is primarily recorded in the consolidated statement of income. In assessing the realizability of deferred tax assets, the Company considers the extent to which it is probable that the deferred tax asset will be realized. The ultimate realization of deferred tax assets is dependent upon the generation of future taxable profits during the periods in which those temporary differences and tax loss carry-forwards become deductible. The Company considers the expected reversal of deferred tax liabilities, projected future taxable income and tax planning strategies in making this assessment. Based on this, the Company believes that it is probable that the Company will realize the benefits of these deductible differences. The amount of deferred tax asset considered realizable, however, could be reduced in the near term if the estimates of future taxable income during the carry-forward period are reduced. Deferred tax asset amounting to I 10,816 and I 13,613 as at March 31, 2025 and 2026, respectively in respect of unused tax losses have not been recognized by the Company. The tax loss carry-forwards of I 44,274 and I 56,119 as at March 31, 2025 and 2026, respectively, on which deferred tax asset has not been recognized by the Company, because it is probable that future taxable profits will not be available against which the unused tax losses can be utilized in the foreseeable future. Approximately, I 40,292, and I 51,505 as at March 31, 2025 and 2026, respectively, of these tax loss carry-forwards is not currently subject to expiration dates. The remaining tax loss carry-forwards of approximately I 3,982 and I 4,614 as at March 31, 2025 and 2026, respectively, expires in various years through fiscal year 2046. The Company has recognized deferred tax assets of I 898 and I 784 primarily in respect of carry forward losses including certain subsidiaries as at March 31, 2025 and 2026, respectively. Management’s projections of future taxable income and tax planning strategies support the assumption that it is probable that sufficient taxable income will be available to utilize these deferred tax assets.


LOGO

484 STATUTORY REPORTS AND FINANCIAL STATEMENTS CONSOLIDATED FINANCIAL STATEMENTS UNDER IFRS Notes to the Consolidated Financial Statements (I in millions, except share and per share data, unless otherwise stated) A substantial portion of the profits of the Company’s India operations are exempt from Indian income taxes being profits attributable to export operations and profits from units established under the Special Economic Zone Act, 2005 scheme. Units in designated SEZs providing service on or after April 1, 2005 will be eligible for a deduction of 100% of profits or gains derived from the export of services for the first five years from commencement of provision of services and 50% of such profits and gains for a further five years. A 50% tax deduction is available for a further five years subject to the unit meeting certain defined conditions. Profits from certain other undertakings are also eligible for preferential tax treatment. New SEZ units set up on or after April 1, 2021 are not eligible for the aforesaid deduction. The tax holiday period being currently available to the Company expires in various years through fiscal years 2034-35. The impact of tax holidays has resulted in a decrease of current tax expense of I 14,308, I 11,798, and I 13,092 for the years ended March 31, 2024, 2025 and 2026, respectively, compared to the effective tax amounts that the Company estimates it would have been required to pay if these incentives had not been available. The per equity share effect of these tax incentives for the years ended March 31, 2024, 2025 and 2026 is I 1.35, I 1.13, and I 1.25, respectively. For the year ended March 31, 2024, earnings per equity share have been proportionately adjusted for the bonus issue in ratio of 1:1. Refer to Note 22. Deferred income tax liabilities are recognized for all taxable temporary differences except in respect of taxable temporary differences associated with investments in certain subsidiaries where the timing of the reversal of the temporary difference can be controlled and it is probable that the temporary difference will not reverse in the foreseeable future. Accordingly, deferred income tax liabilities on cumulative earnings of certain subsidiaries amounting to I 86,937 and I 69,693 as at March 31, 2025 and 2026, respectively and branch profit tax at 15% of the U.S. branch profit have not been recognized. Further, it is not practicable to estimate the amount of the unrecognized deferred tax liabilities for these undistributed earnings. The Pillar Two legislations are neither enacted nor substantively enacted by Government of India, where the parent company is incorporated. Pillar Two legislation has been enacted, or substantively enacted, in certain other jurisdictions where the Company operates. However, the Company does not expect any material financial impact for the year ended March 31, 2026. In line with amended IAS 12, the Company has not recognized deferred taxes related to Pillar Two income taxes and accordingly has applied the mandatory exception as per the said standard. 22. DIVIDENDS, BONUS ISSUE AND BUYBACK OF EQUITY SHARES The Company declares and pays dividends in Indian Rupees. According to the Companies Act, 2013 any dividend should be declared out of accumulated distributable profits. A company may, before the declaration of any dividend, transfer a percentage of its profits for that financial year as it may consider appropriate to the reserves. The cash dividends paid per equity share were I 1, I 6 and I 11 (I 5 declared on July 17, 2025 and I 6 declared on January 16, 2026), during the years ended March 31, 2024, 2025 and 2026, respectively. During the year ended March 31, 2024, the Company concluded the buyback of 269,662,921 equity shares (at a price of I 445 per equity share) as approved by the Board of Directors on April 27, 2023. This has resulted in a total cash outflow of I 145,173 (including tax on buyback of I 24,783 and transaction costs related to buyback of I 390). In line with the requirement of the Companies Act, 2013, an amount of I 3,768 and I 141,405 has been utilized from share premium and retained earnings respectively. Further, capital redemption reserve (included in other reserves) REPORT 2025-26 of I 539 (representing the nominal value of the shares bought back) has been created as an apportionment from ANNUAL retained earnings. Consequent to such buyback, the paid-up equity share capital has reduced by I 539. INTEGRATED During the year ended March 31, 2025, the Company concluded bonus issue in the ratio of 1:1 i.e. 1 (one) bonus equity share of I 2 each for every 1 (one) fully paid-up equity shares held (including ADS holders) was approved by the shareholders of the Company on November 21, 2024. Subsequently, on December 4, 2024, the Company allotted 5,232,094,402 equity shares (including ADS) to shareholders who held equity shares as on the record date of December 3, 2024. The Company also allotted 1:1 bonus equity share on 1,274,805 equity shares (including WIPRO ADS) under allotment as on the record date. Consequently, I 10,467 (representing par value of I 2 per share) was transferred from capital redemption reserves, share premium and retained earnings to the share capital.


LOGO

485 Notes to the Consolidated Financial Statements (I in millions, except share and per share data, unless otherwise stated) 23. ADDITIONAL CAPITAL DISCLOSURES The key objective of the Company’s capital management is to ensure that it maintains a stable capital structure with the focus on total equity to uphold investor, creditor, and customer confidence and to ensure future development of its business. The Company’s focus is to keep strong total equity base to ensure independence, security, as well as a high financial flexibility for potential future borrowings, if required without impacting the risk profile of the Company. The Company’s goal is to continue to be able to return excess liquidity to shareholders by continuing to distribute annual dividends in future periods. The amount of future dividends/ buyback of equity shares will be balanced with efforts to continue to maintain an adequate liquidity status. The capital structure as at March 31, 2025 and 2026 was as follows: As at As at % Change March 31, 2025 March 31, 2026 Equity attributable to the equity shareholders of the Company C 828,309 I 885,368 7% As percentage of total capital 81% 81% Current loans, borrowings and bank overdrafts 97,863 165,912 Non-current loans and borrowings 63,954 1,962 Current and non-current lease liabilities 30,218 35,036 7RWDO_ORDQV__ERUURZLQJV_DQG_EDQN_RYHUGUDIWV_DQGbOHDVH_OLDELOLWLHV K 192,035 K 202,910 6% As percentage of total capital 19% 19% Total capital K 1,020,344 K 1,088,278 7% Loans and borrowings represent 16% and 15% of total capital as at March 31, 2025 and 2026, respectively. The Company is not subjected to any externally imposed capital requirements. 24. REVENUE A. Contract assets and contract liabilities The following table presents the changes in contract assets balance: As at As at March 31, 2025 March 31, 2026 Balance at the beginning of the year C 19,854 I 15,795 $PRXQW_UHFODVVLŮHG_WR_UHFHLYDEOHV_SHUWDLQLQJ_WR_Ů[HG_SULFH_GHYHORSPHQW_FRQWUDFWV_RQ (14,730) (14,073) completion of milestones Increase due to revenue recognized during the year 10,617 12,233 Translation adjustment 54 864 Balance at the end of the year K 15,795 K 14,819


LOGO

486 STATUTORY REPORTS AND FINANCIAL STATEMENTS CONSOLIDATED FINANCIAL STATEMENTS UNDER IFRS Notes to the Consolidated Financial Statements (I in millions, except share and per share data, unless otherwise stated) The following table presents the changes in contract liabilities balance: As at As at March 31, 2025 March 31, 2026 Balance at the beginning of the year C 17,653 I 20,063 Revenue recognized from opening balance of contract liabilities (14,695) (15,724) Increase due to invoicing during the year 17,036 20,262 Translation adjustment 69 833 Balance at the end of the year K 20,063 K 25,434 Contract assets and liabilities are reported in a net position on a contract-by-contract basis at the end of each reporting period. B. Remaining performance obligations Revenue allocated to remaining performance obligations represents contracted revenue that has not yet been recognized, which includes contract liabilities and amounts that will be invoiced and recognized as revenue in future periods. Applying the practical expedient, the Company has not disclosed its right to consideration from customers in an amount that corresponds directly with the value to the customer of the Company’s performance completed to date, which are contracts invoiced on time and material basis and volume based. As at March 31, 2024, 2025 and 2026, the aggregate amount of the Transaction Price allocated to remaining performance obligations, other than those meeting the exclusion criteria above, were I 318,756, I 364,937 and I 373,976, respectively, of which approximately 66%, 66% and 63%, respectively, is expected to be recognized as revenues within two years, and the remainder thereafter. This includes contracts with a substantive enforceable termination penalty if the contract is terminated without cause by the customer, based on an overall assessment of the contract carried out at the time of inception. Historically, customers have not terminated contracts without cause. C. Disaggregation of revenue The tables below present disaggregated revenue from contracts with customers by business segment (refer to Note 33 “Segment Information”), sector and nature of contract. The Company believes that the below disaggregation best depicts the nature, amount, timing and uncertainty of revenue and cash flows from economic factors. ANNUAL REPORT 2025-26 INTEGRATED WIPRO


LOGO

487 Notes to the Consolidated Financial Statements (I in millions, except share and per share data, unless otherwise stated) Information on disaggregation of revenues for the year ended March 31, 2024 is as follows: IT Services IT Products Total Americas 1 Americas 2 Europe APMEA Total A. Revenue Rendering of services C 268,131 C 269,387 C 253,817 C 102,141 C 893,476 C—C 893,476 Sale of products — ——4,127 4,127 K 268,131 K 269,387 K 253,817 K 102,141 K 893,476 K 4,127 K 897,603 B. Revenue by sector Banking, Financial Services and Insurance C 2,462 C 165,002 C 95,475 C 35,762 C 298,701 Health 95,496 162 17,699 4,954 118,311 Consumer 102,439 5,351 43,035 16,387 167,212 Technology and Communications(1) 66,326 25,220 30,961 19,651 142,158 Energy, Manufacturing and (1) 1,408 73,652 66,647 25,387 167,094 Resources K 268,131 K 269,387 K 253,817 K 102,141 K 893,476 K 4,127 K 897,603 C. Revenue by nature of contract Fixed price and volume based C 150,253 C 140,676 C 149,007 C 62,011 C 501,947 C—C 501,947 Time and materials 117,878 128,711 104,810 40,130 391,529—391,529 Products — ——4,127 4,127 K 268,131 K 269,387 K 253,817 K 102,141 K 893,476 K 4,127 K 897,603 Information on disaggregation of revenues for the year ended March 31, 2025 is as follows: IT Services IT Products Total Americas 1 Americas 2 Europe APMEA Total A. Revenue Rendering of services C 281,806 C 271,965 C 240,187 C 94,234 C 888,192 C—C 888,192 Sale of products — ——2,692 2,692 K 281,806 K 271,965 K 240,187 K 94,234 K 888,192 K 2,692 K 890,884 B. Revenue by sector Banking, Financial Services and Insurance C 1,240 C 172,817 C 91,965 C 38,231 C 304,253 Health 108,305 236 13,982 3,272 125,795 Consumer 103,875 6,659 43,435 15,344 169,313 Technology and Communications(1) 64,907 24,255 31,804 14,933 135,899 Energy, Manufacturing and (1) 3,479 67,998 59,001 22,454 152,932 Resources K 281,806 K 271,965 K 240,187 K 94,234 K 888,192 K 2,692 K 890,884 C. Revenue by nature of contract Fixed price and volume based C 144,904 C 137,385 C 142,241 C 56,390 C 480,920 C—C 480,920 Time and materials 136,902 134,580 97,946 37,844 407,272—407,272 Products — ——2,692 2,692 K 281,806 K 271,965 K 240,187 K 94,234 K 888,192 K 2,692 K 890,884


LOGO

488 STATUTORY REPORTS AND FINANCIAL STATEMENTS CONSOLIDATED FINANCIAL STATEMENTS UNDER IFRS Notes to the Consolidated Financial Statements (I in millions, except share and per share data, unless otherwise stated) Information on disaggregation of revenues for the year ended March 31, 2026 is as follows: IT Services IT Products Total Americas 1 Americas 2 Europe APMEA Total A. Revenue Rendering of services I 305,036 I 268,532 I 243,645 I 102,087 I 919,300 I—I 919,300 Sale of products ——- 6,940 6,940 K 305,036 K 268,532 K 243,645 K 102,087 K 919,300 K 6,940 K 926,240 B. Revenue by sector Banking, Financial Services I 842 I 170,299 I 96,587 I 46,283 I 314,011 and Insurance Health 116,104 1,408 12,944 3,392 133,848 Consumer 107,075 3,772 44,537 13,586 168,970 Technology and 74,591 22,195 35,329 14,438 146,553 Communications Energy, Manufacturing and 6,424 70,858 54,248 24,388 155,918 Resources K 305,036 K 268,532 K 243,645 K 102,087 K 919,300 K 6,940 K 926,240 C. Revenue by nature of contract Fixed price and volume I 153,658 I 126,105 I 139,795 I 62,210 I 481,768 I—I 481,768 based Time and materials 151,378 142,427 103,850 39,877 437,532—437,532 Products ——- 6,940 6,940 K 305,036 K 268,532 K 243,645 K 102,087 K 919,300 K 6,940 K 926,240 (1) Effective October 1, 2024, the Company has reorganized its sectors by merging “Technology” and “Communications” into “Technology and Communications” sector, and by merging “Energy, Natural Resources and Utilities” and “Manufacturing” into “Energy, Manufacturing and Resources” sector. Comparative period disaggregation of revenue has been restated to give effect to this change. REPORT 2025-26 ANNUAL INTEGRATED WIPRO


LOGO

489 Notes to the Consolidated Financial Statements (I in millions, except share and per share data, unless otherwise stated) 25. EXPENSES BY NATURE Year ended Year ended Year ended March 31, 2024 March 31, 2025 March 31, 2026 Employee compensation(1) C 549,301 C 533,477 I 555,855 Sub-contracting and technical fees 103,030 100,148 107,668 Cost of hardware and software 4,116 3,170 5,934 Travel 15,102 14,095 13,882 Facility expenses 14,556 16,067 15,886 Software license expense for internal use 18,378 19,338 21,720 Depreciation, amortization and impairment(2) 34,071 29,579 29,107 Communication 4,878 3,842 3,414 Legal and professional fees 9,559 11,270 10,199 Rates, taxes and insurance 5,993 5,804 5,858 Marketing and brand building 3,555 3,591 3,480 Lifetime expected credit loss/ (write-back) 640 324 2,838 (Gain)/loss on sale of property, plant and equipment, net(3) (2,072) (606) (393) Miscellaneous expenses(4) 737 (454) 1,394 7RWDO_FRVW_RI_UHYHQXHV__VHOOLQJ_DQG_PDUNHWLQJ_H[SHQVHV_DQG_JHQHUDO_DQG_ DGPLQLVWUDWLYH_H[SHQVHV K 761,844 K 739,645 K 776,842 (1) Employee compensation includes impact of past service cost on gratuity and remeasurement of leave encashment due to implementation of new labour code amounting to I 2,756 for the year ended March 31, 2026. (2) Depreciation, amortization, and impairment includes an impairment charge on intangible assets amounting to I 1,701, I 1,155 and I 851, for the years ended March 31, 2024, 2025 and 2026, respectively (Refer to Note 6). (3) (Gain)/loss on sale of property, plant and equipment, net for the years ended March 31, 2024, 2025 and 2026, includes gain on sale of immovable properties of I (2,357) and gain on relinquishment of the lease hold rights of land, transfer of building along with other assets of I (885) and gain on transfer of building of I (405), respectively. (4) Miscellaneous expenses are net of reversals of contingent consideration I 1,300, I 169 and I (49) for the years ended March 31, 2024, 2025 and 2026, respectively (Refer to Note 19). Miscellaneous expenses are net of insurance claim received of I 1,805 during the year ended March 31, 2025. 26. FINANCE EXPENSES Year ended Year ended Year ended March 31, 2024 March 31, 2025 March 31, 2026 Interest on loans, borrowings and bank overdrafts C 6,893 C 7,124 I 5,368 Interest on lease liabilities 1,334 1,593 1,956 Interest on liability on written put options to non-controlling interests 33 530 585 2WKHU_ÙQDQFH_H[SHQVHV(1) 4,292 5,523 6,668 K 12,552 K 14,770 K 14,577 (1) Includes gain on remeasurement of written put options amounting to I 385 for the year ended March 31, 2026.


LOGO

490 STATUTORY REPORTS AND FINANCIAL STATEMENTS CONSOLIDATED FINANCIAL STATEMENTS UNDER IFRS Notes to the Consolidated Financial Statements (I in millions, except share and per share data, unless otherwise stated) 27. FINANCE AND OTHER INCOME AND FOREIGN EXCHANGE GAINS/(LOSSES), NET Year ended Year ended Year ended March 31, 2024 March 31, 2025 March 31, 2026 Interest income C 19,478 C 27,210 I 28,367 Dividend income from equity investments designated as FVTOCI 3 2,299 3 1HW_JDLQ_IURP_LQYHVWPHQWV_FODVVLÙHG_DV_)973/ 4,558 8,765 7,763 1HW_ORVV_IURP_LQYHVWPHQWV_FODVVLÙHG_DV_)972&, (143) (72) 358 Finance and other income K 23,896 K 38,202 K 36,491 )RUHLJQ_H[FKDQJH_JDLQV__ORVVHV___QHW_RQ_ÙQDQFLDO_LQVWUXPHQWV_PHDVXUHG_ C 650 C (398) I (5,867) at FVTPL Other foreign exchange gains/(losses), net (310) 430 7,720 )RUHLJQ_H[FKDQJH_JDLQV__ORVVHV___QHW K 340 K 32 K 1,853 28. EARNINGS PER EQUITY SHARE A reconciliation of profit for the year and equity shares used in the computation of basic and diluted earnings per equity share is set out below: Basic: Basic earnings per equity share is calculated by dividing the profit attributable to equity shareholders of the Company by the weighted average number of equity shares outstanding during the year, excluding equity shares purchased by the Company and held as treasury shares. Year ended Year ended Year ended March 31, 2024 March 31, 2025 March 31, 2026 3URŮW_DWWULEXWDEOH_WR_HTXLW¥_KROGHUV_RI_WKH_&RPSDQ¥ C 110,452 C 131,354 I 131,974 Weighted average number of equity shares outstanding 10,576,571,110 10,456,741,552 10,476,247,846 Basic earnings per equity share K 10.44 K 12.56 K 12.60 Diluted: Diluted earnings per equity share is calculated by adjusting the weighted average number of equity shares outstanding during the year for assumed conversion of all dilutive potential equity shares. Employee share options are dilutive potential equity shares for the Company. The calculation is performed in respect of share options to determine the number of equity shares that could have been acquired at fair value (determined as the average market price of the Company’s equity shares during the year). The number of equity shares calculated as above is compared with the number of equity shares that would have been issued assuming the exercise of the share options. Year ended Year ended Year ended March 31, 2024 March 31, 2025 March 31, 2026 3URŮW_DWWULEXWDEOH_WR_HTXLW¥_KROGHUV_RI_WKH_&RPSDQ¥ C 110,452 C 131,354 I 131,974 Weighted average number of equity shares outstanding 10,576,571,110 10,456,741,552 10,476,247,846 REPORT 2025-26 Effect of dilutive equivalent share options 34,853,518 32,197,840 27,175,090 Weighted average number of equity shares for diluted earnings ANNUAL 10,611,424,628 10,488,939,392 10,503,422,936 per share Diluted earnings per equity share K 10.41 K 12.52 K 12.56 INTEGRATED For the years ended March 31, 2024, 2025 and 2026, 128,916, 1,294,623 and 1,586,275 options, respectively, were excluded from the diluted weighted-average number of equity shares calculation because their effect would have been anti-dilutive. Earnings per share and number of shares outstanding for the year ended March 31, 2024, has been proportionately adjusted for the bonus issue in the ratio of 1:1 i.e. 1 (one) bonus equity share of I 2 each for every 1 (one) fully paid-up WIPRO equity shares held (including ADS holders). Refer to Note 22.


LOGO

491 Notes to the Consolidated Financial Statements (I in millions, except share and per share data, unless otherwise stated) 29. EMPLOYEE STOCK INCENTIVE PLANS The stock compensation expense recognized for employee services received during the years ended March 31, 2024, 2025 and 2026, were I 5,590, I 5,542, and I 4,465, respectively. Wipro Equity Reward Trust (“WERT”) In 1984, the Company established a controlled trust called WERT. In the previous years, WERT purchased shares of the Company out of funds borrowed from the Company. The Company’s Nomination and Remuneration Committee recommends to WERT certain officers and key employees, to whom WERT issues shares from its holdings at nominal price subject to vesting conditions. WERT held 5,952,740, 11,905,480 and 11,905,480 treasury shares as of March 31, 2024, 2025 and 2026, respectively. Wipro Employee Restricted Stock Unit Option Plans A summary of the general terms of grants under restricted stock unit (“RSU”) option plans are as follows: Number of options Range of Name of Plan reserved under H[HUFLVH_SULFH the plan Wipro ADS Restricted Stock Unit Plan (WARSUP 2004 plan)(1) 174,595,958 U.S.$ 0.03 Wipro Employee Restricted Stock Unit Plan 2005 (WSRUP 2005 plan)(1) 96,595,958 2 I Wipro Employee Restricted Stock Unit Plan 2007 (WSRUP 2007 plan)(1) 67,663,302 2 I Wipro Limited Employee Stock Options, Performance Stock Unit and/or Restricted Stock Unit 400,000,000 U.S.$ 0.03/ I 2 Scheme 2024 (Wipro 2024 Scheme)(1) (1) The maximum contractual term of these RSU option plans is perpetual until the options are available for grant under the plan. Employees covered under RSU options plans are granted an option to purchase shares of the Company at the respective exercise prices, subject to requirements of vesting conditions. These options generally vest in tranches over a period of one to three years from the date of grant. Upon vesting, the employees can acquire one equity share for every option and can exercise within a period of twelve months from the vesting date of last tranche under the grant. The activity in equity-settled RSU option plans is summarized below: Range of exercise Year ended Year ended Year ended price and weighted March 31, 2024 March 31, 2025 March 31, 2026 average exercise Numbers of Numbers of Numbers of price options options options C2 8,452,491 7,735,669 18,634,747 Outstanding at the beginning of the year U.S.$0.03 16,457,558 18,851,226 36,956,579 C2—10,749,111 -Bonus on outstanding (Refer to Note 22) U.S.$ 0.03—22,882,839 -C2 5,237,166 5,513,469 10,617,130 Granted U.S.$ 0.03 14,546,143 15,030,302 23,259,750 Adjustment of Performance based stock options on C2 (655,831) (331,920) (1,841,526) completion of performance measurement period U.S.$ 0.03 (1,807,750) (499,875) (3,986,719) C2 (4,151,654) (3,731,212) (5,293,789) Exercised U.S.$ 0.03 (6,674,868) (9,897,384) (10,982,620) C2 (1,146,503) (1,300,370) (2,771,279) Forfeited and expired U.S.$ 0.03 (3,669,857) (9,410,529) (8,303,933) C2 7,735,669 18,634,747 19,345,283 Outstanding at the end of the year U.S.$ 0.03 18,851,226 36,956,579 36,943,057 C2 1,905,001 1,996,731 2,010,308 Exercisable at the end of the year U.S.$ 0.03 2,038,346 1,007,466 1,283,137


LOGO

492 STATUTORY REPORTS AND FINANCIAL STATEMENTS CONSOLIDATED FINANCIAL STATEMENTS UNDER IFRS Notes to the Consolidated Financial Statements (I in millions, except share and per share data, unless otherwise stated) The Company has granted below options under RSU and ADS option plans(1): Year ended Year ended Year ended March 31, 2024 March 31, 2025 March 31, 2026 Restricted Stock Units (RSU) 3,344,668 3,498,476 6,743,031 Performance based stock options (RSUs) 1,892,498 2,014,993 3,874,099 Total 5,237,166 5,513,469 10,617,130 ADS RSU 8,886,979 9,707,235 14,834,924 Performance based stock options (ADS) 5,659,164 5,323,067 8,424,826 Total 14,546,143 15,030,302 23,259,750 (1) Numbers in above table for years ended March 31, 2024 and 2025 are not given effect of bonus shares issued during the year ended March 31, 2025. During the year ended March 31, 2026, RSU and ADS grants were issued under the Wipro 2024 Scheme. Performance-based stock options will vest based on the performance parameters of the Company. The activity in cash-settled RSU option plans is summarized below: Year ended Year ended Year ended March 31, 2024 March 31, 2025 March 31, 2026 Number of options Number of options Number of options Outstanding at the beginning of the year 11,800 7,000 -Exercised (4,800) —Forfeited and expired—(7,000) -Outstanding at the end of the year 7,000 —Exercisable at the end of the year 7,000 — The following table summarizes information about outstanding RSU option plans: 5DQJH_RI_H[HUFLVH_SULFH_ Year ended March 31, 2024 Year ended March 31, 2025 Year ended March 31, 2026 DQG_ZHLJKWHG_DYHUDJH_ Weighted average Weighted average Weighted average Number of Number of Number of H[HUFLVH_SULFH remaining life remaining life remaining life options options options (months) (months) (months) C 2 7,735,669 18 18,634,747 18 19,345,283 16 U.S.$ 0.03 18,851,226 20 36,956,579 19 36,943,057 18 The weighted average grant date fair value of options granted during the years ended March 31, 2024, 2025 and 2026 was I 387.67, I 454.58 and I 249.40 for each option, respectively. The weighted average share price of options exercised REPORT 2025-26 during the years ended March 31, 2024, 2025 and 2026 was I 422.87, I 389.52 and I 246.01 for each option, respectively. ANNUAL INTEGRATED WIPRO


LOGO

493 Notes to the Consolidated Financial Statements (I in millions, except share and per share data, unless otherwise stated) 30. EMPLOYEE BENEFITS a) Employee costs includes Year ended Year ended Year ended March 31, 2024 March 31, 2025 March 31, 2026 Salaries and bonus C 524,484 C 507,629 I 525,825 Contribution to provident and other funds 19,227 20,306 25,565 Share-based compensation(1) 5,590 5,542 4,465 K 549,301 K 533,477 K 555,855 (1) Includes I 6, I (9) and I Nil for the years ended March 31, 2024, 2025 and 2026, respectively, towards cash settled ADSs and RSUs. The employee benefit cost is recognized in the following line items in the consolidated statement of income: Year ended Year ended Year ended March 31, 2024 March 31, 2025 March 31, 2026 Cost of revenues C 459,466 C 452,800 I 480,122 Selling and marketing expenses 51,224 47,788 43,060 General and administrative expenses 38,611 32,889 32,673 K 549,301 K 533,477 K 555,855 Defined benefit plan actuarial (gains)/losses recognized in other comprehensive income include: Year ended Year ended Year ended March 31, 2024 March 31, 2025 March 31, 2026 Return on plan assets excluding interest income—loss/(gain) C (675) C (416) I 384 $FWXDULDO_ORVV__JDLQ__DULVLQJ_IURP_ŮQDQFLDO_DVVXPSWLRQV 373 146 730 Actuarial loss/(gain) arising from demographic assumptions 98 (115) 28 Actuarial loss/(gain) arising from experience adjustments 82 (12) (1,290) Change in the effect of asset ceiling—loss/(gain) (71) 74 6 _*DLQ__ORVV_RQ_UH_PHDVXUHPHQW_RI_GHÙQHG_EHQHÙW_SODQV__QHW K (193) K (323) K (142) Deferred tax (asset)/liability thereon 111 49 10 _*DLQ__ORVV_RQ_UH_PHDVXUHPHQW_RI_GHÙQHG_EHQHÙW_SODQV__QHW_RI_ K (82) K(274) K (132) GHIHUUHGbWD[HV


LOGO

494 STATUTORY REPORTS AND FINANCIAL STATEMENTS CONSOLIDATED FINANCIAL STATEMENTS UNDER IFRS Notes to the Consolidated Financial Statements (I in millions, except share and per share data, unless otherwise stated) b) Gratuity and foreign pension Defined benefit plans include gratuity for employees drawing salary in Indian Rupees, pension and certain benefit plans in foreign jurisdictions. Amount recognized in the consolidated statement of income in respect of defined benefit plans is as follows: Year ended Year ended Year ended March 31, 2024 March 31, 2025 March 31, 2026 Current service cost C 2,993 C 3,205 I 3,795 Past service cost — 3,566 1HW_LQWHUHVW_H[SHQVH_RQ_QHW_GHŮQHG_EHQHŮW_OLDELOLW¥ 45 95 268 Net charge to consolidated statement of income K 3,038 K 3,300 K 7,629 Actual return on plan assets C 1,828 C 1,646 I 879 Change in present value of defined benefit obligation is summarized below: As at As at March 31, 2025 March 31, 2026 ‘HŮQHG_EHQHŮW_REOLJDWLRQ_DW_WKH_EHJLQQLQJ_RI_WKH_¥HDU C 21,516 I 24,188 Addition through Business combination—1,311 Current service cost 3,205 3,795 Past service cost—3,566 Interest expense on obligation 1,308 1,506 %HQHÙWV_SDLG (2,627) (2,631) Contributions from plan participants and due to transfer 558 87 Remeasurement loss/(gain) _ $FWXDULDO_ORVV__JDLQ__DULVLQJ_IURP_ŮQDQFLDO_DVVXPSWLRQV 146 730 Actuarial loss/(gain) arising from demographic assumptions (115) 28 Actuarial loss/(gain) arising from experience adjustments (12) (1,290) Translation adjustment 209 1,291 ‘HŮQHG_EHQHŮW_REOLJDWLRQ_DW_WKH_HQG_RI_WKH_¥HDU K 24,188 K 32,581 Change in plan assets is summarized below: As at As at March 31, 2025 March 31, 2026 Fair value of plan assets at the beginning of the year C 20,022 I 22,231 2025-26 Addition through Business combination—211 REPORT Expected return on plan assets 1,230 1,263 Employer contributions 141 5,417 ANNUAL %HQHÙWV_SDLG (313) (188) Contributions from plan participants and due to transfer 558 87 INTEGRATED Remeasurement (loss)/gain Return on plan assets excluding interest income—(loss)/gain 416 (384) Translation adjustment 177 1,200 Fair value of plan assets at the end of the year K 22,231 K 29,837 WIPRO 


LOGO

495 Notes to the Consolidated Financial Statements (I in millions, except share and per share data, unless otherwise stated) As at As at March 31, 2025 March 31, 2026 ‘HÙQHG_EHQHÙW_REOLJDWLRQ C 24,188 I 32,581 Fair value of plan assets 22,231 29,837 Present value of unfunded obligation K (1,957) K (2,744) Change in the effect of asset ceiling (545) (678) Recognized liability K (2,502) K (3,422) Change in effect of asset ceiling is summarized below: As at As at March 31, 2025 March 31, 2026 Effect of asset ceiling at the beginning of the year C 442 I 545 Interest expense on effect of asset ceiling 17 25 Changes in the effect of limiting the surplus to the asset ceiling 74 6 Translation adjustment 12 102 Effect of asset ceiling at the end of the year K 545 K 678 As at March 31, 2025 and 2026, plan assets were primarily invested in insurer managed funds. The Company has established an income tax approved irrevocable trust fund to which it regularly contributes to finance the liabilities of the gratuity plan. The fund’s investments are managed by certain insurance companies as per the selection made by the trustees among the fund plan available. The principal assumptions used for the purpose of actuarial valuation of these defined benefit plans are as follows: As at As at March 31, 2025 March 31, 2026 Discount rate 5.75% 5.70% Expected return on plan assets 5.75% 5.70% Expected rate of salary increase 6.40% 6.44% :HLJKWHG_DYHUDJH_GXUDWLRQ_RI_GHÙQHG_EHQHÙW_REOLJDWLRQV 7.03 years 6.53 years The discount rate is primarily based on the prevailing market yields of government securities for the estimated term of the obligations. The estimates of future salary increase considered takes into account the inflation, seniority, promotion and other relevant factors. Attrition rate considered is the management’s estimate, based on previous years’ employee turnover of the Company. The expected return on plan assets is based on expectation of the average long-term rate of return expected on investments of the fund during the estimated term of the obligations.


LOGO

496 STATUTORY REPORTS AND FINANCIAL STATEMENTS CONSOLIDATED FINANCIAL STATEMENTS UNDER IFRS Notes to the Consolidated Financial Statements (I in millions, except share and per share data, unless otherwise stated) ([SHFWHG_IXWXUH_FRQWULEXWLRQ_DQG_HVWLPDWHG_IXWXUH_EHQHŮW_SD¥PHQWV_IURP_WKH_IXQG_DUH_DV_IROORZV_ For the year ended March 31, 2025 Expected contribution to the fund during the year ending March 31, 2026 C 3,545 (VWLPDWHG_EHQHŮW_SD¥PHQWV_IURP_WKH_IXQG_IRU_WKH_¥HDU_HQGLQJ_0DUFK____ 2026 C 3,565 2027 3,218 2028 2,953 2029 2,736 2030 2,412 Thereafter 17,692 Total K 32,576 For the year ended March 31, 2026 Expected contribution to the fund during the year ending March 31, 2027 I 3,515 (VWLPDWHG_EHQHŮW_SD¥PHQWV_IURP_WKH_IXQG_IRU_WKH_¥HDU_HQGLQJ_0DUFK____ 2027 I 5,493 2028 4,518 2029 4,134 2030 3,748 2031 3,493 Thereafter 21,690 Total K 43,076 The expected benefits are based on the same assumptions used to measure the Company’s benefit obligations as at March 31, 2026. Sensitivity for significant actuarial assumptions is computed to show the movement in defined benefit obligation by 1 percentage. As of March 31, 2026, every 1 percentage point increase/(decrease) in discount rate will result in (decrease)/increase of defined benefit obligation by approximately I (1,914) and I 2,228, respectively (March 31, 2025: I (1,565) and I 1,807, respectively). As of March 31, 2026, every 1 percentage point increase/(decrease) in expected rate of salary will result in increase/ (decrease) of defined benefit obligation by approximately I 1,620 and I (1,512), respectively (March 31, 2025: I 1,189 and I (1,129), respectively). REPORT 2025-26 The sensitivity analysis to significant actuarial assumptions may not be representative of the actual change in the defined benefit obligations as the change in assumptions may not occur in isolation since some of the assumptions may be ANNUAL correlated. Furthermore, in presenting the sensitivity analysis, the present value of the defined benefit obligations has been calculated using the projected unit credit method at the end of the reporting period, which is the same as that applied INTEGRATED in calculating the defined benefit obligation liability recognized in the consolidated statement of financial position. WIPRO


LOGO

497 Notes to the Consolidated Financial Statements (I in millions, except share and per share data, unless otherwise stated) c) Provident fund: The details of fund and plan assets are given below: As at As at March 31, 2025 March 31, 2026 Fair value of plan assets C 121,067 I 133,417 3UHVHQW_YDOXH_RI_GHÙQHG_EHQHÙW_REOLJDWLRQ (121,067) (133,417) Net shortfall K—K—The total expense for the years ended March 31, 2024, 2025 and 2026 is I 6,265, I 6,517 and I 7,058, respectively. The plan assets have been invested as per the regulations of Employees’ Provident Fund Organization (EPFO). The principal assumptions used in determining the present value obligation of interest guarantee under the deterministic approach are as follows: As at As at March 31, 2025 March 31, 2026 Discount rate for the term of the obligation 6.55% 6.50% Weighted average remaining tenure of investment portfolio 6.71 years 13.81 years Guaranteed rate of return 8.25% 8.25% d) Defined contribution plans: The total expense for the years ended March 31, 2024, 2025 and 2026 was I 9,969, I 10,584 and I 11,146, respectively. 31. RELATED PARTY RELATIONSHIP AND TRANSACTIONS The list of subsidiaries, associate and joint venture as of March 31, 2026 are provided in the table below: Country of Subsidiaries Subsidiaries Subsidiaries Holding Incorporation Attune Consulting India India 100.00% Private Limited Capco Technologies Private India 100.00% Limited Wipro Chengdu Limited China 8.96% Wipro Holdings (UK) Limited U.K. 100.00% Wipro Technologies SRL Romania ^ Wipro IT Services Bangladesh Bangladesh 100.00% Limited Wipro IT Services UK U.K. 100.00% Societas Capco Consulting Middle East FZE(2) UAE 100.00% Designit A/S Denmark 100.00% Designit Denmark A/S Denmark 100.00% Designit Germany GmbH Germany 100.00% Designit Oslo A/S Norway 100.00% Designit Spain Digital, S.L.U Spain 100.00% Designit T.L.V Ltd. Israel 100.00%


LOGO

498 STATUTORY REPORTS AND FINANCIAL STATEMENTS CONSOLIDATED FINANCIAL STATEMENTS UNDER IFRS Notes to the Consolidated Financial Statements (I in millions, except share and per share data, unless otherwise stated) Country of Subsidiaries Subsidiaries Subsidiaries Holding Incorporation Wipro Bahrain Limited Co. W.L.L Bahrain 100.00% Wipro Czech Republic IT Services Czech Republic 100.00% s.r.o. Wipro CRM Services Belgium 100.00% Wipro 4C Consulting France France 100.00% SAS Wipro CRM Services B.V. Netherlands 100.00% Wipro CRM Services ApS Denmark 100.00% Wipro CRM Services UK U.K. 100.00% Limited Grove Holdings 2 S.á.r.l Luxembourg 100.00% Capco Solution Services GmbH Germany 100.00% The Capital Markets Company Italy 100.00% Italy Srl Capco Brasil Serviços E Brazil 99.99% Consultoria Ltda The Capital Markets Company (1) Belgium 100.00% BV PT. WT Indonesia Indonesia 99.60% Rainbow Software LLC Iraq 100.00% Wipro Arabia Limited Saudi Arabia 66.67% Women’s Business Park Saudi Arabia 100.00% Technologies Limited Wipro Doha LLC Qatar 100.00% Wipro Financial Outsourcing Services U.K. 100.00% Limited Wipro UK Limited U.K. 100.00% Wipro Gulf LLC Sultanate of Oman 99.98% Wipro Information Technology Netherlands 100.00% Netherlands BV. Wipro Gulf LLC Sultanate of Oman 0.02% Wipro Technologies SA Argentina 2.62% Wipro (Thailand) Co. Limited Thailand 0.03% Wipro Technologies GmbH Germany 14.87% Wipro Do Brasil Sistemas De Brazil 0.07% Informatica Ltda Wipro do Brasil Technologia (1) Brazil 99.44% Ltda Wipro Information Technology Kazakhstan 100.00% 2025-26 Kazakhstan LLP REPORT Wipro Outsourcing Services Ireland 100.00% (Ireland) Limited Wipro Portugal S.A.(1) Portugal 100.00% ANNUAL Wipro Solutions Canada Canada 100.00% Limited INTEGRATED Wipro Technologies Limited Russia 99.99% Wipro Technologies Peru SAC Peru 99.98% Wipro Technologies W.T. Costa Rica 100.00% Sociedad Anonima Wipro Technology Chile SPA Chile 100.00% WIPRO Applied Value Technologies B.V. Netherlands 100.00%


LOGO

499 Notes to the Consolidated Financial Statements (I in millions, except share and per share data, unless otherwise stated) Country of Subsidiaries Subsidiaries Subsidiaries Holding Incorporation Wipro IT Service Ukraine, LLC Ukraine 100.00% Wipro IT Services Poland SP Z.O.O Poland 100.00% Wipro IT Services S.R.L. Romania 100.00% Wipro Regional Headquarter Saudi Arabia 100.00% Wipro Technologies Australia Pty Ltd Australia 100.00% Wipro Ampion Holdings Pty (1) Australia 100.00% Ltd Wipro Technologies SA Argentina 97.38% Wipro Technologies SA DE CV Mexico 91.08% Wipro Technologies South Africa South Africa 69.42% (Proprietary) Limited Wipro Technologies Nigeria Nigeria 99.84% Limited Wipro Technologies SRL Romania 100.00% Wipro (Thailand) Co. Limited Thailand 99.97% Wipro Shanghai Limited China 84.63% Wipro Technologies Nigeria Limited Nigeria 0.16% Wipro Technologies Limited Russia 0.01% Wipro Technologies Peru SAC Peru 0.02% Wipro Japan KK Japan 100.00% Wipro Networks Pte Limited Singapore 100.00% Applied Value Technologies Pte. Singapore 100.00% Limited Wipro Chengdu Limited China 91.04% PT. WT Indonesia Indonesia 0.40% Wipro (Thailand) Co. Limited Thailand ^ Wipro (Dalian) Limited China 100.00% Wipro Technologies SDN BHD Malaysia 100.00% Wipro (Tianjin) Limited(3) China 100.00% Wipro Philippines, Inc. Philippines 100.00% Wipro Shanghai Limited China 15.37% Wipro Travel Services Limited India 100.00% Wipro, LLC USA 100.00% Wipro Technologies SA DE CV Mexico 8.92% Wipro Gallagher Solutions, LLC USA 100.00% Wipro Insurance Solutions, LLC USA 100.00% Wipro IT Services, LLC(8) USA 100.00% Aggne Global Inc. USA 60.00% Edgile, LLC USA 100.00% HealthPlan Services, Inc.(1) USA 100.00% Infocrossing, LLC USA 100.00% International TechneGroup (1) USA 100.00% Incorporated Wipro NextGen Enterprise (1) USA 100.00% Inc. Rizing Intermediate Holdings, (1) USA 100.00% Inc. Wipro Appirio, Inc.(1) USA 100.00% Wipro Designit Services, Inc.(1) USA 100.00% Wipro Telecom Consulting LLC USA 100.00%


LOGO

500 STATUTORY REPORTS AND FINANCIAL STATEMENTS CONSOLIDATED FINANCIAL STATEMENTS UNDER IFRS Notes to the Consolidated Financial Statements (I in millions, except share and per share data, unless otherwise stated) Country of Subsidiaries Subsidiaries Subsidiaries Holding Incorporation Wipro VLSI Design Services, USA 100.00% LLC Applied Value Technologies, USA 100.00% Inc. Wipro Business Services LLC(10) USA 100.00% The Capital Markets Company, ___b___ USA 100.00% LLC Aggne Global IT Services Private India 60.00% Limited Wipro, Inc. USA 100.00% Wipro Life Science Solutions, LLC USA 100.00% Wipro Connected Services, Inc. (Formerly known as USA 100.00% Harman Connected Services, Inc.)(4) (5) Wipro Connected Services Mauritius Pvt Ltd (Formerly known as Harman Mauritius 100.00% Connected Services Mauritius 3YWb/WG_ Connected Services Corporation Wipro India Private Limited (Formerly known as India 98.40% Harman Connected Services Corporation India Pvt. Ltd.) Connected Services Corporation Wipro India Private Limited (Formerly India 1.60% known as Harman Connected Services Corporation India Pvt. Ltd.) Wipro Connected Services Engineering Corp. (Formerly known USA 100.00% as Harman Connected Services Engineering Corp.) Wipro Connected Services UK Limited (Formerly known as Harman UK 100.00% Connected Services UK Limited) Harman Connected Services Morocco 100.00% Morocco Wipro Connected Services US Midco LLC (Formerly known as Harman USA 100.00% Connected Services US Midco LLC) 2025-26 Harman Connected Services REPORT (1) Sweden 100.00% AB ANNUAL The Wipro SA Broad Based Ownership Scheme Trust INTEGRATED Wipro SA Broad Based Ownership 100.00% Scheme SPV (RF) (PTY) LTD Wipro Technologies South South Africa 30.58% Africa (Proprietary) Limited ^ Value is less than 0.01% WIPRO The Company controls ‘The Wipro SA Broad Based Ownership Scheme Trust’, ‘Wipro SA Broad Based Ownership Scheme SPV (RF) (PTY) LTD’ incorporated in South Africa and Wipro Foundation in India.


LOGO

501 Notes to the Consolidated Financial Statements (I in millions, except share and per share data, unless otherwise stated) (2) Grove Holdings 2 S.á.r.l. has transferred its entire shareholding in Capco Consulting Middle East FZE to Wipro IT Services UK Societas, effective September 19, 2025. (3) Wipro (Tianjin) Limited has been incorporated with effect from May 23, 2025, which is 100% held by Wipro Networks Pte Limited. (4) The Company, through its subsidiaries, has acquired 100% shareholding in Wipro Connected Services, Inc. (Formerly known as Harman Connected Services, Inc.) and its subsidiaries, effective December 1, 2025. (5) Wipro Digital Inc., a wholly owned subsidiary, has merged with Wipro Connected Services, Inc. (Formerly known as Harman Connected Services, Inc.), a step-down subsidiary, effective December 1, 2025. (6) Cardinal US Holdings, Inc transferred its entire ownership in Capco Consulting Services LLC to The Capital Markets Company, LLC effective March 30, 2026. (7) Capco RISC Consulting LLC merged with The Capital Markets Company, LLC effective March 30, 2026. (8) Cardinal US Holdings, Inc. merged with Wipro IT Services, LLC effective March 31, 2026. (9) Rizing Consulting USA, LLC (Formerly known as Rizing Consulting USA, Inc.) merged with Rizing LLC effective March 31, 2026. (10) Wipro Business Services LLC has been incorporated as a step down subsidiary of the Company with effect from January 20, 2026, which is 100% held by Wipro, LLC. (1) Step Subsidiary details of The Capital Markets Company LLC, HealthPlan Services, Inc., International TechneGroup Incorporated, Wipro NextGen Enterprise Inc., Rizing Intermediate Holdings, Inc., The Capital Markets Company BV, Wipro Ampion Holdings Pty Ltd, Wipro Appirio, Inc., Wipro Designit Services, Inc., Wipro do Brasil Technologia Ltda, Wipro Portugal S.A. and Harman Connected Services AB are as follows: Country of Subsidiaries Subsidiaries Subsidiaries Holding Incorporation The Capital Markets USA Company, LLC Capco Consulting Services LLC(6) USA 100.00% HealthPlan Services, Inc. USA HealthPlan Services Insurance USA 100.00% Agency, LLC International TechneGroup USA Incorporated International TechneGroup Ltd. U.K. 100.00% ,7,_3URŮFLHQF¥_/WG Israel 100.00% MechWorks S.R.L. Italy 100.00% Wipro NextGen Enterprise USA Inc. LeanSwift AB Sweden 100.00% Rizing Intermediate USA Holdings, Inc. Rizing Lanka (Private) Ltd Sri Lanka 100.00% Attune Netherlands B.V.(11) Netherlands 100.00% Rizing Solutions Canada Inc. Canada 100.00% Rizing LLC(9) USA 100.00% Rizing B.V. Netherlands 100.00% Rizing Consulting Ireland Ireland 100.00% Limited Rizing Consulting Pty Ltd. Australia 100.00% Rizing Geospatial LLC USA 100.00% Rizing GmbH Germany 100.00% Rizing Limited U.K. 100.00% Rizing Pte Ltd.(11) Singapore 100.00% The Capital Markets Belgium Company BV CapAfric Consulting (Pty) Ltd South Africa 100.00%


LOGO

502 STATUTORY REPORTS AND FINANCIAL STATEMENTS CONSOLIDATED FINANCIAL STATEMENTS UNDER IFRS Notes to the Consolidated Financial Statements (I in millions, except share and per share data, unless otherwise stated) Country of Subsidiaries Subsidiaries Subsidiaries Holding Incorporation Capco Belgium BV Belgium 100.00% The Capital Markets Company Slovakia 15.00% s.r.o Capco Consultancy (Thailand) Thailand 0.04% Ltd Capco Consultancy (Malaysia) Sdn. Malaysia 100.00% Bhd Capco Consultancy (Thailand) Ltd Thailand 99.92% Capco Consulting Singapore Pte. Ltd Singapore 100.00% Capco Greece Single Member P.C Greece 100.00% Capco Poland sp. z.o.o Poland 100.00% The Capital Markets Company (UK) U.K. 100.00% Ltd Capco Consultancy (Thailand) Thailand 0.04% Ltd The Capital Markets Company Hong Kong 0.01% Limited The Capital Markets Company Germany 100.00% GmbH Capco Austria GmbH Austria 100.00% The Capital Markets Company Hong Kong 99.99% Limited The Capital Markets Company Canada 100.00% Limited Capco Brasil Serviços E Brazil 0.01% Consultoria Ltda The Capital Markets Company S.á.r.l Switzerland 100.00% Andrion AG Switzerland 100.00% The Capital Markets Company S.A.S France 100.00% The Capital Markets Company s.r.o Slovakia 85.00% Wipro Ampion Australia Holdings Pty Ltd Wipro Revolution IT Pty Ltd Australia 100.00% Wipro Shelde Australia Pty Ltd Australia 100.00% Wipro Appirio, Inc. USA Wipro Appirio (Ireland) Limited Ireland 100.00% Wipro Appirio UK Limited U.K. 100.00% Topcoder, LLC USA 100.00% Wipro Designit USA 2025-26 Services, Inc. REPORT Wipro Designit Services Limited Ireland 100.00% Wipro do Brasil Brazil ANNUAL Technologia Ltda Wipro do Brasil Servicos Ltda Brazil 100.00% Wipro Do Brasil Sistemas De Brazil 96.84% INTEGRATED Informatica Ltda WIPRO


LOGO

503 Notes to the Consolidated Financial Statements (I in millions, except share and per share data, unless otherwise stated) Country of Subsidiaries Subsidiaries Subsidiaries Holding Incorporation Wipro Portugal S.A. Portugal Wipro do Brasil Technologia Ltda Brazil 0.56% Wipro Do Brasil Sistemas De Brazil 3.09% Informatica Ltda Wipro Technologies GmbH Germany 85.13% Wipro Business Solutions (11) Germany 100.00% GmbH Wipro IT Services Austria Austria 100.00% GmbH Harman Connected Services Sweden AB Harman Connected Services China 100.00% Solutions (Chengdu) Co. Ltd. (11) Step Subsidiary details of Attune Netherlands B.V., Rizing Pte Ltd. and Wipro Business Solutions GmbH are as follows: Country of Subsidiaries Subsidiaries Subsidiaries Holding Incorporation Attune Netherlands B.V. Netherlands Rizing Germany GmbH Germany 100.00% Attune Italia S.R.L Italy 100.00% Attune UK Ltd. U.K. 100.00% Rizing Pte Ltd. Singapore Rizing New Zealand Ltd. New Zealand 100.00% Rizing Philippines Inc. Philippines 100.00% Rizing SDN BHD Malaysia 100.00% Rizing Solutions Pty Ltd Australia 100.00% Wipro Business Solutions Germany GmbH Wipro Technology Solutions S.R.L Romania 100.00% As at March 31, 2026, Wipro, LLC held 43.7% interest in Drivestream Inc., incorporated in the USA, and Wipro IT Services LLC held 27% interest in SDVerse LLC, incorporated in the USA, accounted for using the equity method. The list of controlled trusts are: Name of the entity Country of incorporation Wipro Equity Reward Trust India Wipro Foundation India Vide the order dated June 06, 2025, the Hon’ble National Company Law Tribunal, Bengaluru bench, approved the scheme of amalgamation for the merger of wholly owned subsidiaries Wipro HR Services India Private Limited, Wipro Overseas IT Services Private Limited, Wipro Technology Product Services Private Limited, Wipro Trademarks Holding Limited and Wipro VLSI Design Services India Private Limited with Wipro Limited. As per the said scheme, the appointed date is April 1, 2025.


LOGO

504 STATUTORY REPORTS AND FINANCIAL STATEMENTS CONSOLIDATED FINANCIAL STATEMENTS UNDER IFRS Notes to the Consolidated Financial Statements (I in millions, except share and per share data, unless otherwise stated) The other related parties are: Name of the related parties: Nature Azim Premji Foundation Entity controlled by Promoters Azim Premji Foundation for Development Entity controlled by Promoters Hasham Traders Entity controlled by Promoters Prazim Traders Entity controlled by Promoters Zash Traders Entity controlled by Promoters Hasham Investment and Trading Co. Pvt. Ltd Entity controlled by Promoters Azim Premji Philanthropic Initiatives Pvt. Ltd Entity controlled by Promoters Azim Premji Trust Entity controlled by Promoters Azim Premji Trustee Company Pvt Ltd Entity controlled by Promoters Azim Premji Safe Deposit Pvt Ltd Entity controlled by Promoters Hasham Premji Pvt Ltd Entity controlled by Promoters PI Opportunities Fund I Entity controlled by Promoters PI Opportunities Fund II Entity controlled by Promoters Apex Trust Entity controlled by Promoters Napean Trading and Investment Company (Singapore) Pte Ltd Entity controlled by Promoters Pioneer Private Trust Entity controlled by Promoters Pioneer Investment Fund Entity controlled by Promoters Azim Premji Trust Services Pvt Ltd Entity controlled by Promoters Pl International Holdings LLC Entity controlled by Promoters Azim Premji Custodial & Management Service Private Limited Entity controlled by Promoters Azim Premji Education Trust Entity controlled by Promoters Prazim Trading & Investment Company Private Limited Entity controlled by Promoters Nina Investment & Estates Pvt. Ltd. Entity controlled by Promoters Varsha Investment & Estates Pvt. Ltd. Entity controlled by Promoters Bharti Investment & Estates Pvt. Ltd. Entity controlled by Promoters Napean Opportunities LLP Entity controlled by Promoters Best Value Chem Private Limited Entity controlled by Promoters PI Investment Advisory LLP Entity controlled by Promoters WEPL Family Trust Entity controlled by Promoters +¥JLHQLF_5HVHDUFK_,QVWLWXWH_3ULYDWH_/LPLWHGb Entity controlled by Promoters 2025-26 Wipro Enterprises (P) Limited and its subsidiaries Entity controlled by Promoters REPORT Azim Premji University Entity controlled by Promoters PI Opportunities Fund I Scheme II Entity controlled by Promoters ANNUAL PI Opportunities AIF V LLP Entity controlled by Promoters Vidyaniti LLP Entity controlled by Promoters INTEGRATED Pioneer Investment Fund Scheme II Entity controlled by Promoters Tariq Azim Premji Trust Entity controlled by Promoters WIPRO


LOGO

505 Notes to the Consolidated Financial Statements (I in millions, except share and per share data, unless otherwise stated) Name of the related parties: Nature Pioneer Independent Trust Entity controlled by Promoters Central Camera Co. Pvt. Ltd. Entity controlled by Promoters Gem Photographic (India) Pvt. Ltd. Entity controlled by Promoters Wipro GE Healthcare Private Limited Joint Venture between Wipro Enterprises (P) Limited and General Electric S.B. Packagings Private Limited (QWLW¥_ZLWK_VLJQLŮFDQW_LQůXHQFH_RI_ Promoters Financial Software and Systems Private Limited (QWLW¥_ZLWK_VLJQLŮFDQW_LQůXHQFH_RI_ Promoters Fab India Limited (QWLW¥_ZLWK_VLJQLŮFDQW_LQůXHQFH_RI_ Promoters Amagi Media Labs Private Limited (QWLW¥_ZLWK_VLJQLŮFDQW_LQůXHQFH_RI_ Promoters Finnovation Tech Solutions Private Limited (QWLW¥_ZLWK_VLJQLŮFDQW_LQůXHQFH_RI_ Promoters Shubham Housing Development Finance Company Limited (QWLW¥_ZLWK_VLJQLŮFDQW_LQůXHQFH_RI_ Promoters Microplastics Private Limited (QWLW¥_ZLWK_VLJQLŮFDQW_LQůXHQFH_RI_ Promoters Comfort Grid Technologies Private Limited (QWLW¥_ZLWK_VLJQLŮFDQW_LQůXHQFH_RI_ Promoters TI Medical Private Limited (QWLW¥_ZLWK_VLJQLŮFDQW_LQůXHQFH_RI_ Promoters Indiejewel Fashions Private Limited (QWLW¥_ZLWK_VLJQLŮFDQW_LQůXHQFH_RI_ Promoters The Woodenstreet Furnitures Private Limited (QWLW¥_ZLWK_VLJQLŮFDQW_LQůXHQFH_RI_ Promoters SBI General Insurance Company Limited (QWLW¥_ZLWK_VLJQLŮFDQW_LQůXHQFH_RI_ Promoters Weaver Services Private Limited (QWLW¥_ZLWK_VLJQLŮFDQW_LQůXHQFH_RI_ Promoters Krazybee Services Private Limited (QWLW¥_ZLWK_VLJQLŮFDQW_LQůXHQFH_RI_ Promoters 3RVW_HPSOR¥PHQW_EHQHŮW_SODQV Wipro Information Technology Limited Provident Fund Trust 3RVW_HPSOR¥PHQW_EHQHŮW_SODQV Wipro Systems Provident Fund Trust 3RVW_HPSOR¥PHQW_EHQHŮW_SODQV Wipro Limited Management Employees Pension Fund 3RVW_HPSOR¥PHQW_EHQHŮW_SODQV Wipro Limited BPO Division Employees Superannuation Trust 3RVW_HPSOR¥PHQW_EHQHŮW_SODQV Wipro Infotech Limited Management Employees Pension Fund 3RVW_HPSOR¥PHQW_EHQHŮW_SODQV Wipro Limited Employees Superannuation Fund 3RVW_HPSOR¥PHQW_EHQHŮW_SODQV Wipro Limited Employees Gratuity Fund 3RVW_HPSOR¥PHQW_EHQHŮW_SODQV Wipro Limited BPO Division Employees Gratuity Trust 3RVW_HPSOR¥PHQW_EHQHŮW_SODQV


LOGO

506 STATUTORY REPORTS AND FINANCIAL STATEMENTS CONSOLIDATED FINANCIAL STATEMENTS UNDER IFRS Notes to the Consolidated Financial Statements (I in millions, except share and per share data, unless otherwise stated) Name of the related parties: Nature Key management personnel $]LP_+__3UHPMLbb Non-Executive, Non-Independent Director (designated as “Founder Chairman”)(1) 5LVKDG_$__3UHPMLbbbbbbbbb Chairman of the Board (designated as “Executive Chairman”) Srinivas Pallia &KLHI_([HFXWLYH_2IÙFHU_DQG_0DQDJLQJ_ Director Aparna C. Iyer &KLHI_)LQDQFLDO_2IÙFHU Päivi Rekonen Independent Director 1__6__.DQQDQb Independent Director ‘U__3DWULFN_-__(QQLVbbbbbbbbbbbb Independent Director(2) 3DWULFN_‘XSXLVbbb Independent Director(2) Laura Marie Miller Independent Director(3) Deepak M. Satwalekar ,QGHSHQGHQW_‘LUHFWRUb Tulsi Naidu ,QGHSHQGHQW_‘LUHFWRUb (1) Mr. Azim H. Premji is the ultimate controlling party. (2) Dr. Patrick J. Ennis and Mr. Patrick Dupuis retired from their positions as Independent Directors of the Company with effect from the close of business hours on March 31, 2026. (3) On March 5, 2026, the Board of Directors approved the appointment of Ms. Laura Marie Miller as an Additional Director in the capacity of Independent Director for a term of five years, with effect from April 1, 2026 to March 31, 2031, subject to the approval of the Members of the Company. The appointment was approved by the Members of the Company vide special resolution dated May 21, 2026, passed through postal ballot by e-voting. Close members of Key Management Personnel:—Yasmeen A. Premji—Tariq A. Premji—Aditi Mehta Premji—Avita Hazarika REPORT 2025-26 ANNUAL INTEGRATED WIPRO


LOGO

507 Notes to the Consolidated Financial Statements (I in millions, except share and per share data, unless otherwise stated) The Company has the following related party transactions: Entities controlled E¥_ZLWK_VLJQLŮFDQW_ Key Management Associate / Joint Other related LQùXHQFH_RI_ Personnel Venture parties Promoters Transactions for the year ended March 31, 2024 Sale of goods and services C 559 C—C—C -Purchase of services — 107 -Items of property, plant and equipments purchased 330 — -Dividend(1) 3,577 232 —Buyback of shares(1) 81,093 5,028 —Rental income 26 — -Rent paid ^ 7 — &RQWULEXWLRQ_WR_SRVW_HPSOR¥PHQW_EHQHŮW_SODQV ——6,265 Others 14 ——Key management personnel(2)(3) 5HPXQHUDWLRQ_DQG_VKRUW_WHUP_EHQHÙWV(4) C—C 1,321 C—C—2WKHU_EHQHÙWV(5)—585 — Balance as at March 31, 2024 Receivables C 478 C—C—C -Payables—638 — Entities controlled E¥_ZLWK_VLJQLŮFDQW_ Key Management Associate / Joint Other related LQùXHQFH_RI_ Personnel Venture parties Promoters Transactions for the year ended March 31, 2025 Sale of goods and services C 305 C—C—C -Purchase of services 423 — -Items of property, plant and equipments purchased 155 — -Dividend(1) 42,923 2,780 —Buyback of shares(1) — —Rental income 31 — -Rent paid 1 12 — &RQWULEXWLRQ_WR_SRVW_HPSOR¥PHQW_EHQHŮW_SODQV ——6,517 Others 70 ——Key management personnel(2)(6) 5HPXQHUDWLRQ_DQG_VKRUW_WHUP_EHQHÙWV(4) C—C 596 C—C—2WKHU_EHQHÙWV(5)—283 — Balance as at March 31, 2025 Receivables C 255 C—C—C -Payables—254 —


LOGO

508 STATUTORY REPORTS AND FINANCIAL STATEMENTS CONSOLIDATED FINANCIAL STATEMENTS UNDER IFRS Notes to the Consolidated Financial Statements (I in millions, except share and per share data, unless otherwise stated) Entities controlled by/ Key Associate / Joint Other related ZLWK_VLJQLÙFDQW_ Management Venture parties LQùXHQFH_RI_ Personnel Promoters Transactions for the year ended March 31, 2026 Sale of goods and services I 358 I—I 7 I -Purchase of services 169 — -Items of property, plant and equipments 145 — -purchased Ticketing and hospitality 418 ——Dividend(1) 78,692 5,097 — Rental income 11 —-Rent paid 1 12--Sale of investment — 181 -Advance paid to supplier 46 —- &RQWULEXWLRQ_WR_SRVW_HPSOR¥PHQW_EHQHŮW_SODQV ——7,058 Contribution to Gratuity trust ——5,220 Investment — 348 -Others 20 —- Key management personnel(2) 5HPXQHUDWLRQ_DQG_VKRUW_WHUP_EHQHÙWV(4) 505 I—I I—I—2WKHU_EHQHÙWV(5)—273-- Balance as at March 31, 2026 Receivables I 371 I—I—I -Payables—138-- ^ Value is less than 0.5 (1) Includes relative of key management personnel. (2) Post-employment benefits and other long-term benefits including compensated absences are not disclosed, as these are determined for the Company as a whole based on actuarial valuation. (3) Remuneration, short-term benefits and other benefits for Mr. Thierry Delaporte includes cash compensation in amount of I 415, cost of accelerated vesting of I 310 towards unvested stock options and I 196 towards social security contributions. 2025-26 (4) Remuneration and short-term benefits includes sitting fees and commission paid to non-executive directors, non-independent directors, and REPORT independent directors. (5) Other benefits include I 575, I 277, and I 267 as of March 31, 2024, 2025 and 2026, respectively towards amortization of RSUs granted to key ANNUAL management personnel, which vest over a period of time. This also includes RSU’s that will vest based on performance parameters of the Company. (6) Remuneration, short-term benefits and other benefits for Mr. Srinivas Pallia is for the period from April 7, 2024 to March 31, 2025. INTEGRATED During the year ended March 31, 2025, the Company allotted 231,642,592 equity shares to Key management personnel and 3,576,894,608 equity shares to entities controlled by promoters on account of bonus issue. All related party transactions were entered at an arm’s length basis and in the ordinary course of business. There are no materially significant related party transactions made by the Company with promoters, directors or key management WIPRO personnel, which may have a potential conflict with the interests of the Company at large.


LOGO

509 Notes to the Consolidated Financial Statements (I in millions, except share and per share data, unless otherwise stated) 32. COMMITMENTS AND CONTINGENCIES Capital commitments: As at March 31, 2025 and 2026, the Company had committed to spend approximately I 8,719 and I 9,416 respectively, under agreements to purchase/construct property and equipment. These amounts are net of capital advances paid in respect of these purchases. Refer to Note 8 for uncalled capital commitments investment on equity instruments. Guarantees: As at March 31, 2025 and 2026, guarantees provided by banks on behalf of the Company to the Indian Government, customers and certain other agencies amount to approximately I 13,110 and I 13,358 respectively, as part of the bank line of credit. Contingencies and lawsuits: The Company is subject to legal proceedings and claims resulting from tax assessment orders/ penalty notices issued under the Income-tax Act, 1961, which have arisen in the ordinary course of its business. Some of the claims involve complex issues and it is not possible to make a reasonable estimate of the expected financial effect, if any, that will result from ultimate resolution of such proceedings. However, the resolution of these legal proceedings is not likely to have a material and adverse effect on the results of operations or the financial position of the Company. The Company’s assessments in India are completed for the years up to March 31, 2022. The Company has received demands on multiple tax issues. These claims are primarily arising out of denial of deduction under section 10A of the Income-tax Act, 1961 in respect of profit earned by the Company’s undertaking in Software Technology Park in Bengaluru, the appeals filed against the said demand before the appellate authorities have been allowed in favor of the Company by the second appellate authority for the years up to March 31, 2008 which either has been or may be contested by the Income tax authorities before the Hon’ble Supreme Court of India. Other claims relate to disallowance of tax benefits on profits earned from Software Technology Park and Special Economic Zone units, capitalization of research and development expenses, transfer pricing adjustments on intercompany/inter unit transactions and other issues. Income tax claims against the Company amounting to I 99,431 and I 104,613 are not acknowledged as debt as at March 31, 2025 and 2026, respectively. These matters are pending before various appellate authorities and the management expects its position will likely be upheld on ultimate resolution and will not have a material adverse effect on the Company’s financial position and results of operations. The contingent liability in respect of disputed demands for excise duty, custom duty, sales tax and other matters amounting to I 19,292 and I 20,733 as of March 31, 2025 and 2026, respectively. However, the resolution of these disputed demands is not likely to have a material and adverse effect on the results of operations or the financial position of the Company. 33. SEGMENT INFORMATION The Company is now organized into the following operating segments: IT Services and IT Products. IT Services: The IT Services segment primarily consists of IT services offerings to customers organized by four Strategic Market Units (“SMUs”)—Americas 1, Americas 2, Europe and Asia Pacific Middle East and Africa (“APMEA”). Americas 1 and Americas 2 are primarily organized by industry sector, while Europe and APMEA are organized by countries. Americas 1 includes the entire business of Latin America (“LATAM”) and the following industry sectors in the United States of America: Communication, Media and Networks, Technology Software and Gaming, Technology New Age, Health and Consumer. Americas 2 includes the entire business in Canada and the following industry sectors in the United States of America: Banking and Financial services, Energy, Manufacturing and Resources, Capital markets and Insurance and Hi-tech. Europe consists of the United Kingdom and Ireland, Switzerland, Germany and Western Europe. APMEA consists of Australia and New Zealand, Southeast Asia, Japan, India, the Middle East and Africa.


LOGO

510 STATUTORY REPORTS AND FINANCIAL STATEMENTS CONSOLIDATED FINANCIAL STATEMENTS UNDER IFRS Notes to the Consolidated Financial Statements (I in millions, except share and per share data, unless otherwise stated) Revenue from each customer is attributed to the respective SMUs based on the location of the customer’s primary buying center of such services. With respect to certain strategic global customers, revenue may be generated from multiple countries based on such customer’s buying centers, but the total revenue related to these strategic global customers are attributed to a single SMU based on the geographical location of key decision makers. Our IT Services segment provides a range of AI-powered IT and IT-enabled services including AI advisory, industry & functional consulting, AI native development, customer centric design, modernization, custom application development, infrastructure services, cybersecurity services, data and analytics services, business process services, research and development, and hardware and software design. Through AI-powered, consulting-led solutions, we help our clients transform their businesses to drive better efficiencies and generate new growth opportunities. IT Products: The Company is a value-added reseller of security, packaged and SaaS software for leading international brands. In certain total outsourcing contracts of the IT Services segment, the Company delivers hardware, software products and other related deliverables. Revenue relating to these items is reported as revenue from the sale of IT Products. The Chief Executive Officer (“CEO”) and managing director of the Company has been identified as the Chief Operating Decision Maker as defined by IFRS 8, “Operating Segments”. The CEO evaluates the segments based on their revenue growth and operating income. Assets and liabilities used in the Company’s business are not identified to any of the operating segments, as these are used interchangeably between segments. Management believes that it is currently not practicable to provide segment disclosures relating to total assets and liabilities since a meaningful segregation of the available data is onerous. Information on reportable segments for the year ended March 31, 2024 is as follows: IT Services IT Reconciling Total Americas 1 Americas 2 Europe APMEA Total Products Items Revenue C 268,230 C 269,482 C 253,927 C 102,177 C 893,816 C 4,127 C—C 897,943 Segment result 59,364 59,163 33,354 12,619 164,500 (371) (7,726) 156,403 Unallocated (20,304) — (20,304) Segment result total K 144,196 K (371) K (7,726) K 136,099 Finance expense (12,552) Finance and other 23,896 income 6KDUH_RI_QHW_SURÙW_ (loss) of associate (233) accounted for using the equity method 3URÙW_EHIRUH_WD[ K 147,210 REPORT 2025-26 Income tax expense (36,089) ANNUAL 3URŮW_IRU_WKH_¥HDU K 111,121 Depreciation, INTEGRATED amortization and C 34,071 impairment WIPRO


LOGO

511 Notes to the Consolidated Financial Statements (I in millions, except share and per share data, unless otherwise stated) Information on reportable segments for the year ended March 31, 2025 is as follows: IT Services IT Reconciling Total Americas 1 Americas 2 Europe APMEA Total Products Items Revenue C 281,824 C 271,972 C 240,077 C 94,351 C 888,224 C 2,692 C—C 890,916 Segment result 58,186 61,326 29,434 12,850 161,796 (173) (195) 161,428 Unallocated (10,157) — (10,157) Segment result total K 151,639 K (173) K (195) K 151,271 Finance expense (14,770) Finance and other income 38,202 6KDUH_RI_QHW_SURÙW__ORVV__RI_ associate and joint venture 254 accounted for using the equity method 3URÙW_EHIRUH_WD[ K 174,957 Income tax expense (42,777) 3URŮW_IRU_WKH_¥HDU K 132,180 Depreciation, amortization and impairment C 29,579 Information on reportable segments for the year ended March 31, 2026 is as follows: IT Services IT Reconciling Total Americas 1 Americas 2 Europe APMEA Total Products Items Revenue I 305,571 I 269,077 I 244,165 I 102,340 I 921,153 I 6,940 I—I 928,093 Segment result 62,896 53,138 31,083 14,955 162,072 559 (7,954) 154,677 Unallocated (3,426) — (3,426) Segment result total K 158,646 K 559 K (7,954) K 151,251 Finance expense (14,577) Finance and other income 36,491 6KDUH_RI_QHW_SURÙW__ORVV__RI_ associate and joint venture 257 accounted for using the equity method 3URÙW_EHIRUH_WD[ K 173,422 Income tax expense (40,767) 3URŮW_IRU_WKH_¥HDU K 132,655 Depreciation, amortization and impairment I 29,107 Revenues from India, being the Company’s country of domicile, were I 23,484, I 20,699 and I 23,446 for years ended March 31, 2024, 2025 and 2026, respectively.


LOGO

512 STATUTORY REPORTS AND FINANCIAL STATEMENTS CONSOLIDATED FINANCIAL STATEMENTS UNDER IFRS Notes to the Consolidated Financial Statements (I in millions, except share and per share data, unless otherwise stated) Revenues from the United States of America and United Kingdom contributed more than 10% of Company’s total revenues as per table below: Year ended Year ended Year ended March 31, 2024 March 31, 2025 March 31, 2026 United States of America C 512,740 C 529,943 I 553,186 United Kingdom 108,613 95,241 97,041 K 621,353 K 625,184 K 650,227 No customer individually accounted for more than 10% of the revenues during the years ended March 31, 2024, 2025 and 2026. Management believes that it is currently not practicable to provide disclosure of geographical location wise assets, since the meaningful segregation of the available information is onerous. Notes: a) “Reconciling Items” includes elimination of inter-segment transactions and other corporate activities. b) Revenue from sale of Company owned intellectual properties is reported as part of IT Services revenues. c) For the purpose of segment reporting, the Company has included the impact of “foreign exchange gains/ (losses), net” in revenues, which is reported as a part of operating profit in the consolidated statement of income, amounting to I 340, I 32 and I 1,853 for the fiscal years ended March 31, 2024, 2025 and 2026, respectively. d) Restructuring cost of I 6,814, I Nil and I 5,139 is included under Reconciling items for the years ended March 31, 2024, 2025 and 2026, respectively. e) Reconciling Items for the year ended March 31, 2024, includes employee costs of I 921 towards outgoing CEO and managing director. f) Impact of past service cost on gratuity and remeasurement of leave encashment due to implementation of new labour code amounting to I 2,756 for the year ended March 31, 2026, is included under Reconciling items. g) “Unallocated” within IT Services segment includes: Year ended Year ended Year ended March 31, 2024 March 31, 2025 March 31, 2026 Amortization and impairment expenses on intangible C 11,756 C 7,909 I 7,787 assets (Refer to Note 6) Change in fair value of contingent consideration 49 (1,300) (169) (Refer to Note 19) Segment results of IT Services segment for the year ended March 31, 2024 are after considering additional amortization due to change in estimate of useful life of the customer-related intangibles in an earlier REPORT 2025-26 business combination. ANNUAL h) Segment results of IT Services segment are after recognition of share-based compensation expense I 5,590, I 5,542 and I 4,465 for the years ended March 31, 2024, 2025 and 2026, respectively. INTEGRATED i) Segment results of IT Services segment are after recognition of (gain)/loss on sale of property, plant and equipment of, I (2,072), I (606) and I (393) for the years ended March 31, 2024, 2025 and 2026, respectively. WIPRO


LOGO

513 Notes to the Consolidated Financial Statements (I in millions, except share and per share data, unless otherwise stated) 34. On November 21, 2025, the Government of India notified four labour codes (the “Labour Codes”), effective immediately, replacing the existing 29 labour laws. In accordance with IAS 19, employee benefits and changes to employee benefit plans arising from legislative amendments are treated as plan amendments, requiring immediate recognition of past service cost in the Statement of Income. This approach is consistent with the guidance issued by the Institute of Chartered Accountants of India. The Company has concluded the salary restructuring exercise in compliance with the Labour Codes. The implementation of the Labour Codes has resulted in a net increase of I 2,756 in the provision for gratuity and remeasurement of leave encashment, which has been recognized as employee benefit expense in the current year. The Company continues to monitor the finalization of Central and State Rules, as well as Government clarifications on other aspects of the Labour Codes. 35. EVENTS AFTER THE REPORTING PERIOD a) The Company completed its acquisition of Mindsprint, Olam Group’s IT services arm, a provider of technology and digital transformation services in May 2026 for a total consideration of U.S.$ 375 million. b) On April 14, 2026, the Company signed a definitive agreement to acquire select customer contracts of Alpha Net Consulting, a provider of enterprise software development, data engineering, and managed services for a total consideration (including earnouts) of U.S.$ 70.8 million. The acquisition is subject to customary closing conditions and is expected to be concluded by quarter ending June 30, 2026. c) On April 16, 2026, the Company’s Board of Directors approved a proposal to buyback of equity shares, subject to the approval of shareholders, for purchase by the Company of up to 600,000,000 equity shares of I 2 (U.S.$ 0.02*) each (being 5.7% of total number of equity shares) from the shareholders of the Company on a proportionate basis by way of a tender offer at a price of I 250 (U.S.$ 2.71*) per equity share for an aggregate amount not exceeding I 150,000 (U.S.$ 1,626*), in accordance with the provisions contained in the SEBI (Buy-back of Securities) Regulations, 2018, as amended and the Companies Act, 2013 and rules made thereunder. This proposal was approved by the shareholders of the Company by way of a special resolution dated May 21, 2026, passed through postal ballot by e-voting. *Based on the certified foreign exchange rates published by the Federal Reserve Board of Governors on April 8, 2026, which was I 92.25 per U.S.$ 1. d) On June 1, 2026, the Company acquired additional 20% equity interest in Aggne Global Inc. for a consideration of U.S. $ 28.5 million. As per our report of even date attached For and on behalf of the Board of Directors for Deloitte Haskins & Sells LLP Rishad A. Premji Deepak M. Satwalekar Srinivas Pallia Chartered Accountants Chairman Director Chief Executive Officer Firm’s Registration No: 117366W/W—100018 (DIN: 02983899) (DIN: 00009627) and Managing Director (DIN: 10574442) Anand Subramanian Aparna C. Iyer M. Sanaulla Khan Partner Chief Financial Officer Company Secretary Membership No.: 110815 Membership No.: F4129 Bengaluru June 2, 2026


LOGO

568 GLOSSARY Sl. No. Abbreviation Expansion 1 ABAC Anti-Bribery and Anti-Corruption 2 ACV Annual contract value 3 ADR American Depositary Receipt 4 ADS American Depositary Share 5 AE Automobile Engineering 6 AGM Annual General Meeting 7 AHU Air Handling Units 8 AI $UWLŮFLDO_,QWHOOLJHQFH 9 AI/ML $UWLŮFLDO_,QWHOOLJHQFH_0DFKLQH_/HDUQLQJ 10 AMC Annual Maintenance Contracts 11 AML Anti- Money Laundering 12 ANZ Australia and New Zealand 13 APAC $VLD_3DFLŮF_ 14 APMEA $VLD_3DFLŮF__0LGGOH_(DVW_DQG_$IULFD 15 AR Augmented Reality 16 AWS Amazon Web Services 17 BCMS Business Continuity Management System 18 BCWI Best Companies for Women in India 19 BFSI Banking, Financial Services & Insurance 20 BI Business Intelligence 21 BIC Bangalore International Center 22 BMS Building Management System 23 BPS Basis points 24 BRSR Business Responsibility and Sustainability Report 25 BSE Bombay Stock Exchange 26 BSF Bengaluru Sustainability Forum 27 C&D Construction and Demolition 28 CAGR Compounded Annual Growth Rate 29 CBU Consumer Business Unit 30 CC Constant Currency 2025-26 31 CDP Carbon disclosure Project REPORT 32 CEO &KLHI_([HFXWLYH_2IÙFHU 33 CFO &KLHI_)LQDQFLDO_2IÙFHU Glossary ANNUAL 34 CHRO &KLHI_+XPDQ_5HVRXUFH_2IÙFHU_ 35 CII Confederation of Indian Industry INTEGRATED 36 CII – GBC Green Business Centre of the Confederate of Indian Industries 37 CIN Corporate Identity Number 38 CIO &KLHI_,QIRUPDWLRQ_2IÙFHU WIPRO 39 CIS Cloud and Infrastructure Services


LOGO

569 Sl. No. Abbreviation Expansion Sl. No. Abbreviation Expansion 40 COBC Code of Business Conduct 79 EVP Employer Value Proposition 41 CoE Center of Excellence 80 FA Financial Advisors 42 COO &KLHI_2SHUDWLRQ_2IÙFHU 81 FCA Financial Conduct Authority 43 COSO Committee of Sponsoring Organizations 82 FCPA Foreign Corrupt Practices Act 44 CRS Cybersecurity and Risk Services 83 FGD Focus group discussion 45 CSAT Customer Satisfaction 84 FPGA Field-Programmable Gate Arrays 46 CSO &KLHI_6XVWDLQDELOLW¥_RIŮFHU 85 FY Financial Year 47 CSR Corporate Social Responsibility 86 GAAP Generally Accepted Accounting Principles 48 CSRD Corporate Sustainability Reporting Directive 87 GAE Global Account Executive 49 CTO &KLHI_7HFKQRORJ¥_2IŮFHU 88 GBL Global Business Lines 50 CwD Children with Disabilities 89 GDP Gross Domestic Product 51 CX Customer Experience 90 GDPR General Data Protection Regulation 52 CXO &KLHI_([SHULHQFH_2IÙFHU 91 GDR Global Depository Receipt 53 DAAI ‘DWD__$QDO¥WLFV__DQG_$UWLŮFLDO_,QWHOOLJHQFH_ 92 GEC Global Electronics Council 54 DASRA Developmental Action, Research, and 93 GECC Global Energy Command Centre Social Advancement 94 GEI Gender-Equality Index 55 DE Digital Engineering 95 Gen AI *HQHUDWLYH_$UWLŮFLDO_LQWHOOLJHQFH 56 DEI Diversity, Equity and Inclusion 96 GHG GreenHouse Gas 57 DJSI Dow Jones Sustainability Indices 97 GoI Government of India 58 DOP Digital Operations and Platforms 98 GRI Global Reporting Initiative 59 DP Data Privacy 99 GSSB Global Sustainability Standard Board 60 DX Digital Experience 100 HNI High Networth Individual 61 E- IQ Enterprise Intelligence Quotient 101 HRO +XPDQ_5HVRXUFH_2IÙFH 62 E2E end-to-end 102 HRSS HR Shared Services 63 EA Enterprise Applications 103 HUB Historically Underutilized Businesses 64 EBITDA Earnings before Interest, Tax, Depreciation 104 HUF Hindu Undivided Family and Amortization 105 HVAC Heating, Ventilation, and Air Conditioning 65 EES Employee Experience Survey 106 I&B Inclusion and Belonging 66 EMR Energy, Manufacturing & Resources 107 I&D Inclusion and Diversity 67 EMS Environmental Management System 108 IAAS Infrastructure as a Service 68 ENU Energy, Natural Resources and Utilities 109 IAS International Accounting Standards 69 EPEAT Electronic Product Environmental 110 IASB International Accounting Standards Board Assessment Tool 70 EPI Energy Performance Index 111 IC Integrated Circuit 71 EPS Earnings Per Share 112 IC&D Industry Cloud and Digital 72 ER&D Engineering, Research and Development 113 ICRA Investment Information and Credit Rating Agency 73 ERG Employee resource group 114 IEPF Investor Education and Protection Fund 74 ERM Enterprise Risk Management 115 IFRS International Financial Reporting Standards 75 ESG Environmental, Social and Governance 116 IIA Institute of Internal Auditors 76 ESOP Employee Stock Option 117 IIRC International Integrated Reporting Council 77 ESS Employee Satisfaction Survey 118 IIT Indian Institute of Technology 78 EV Electric vehicle


LOGO

570 GLOSSARY Sl. No. Abbreviation Expansion 119 ILO International Labour Organization 120 Ind AS Indian Accounting Standards 121 IoT Internet of Things 122 IP Intellectual Property 123 ISG Information Services Group 124 ISIN International Securities ,GHQWLÙFDWLRQ_1XPEHU 125 ISO International Standards Organization 126 ISSB International Sustainability Standards Board 127 IT Information technology 128 KMP Key Managerial Personnel 129 KPI Key Performance Indicator 130 KRA Key Responsibility Area 131 LEED Leadership in Energy and Environmental Designs 132 LOC /HWWHU_RI_&RQÙUPDWLRQ 133 LOS Loan Origination Systems 134 Lpcd Liters per capita per day 135 M&A Mergers and Acquisitions 136 MAP Museum of Art and Photography 137 MD Managing Director 138 ML Machine learning 139 MOU Memorandum of Understanding 140 MRE Median Remuneration of employees 141 MSA Master Service Agreement 142 MSCI Morgan Stanley Capital International 143 MSCI ESG Morgan Stanley Capital International Environmental Social and Governance 144 MSME Micro, Small and Medium Enterprises 145 NASSCOM National Association of Software and Services Companies 2025-26 146 NCV Natural Capital Valuation REPORT 147 NGO Non-Government Organization 148 NSE National Stock Exchange of India Limited ANNUAL 149 NYSE New York Stock Exchange 150 OEM Original Equipment Manufacturer INTEGRATED 151 OFAC 2IŮFH_RI_)RUHLJQ_$VVHWV_&RQWURO 152 OM Operating Margin 153 OT Operational Technology 154 PE Price Earnings WIPRO 155 PIA Privacy Impact Assessments


LOGO

571 Sl. No. Abbreviation Expansion Sl. No. Abbreviation Expansion 156 PII 3HUVRQDOO¥_,GHQWLŮDEOH_,QIRUPDWLRQ 189 SOW Statement of Work 157 PLM Product Lifecycle Management 190 SOX Sarbanes’ Oxley 158 PPA Private Purchase Agreements 191 STEM Science, Technology, Engineering and Mathematics 159 PPE Personal Protection Equipment 192 STP Sewage Treatment Plants 160 PSH/POSH Prevention of Sexual Harassment 193 SWM Solid Waste Management 161 PSU Performance based Stock Units 194 SWOT Strengths, Weaknesses, Opportunities, 162 PWD People with Disabilities 163 R&D Research and Development and Threats 164 RCP Representative Concentration Pathways 195 T&M Time and Material 165 REC 5HQHZDEOH_(QHUJ¥_&HUWLŮFDWH 196 TCFD Task Force on Climate-related Financial Disclosures 166 REI Renewable Energy Initiative 197 TCV Total Contract Value 167 ROI Return on Investment 198 TECH Technology 168 RPT Related Party Transactions 199 UK United Kingdom 169 RSA Republic of South Africa 200 UPSI Unpublished Price Sensitive Information 170 RSU Restricted Stock Units 201 VC Video Conferencing 171 RTA Registrar and Transfer Agent 202 VILT Virtual Instructor-led Trainings 172 RWH Rain water harvesting 203 VIU Value-in-Use 173 SAAB Sustainability Accounting Standard Board 204 VLSI Very-Large-Scale-Integration 174 SaaS Software as a Service 205 VR Virtual Reality 175 SAP Systems, Applications & Products in 206 VRA Vendor Risk Assessment Data Processing 176 SASB Sustainability Accounting Standards Board 207 WEF World Economic Forum 177 SBTi Science-Based Targets initiative 208 WeGA Wipro Enterprise Generative AI 178 SCOC Supplier Code of Conduct 209 WERT Wipro Equity Reward Trust 179 SCRA Securities Contracts Regulation Act 210 WFH Work from Home 180 SDG Sustainable Development Goals 211 WGS Wipro Gallagher Solutions 181 SDI Smart, Digital, and Intelligent 212 WHO World Health Organization 182 SDLC Software Development Lifecycle 213 WISDOM Wipro Inclusive Supplier Development and Mentorship 183 SDV 6RIWZDUH_GHÙQHG_YHKLFOH 214 WISE Wipro Initiative for Supplier Engagement 184 SEBI Securities and Exchange Board of India 215 WLI Wipro Leadership Institute 185 SEC Securities Exchange Commission 216 WoW Women of Wipro 186 SEZ Special Economic Zones 217 WTD Whole-time Directors 187 SMU Strategic Marketing Units 218 YoY Year-on-Year 188 SoW Spirit of Wipro


LOGO

WIPRO INTEGRATED ANNUAL REPORT 2025-26 Notes 


LOGO

works whatsup@stirrup. | Wipro Limited Doddakannelli, Sarjapur Road, Bengaluru—560035, India CIN: L32102KA1945PLC020800 Email: info@wipro.com wipro.com Concept, content and design at