Performance Management
|
Jun. 25, 2026 |
| WAYCROSS MANAGED RISK EQUITY FUND |
|
| Prospectus [Line Items] |
|
| Bar Chart and Performance Table [Heading] |
PERFORMANCE
SUMMARY
|
| Performance Narrative [Text Block] |
The
Fund was reorganized as of the close of business on November 17, 2020, from a series of Ultimus Managers Trust, an Ohio business trust
(the “Predecessor Fund”), to a series of Waycross Independent Trust, a Delaware statutory trust (the “Reorganization”).
While the Fund’s investment objective, principal investment strategies, and risks are identical to the Predecessor Fund and theoretically
would have invested in the same portfolio of securities, the Fund’s performance may be different than the performance of the Predecessor
Fund due to, among other things, differences in fees and expenses.
The
Fund has adopted the performance of the Predecessor Fund, and the performance information presented below for the Fund reflects the performance
of the Predecessor Fund for periods prior to November 17, 2020. The bar chart and table that follow provide some indication of the risks
of investing in the Fund by showing changes in the Fund’s performance from year to year and by showing how the Fund’s average
annual total returns for one year, five years and since inception compare with those of a broad-based securities market index. How the
Fund has performed in the past (before and after taxes) is not necessarily an indication of how the Fund will perform in the future.
Updated performance information, current through the most recent month end, is available by calling 1-866-267-4304 or by visiting the
Fund’s website at https://www.waycrosspartners.com/strategies-and-funds.
|
| Performance Past Does Not Indicate Future [Text] |
How the
Fund has performed in the past (before and after taxes) is not necessarily an indication of how the Fund will perform in the future.
|
| Performance Information Illustrates Variability of Returns [Text] |
The bar chart and table that follow provide some indication of the risks
of investing in the Fund by showing changes in the Fund’s performance from year to year and by showing how the Fund’s average
annual total returns for one year, five years and since inception compare with those of a broad-based securities market index.
|
| Bar Chart [Heading] |
Calendar
Year Returns
|
| Bar Chart [Table] |
| |
2016 |
2017 |
2018 |
2019 |
2020 |
2021 |
2022 |
2023 |
2024 |
2025 |
| |
1.26% |
13.06% |
-8.80% |
21.18% |
22.26% |
11.45% |
-11.66% |
18.98% |
14.93% |
13.16% |
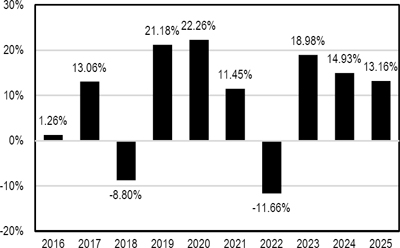
|
| Bar Chart Closing [Text Block] |
The
Fund’s year-to-date return through March 31, 2026 is (5.57%).
Quarterly
Returns During This Time Period
| Highest: |
13.91%
(quarter ended June 30, 2020) |
| Lowest: |
(14.43%)
(quarter ended December 31, 2018) |
|
| Year to Date Return, Label [Optional Text] |
The
Fund’s year-to-date
|
| Bar Chart, Year to Date Return |
(5.57%)
|
| Bar Chart, Year to Date Return, Date |
Mar. 31, 2026
|
| Highest Quarterly Return, Label [Optional Text] |
Highest:
|
| Highest Quarterly Return |
13.91%
|
| Highest Quarterly Return, Date |
Jun. 30, 2020
|
| Lowest Quarterly Return, Label [Optional Text] |
Lowest:
|
| Lowest Quarterly Return |
(14.43%)
|
| Lowest Quarterly Return, Date |
Dec. 31, 2018
|
| Performance Table Heading |
Average
Annual Total Returns
(for
periods ended December 31, 2025)
|
| Performance Table Uses Highest Federal Rate |
After-tax
returns are calculated using the historical highest individual federal marginal income tax rates and do not reflect the impact of state
and local taxes.
|
| Performance Table Not Relevant to Tax Deferred |
Actual after-tax returns depend on an investor’s tax situation and may differ from those shown above. After-tax
returns shown are not relevant to investors who hold their shares through tax-deferred arrangements, such as a 401(k) plan or an individual
retirement account (“IRA”).
|
| Performance [Table] |
| |
One
Year |
Five
Years |
Ten
Years |
| Waycross
Managed Risk Equity Fund |
|
|
|
| Return
Before Taxes |
13.16% |
8.78% |
8.95% |
| Return
After Taxes on Distributions |
11.73% |
7.78% |
8.37% |
| Return
After Taxes on Distributions and Sale of Fund Shares |
8.68% |
6.80% |
7.25% |
| S&P
500® Index (reflects no deduction for fees, expenses, or taxes) |
17.88% |
14.42% |
14.82% |
| S&P
500® Index/Treasury Bill Index (reflects no deduction for fees, expenses, or taxes) |
11.00% |
8.98% |
8.64% |
|
| Performance Table One Class of after Tax Shown [Text] |
Return After Taxes on Distributions and Sale of Fund Shares may be higher than other returns
for the same period due to a tax benefit of realizing a capital loss on the sale of Fund shares.
|
| Index No Deduction for Fees, Expenses, or Taxes [Text] |
reflects no deduction for fees, expenses, or taxes
|
| Performance Table Closing [Text Block] |
After-tax
returns are calculated using the historical highest individual federal marginal income tax rates and do not reflect the impact of state
and local taxes. Actual after-tax returns depend on an investor’s tax situation and may differ from those shown above. After-tax
returns shown are not relevant to investors who hold their shares through tax-deferred arrangements, such as a 401(k) plan or an individual
retirement account (“IRA”). Return After Taxes on Distributions and Sale of Fund Shares may be higher than other returns
for the same period due to a tax benefit of realizing a capital loss on the sale of Fund shares.
|
| Performance Availability Website Address [Text] |
https://www.waycrosspartners.com/strategies-and-funds
|
| Performance Availability Phone [Text] |
1-866-267-4304
|
| WAYCROSS FOCUSED CORE EQUITY FUND |
|
| Prospectus [Line Items] |
|
| Bar Chart and Performance Table [Heading] |
PERFORMANCE
SUMMARY
|
| Performance Narrative [Text Block] |
The
bar chart and table that follow provide some indication of the risks of investing in the Fund by showing changes in the Fund’s
performance from year to year and by showing how the Fund’s average annual total returns for one year and since inception compare
with those of a broad-based securities market index. How the Fund has performed in the past (before and after taxes) is not necessarily
an indication of how the Fund will perform in the future. Updated performance information, current through the most recent month end,
is available by calling 1-866-267-4304 or by visiting the Fund’s website at https://www.waycrosspartners.com/strategies-and-funds.
|
| Performance Past Does Not Indicate Future [Text] |
How the Fund has performed in the past (before and after taxes) is not necessarily
an indication of how the Fund will perform in the future.
|
| Performance Information Illustrates Variability of Returns [Text] |
The
bar chart and table that follow provide some indication of the risks of investing in the Fund by showing changes in the Fund’s
performance from year to year and by showing how the Fund’s average annual total returns for one year and since inception compare
with those of a broad-based securities market index.
|
| Bar Chart [Heading] |
Calendar
Year Returns
|
| Bar Chart [Table] |
| |
2021 |
2022 |
2023 |
2024 |
2025 |
| |
26.33% |
-19.69% |
33.43% |
25.10% |
18.35% |
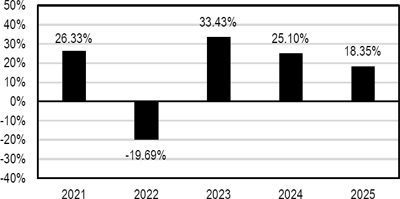
|
| Bar Chart Closing [Text Block] |
The
Fund’s year-to-date return through March 31, 2026 is (7.96%).
Quarterly
Returns During This Time Period
| Highest: |
13.77%
(quarter ended June 30, 2025) |
| Lowest: |
(17.50%)
(quarter ended June 30, 2022) |
|
| Year to Date Return, Label [Optional Text] |
The
Fund’s year-to-date return
|
| Bar Chart, Year to Date Return |
(7.96%)
|
| Bar Chart, Year to Date Return, Date |
Mar. 31, 2026
|
| Highest Quarterly Return, Label [Optional Text] |
Highest:
|
| Highest Quarterly Return |
13.77%
|
| Highest Quarterly Return, Date |
Jun. 30, 2025
|
| Lowest Quarterly Return, Label [Optional Text] |
Lowest:
|
| Lowest Quarterly Return |
(17.50%)
|
| Lowest Quarterly Return, Date |
Jun. 30, 2022
|
| Performance Table Heading |
Average
Annual Total Returns
(for
periods ended December 31, 2025)
|
| Performance Table Uses Highest Federal Rate |
After-tax
returns are calculated using the historical highest individual federal marginal income tax rates and do not reflect the impact of state
and local taxes.
|
| Performance Table Not Relevant to Tax Deferred |
Actual after-tax returns depend on an investor’s tax situation and may differ from those shown above. After-tax
returns shown are not relevant to investors who hold their shares through tax-deferred arrangements, such as a 401(k) plan or an IRA.
|
| Performance Table Explanation after Tax Higher |
Return After Taxes on Distributions and Sale of Fund Shares may be higher than other returns for the same period due to a tax benefit
of realizing a capital loss on the sale of Fund shares.
|
| Performance [Table] |
| |
One
Year |
Five
Years |
Since
Inception
(December 15, 2020) |
| Waycross
Focused Core Equity Fund |
|
|
|
| Return
Before Taxes |
18.35% |
14.92% |
15.23% |
| Return
After Taxes on Distributions |
18.05% |
14.73% |
15.05% |
| Return
After Taxes on Distributions and Sale of Fund Shares |
11.07% |
11.98% |
12.25% |
S&P
500® Index
(reflects no deduction for fees, expenses, or taxes) |
17.88% |
14.42% |
14.68% |
|
| Index No Deduction for Fees, Expenses, or Taxes [Text] |
reflects no deduction for fees, expenses, or taxes
|
| Performance Table Closing [Text Block] |
After-tax
returns are calculated using the historical highest individual federal marginal income tax rates and do not reflect the impact of state
and local taxes. Actual after-tax returns depend on an investor’s tax situation and may differ from those shown above. After-tax
returns shown are not relevant to investors who hold their shares through tax-deferred arrangements, such as a 401(k) plan or an IRA.
Return After Taxes on Distributions and Sale of Fund Shares may be higher than other returns for the same period due to a tax benefit
of realizing a capital loss on the sale of Fund shares.
|
| Performance Availability Website Address [Text] |
https://www.waycrosspartners.com/strategies-and-funds
|
| Performance Availability Phone [Text] |
1-866-267-4304
|