Exhibit 99.2
Creating a Strategic Partnership for Scalable Growth June 2026
2 CAUTIONARY STATEMENTS Forward-Looking Statements This presentation contains “forward-looking statements” as defined in the Private Securities Litigation Reform Act of 1995. In general, forward-looking statements usually use words such as “may,” “believe,” “expect,” “anticipate,” “intend,” “will,” “should,” “plan,” “estimate,” “predict,” “continue” and “potential” or the negative of these terms or other comparable terminology, including statements related to the expected timing of the closing of the merger (the “Merger”) between Colony Bankcorp, Inc. (“CBAN” or “Colony”) and First Reliance Bancshares, Inc. (“FSRL”), the expected returns and other benefits of the Merger to shareholders, expected improvement in operating efficiency resulting from the Merger, estimated expense reductions resulting from the transactions and the timing of achievement of such reductions, the impact on and timing of the recovery of the impact on tangible book value, and the effect of the Merger on CBAN’s capital ratios. Forward-looking statements represent management's beliefs, based upon information available at the time the statements are made, with regard to the matters addressed; they are not guarantees of future performance. Forward-looking statements are subject to numerous assumptions, risks and uncertainties that change over time and could cause actual results or financial condition to differ materially from those expressed in or implied by such statements. Factors that could cause or contribute to such differences include, but are not limited to (1) the risk that the cost savings and any revenue synergies from the Merger may not be realized or take longer than anticipated to be realized, (2) disruption from the Merger with customers, suppliers, employee or other business partners relationships, (3) the occurrence of any event, change or other circumstances that could give rise to the termination of the merger agreement, (4) the risk of successful integration of FSRL’s business into CBAN, (5) the failure to obtain the necessary approvals by the shareholders of FSRL or CBAN, (6) the amount of the costs, fees, expenses and charges related to the Merger, (7) the ability of the parties to obtain required governmental approvals of the Merger on expected terms or in a timely manner, or at all, (8) reputational risk and the reaction of each of the companies’ customers, suppliers, employees or other business partners to the Merger, (9) the failure of the closing conditions in the merger agreement to be satisfied, or any unexpected delay in closing of the Merger, (10) the risk that the integration of FSRL’s operations into the operations of CBAN will be materially delayed or will be more costly or difficult than expected, (11) the possibility that the Merger may be more expensive to complete than anticipated, including as a result of unexpected factors or events, (12) the dilution caused by CBAN’s issuance of additional shares of its common stock in the Merger transaction, and (13) the successful integration of the recently completed acquisition of TC Bancshares, Inc., (14) general competitive, economic, political and market conditions. These factors are not necessarily all of the factors that could cause CBAN’s, FSRL’s or the combined company’s actual results, performance, or achievements to differ materially from those expressed in or implied by any of the forward-looking statements. Other factors, including unknown or unpredictable factors, also could harm CBAN’s, FSRL’s, or the combined company’s results. CBAN and FSRL urge you to consider all of these risks, uncertainties and other factors carefully in evaluating all such forward-looking statements made by CBAN and / or FSRL. As a result of these and other matters, including changes in facts, assumptions not being realized or other factors, the actual results relating to the subject matter of any forward- looking statement may differ materially from the anticipated results expressed or implied in that forward-looking statement. Any forward-looking statement made in this presentation or made by CBAN or FSRL in any report, filing, document or information incorporated by reference in this presentation, speaks only as of the date on which it is made. CBAN and FSRL undertake no obligation to update any such forward-looking statement, whether as a result of new information, future developments or otherwise, except as may be required by law. A forward-looking statement may include a statement of the assumptions or bases underlying the forward-looking statement. CBAN and FSRL believe that these assumptions or bases have been chosen in good faith and that they are reasonable. However, CBAN and FSRL caution you that assumptions as to future occurrences or results almost always vary from actual future occurrences or results, and the differences between assumptions and actual occurrences and results can be material. Therefore, CBAN and FSRL caution you not to place undue reliance on the forward-looking statements contained in this presentation or incorporated by reference herein. If CBAN or FSRL update one or more forward-looking statements, no inference should be drawn that CBAN or FSRL will make additional updates with respect to those or other forward-looking statements, unless required by law. Further information regarding CBAN and factors which could affect the forward-looking statements contained herein can be found in the cautionary language included under the headings “Management's Discussion and Analysis of Financial Condition and Results of Operations” and “Risk Factors” in CBAN’s Annual Reports on Form 10-K for the year ended December 31, 2025, and other documents subsequently filed by CBAN with the Securities and Exchange Commission (the “SEC”).
3 CAUTIONARY STATEMENTS Additional Information About the Merger and Where to Find It This presentation does not constitute an offer to sell or the solicitation of an offer to buy any securities, or a solicitation of any vote or approval, nor shall there be any sale of securities in any jurisdiction in which such offer, solicitation or sale would be unlawful prior to registration or qualification under the securities laws of any such jurisdiction. In connection with the proposed Merger, CBAN will file with the SEC a registration statement on Form S-4 that will include a joint proxy statement of FSRL and CBAN and a prospectus of CBAN, as well as other relevant documents concerning the proposed transaction. WE URGE INVESTORS AND SECURITY HOLDERS TO READ THE REGISTRATION STATEMENT ON FORM S-4, THE JOINT PROXY STATEMENT/PROSPECTUS INCLUDED WITHIN THE REGISTRATION STATEMENT ON FORM S-4 AND ANY OTHER RELEVANT DOCUMENTS TO BE FILED WITH THE SEC IN CONNECTION WITH THE PROPOSED MERGER BECAUSE THEY WILL CONTAIN IMPORTANT INFORMATION ABOUT CBAN, FSRL AND THE PROPOSED MERGER. The joint proxy statement/prospectus will be sent to the shareholders of FSRL seeking the required shareholder approval. Investors and security holders will be able to obtain free copies of the registration statement on Form S-4 and the related joint proxy statement/prospectus, when filed, as well as other documents filed with the SEC by CBAN through the web site maintained by the SEC at www.sec.gov. Documents filed with the SEC by CBAN will also be available free of charge by directing a written request to Colony Bankcorp, Inc., 115 South Grant Street, Fitzgerald, Georgia 31750, Attn: Derek Shelnutt and on CBAN’s website, www.colony.bank, under Investor Relations. CBAN’s telephone number is (229) 426-6000. Participants in the Transaction CBAN, FSRL and certain of their respective directors and executive officers may be deemed to be participants in the solicitation of proxies from the shareholders of FSRL and CBAN in connection with the proposed transaction. Certain information regarding the interests of these participants and a description of their direct and indirect interests, by security holdings or otherwise, will be included in the joint proxy statement/prospectus regarding the proposed transaction when it becomes available. Additional information about CBAN and its directors and officers may be found in the definitive proxy statement of CBAN relating to its 2026 Annual Meeting of Shareholders filed with the SEC on April 16, 2026. The definitive proxy statement can be obtained free of charge from the sources described above.
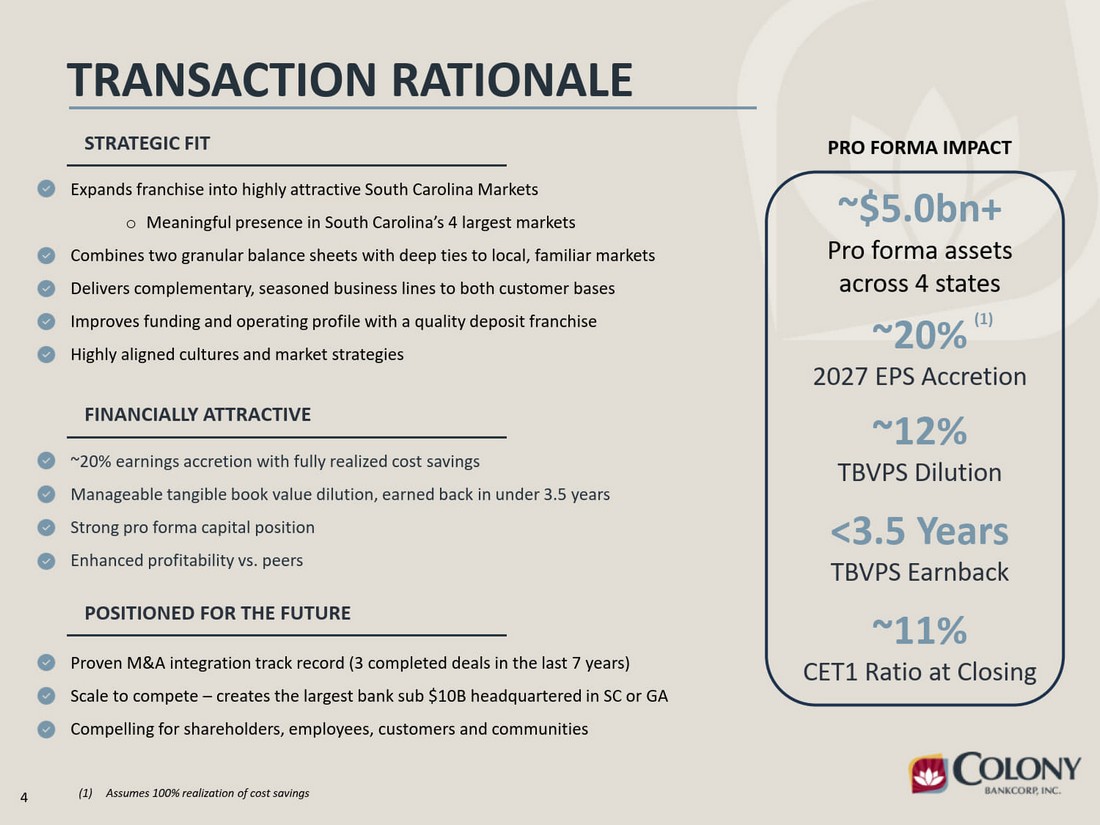
4 TRANSACTION RATIONALE PRO FORMA IMPACT ~20% 2027 EPS Accretion ~12% TBVPS Dilution <3.5 Years TBVPS Earnback ~11% CET1 Ratio at Closing FINANCIALLY ATTRACTIVE ~20% earnings accretion with fully realized cost savings Manageable tangible book value dilution, earned back in under 3.5 years Strong pro forma capital position Enhanced profitability vs. peers POSITIONED FOR THE FUTURE Proven M&A integration track record (3 completed deals in the last 7 years) Scale to compete – creates the largest bank sub $10B headquartered in SC or GA Compelling for shareholders, employees, customers and communities ~$5.0bn+ Pro forma assets across 4 states (1) Assumes 100% realization of cost savings (1) STRATEGIC FIT Expands franchise into highly attractive South Carolina Markets o Meaningful presence in South Carolina’s 4 largest markets Combines two granular balance sheets with deep ties to local, familiar markets Delivers complementary, seasoned business lines to both customer bases Improves funding and operating profile with a quality deposit franchise Highly aligned cultures and market strategies
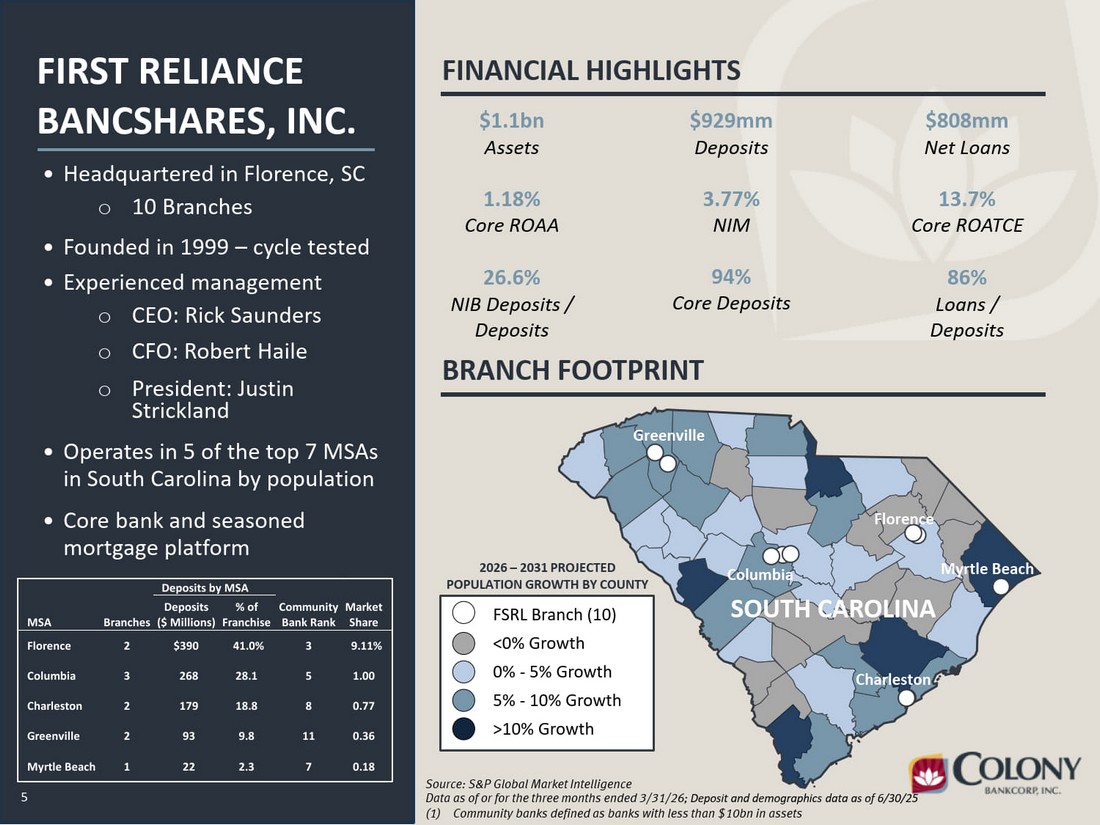
5 FIRST RELIANCE BANCSHARES, INC. FINANCIAL HIGHLIGHTS $1.1bn Assets $929mm Deposits $808mm Net Loans 1.18% Core ROAA 3.77% NIM 13.7% Core ROATCE Source: S&P Global Market Intelligence Data as of or for the three months ended 3/31/26; Deposit and demographics data as of 6/30/25 (1) Community banks defined as banks with less than $10bn in assets 94% Core Deposits 86% Loans / Deposits 26.6% NIB Deposits / Deposits FSRL Branch (10) <0% Growth 0% - 5% Growth 5% - 10% Growth >10% Growth SOUTH CAROLINA Columbia Greenville Charleston Myrtle Beach Florence 5 BRANCH FOOTPRINT 2026 – 2031 PROJECTED Deposits by MSA POPULATION GROWTH BY COUNTY MSA Branches Deposits ($ Millions) % of Franchise Community Bank Rank Market Share Florence 2 $390 41.0% 3 9.11% Columbia 3 268 28.1 5 1.00 Charleston 2 179 18.8 8 0.77 Greenville 2 93 9.8 11 0.36 Myrtle Beach 1 22 2.3 7 0.18 • Headquartered in Florence, SC o 10 Branches • Founded in 1999 – cycle tested • Experienced management o CEO: Rick Saunders o CFO: Robert Haile o President: Justin Strickland • Operates in 5 of the top 7 MSAs in South Carolina by population • Core bank and seasoned mortgage platform
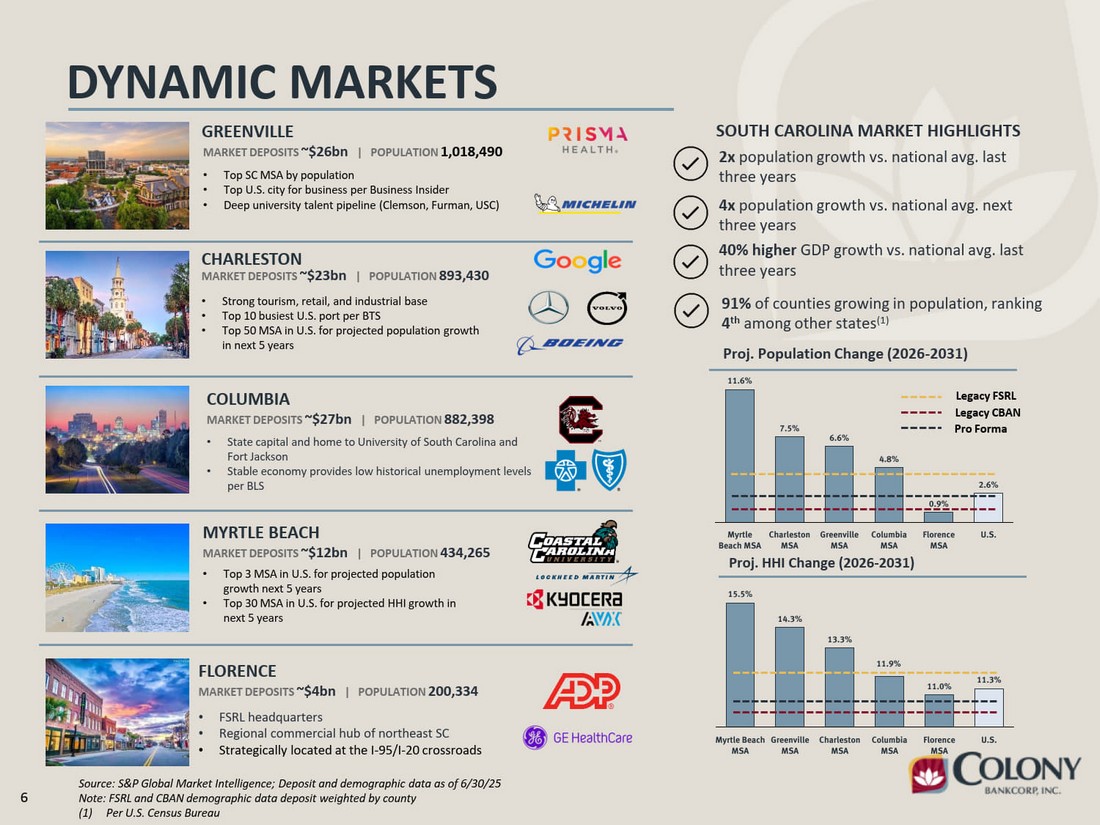
6 15.5% 14.3% 13.3% 11.9% 11.0% 11.3% Myrtle Beach MSA Greenville MSA Charleston MSA Columbia MSA Florence MSA U.S. DYNAMIC MARKETS CHARLESTON MARKET DEPOSITS ~$23bn | POPULATION 893,430 • Strong tourism, retail, and industrial base • Top 10 busiest U.S. port per BTS • Top 50 MSA in U.S. for projected population growth in next 5 years COLUMBIA MARKET DEPOSITS ~$27bn | POPULATION 882,398 • State capital and home to University of South Carolina and Fort Jackson • Stable economy provides low historical unemployment levels per BLS Proj. HHI Change (2026-2031) Proj. Population Change (2026-2031) 11.6% 7.5% 6.6% 4.8% 0.9% 2.6% Myrtle Beach MSA Charleston MSA Greenville MSA Columbia MSA Florence MSA U.S. Legacy FSRL Legacy CBAN Pro Forma 2x population growth vs. national avg. last three years 4x population growth vs. national avg. next three years 40% higher GDP growth vs. national avg. last three years SOUTH CAROLINA MARKET HIGHLIGHTS MARKET DEPOSITS ~$12bn | POPULATION 434,265 MYRTLE BEACH • Top 3 MSA in U.S. for projected population growth next 5 years • Top 30 MSA in U.S. for projected HHI growth in next 5 years FLORENCE MARKET DEPOSITS ~$4bn | POPULATION 200,334 • FSRL headquarters • Regional commercial hub of northeast SC • Strategically located at the I-95/I-20 crossroads GREENVILLE MARKET DEPOSITS ~$26bn | POPULATION 1,018,490 • Top SC MSA by population • Top U.S. city for business per Business Insider • Deep university talent pipeline (Clemson, Furman, USC) 91% of counties growing in population, ranking 4th among other states(1) Source: S&P Global Market Intelligence; Deposit and demographic data as of 6/30/25 Note: FSRL and CBAN demographic data deposit weighted by county (1) Per U.S. Census Bureau
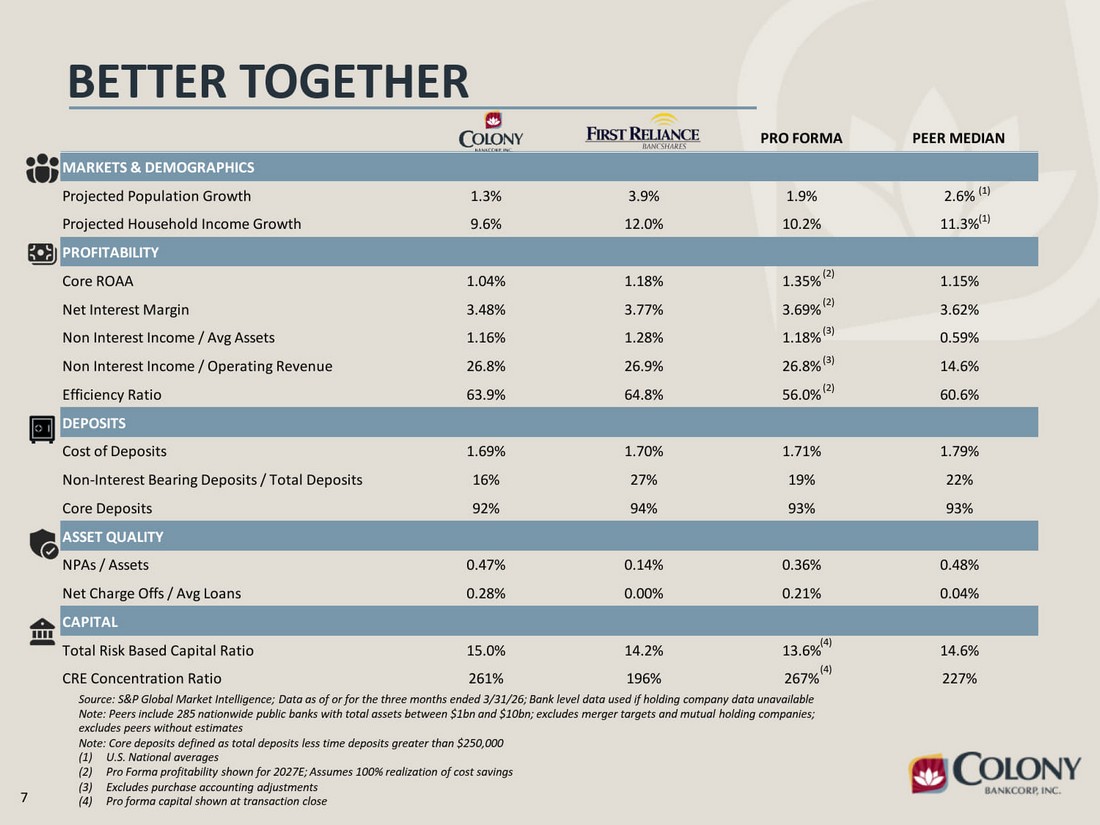
7 BETTER TOGETHER Source: S&P Global Market Intelligence; Data as of or for the three months ended 3/31/26; Bank level data used if holding company data unavailable Note: Peers include 285 nationwide public banks with total assets between $1bn and $10bn; excludes merger targets and mutual holding companies; excludes peers without estimates Note: Core deposits defined as total deposits less time deposits greater than $250,000 (1) U.S. National averages (2) Pro Forma profitability shown for 2027E; Assumes 100% realization of cost savings (3) Excludes purchase accounting adjustments (4) Pro forma capital shown at transaction close PRO FORMA PEER MEDIAN MARKETS & DEMOGRAPHICS Projected Population Growth 1.3% 3.9% 1.9% 2.6% Projected Household Income Growth 9.6% 12.0% 10.2% 11.3% PROFITABILITY Core ROAA 1.04% 1.18% 1.35% 1.15% Net Interest Margin 3.48% 3.77% 3.69% 3.62% Non Interest Income / Avg Assets 1.16% 1.28% 1.18% 0.59% Non Interest Income / Operating Revenue 26.8% 26.9% 26.8% 14.6% Efficiency Ratio 63.9% 64.8% 56.0% 60.6% DEPOSITS Cost of Deposits 1.69% 1.70% 1.71% 1.79% Non-Interest Bearing Deposits / Total Deposits 16% 27% 19% 22% Core Deposits 92% 94% 93% 93% ASSET QUALITY NPAs / Assets 0.47% 0.14% 0.36% 0.48% Net Charge Offs / Avg Loans 0.28% 0.00% 0.21% 0.04% CAPITAL Total Risk Based Capital Ratio 15.0% 14.2% 13.6% 14.6% CRE Concentration Ratio 261% 196% 267% 227% (1) (1) (3) (3) (2) (2) (2) (4) (4)
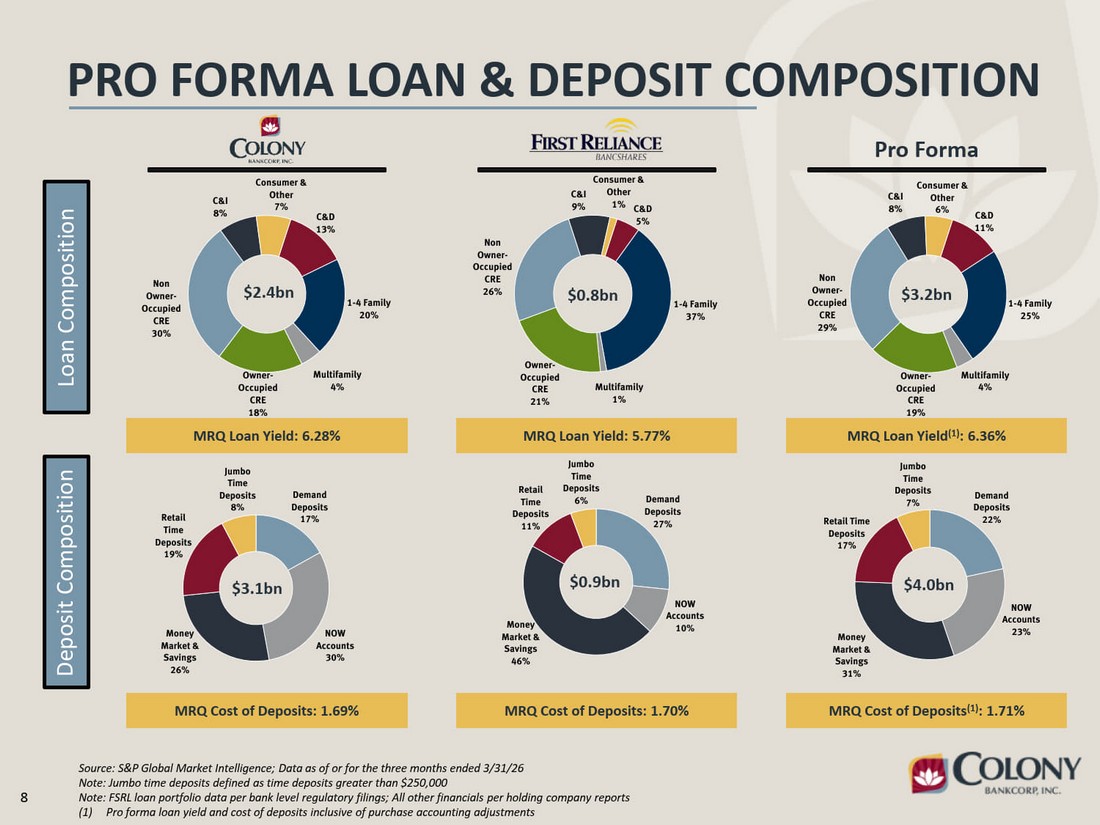
8 C&D 11% 1-4 Family 25% Multifamily 4% Owner- Occupied CRE 19% Non Owner- Occupied CRE 29% C&I 8% Consumer & Other 6% C&D 13% 1-4 Family 20% Multifamily 4% Owner- Occupied CRE 18% Non Owner- Occupied CRE 30% C&I 8% Consumer & Other 7% C&D 5% 1-4 Family 37% Multifamily 1% Owner- Occupied CRE 21% Non Owner- Occupied CRE 26% C&I 9% Consumer & Other 1% PRO FORMA LOAN & DEPOSIT COMPOSITION Source: S&P Global Market Intelligence; Data as of or for the three months ended 3/31/26 Note: Jumbo time deposits defined as time deposits greater than $250,000 Note: FSRL loan portfolio data per bank level regulatory filings; All other financials per holding company reports (1) Pro forma loan yield and cost of deposits inclusive of purchase accounting adjustments Pro Forma $2.4bn MRQ Loan Yield: 6.28% $0.8bn MRQ Loan Yield: 5.77% $3.2bn MRQ Loan Yield(1): 6.36% Demand Deposits 17% NOW Accounts 30% Money Market & Savings 26% Retail Time Deposits 19% Jumbo Time Deposits 8% $3.1bn MRQ Cost of Deposits: 1.69% Demand Deposits 27% NOW Accounts Money 10% Market & Savings 46% Retail Time Deposits 11% Jumbo Time Deposits 6% $0.9bn MRQ Cost of Deposits: 1.70% Demand Deposits 22% NOW Accounts Money 23% Market & Savings 31% Retail Time Deposits 17% Jumbo Time Deposits 7% $4.0bn MRQ Cost of Deposits(1): 1.71% Deposit Composition Loan Composition
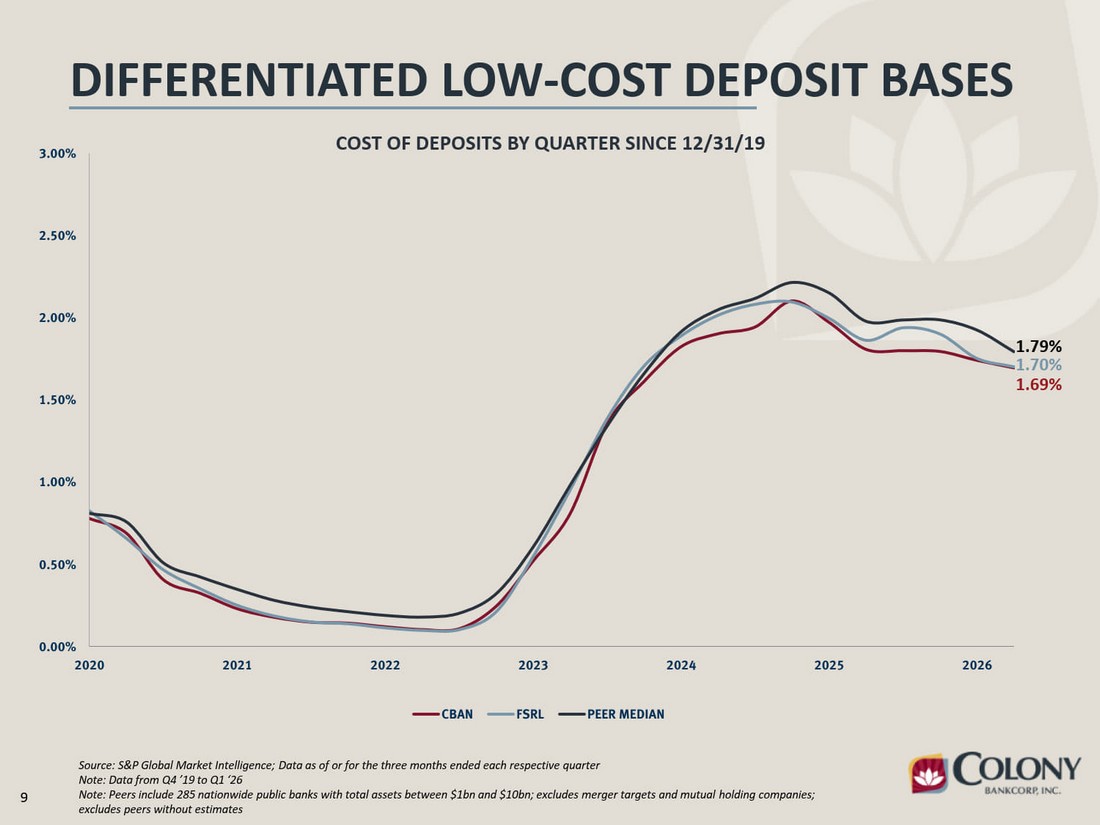
9 DIFFERENTIATED LOW-COST DEPOSIT BASES Source: S&P Global Market Intelligence; Data as of or for the three months ended each respective quarter Note: Data from Q4 ’19 to Q1 ‘26 Note: Peers include 285 nationwide public banks with total assets between $1bn and $10bn; excludes merger targets and mutual holding companies; excludes peers without estimates 0.00% 0.50% 1.00% 1.50% 2.00% 2.50% 3.00% 2020 2021 2022 2023 2024 2025 2026 CBAN FSRL PEER MEDIAN 1.79% 1.70% 1.69% COST OF DEPOSITS BY QUARTER SINCE 12/31/19
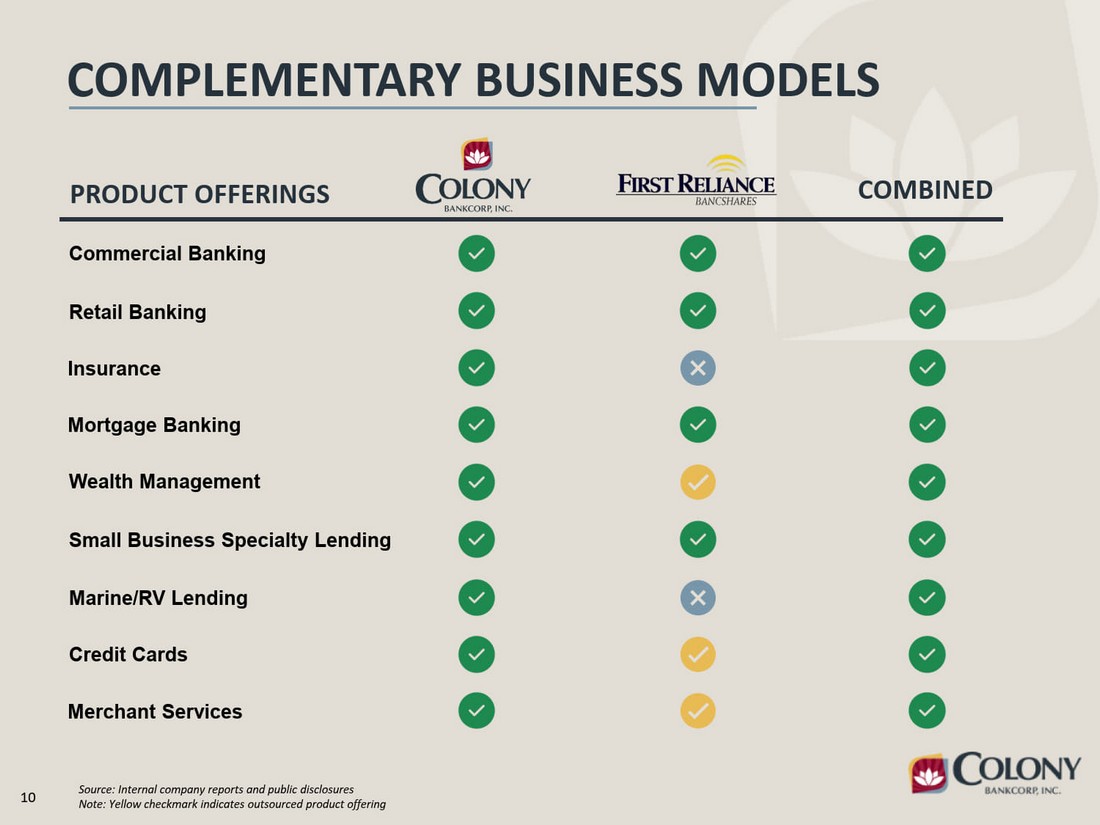
10 COMPLEMENTARY BUSINESS MODELS COMBINED Commercial Banking Retail Banking Insurance Mortgage Banking Wealth Management Small Business Specialty Lending Marine/RV Lending PRODUCT OFFERINGS Source: Internal company reports and public disclosures Note: Yellow checkmark indicates outsourced product offering Credit Cards Merchant Services
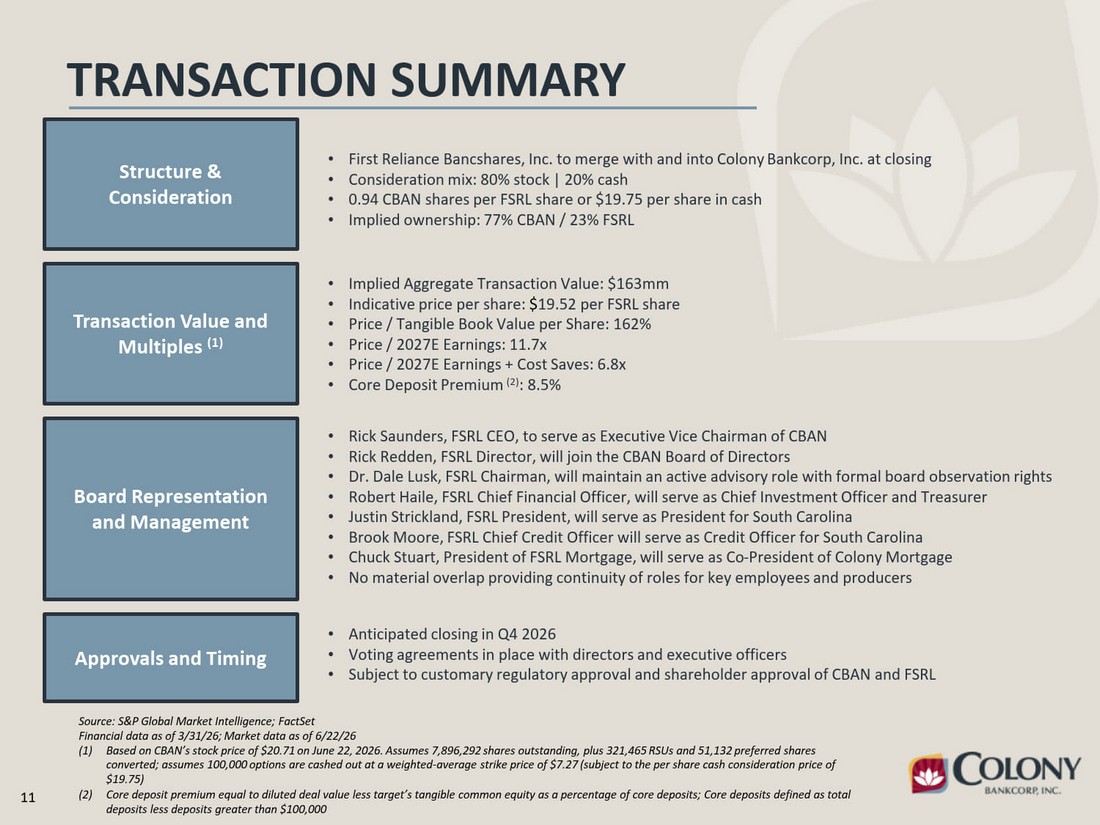
11 TRANSACTION SUMMARY Source: S&P Global Market Intelligence; FactSet Financial data as of 3/31/26; Market data as of 6/22/26 (1) Based on CBAN’s stock price of $20.71 on June 22, 2026. Assumes 7,896,292 shares outstanding, plus 321,465 RSUs and 51,132 preferred shares converted; assumes 100,000 options are cashed out at a weighted-average strike price of $7.27 (subject to the per share cash consideration price of $19.75) (2) Core deposit premium equal to diluted deal value less target’s tangible common equity as a percentage of core deposits; Core deposits defined as total deposits less deposits greater than $100,000 Structure & Consideration Transaction Value and Multiples (1) Approvals and Timing Board Representation and Management • First Reliance Bancshares, Inc. to merge with and into Colony Bankcorp, Inc. at closing • Consideration mix: 80% stock | 20% cash • 0.94 CBAN shares per FSRL share or $19.75 per share in cash • Implied ownership: 77% CBAN / 23% FSRL • Implied Aggregate Transaction Value: $163mm • Indicative price per share: $19.52 per FSRL share • Price / Tangible Book Value per Share: 162% • Price / 2027E Earnings: 11.7x • Price / 2027E Earnings + Cost Saves: 6.8x • Core Deposit Premium (2): 8.5% • Rick Saunders, FSRL CEO, to serve as Executive Vice Chairman of CBAN • Rick Redden, FSRL Director, will join the CBAN Board of Directors • Dr. Dale Lusk, FSRL Chairman, will maintain an active advisory role with formal board observation rights • Robert Haile, FSRL Chief Financial Officer, will serve as Chief Investment Officer and Treasurer • Justin Strickland, FSRL President, will serve as President for South Carolina • Brook Moore, FSRL Chief Credit Officer will serve as Credit Officer for South Carolina • Chuck Stuart, President of FSRL Mortgage, will serve as Co-President of Colony Mortgage • No material overlap providing continuity of roles for key employees and producers • Anticipated closing in Q4 2026 • Voting agreements in place with directors and executive officers • Subject to customary regulatory approval and shareholder approval of CBAN and FSRL
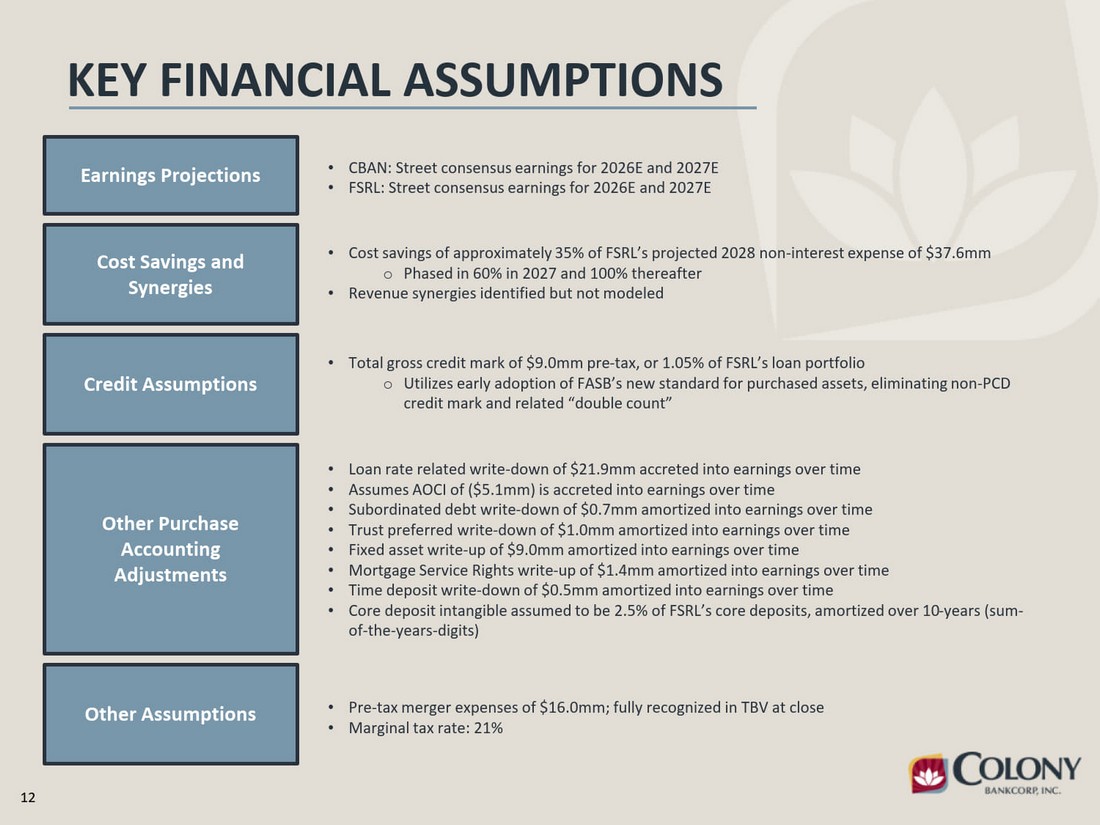
12 KEY FINANCIAL ASSUMPTIONS Earnings Projections •• CBAN: Street consensus earnings for 2026E and 2027E FSRL: Street consensus earnings for 2026E and 2027E Cost Savings and Synergies • Cost savings of approximately 35% of FSRL’s projected 2028 non-interest expense of $37.6mm o Phased in 60% in 2027 and 100% thereafter • Revenue synergies identified but not modeled Credit Assumptions • Total gross credit mark of $9.0mm pre-tax, or 1.05% of FSRL’s loan portfolio o Utilizes early adoption of FASB’s new standard for purchased assets, eliminating non-PCD credit mark and related “double count” Other Purchase Accounting Adjustments • Loan rate related write-down of $21.9mm accreted into earnings over time • Assumes AOCI of ($5.1mm) is accreted into earnings over time • Subordinated debt write-down of $0.7mm amortized into earnings over time • Trust preferred write-down of $1.0mm amortized into earnings over time • Fixed asset write-up of $9.0mm amortized into earnings over time • Mortgage Service Rights write-up of $1.4mm amortized into earnings over time • Time deposit write-down of $0.5mm amortized into earnings over time • Core deposit intangible assumed to be 2.5% of FSRL’s core deposits, amortized over 10-years (sum- of-the-years-digits) Other Assumptions • Pre-tax merger expenses of $16.0mm; fully recognized in TBV at close • Marginal tax rate: 21%
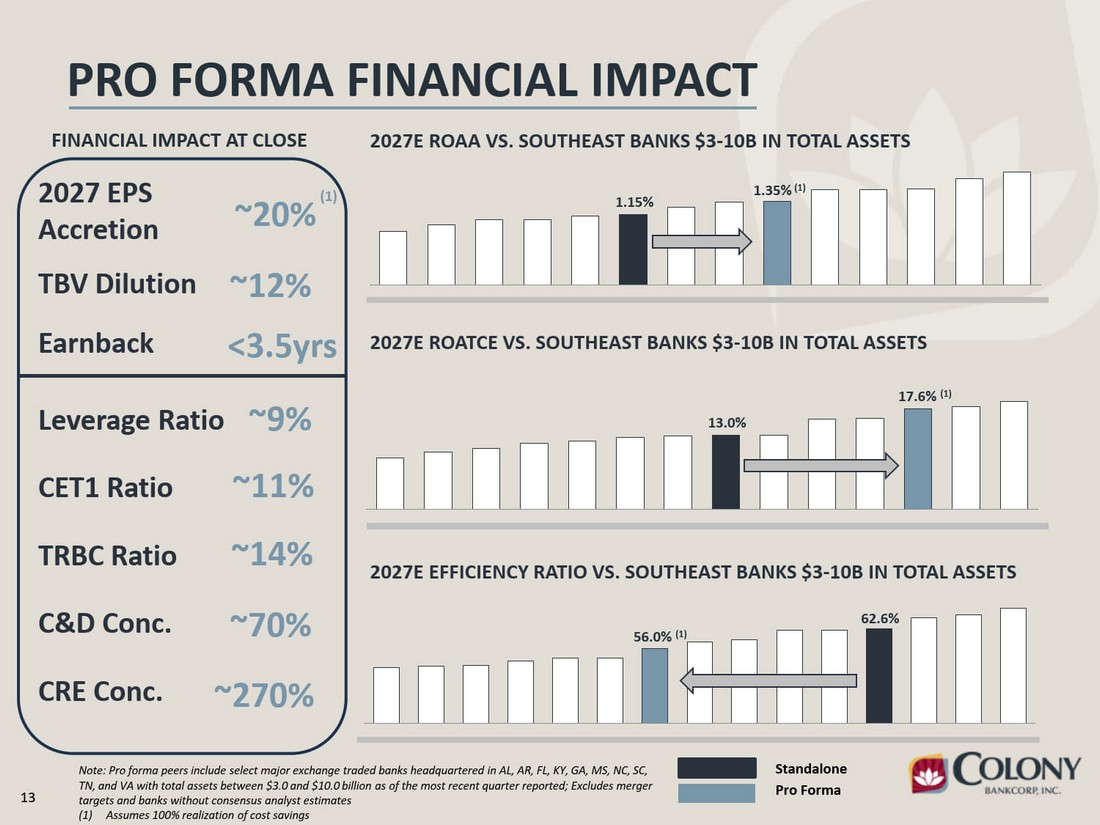
13 1.15% 1.35% (1) 17.6% (1) 13.0% PRO FORMA FINANCIAL IMPACT Note: Pro forma peers include select major exchange traded banks headquartered in AL, AR, FL, KY, GA, MS, NC, SC, TN, and VA with total assets between $3.0 and $10.0 billion as of the most recent quarter reported; Excludes merger targets and banks without consensus analyst estimates (1) Assumes 100% realization of cost savings 2027E ROAA VS. SOUTHEAST BANKS $3-10B IN TOTAL ASSETS 2027E ROATCE VS. SOUTHEAST BANKS $3-10B IN TOTAL ASSETS 2027E EFFICIENCY RATIO VS. SOUTHEAST BANKS $3-10B IN TOTAL ASSETS 56.0% (1) 62.6% Standalone Pro Forma FINANCIAL IMPACT AT CLOSE 2027 EPS Accretion ~20% TBV Dilution ~12% Earnback <3.5yrs CET1 Ratio ~11% TRBC Ratio ~14% CRE Conc. ~270% Leverage Ratio ~9% C&D Conc. ~70% (1)
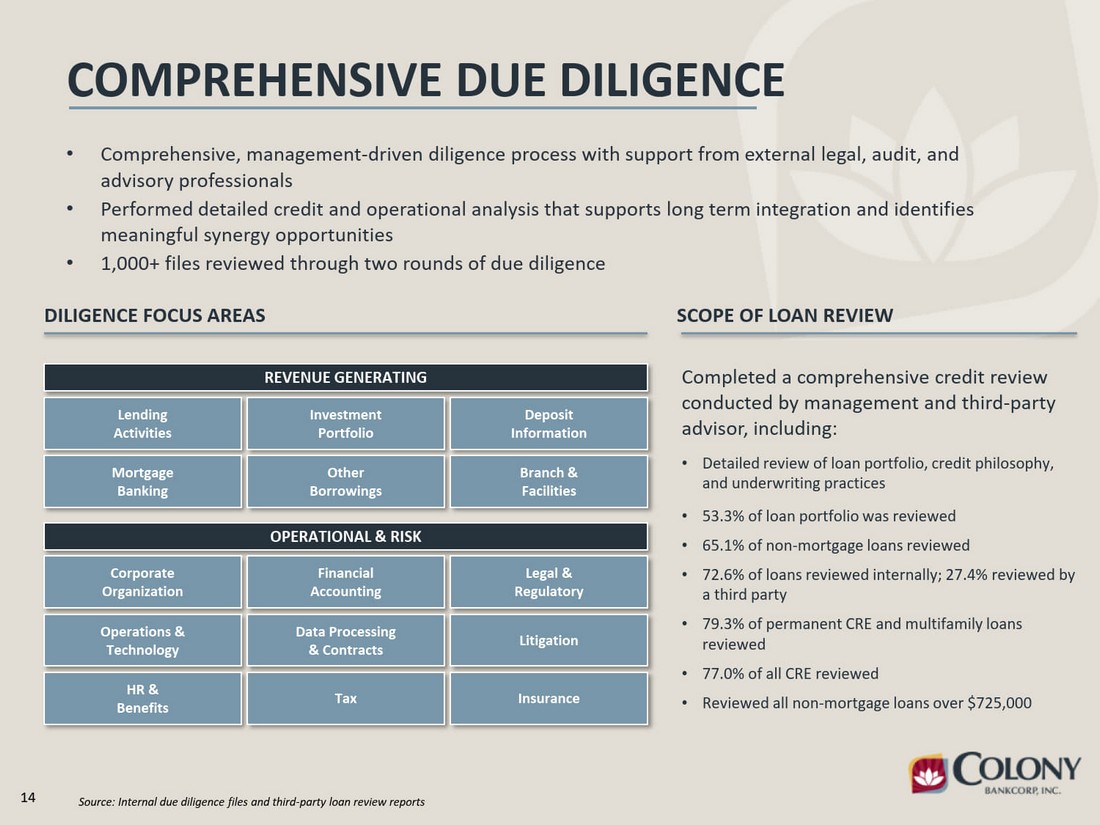
14 COMPREHENSIVE DUE DILIGENCE • Comprehensive, management-driven diligence process with support from external legal, audit, and advisory professionals • Performed detailed credit and operational analysis that supports long term integration and identifies meaningful synergy opportunities • 1,000+ files reviewed through two rounds of due diligence DILIGENCE FOCUS AREAS SCOPE OF LOAN REVIEW Completed a comprehensive credit review conducted by management and third-party advisor, including: • Detailed review of loan portfolio, credit philosophy, and underwriting practices • 53.3% of loan portfolio was reviewed • 65.1% of non-mortgage loans reviewed • 72.6% of loans reviewed internally; 27.4% reviewed by a third party • 79.3% of permanent CRE and multifamily loans reviewed • 77.0% of all CRE reviewed • Reviewed all non-mortgage loans over $725,000 REVENUE GENERATING Lending Activities Investment Portfolio Deposit Information Mortgage Banking Other Borrowings Branch & Facilities OPERATIONAL & RISK Corporate Organization Financial Accounting Legal & Regulatory Operations & Technology Data Processing & Contracts Litigation HR & Benefits Tax Insurance Source: Internal due diligence files and third-party loan review reports
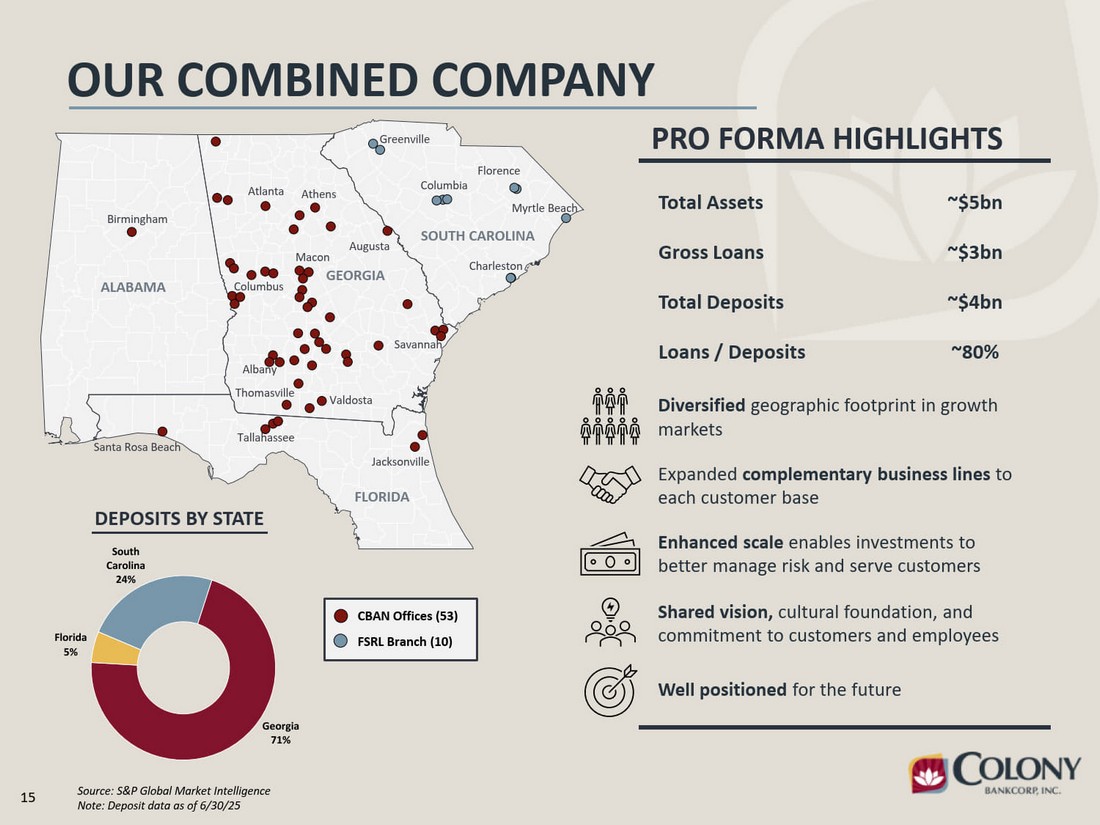
15 Georgia 71% Florida 5% South Carolina 24% OUR COMBINED COMPANY Source: S&P Global Market Intelligence Note: Deposit data as of 6/30/25 ALABAMA FLORIDA GEORGIA SOUTH CAROLINA Birmingham Atlanta Athens Macon Albany Thomasville Tallahassee Jacksonville Santa Rosa Beach Savannah Augusta Columbia Greenville Charleston Myrtle Beach CBAN Offices (53) FSRL Branch (10) Florence DEPOSITS BY STATE PRO FORMA HIGHLIGHTS Total Assets ~$5bn Gross Loans ~$3bn Total Deposits ~$4bn Loans / Deposits ~80% Expanded complementary business lines to each customer base Diversified geographic footprint in growth markets Enhanced scale enables investments to better manage risk and serve customers Shared vision, cultural foundation, and commitment to customers and employees Well positioned for the future Valdosta Columbus
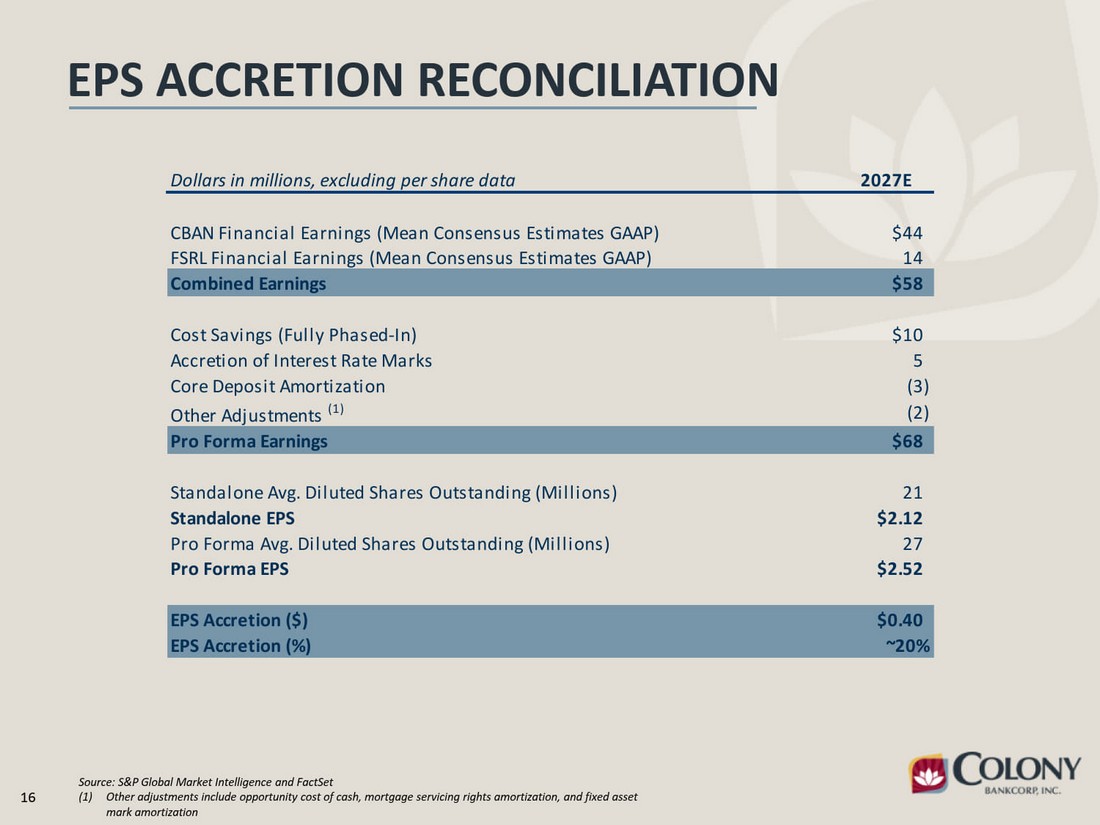
16 EPS ACCRETION RECONCILIATION Source: S&P Global Market Intelligence and FactSet (1) Other adjustments include opportunity cost of cash, mortgage servicing rights amortization, and fixed asset mark amortization Dollars in millions, excluding per share data 2027E CBAN Financial Earnings (Mean Consensus Estimates GAAP) $44 FSRL Financial Earnings (Mean Consensus Estimates GAAP) 14 Combined Earnings $58 Cost Savings (Fully Phased-In) $10 Accretion of Interest Rate Marks 5 Core Deposit Amortization (3) Other Adjustments (1) (2) Pro Forma Earnings $68 Standalone Avg. Diluted Shares Outstanding (Millions) 21 Standalone EPS $2.12 Pro Forma Avg. Diluted Shares Outstanding (Millions) 27 Pro Forma EPS $2.52 EPS Accretion ($) $0.40 EPS Accretion (%) ~20%
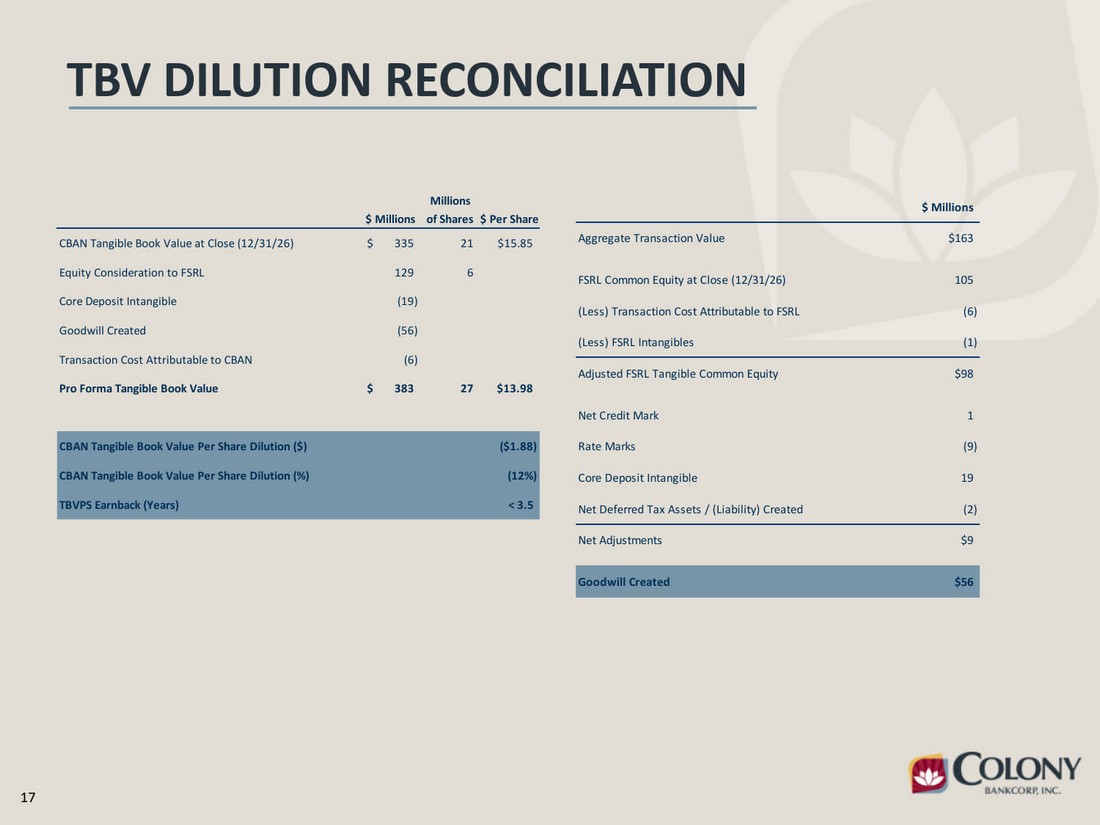
17 TBV DILUTION RECONCILIATION Millions $ Millions of Shares $ Per Share CBAN Tangible Book Value at Close (12/31/26) $ 335 21 $15.85 Equity Consideration to FSRL 129 6 Core Deposit Intangible (19) Goodwill Created (56) Transaction Cost Attributable to CBAN (6) Pro Forma Tangible Book Value $ 383 27 $13.98 CBAN Tangible Book Value Per Share Dilution ($) ($1.88) CBAN Tangible Book Value Per Share Dilution (%) (12%) TBVPS Earnback (Years) < 3.5 $ Millions Aggregate Transaction Value $163 FSRL Common Equity at Close (12/31/26) 105 (Less) Transaction Cost Attributable to FSRL (6) (Less) FSRL Intangibles (1) Adjusted FSRL Tangible Common Equity $98 Net Credit Mark 1 Rate Marks (9) Core Deposit Intangible 19 Net Deferred Tax Assets / (Liability) Created (2) Net Adjustments $9 Goodwill Created $56