|
|
|
|
|
|
|
|
|
|
|
|
|
|
|
|
|
|
|
|
|
|
|
|
|
|
Value of Initial Fixed $100 |
|
|
|
|
|
|
|
|||||||||||||||
Year |
|
Summary Compensation Table Total |
|
|
Summary Compensation Table Total for Vineet |
|
|
Summary Compensation Table Total for Michael C. Doogue 1 |
|
|
Compensation Actually Paid to Ravi Vig 1,2,3 |
|
|
Compensation Actually Paid to Vineet Nargolwala 1,2,3 |
|
|
Compensation Actually Paid to Michael C. Doogue 1,2,3 |
|
|
Average |
|
|
Average Compensation Actually Paid to Non-PEO NEOs 1,2,3 |
|
|
Total Shareholder Return |
|
|
Peer Group Total Shareholder Return |
|
|
Net (Loss) Income ($ Thousands) |
|
|
Performance EBIT ($ Thousands) ⁵ |
|
||||||||||||
2026 |
|
|
— |
|
|
|
— |
|
|
|
10,459,680 |
|
|
|
— |
|
|
|
— |
|
|
|
13,192,521 |
|
|
|
3,405,613 |
|
|
|
4,341,697 |
|
|
|
119.19 |
|
|
|
240.08 |
|
|
|
(14,653 |
) |
|
|
125,577 |
|
2025 |
|
|
— |
|
|
|
11,005,040 |
|
|
|
2,930,527 |
|
|
|
— |
|
|
|
9,559,892 |
|
|
|
1,766,319 |
|
|
|
2,807,168 |
|
|
|
1,725,409 |
|
|
|
98.38 |
|
|
|
137.94 |
|
|
|
(72,763 |
) |
|
|
68,556 |
|
2024 |
|
|
— |
|
|
|
7,001,603 |
|
|
|
— |
|
|
|
— |
|
|
|
(4,253,826 |
) |
|
|
— |
|
|
|
2,280,501 |
|
|
|
(3,628,582 |
) |
|
|
106.69 |
|
|
|
157.91 |
|
|
|
152,888 |
|
|
|
306,175 |
|
2023 |
|
|
35,348,581 |
|
|
|
10,128,514 |
|
|
|
— |
|
|
|
8,300,753 |
|
|
|
22,659,744 |
|
|
|
— |
|
|
|
3,289,690 |
|
|
|
9,200,243 |
|
|
|
189.91 |
|
|
|
104.01 |
|
|
|
187,494 |
|
|
|
282,560 |
|
2022 |
|
|
11,191,041 |
|
|
|
— |
|
|
|
— |
|
|
|
21,149,326 |
|
|
|
— |
|
|
|
— |
|
|
|
4,272,620 |
|
|
|
3,460,448 |
|
|
|
115.47 |
|
|
|
113.49 |
|
|
|
119,555 |
|
|
|
180,627 |
|
2022 |
|
2023 & 2024 |
|
2025 |
|
2026 |
Derek P. D’Antilio |
|
Derek P. D’Antilio |
|
Derek P. D’Antilio |
|
Derek P. D’Antilio |
Michael C. Doogue |
|
Michael C. Doogue |
|
Suman S. Narayan |
|
Richard A. Madormo |
Max R. Glover |
|
Max R. Glover |
|
Sharon S. Briansky |
|
Sharon S. Briansky |
Thomas C. Teebagy, Jr. |
|
Sharon S. Briansky |
|
Max R. Glover |
|
Troy T. Coleman |
Paul V. Walsh, Jr. |
|
|
|
|
|
|
Christopher E. Brown |
|
|
|
|
|
|
Year |
|
Summary Compensation Table Total for Michael C. Doogue ($) |
|
|
Exclusion of Stock Awards for Michael C. Doogue ($) |
|
|
Inclusion of Equity Values for Michael C. Doogue ($) |
|
|
Compensation |
|
||||
2026 |
|
|
10,459,680 |
|
|
|
(9,685,198 |
) |
|
|
12,418,039 |
|
|
|
13,192,521 |
|
The amounts in the Inclusion of Equity Values in the tables above are derived from the amounts set forth in the following tables:
Year |
|
Year-End Fair Value of Equity Awards Granted During Year That Remained Unvested as of Last Day of Year for Michael C. Doogue ($) |
|
|
Change in Fair Value from Last Day of Prior Year to Last Day of Year of Unvested Equity Awards for Michael C. Doogue |
|
|
Vesting-Date Fair Value of Equity Awards Granted During Year that Vested During Year for Michael C. Doogue |
|
|
Change in Fair |
|
|
Fair Value at Last Day of Prior Year of Equity Awards Forfeited During Year for Michael C. Doogue |
|
|
Value of Dividends or Other Earnings Paid on Equity Awards Not Otherwise Included for Michael C. Doogue ($) |
|
|
Total - Inclusion of Equity Values for Michael C. Doogue ($) |
|
|||||||
2026 |
|
|
12,291,580 |
|
|
|
(20,641 |
) |
|
|
— |
|
|
|
147,100 |
|
|
|
— |
|
|
|
— |
|
|
|
12,418,039 |
|
Year |
|
Average Summary Compensation Table Total for Non-PEO NEOs ($) |
|
|
Average Exclusion of Stock Awards for |
|
|
Average Inclusion of Equity Values for Non-PEO NEOs ($) |
|
|
Average Compensation |
|
||||
2026 |
|
|
3,405,613 |
|
|
|
(2,532,292 |
) |
|
|
3,468,376 |
|
|
|
4,341,697 |
|
Year |
|
Average Year-End Fair Value of Equity Awards Granted During Year That Remained Unvested as of Last Day of Year for Non-PEO NEOs ($) |
|
|
Average Change in Fair Value from Last Day of Prior Year to Last Day of Year of Unvested Equity Awards for Non-PEO NEOs |
|
|
Average Vesting-Date Fair Value of Equity Awards Granted During Year that Vested During Year for Non-PEO NEOs |
|
|
Average Change in Fair Value from Last Day of Prior Year to Vesting Date of Unvested Equity Awards that Vested During Year for Non-PEO NEOs ($) |
|
|
Average Fair Value at Last Day of Prior Year of Equity Awards Forfeited During Year for Non-PEO NEOs |
|
|
Average Value of Dividends or Other Earnings Paid on Equity Awards Not Otherwise Included for Non-PEO NEOs |
|
|
Total - Average Inclusion of Equity Values for Non-PEO NEOs |
|
|||||||
2026 |
|
|
3,010,840 |
|
|
|
7,909 |
|
|
|
— |
|
|
|
449,627 |
|
|
|
— |
|
|
|
— |
|
|
|
3,468,376 |
|
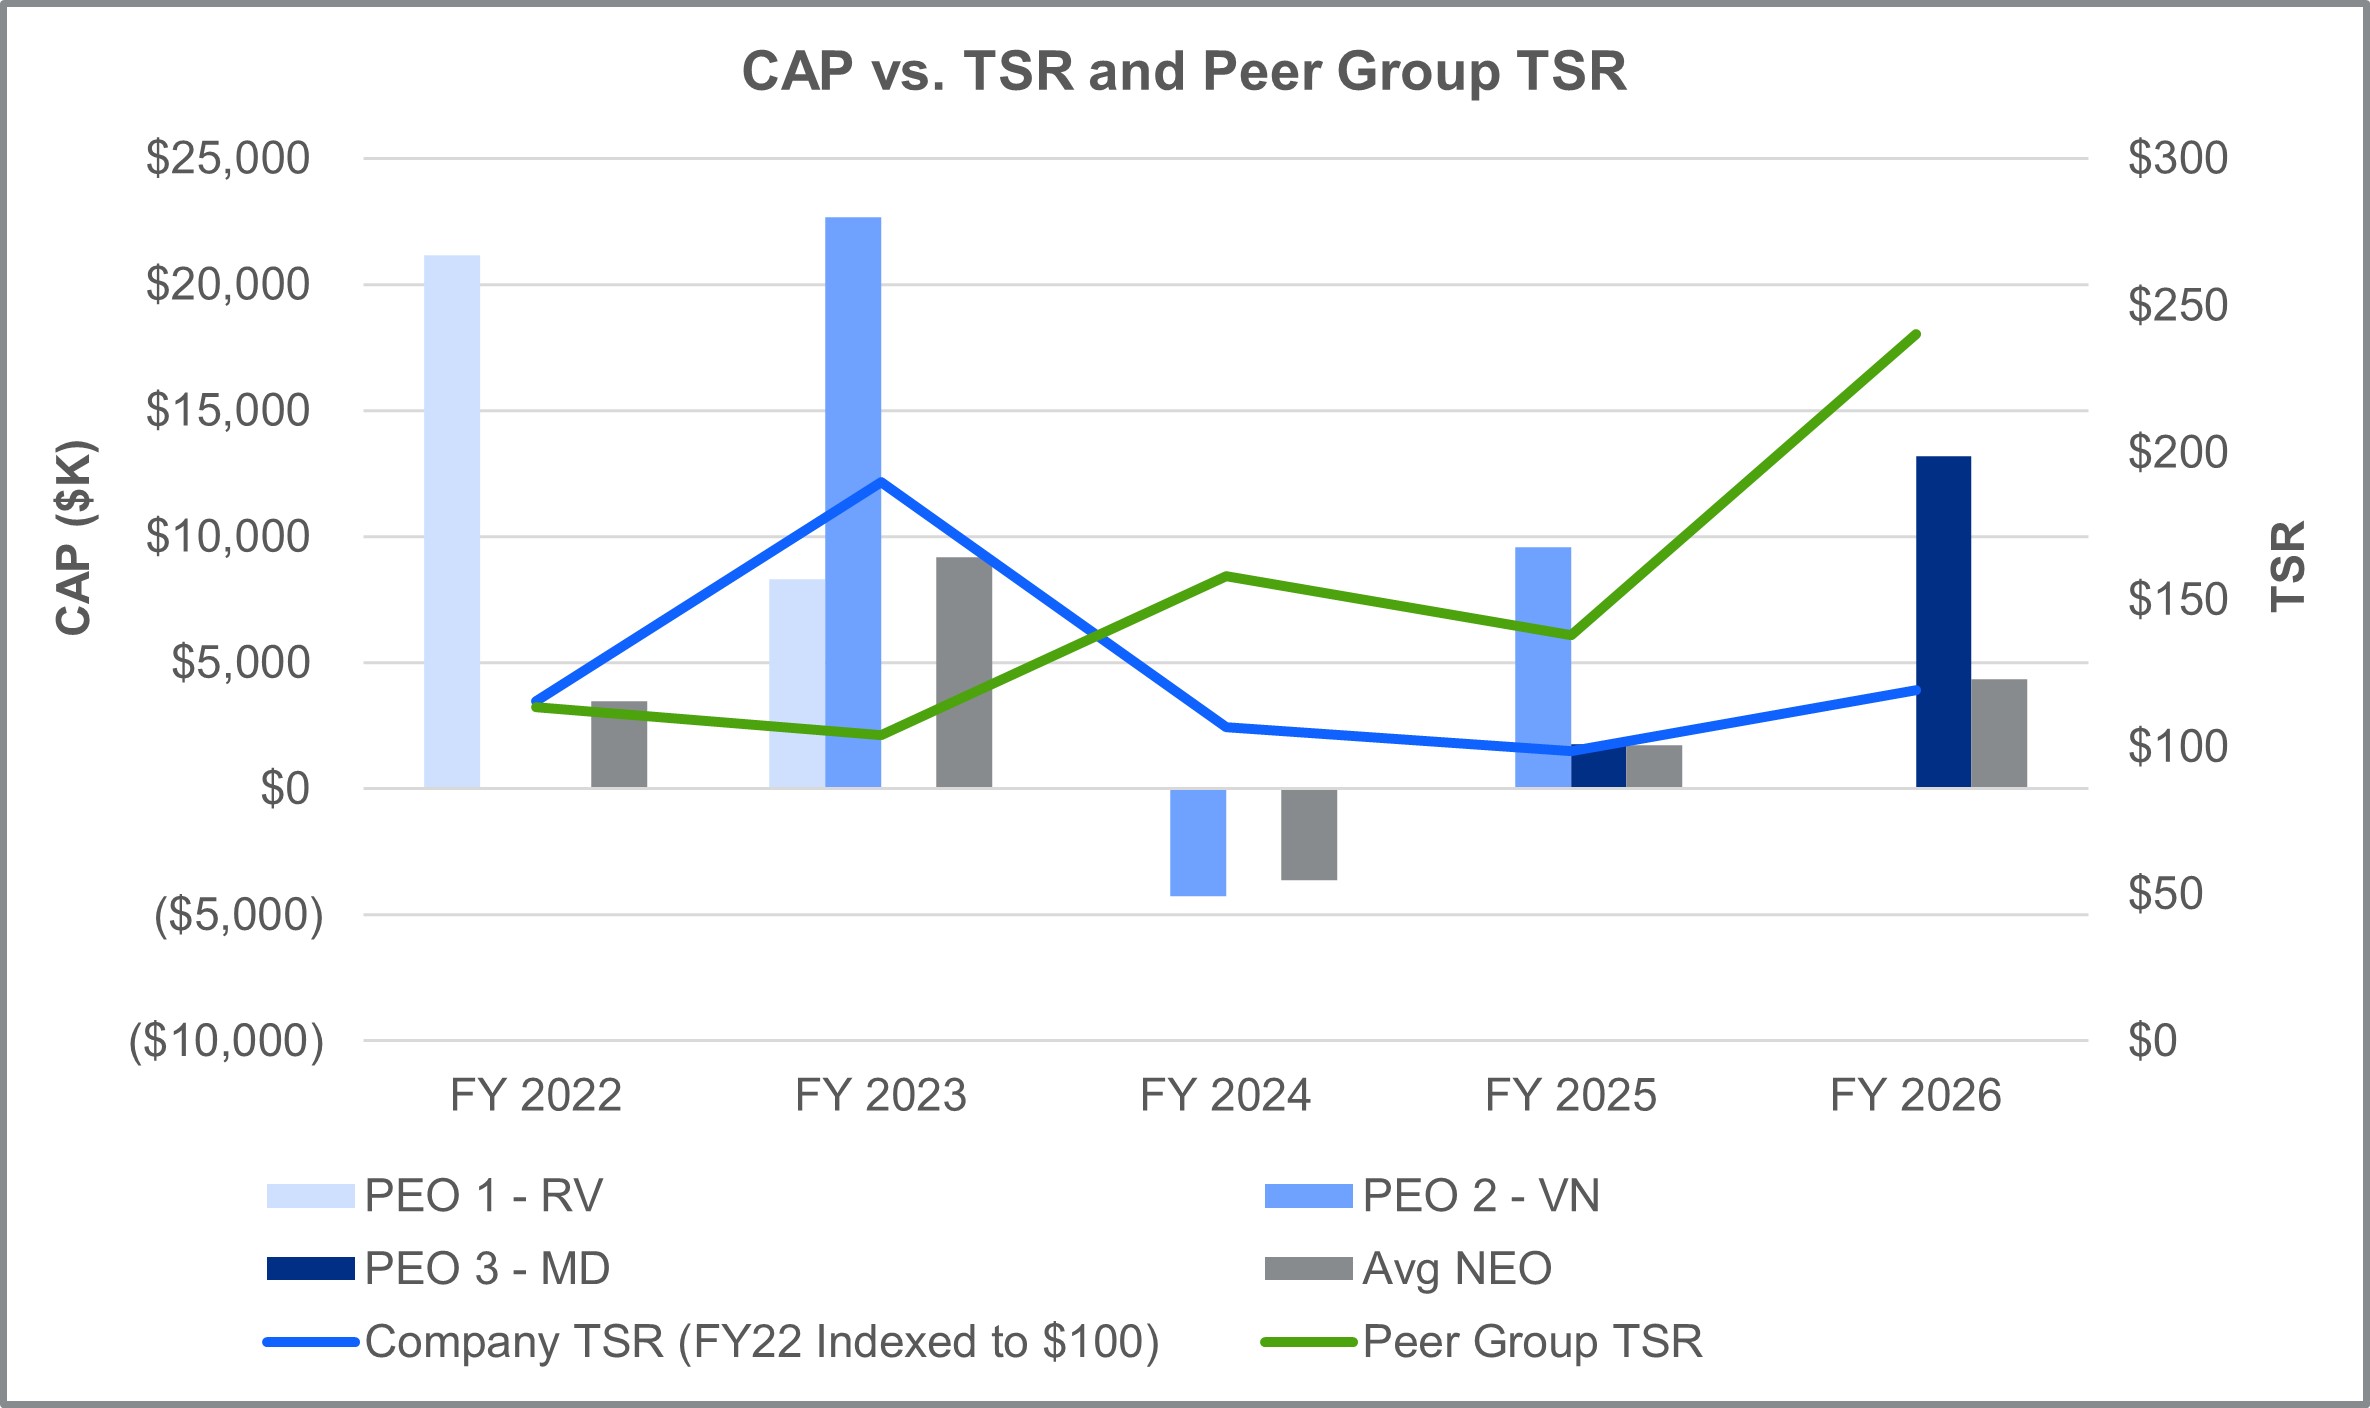
The following chart sets forth the relationship between Compensation Actually Paid (“CAP”) to our PEOs, the average of CAP to our Non-PEO NEOs, and the Company’s cumulative TSR over the five most recently completed fiscal years. This chart also compares our cumulative TSR over the four most recently completed fiscal years to that of the Philadelphia Semiconductor Index over the same period. TSR amounts reported in the graph assume an initial fixed investment of $100 and that all dividends, if any, were reinvested.cap vs tsr and peer group tsr $25,000 $20,000 $15,000 $10,000 $5,000 $0 ($5,000) $(10,000) fy 2022 fy 2023 fy 2024 fy 2025 fy 2026 300 250 200 150 100 50 0 tsr peo - 1 rv peo 3 - md peo -2 vn avg neo Company tsr (FY22 indexed to $100) peer group tsr cap ($k)
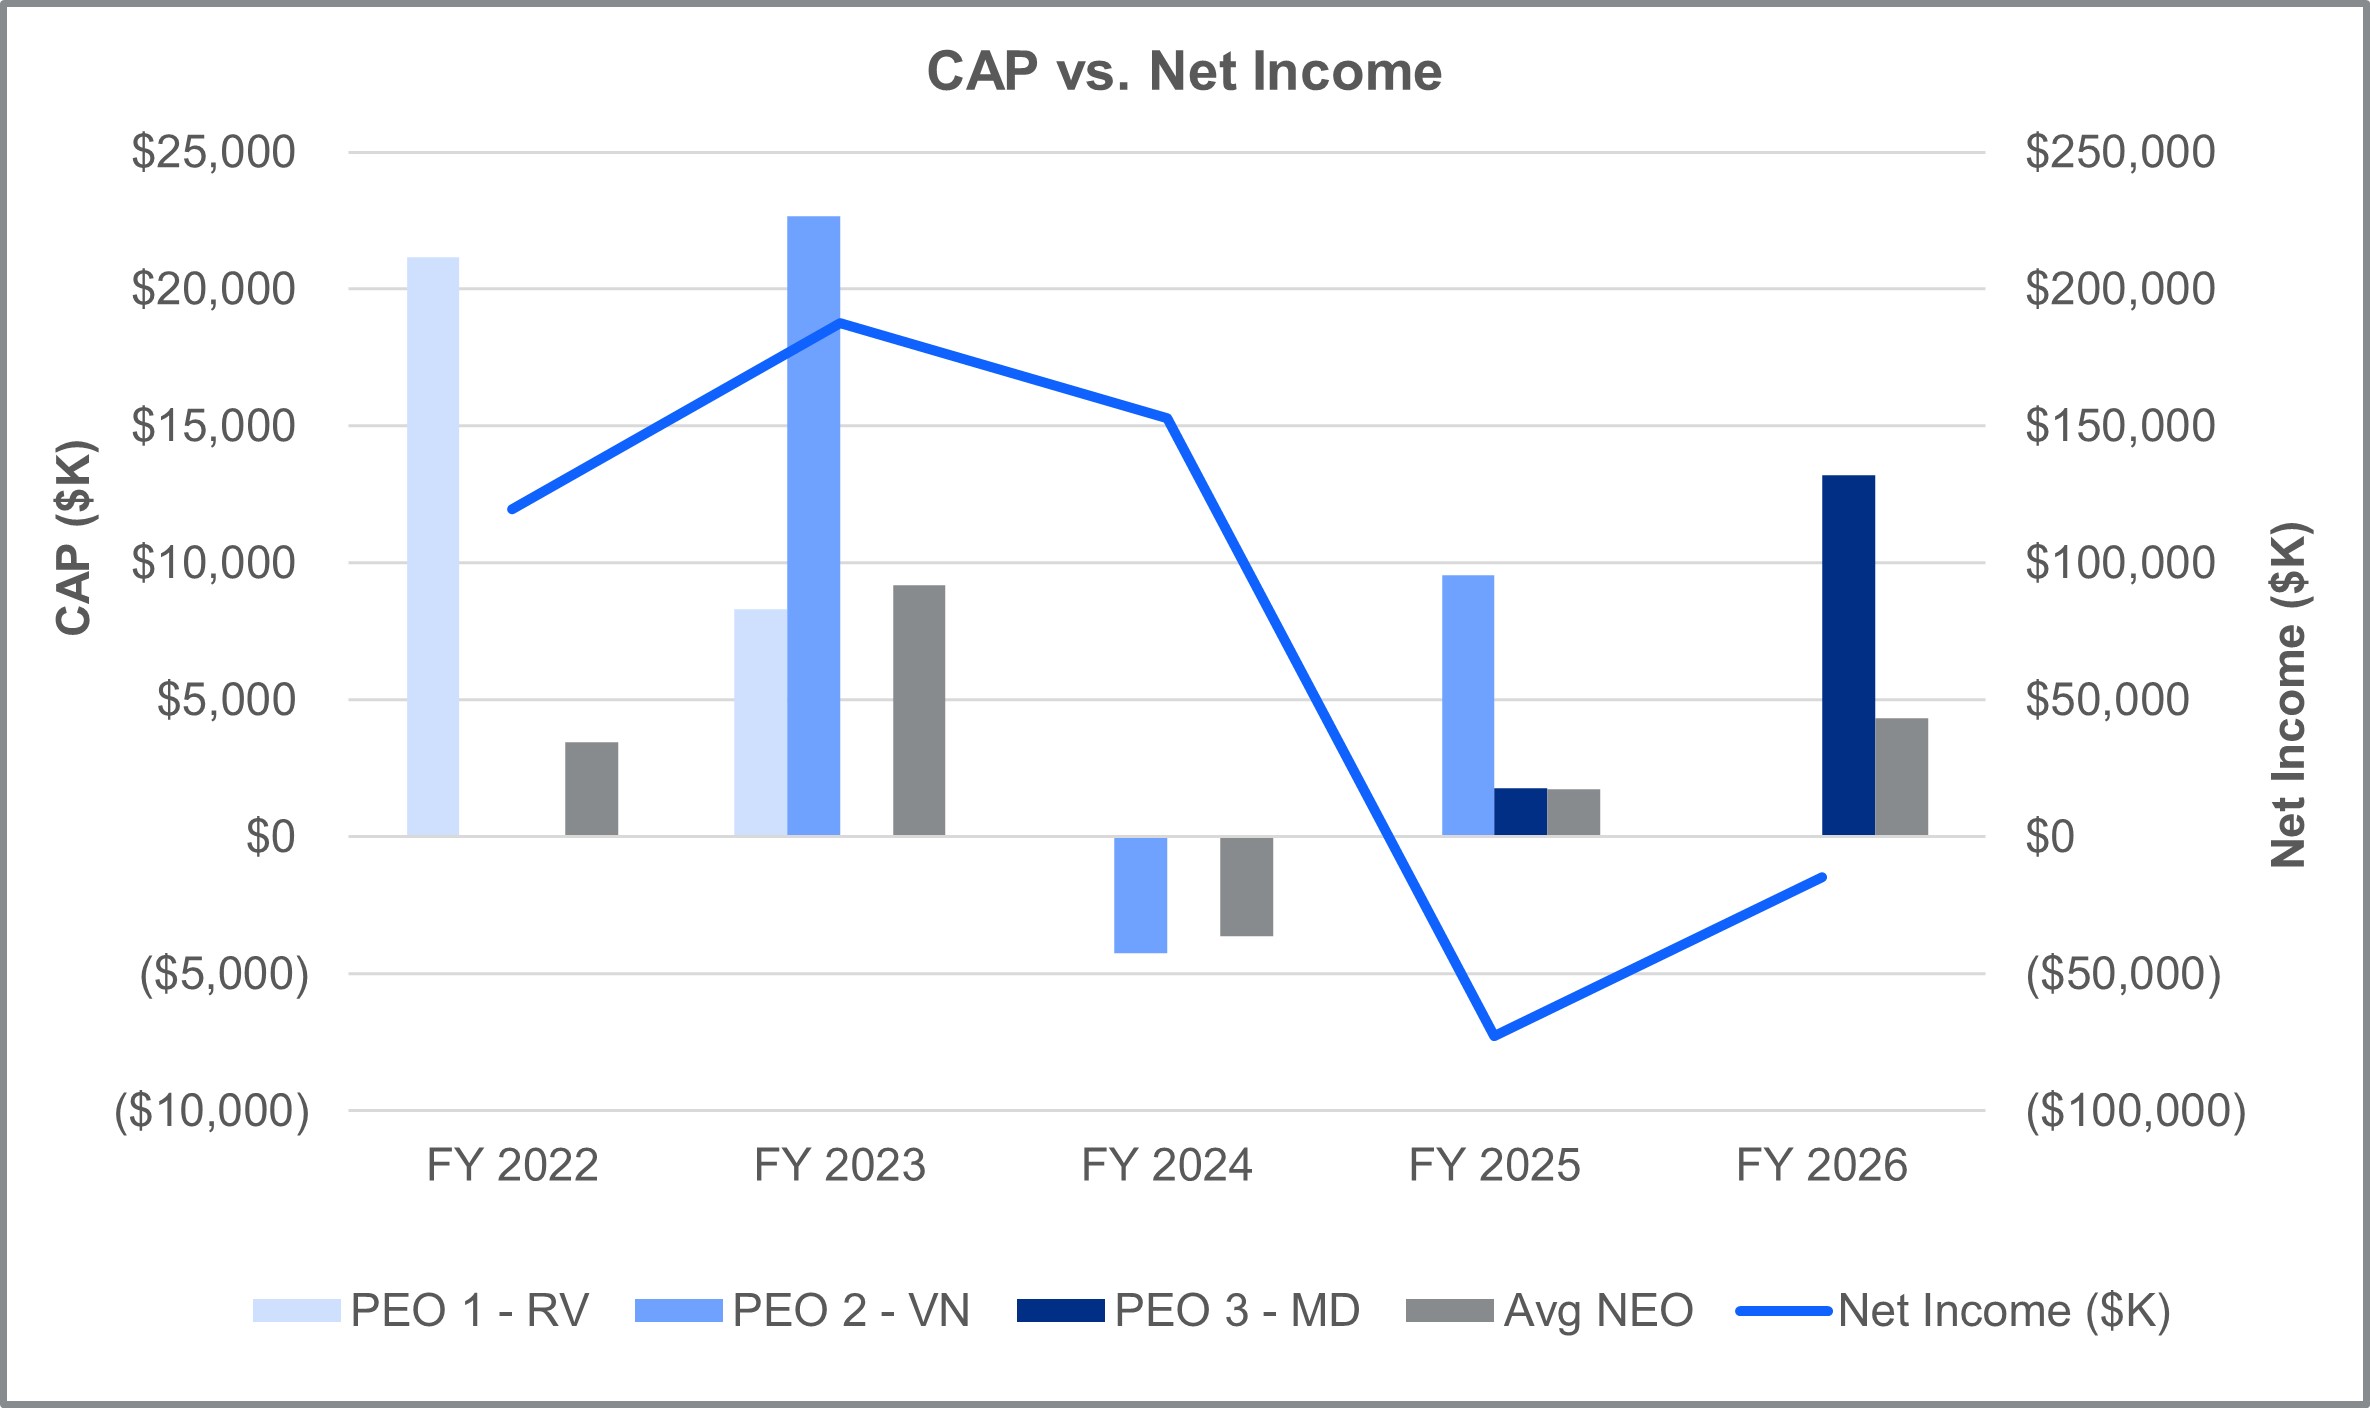
The following chart sets forth the relationship between CAP to our PEOs, the average of CAP to our Non-PEO NEOs, and our net income for each of the five most recently completed fiscal years.cap vs. net income $25,000 $20,000 $15,000 $10,000 $5,000 $0 ($5,000) $(10,000) fy 2022 fy 2023 fy 2024 fy 2025 fy 2026 $250,000 $200,000 $150,000 $100,000 $50,000 $- $950,000) $(100,000) net income ($k) cap ($K) peo 1-rv peo 22 - vn peo 3 - MD avg NEO net income ($K)
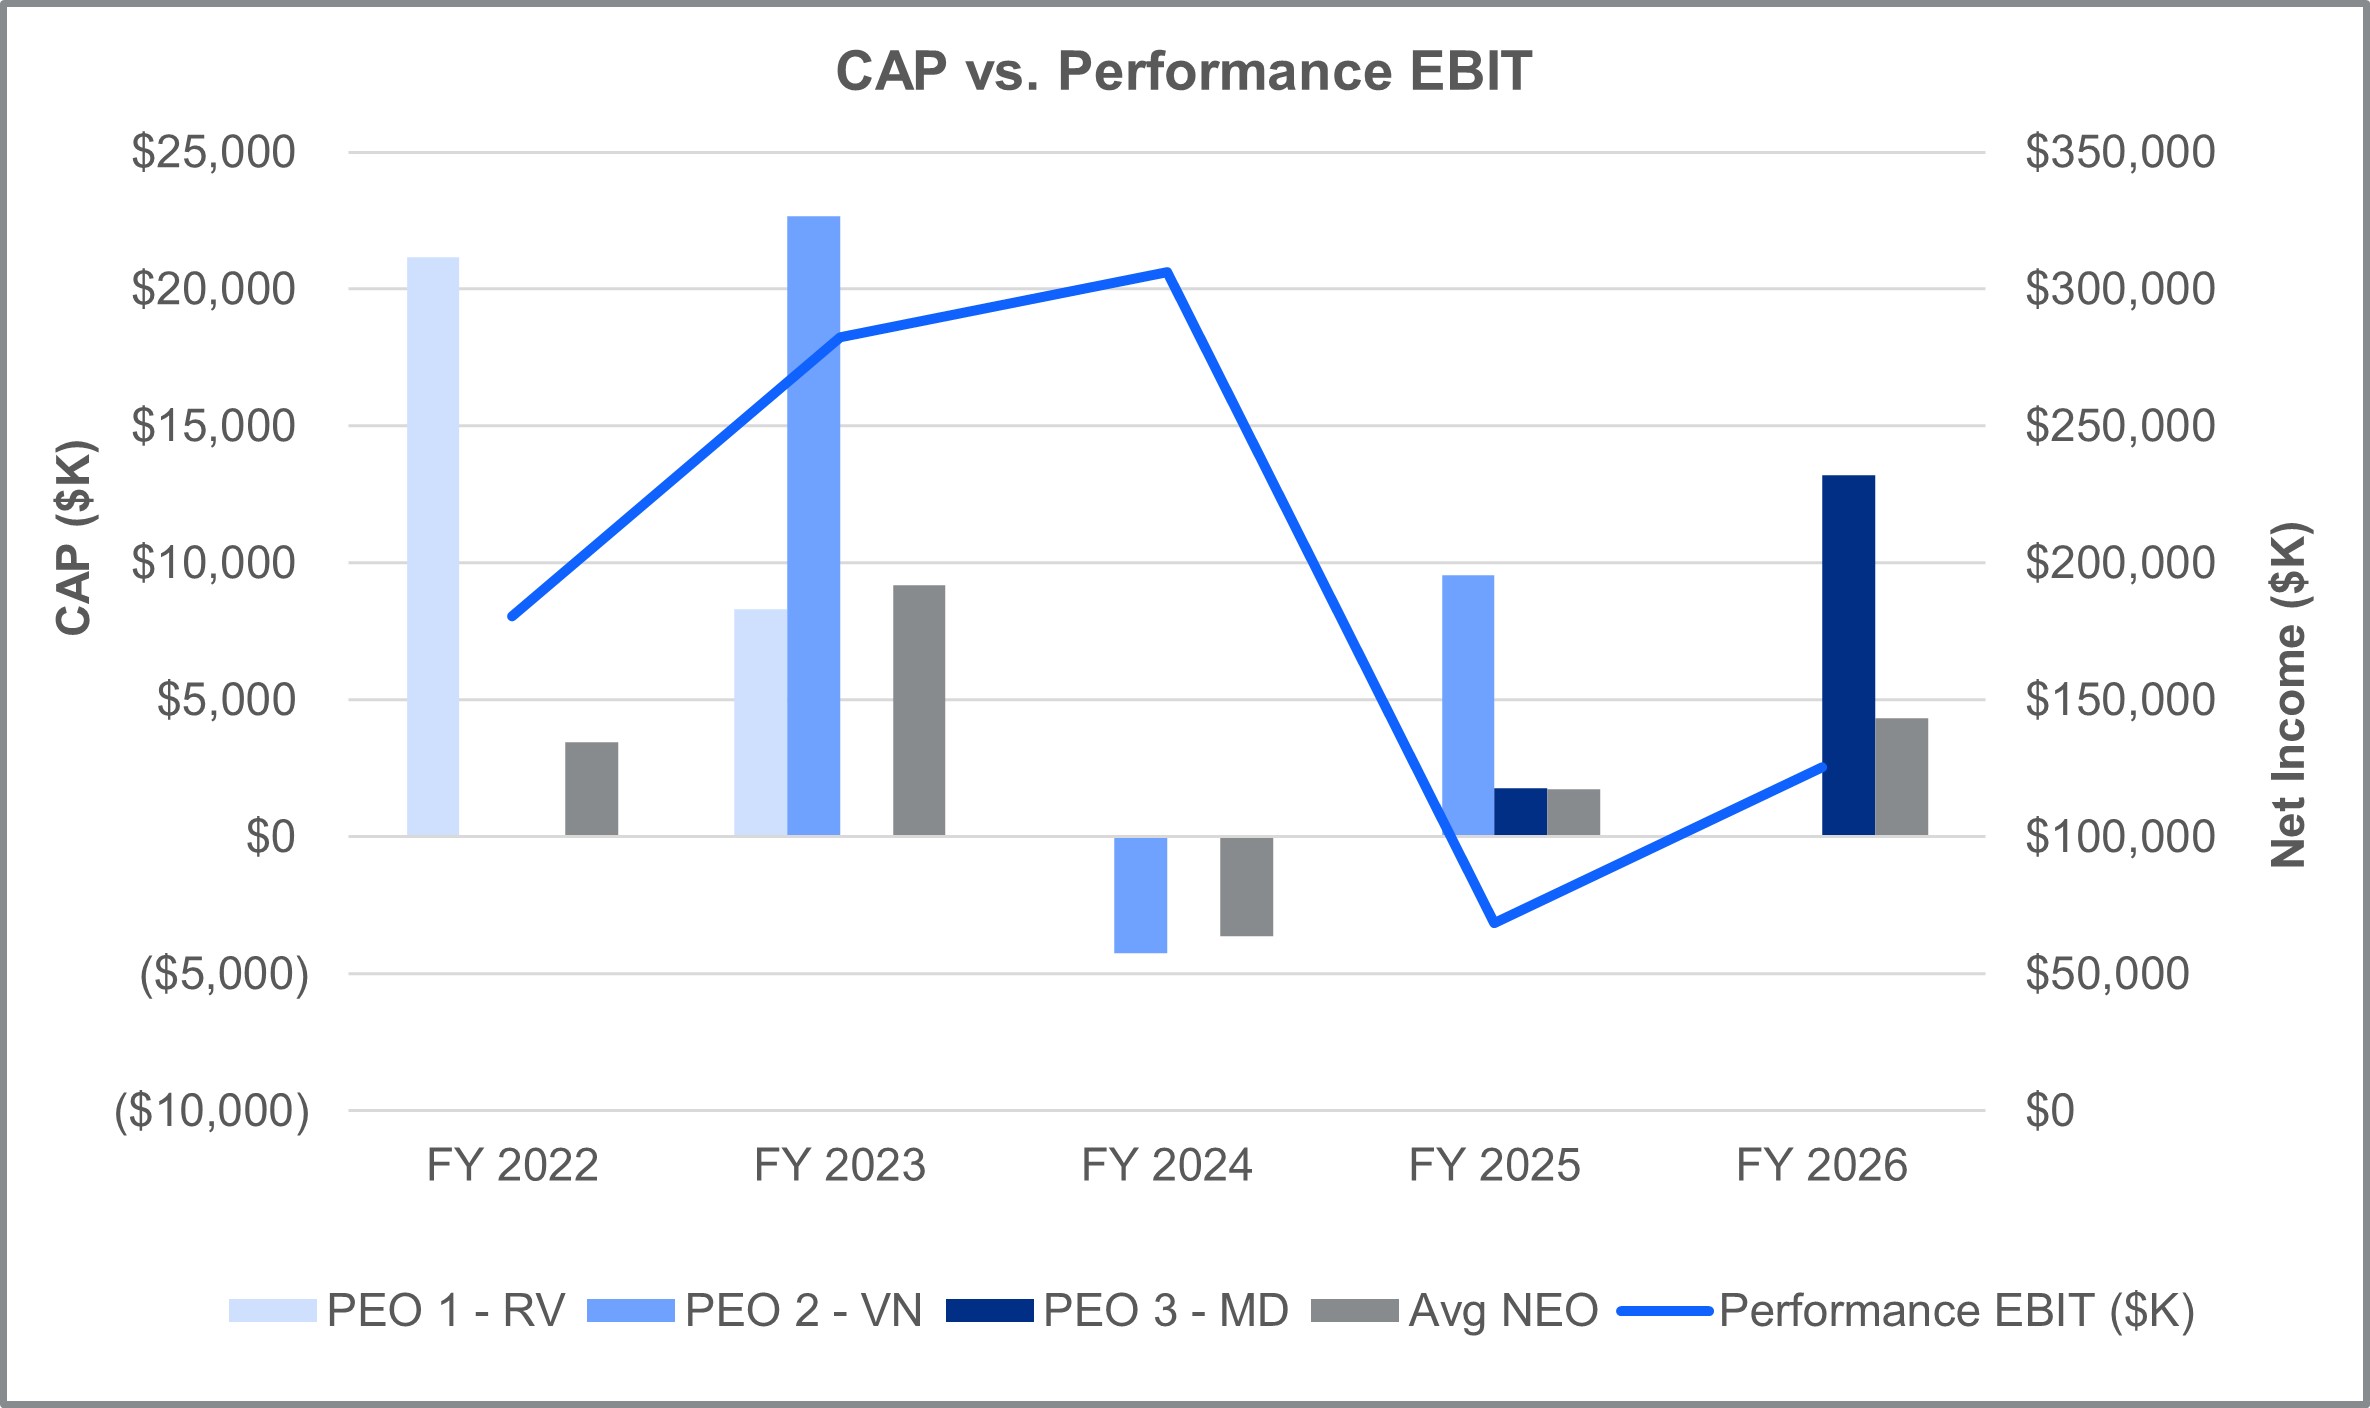
The following chart sets forth the relationship between CAP to our PEOs, the average of CAP to our Non-PEO NEOs, and Performance EBIT during the five most recently completed fiscal years..cap vs. performance ebit $25,000 $20,000 $15,000 $10,000 $5,000 $0 ($5,000) $(10,000) cap ($k) peo 1 - rv peo 2 - vn peo 3 - md avg neo performance ebit ($k) fy 2022 fy 2023 fy 2024 fy 2025 fy 2026 $350,000 $300,000 $250,000 $200,000 $150,000 $100,000 $100,000 $50,000 $- performance ebit ($K)
The following chart sets forth the relationship between Compensation Actually Paid (“CAP”) to our PEOs, the average of CAP to our Non-PEO NEOs, and the Company’s cumulative TSR over the five most recently completed fiscal years. This chart also compares our cumulative TSR over the four most recently completed fiscal years to that of the Philadelphia Semiconductor Index over the same period. TSR amounts reported in the graph assume an initial fixed investment of $100 and that all dividends, if any, were reinvested.cap vs tsr and peer group tsr $25,000 $20,000 $15,000 $10,000 $5,000 $0 ($5,000) $(10,000) fy 2022 fy 2023 fy 2024 fy 2025 fy 2026 300 250 200 150 100 50 0 tsr peo - 1 rv peo 3 - md peo -2 vn avg neo Company tsr (FY22 indexed to $100) peer group tsr cap ($k)
The following table presents the financial performance measures that the Company considers to be the most important in linking CAP to our PEOs and Non-PEO NEOs for 2026 to Company performance. The measures in this table are not ranked.
Performance EBIT |
Performance EBITDA |
Total Revenue |
Relative TSR |