Pay vs Performance Disclosure - USD ($)
Mar. 31, 2026
Mar. 31, 2025
Mar. 31, 2024
Mar. 31, 2023
Mar. 31, 2022
Value on Initial Fixed $100 Investment(3) | ||||||||||||||||||||||||||
Year(1) | Summary Compensation Table Total for PEO | Compensation Actually Paid for PEO(2) | Average Summary Compensation Table Total for Non-PEO NEOs | Average Compensation Actually Paid for Non-PEO NEOs(2) | TSR | Peer Group TSR(4) | Net Income /(Loss) | Revenue(5) | ||||||||||||||||||
| 2026 | $19,909,500 | $(3,617,162) | $4,964,975 | $(827,299) | $121 | $226 | $70,657,000 | $1,183,690,000 | ||||||||||||||||||
| 2025 | $18,811,603 | $42,127,082 | $7,057,946 | $11,393,342 | $245 | $169 | $76,106,000 | $995,619,000 | ||||||||||||||||||
| 2024 | $12,107,760 | $30,293,753 | $3,901,453 | $3,890,783 | $157 | $161 | $168,906,000 | $839,247,000 | ||||||||||||||||||
| 2023 | $10,852,803 | $8,128,462 | $3,237,743 | $1,706,699 | $88 | $108 | $(35,774,000) | $784,590,000 | ||||||||||||||||||
| 2022 | $10,760,212 | $11,275,932 | $3,342,790 | $3,534,151 | $103 | $120 | $33,624,000 | $769,591,000 | ||||||||||||||||||
Year | PEO (CEO) | Non-PEO (NEOs) | ||||||
| 2026 | Sanjay Mirchandani | Gary Merrill, Danielle Abrahamsen, Jen DiRico | ||||||
| 2025 | Sanjay Mirchandani | Jen DiRico, Gary Merrill | ||||||
| 2024 | Sanjay Mirchandani | Gary Merrill, Riccardo Di Blasio | ||||||
| 2023 | Sanjay Mirchandani | Gary Merrill, Riccardo Di Blasio, Brian Carolan | ||||||
| 2022 | Sanjay Mirchandani | Riccardo Di Blasio, Brian Carolan | ||||||
| PEO | 2022 | 2023 | 2024 | 2025 | 2026 | |||||||||||||||||||||
| Summary Compensation Table - Total Compensation | $10,760,212 | $10,852,803 | $12,107,760 | $18,811,603 | $19,909,500 | |||||||||||||||||||||
| - | Grant Date Fair Value of Stock Awards and Option Awards Granted in Fiscal Year | $9,413,382 | $9,722,388 | $10,694,658 | $16,522,465 | $18,046,786 | ||||||||||||||||||||
| + | Fair Value at Fiscal Year End of Outstanding and Unvested Stock Awards and Option Awards Granted in Fiscal Year | $10,030,014 | $9,814,556 | $19,279,768 | $25,421,345 | $5,437,745 | ||||||||||||||||||||
| + | Change in Fair Value of Outstanding and Unvested Stock Awards and Option Awards Granted in Prior Fiscal Years | $(616,535) | $(1,773,893) | $7,094,774 | $8,621,030 | $(13,227,555) | ||||||||||||||||||||
| + | Fair Value at Vesting of Stock Awards and Option Awards Granted in Fiscal Year That Vested During Fiscal Year | $— | $— | $— | $— | $— | ||||||||||||||||||||
| + | Change in Fair Value as of Vesting Date of Stock Awards and Option Awards Granted in Prior Fiscal Years For Which Applicable Vesting Conditions Were Satisfied During Fiscal Year | $515,623 | $(1,042,616) | $2,506,109 | $5,795,569 | $2,309,934 | ||||||||||||||||||||
| - | Fair Value as of Prior Fiscal Year End of Stock Awards and Option Awards Granted in Fiscal Years That Failed to Meet Applicable Vesting Conditions During Fiscal Year | $— | $— | $— | $— | $— | ||||||||||||||||||||
| = | Compensation Actually Paid | $11,275,932 | $8,128,462 | $30,293,753 | $42,127,082 | $(3,617,162) | ||||||||||||||||||||
| NEO Average | 2022 | 2023 | 2024 | 2025 | 2026 | |||||||||||||||||||||
| Summary Compensation Table - Total Compensation | $3,342,790 | $3,237,743 | $3,901,453 | $7,057,946 | $4,964,975 | |||||||||||||||||||||
| - | Grant Date Fair Value of Stock Awards and Option Awards Granted in Fiscal Year | $2,491,707 | $2,559,448 | $3,142,162 | $6,048,230 | $4,195,544 | ||||||||||||||||||||
| + | Fair Value at Fiscal Year End of Outstanding and Unvested Stock Awards and Option Awards Granted in Fiscal Year | $2,655,470 | $2,185,843 | $3,179,994 | $8,385,381 | $762,404 | ||||||||||||||||||||
| + | Change in Fair Value of Outstanding and Unvested Stock Awards and Option Awards Granted in Prior Fiscal Years | $(165,930) | $(924,865) | $625,474 | $1,264,427 | $(1,705,358) | ||||||||||||||||||||
| + | Fair Value at Vesting of Stock Awards and Option Awards Granted in Fiscal Year That Vested During Fiscal Year | $— | $287,324 | $— | $— | $— | ||||||||||||||||||||
| + | Change in Fair Value as of Vesting Date of Stock Awards and Option Awards Granted in Prior Fiscal Years For Which Applicable Vesting Conditions Were Satisfied During Fiscal Year | $193,528 | $(209,402) | $432,318 | $733,818 | $463,362 | ||||||||||||||||||||
| - | Fair Value as of Prior Fiscal Year End of Stock Awards and Option Awards Granted in Fiscal Years That Failed to Meet Applicable Vesting Conditions During Fiscal Year | $— | $310,496 | $1,106,294 | $— | $1,117,138 | ||||||||||||||||||||
| = | Compensation Actually Paid | $3,534,151 | $1,706,699 | $3,890,783 | $11,393,342 | $(827,299) | ||||||||||||||||||||
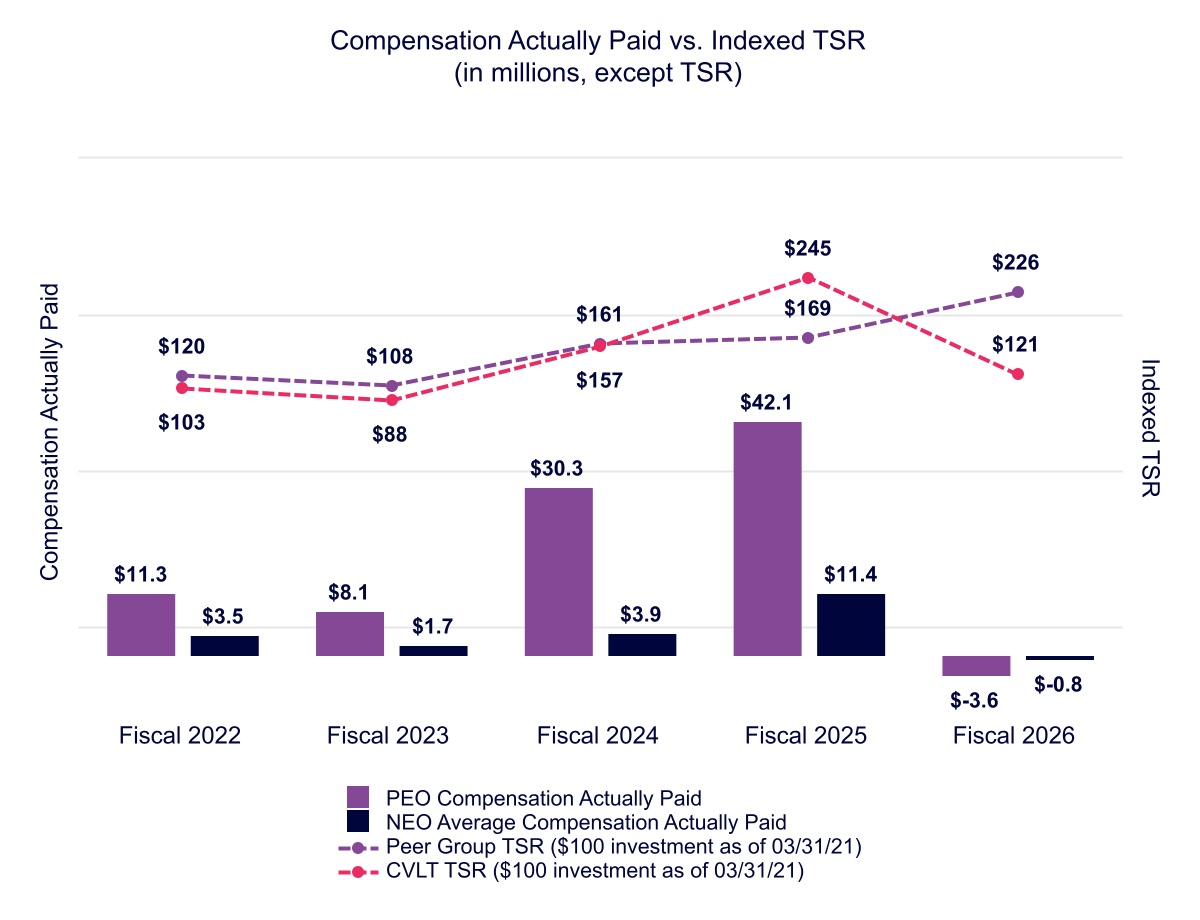
The following graph illustrates the relationship between compensation actually paid to our PEO and our non-PEO NEOs and our TSR for the period presented in the Pay-Versus-Performance table.
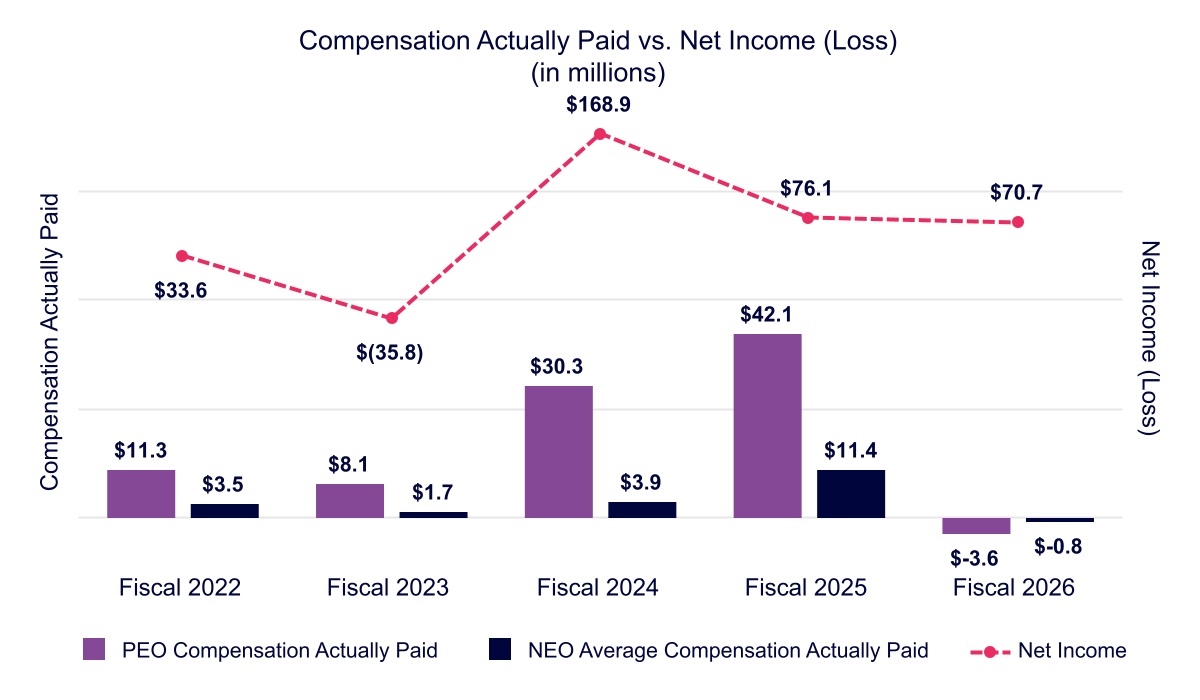
The following graph illustrates the relationship between compensation actually paid to our PEO and our non-PEO NEOs and our net income for the period presented in the Pay-Versus-Performance table.
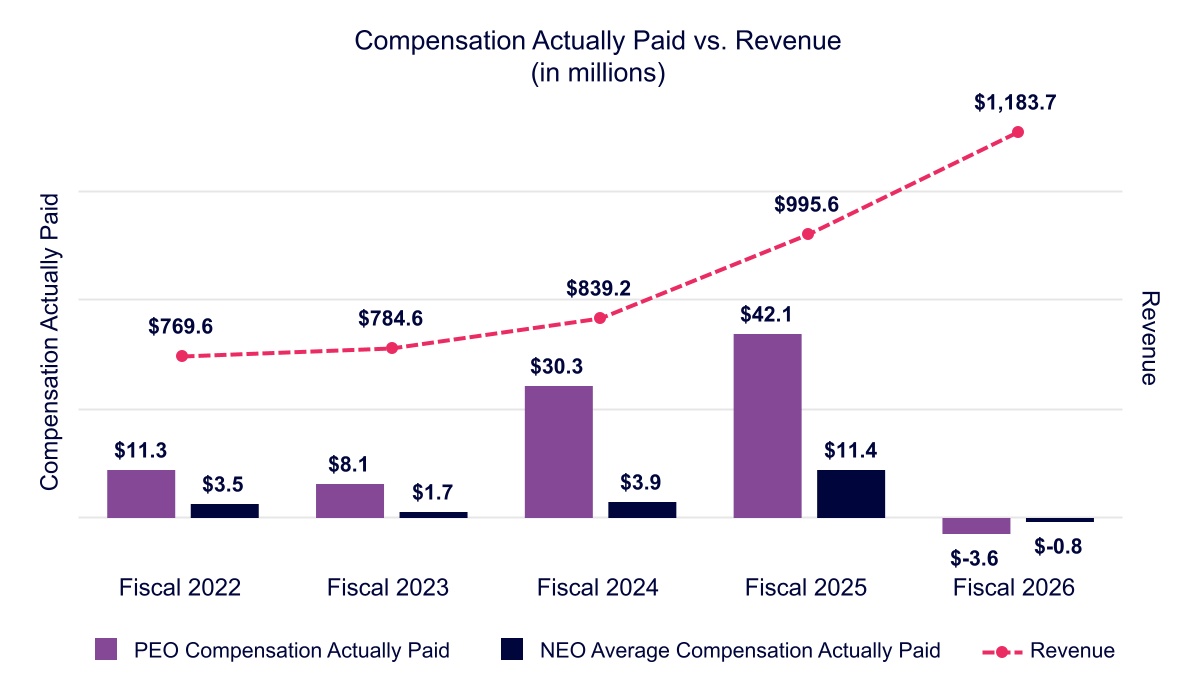
The following graph illustrates the relationship between compensation actually paid to our PEO and our non-PEO NEOs and our revenue for the period presented in the Pay-Versus-Performance table.
The following graph illustrates the relationship between compensation actually paid to our PEO and our non-PEO NEOs and our TSR for the period presented in the Pay-Versus-Performance table.
Company Performance Measures | ||
| Revenue | ||
| Non-GAAP EBIT | ||
| Relative TSR | ||
| ARR | ||