Exhibit 99.1

 INVESTOR DAY  June 24  2026  Exhibit 99.1 
 

 2  The presentation is dated as of June 24, 2026 and speaks as of the date unless otherwise specified.   FORWARD-LOOKING STATEMENTS  This presentation contains statements that may constitute forward-looking statements within the meaning of the Private Securities Litigation Reform Act of 1995, including those related to the expectations for future periods, possible or assumed future results of operations, financial conditions, liquidity and related sources or needs, business and/or integration strategies, plans and synergies, supply chain, growth opportunities, and performance at our stores. There are a number of known and unknown risks, uncertainties, and other factors that may cause our actual results to differ materially from any results expressed or implied by these forward-looking statements, including but not limited to the execution of our strategic plan, the integration and financial performance of acquired stores, wholesale fuel, inventory and ingredient costs, distribution challenges and disruptions, the impact and duration of conflicts in oil producing regions or other geopolitical disruptions, as well as other risks, uncertainties and factors which are described in the Company’s most recent annual report on Form 10-K and quarterly reports on Form 10-Q, as filed with the Securities and Exchange Commission and available on our website. Any forward-looking statements contained in this presentation represent our current views as of the date of this presentation with respect to future events, and Casey’s disclaims 
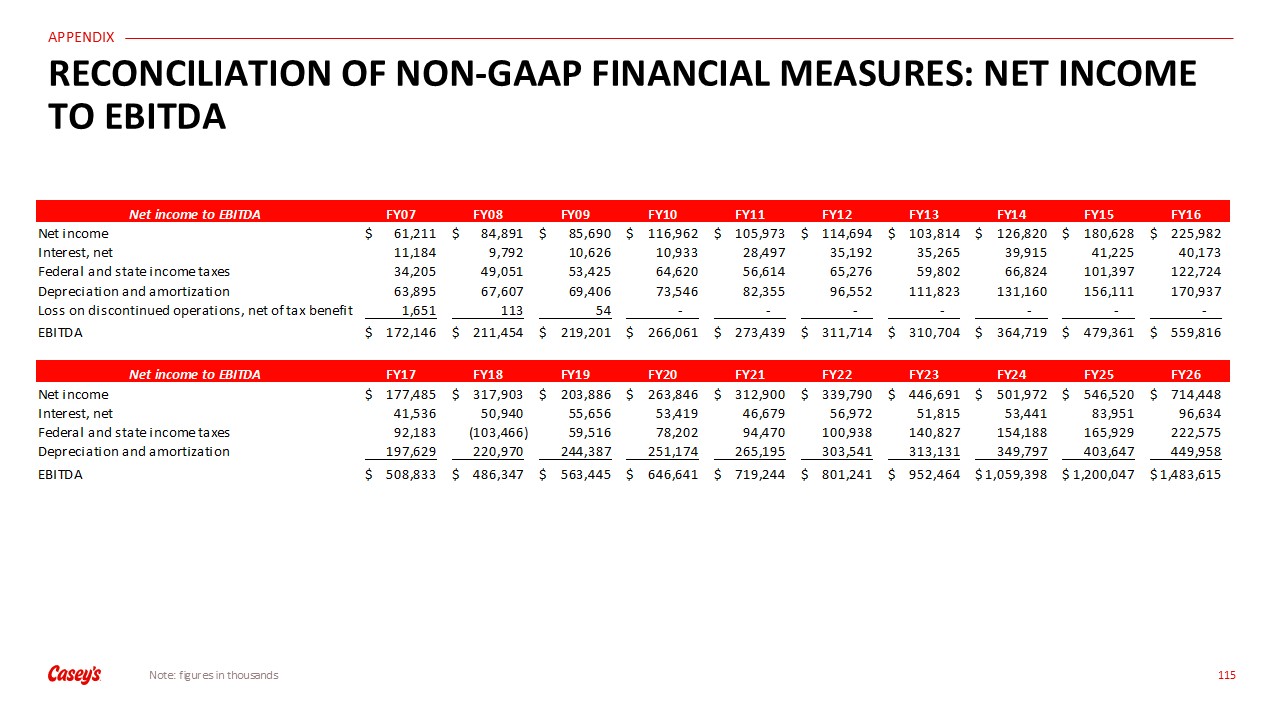
any intention or obligation to update or revise any forward-looking statements in the presentation whether as a result of new information, future events, or otherwise.  USE OF NON-GAAP MEASURES  This presentation includes references to "EBITDA," which we define as net income before net interest expense, income taxes, and depreciation and amortization. EBITDA is not presented in accordance with accounting principles generally accepted in the United States ("GAAP"). We believe EBITDA is useful to investors in evaluating our operating performance because securities analysts and other interested parties use such calculations as a measure of financial performance and debt service capabilities, and it is regularly used by management for internal purposes including our capital budgeting process, evaluating acquisition targets, and assessing store performance. EBITDA is not a recognized term under GAAP and should not be considered a substitute for net income, cash flows from 
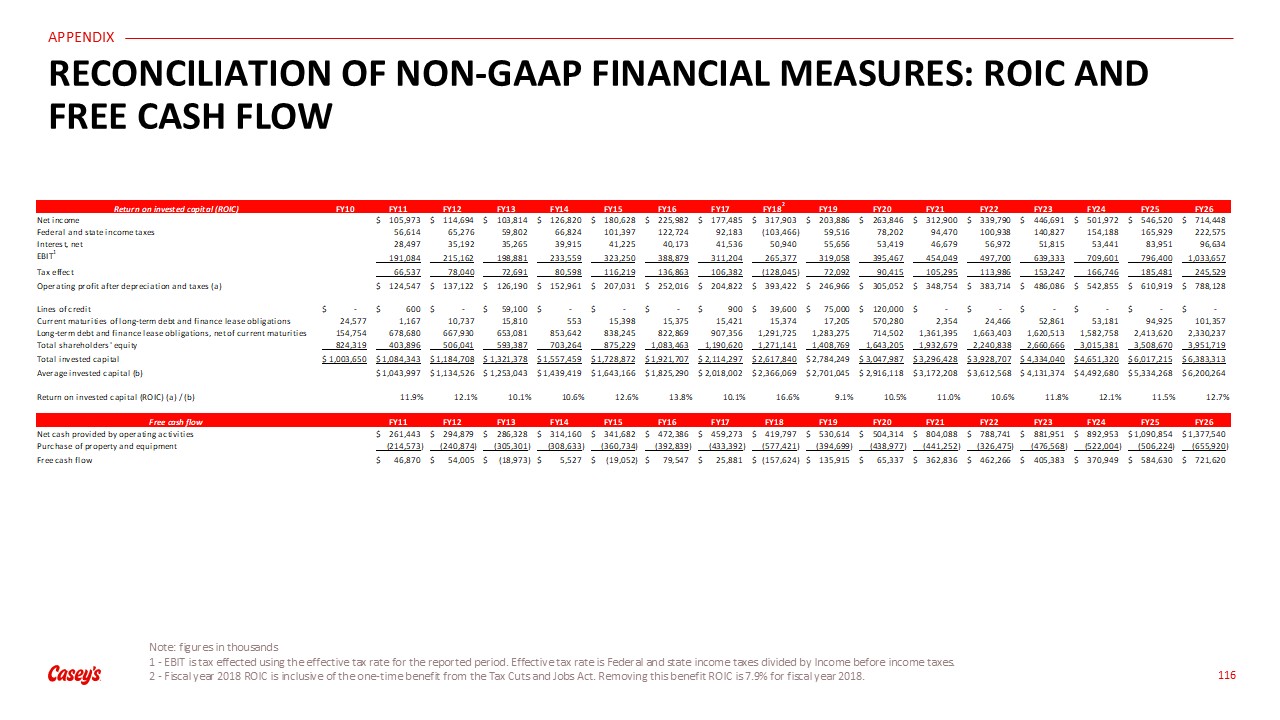
operating activities or other income or cash flow statement data. This presentation also includes references to “free cash flow," which we define as net cash provided by operating activities less purchases of property and equipment. Free cash flow is not presented in accordance with GAAP. We believe free cash flow is useful to investors in evaluating our cash generation because securities analysts and other interested parties use such calculations as a measure of financial performance, liquidity, and debt service capabilities, and it is regularly used by management for internal purposes including our capital budgeting process, evaluating acquisition targets, and evaluating debt service. This presentation also includes references to “return on invested capital” or “ROIC,” which we define as operating profit after taxes (net income, plus net interest expenses, income taxes, tax effected) divided by average invested capital. ROIC is not presented in accordance with GAAP. We believe ROIC is useful to investors as a measure of financial performance and prudent capital allocation and is regularly used by management for internal purposes including our capital budgeting process, evaluating acquisition targets and assessing company performance. Neither EBITDA, free cash flow, nor ROIC are recognized terms under GAAP and should not be considered a substitute for net income, net cash provided by operating activities or other income or cash flow statement data. EBITDA, free cash flow, and ROIC have limitations as an analytical tool, and should not be considered in isolation or as a substitute for analysis of our results as reported under GAAP. We strongly encourage investors to review our financial statements and publicly filed reports in their entirety and not to rely on any single financial measure. Because non-GAAP financial measures are not standardized, EBITDA, free cash flow, and ROIC, as defined by us, may not be comparable to similarly titled measures reported by other companies. It therefore may not be possible to compare our use of this non-GAAP financial measure with those used by other companies. For reconciliations of EBITDA, free cash flow, and ROIC to GAAP net income and net cash generated by operating activities, for the completed applicable period shown, see the appendix attached hereto. 
 

 3  TODAY’S PRESENTERS  DARREN REBELEZ  President & Chief Executive Officer  Since June 2019  STEVE BRAMLAGE  Chief Financial Officer  Since May 2020  TOM BRENNAN  Chief Merchandising Officer  Since October 2019  ENA WILLIAMS  Chief Operating Officer  Since June 2020  BRAD HAGA  SVP, Prepared Food & Dispensed Beverage  Since February 2020  CHAD FRAZELL  Chief Human Resources Officer  Since January 2020  NATHANIEL DODDRIDGE  SVP, Fuels  Since August 2017 
 

 4  Today’s Agenda  Evolving our Strategy  Darren Rebelez | President & Chief Executive Officer  Q&A  Executive Leadership Team  Scalable Foundation  Ena Williams | Chief Operating Officer; Nathaniel Doddridge | SVP, Fuels  Accelerate Food and Beverage  Brad Haga| SVP, Prepared Food & Dispensed Beverage  Grow Units & Enhance Operational Efficiency  Ena Williams| Chief Operating Officer  Proven Financial Execution  Steve Bramlage | Chief Financial Officer  Team Member Value Proposition  Chad Frazell | Chief Human Resources Officer  Why Invest in Casey’s  Darren Rebelez | President & Chief Executive Officer  The Guest  Tom Brennan | Chief Merchandising Officer  BREAK  LUNCH 
 

 Our proven, compounding growth strategy has multiple levers for growth and efficiency with a strong runway in prepared food, private brands and fuel   Our “Convenience QSR” operating model creates a flywheel effect, strengthening our advantages as many competitors face secular headwinds  We have clear competitive advantages, including our unique rural footprint, restaurant-quality prepared food, vertical integration, 100% company owned and operated retail stores, and consolidated scale  We executed on our last 3-year strategic plan and delivered on our commitments under the plan  TODAY’S KEY MESSAGES  5 
 

 6  EVOLVING OUR STRATEGY  DARREN REBELEZ  PRESIDENT & CHIEF EXECUTIVE OFFICER 
 

 AN INTRODUCTION TO CASEY’S  7 
 

 Note: Market data, number of locations, transactions, team members as of April 30, 2026.   1 - Inside is defined as the combination of grocery and general merchandise and prepared food and dispensed beverage. Same-store sales is defined as the total sales increase (or decrease) for stores open during the full time of the periods being presented.  2 - By number of stores in the U.S., source CSP Daily News - Top 202 Convenience Stores 2025  3 - ~1,500 liquor license locations ranks 4th in the United States  4 - 5th largest pizza chain business by number of kitchens in United States, supported by Placer.ai  8  CASEY’S IS A STAPLE FOR MILLIONS OF AMERICANS  3rd  largest convenience store chain in the United States2  4th  in liquor licenses among US retailers3  5th  largest pizza chain in the United States4  NASDAQ: CASY  ND  SD  WI   MN  IA  NE  IN  OH  IL   KY  KS  MO   OK  TN  TX  AR  AL  FL  MI  ~$32B  Total Enterprise Value  ~3,000  Convenience Stores Operating in 19 States  ~800M  Guest Transactions per Year  ~50,000  Total Team Members  25  consecutive years of inside same-store sales1 growth  27  consecutive years of dividend increase 
 

 9  CASEY’S SITS AT THE INTERSECTION OF CONVENIENCE AND QSR  CONVENIENCE STORE  QUICK-SERVICE RESTAURANT 
 

 CASEY’S HAS UNIQUE COMPETITIVE ADVANTAGES IN THE CONVENIENCE AND QSR RETAIL LANDSCAPES  10  DIFFERENTIATOR  BENEFIT  UNIQUE FOOTPRINT   ~2/3rds of stores in towns of 20K people or fewer  Stronger market position in rural areas; generally less expensive to build, buy, and operate units  PREPARED FOOD   Prepared food is a larger % of inside sales mix1  5th largest pizza chain in the US  Food sales across all dayparts, with high quality differentiated products and best-in-class margins1  ADVANCED TECHNOLOGY   Rewards platform with ~11M (and growing) members  AI-infused resilient and agile tech stack  Higher transaction value, more frequent visits, and personalized marketing to influence guest behavior  VERTICAL INTEGRATION   Products inside store delivered from owned distribution centers   Fuel delivered from owned tanker fleet  Positive control over value chain that enables service to rural areas and distribution efficiencies  CONSOLIDATED SCALE   3rd largest US convenience retailer in highly fragmented industry  100% company owned and operated retail stores  Stronger business relationships with strategic vendors  Enables speed to market through end-to-end control that strengthens both upstream partnerships with vendors and downstream execution at stores  1 – In comparison to convenience store peers. 
 

 11  CASEY’S “CONVENIENCE QSR” OPERATING MODEL CREATES FLYWHEEL EFFECT FOR COMPOUNDING EARNINGS GROWTH  ECONOMIC & MARGIN   Shared labor and fixed costs across 3 lines of business   Mix shift to higher-margin categories expands overall margin profile  Strong operating leverage as incremental sales scale through a single cost base  GUESTS & TRAFFIC  One-stop destination increases trip frequency and convenience  Cross-category attachment drives higher basket sizes  Mission trips relevant to all dayparts  RESILIENCE & RISK DIVERSIFICATION  Balanced revenue streams mitigate earnings volatility   Multiple demand drivers reduce reliance on any single category  More predictable cash flow supported by diversified, recurring trips across missions  3. OPERATING LEVERAGE IMPROVES  4. EARNINGS GROW  1. REINVEST INTO VALUE PROPOSITION   2. TRAFFIC INCREASES  PREPARED FOOD &DISPENSED BEVERAGES  GROCERY & GENERAL MERCHANDISE  FUEL  OPERATINGCOSTS 
 

 12  1 - EBITDA is a non-GAAP metric, and we define EBITDA as net income before net interest expense, income taxes, depreciation and amortization. A reconciliation of EBITDA to net income is included in the Appendix. 2 - ROIC is a non-GAAP metric, and we define ROIC as operating profit after taxes (net income, plus net interest expenses, income taxes, tax effected) divided by average invested capital. Fiscal year 2018 ROIC is exclusive of the one-time benefit from the Tax Cuts and Jobs Act. A reconciliation of ROIC is included in the Appendix.  OUR MODEL HAS A LONG TRACK RECORD OF COMPOUNDING SUCCESS  EBITDA1 CAGR  Total Store Count CAGR  Total Inside Sales CAGR  Average Annual ROIC2  FY10-FY20  9.3%  3.7%  9.6%  10.9%  FY20-FY23  13.8%  4.5%  9.9%  11.1%  FY23-FY26  15.9%  5.3%  10.0%  12.1%  FY11-FY20  FY21-FY23  FY24-FY26 
 

 13  CONSISTENT AND RESILIENT SUCCESS LED TO ADDITION TO S&P 500  z  2017  Opened 2000th store in Russellville, KY  2024  Largest acquisition in Company history with Fikes Wholesale  2025  Crossed the $20 billion market cap threshold  2026  CASEY’S ADDED TO S&P 500  2021  Opened 3rd distribution center in Joplin, MO 
 

 REVIEW OF LAST 3-YEAR STRATEGIC PLAN  14 
 

 guest insights   Deliver top quintile1 EBITDA growth of 8-10%  1 – For the FY24-FY26 Plan: Top Quintile defined as S&P 500 ǀ S&P 400 composite retail peers with market cap > $5B plus public c-store peers. Excludes Amazon.com, Inc., Etsy, Inc., eBay Inc., and Walgreens Boots Alliances, Inc. Growth rates represent forward-looking next 3 years growth calendarized to Casey’s FYE April 30. Sourced from FactSet as of May 15, 2023.   15  DURING OUR 2023 INVESTOR DAY, WE SAID WE WERE GOING TO…  Team Member Value Proposition  Enabling Foundation  ENHANCE   OPERATIONALEFFICIENCY   GROW THE NUMBER OF UNITS  ACCELERATETHE FOOD BUSINESS 
 

 16  …AND WE DELIVERED ON OUR OBJECTIVES  16  ENABLING FOUNDATION  Launched and scaled fuel self-supply  Delivered modern enterprise data & analytics toolkit and capabilities  Implemented AI-enabled demand forecasting tool, decreasing warehouse working capital by 33%  GROW THE NUMBER OF UNITS  Added 504 new and acquired stores  Closed on Fikes Wholesale, largest acquisition in company history  Expanded to 19 states including Texas  DELIVER TOP QUINTILE EBITDA GROWTH  16% CAGR over 3-year period   2023 INVESTOR DAY PILLARS  SELECT ACCOMPLISHMENTS  ACCELERATE THE FOOD BUSINESS  10% CAGR Prepared Food & Dispensed Beverage sales  Casey’s Rewards members grew by over 60% to 10+ million  Launched and scaled new sauced wings and fries to first 850 stores  TEAM MEMBER VALUE PROPOSITION  ~70ppt reduction in store team member turnover  Maintained 80%+ overall team member engagement  Over 23k internal promotions  ENHANCE OPERATIONAL EFFICIENCY  10% operating expense growth < 16% EBITDA growth  5% cumulative same-store labor hour reduction through continuous improvement   >$200 million savings from centralized procurement and asset protection  GUEST INSIGHTS  75% Overall Satisfaction all-time high 
 

 STRONG EXECUTION GENERATED RESULTS EXCEEDING TARGETS...  REVIEW OF LAST 3-YEAR STRATEGIC PLAN  1 – Free cash flow is a non-GAAP metric, and we define free cash flow as cash flow from operations less the purchase of property & equipment. A reconciliation of free cash flow is included in the Appendix.  17  504  Stores AddedOver 3-year Period  +230bps  Inside Margin ExpansionOver 3-year Period  16%  EBITDA CAGROver 3-year Period  4%  Avg Inside Same-store Sales GrowthOver 3-year Period  +90bps  Return on Invested CapitalFrom FY23 to FY26  $1.7B  Free Cash Flow1 Generation  Over 3-year Period 
 

 18  …AND ACCELERATED SHARE PRICE APPRECIATION  R-squared = .88  Source: S&P Global CapIQ; Share prices as of or nearest each fiscal year end. 
 

 19  INDUSTRY REVIEW  19 
 

 QSR INDUSTRY  20  PREPARED FOOD &DISPENSED BEVERAGES  PREPARED FOOD &DISPENSED BEVERAGES  OPERATINGCOSTS 
 

 21  THE EVOLVING QSR INDUSTRY  1  RESILIENT BUT VULNERABLE  Long track record of unit count and sales dollar growth but operate on thin profit margins  2  HEAVILY FRANCHISED  ~3/4ths of the restaurant industry is franchised, and company-owned store operating models are outperforming  4  SHIFTING  Consumption is shifting off-premise, and customers increasingly value discounts and rewards programs  3  PRESSURED  Operators are facing mounting pressures from increased labor costs, fixed costs and declining traffic  Pure play/franchised QSRs face multiple headwinds 
 

 Source: National Restaurant Association (NRA) and NRA’s Restaurant Operations Data Abstract 2025  22  QSR INDUSTRY HAS PROVEN RATABLE GROWTH BUT THIN MARGINS  Limited-Service Restaurant  Cost and Margin Structure  Total number of limited-service restaurants (thousands)   Food and beverage sales (billions) and limited-service restaurants  Food Costs  Labor Costs  Other Costs  Pre-tax Margin  2025  1 
 

 Sources: Top 1,500 Chain Restaurants U.S. location share by ownership via Technomic Ignite Company & Technomic Top 500   23  THE RESTAURANT INDUSTRY IS DOMINATED BY FRANCHISE OPERATING MODEL  US Chain Restaurant Ownership  Median Sales Growth Of Top 500 Chains   Company-Owned Outperforms  OPERATIONS  Company-Owned Advantages  Full control of menu, pricing/promotion, labor  Faster execution from ideation to implementation  Better consistency across the store base  Casey’s 100% company-owned and operated retail stores are advantaged against the QSR franchised model  ECONOMICS  No franchise or royalty fee  Optimize decisions for chain, not single store  Apply scale to enhance store-level performance  Non-Franchised 26%   Franchised 74%  2 
 

 EARNINGS PRESSURED  INFLATION INCREASES COSTS  RAISE MENU PRICES  TRAFFIC DECREASES   Accelerating Wages Driving Higher Menu Prices…  R-squared = .98  Cumulative % Change Indexed to 2000  Sources: U.S. Bureau of Labor Statistics (BLS), NRA’s State of the Restaurant Industry 2026  24  ACCELERATION OF COSTS ARE PRESSURING THIN MARGINS  … Pressuring Traffic and Earnings   PREPARED FOOD  OPERATINGCOSTS  Pure Play / Franchised QSRs Rely on Menu Price Increases to Offset Cost Pressures  Limited-Service Restaurant Profit Margins are   Down ~200 Bps Since 2019  41%  41%  59%  42%  3 
 

 As younger generations prefer off-premise,  CASEY’S IS POSITIONED TO BENEFIT   25  OFF-PREMISE RESTAURANT DEMAND IS GROWING RAPIDLY   Off-Premise Traffic is Growing   % share of total customer traffic  2019  2025  Full Service  Restaurants  Limited-Service  Restaurants  Off-premise  On-premise  Driven by Younger Customers   % of adults ordering takeout at least once a week  4  Sources: NRA State of the Restaurant Industry 2026 and NRA Restaurant Operations Data Abstract 2025 
 

 26  C-STORE INDUSTRY  GROCERY & GENERAL MERCHANDISE  OPERATINGCOSTS  GROCERY & GENERAL MERCHANDISE  FUEL 
 

 1  RESILIENT  The c-store industry has shown resiliency throughout economic cycles.  2  SHIFTING  The industry is shifting in response to declining categories (tobacco and fuel) and rising operating costs.  4  FRAGMENTED &  CONSOLIDATING  Smaller operators are challenged – further strengthening opportunities for consolidation.  3  SEPARATING  Stores with restaurant-quality food are leaders in the industry.   Scale matters now more than ever  THE EVOLVING CONVENIENCE STORE INDUSTRY  27 
 

 Convenience Store Industry Stores and Sales (US)  COVID-19 Pandemic  2008 Recession  Annual Fuel Gallons (billion)   Number of Convenience Stores (thousands)  Annual Inside Sales ($ billion)  28  THE CONVENIENCE STORE INDUSTRY HAS PROVEN RESILIENT  1  Sources: National Association of Convenience Stores (NACS), U.S. Department of Transportation, U.S. Federal Highway Administration 
 

 FY06-26 20 YR CAGR  29  CASEY’S HAS PROVEN RATABLE GROWTH  Casey’s Stores and Sales  Annual Fuel Gallons (million)   Number of Convenience Stores  Annual Inside Sales ($ million)  COVID-19 Pandemic  2008 Recession  +10%   Inside Sales  +6%   Fuel Gallons  +4%   Store Growth  1 
 

 OPERATINGCOSTS  PREPARED FOODS  GENERAL MERCHANDISE  FUEL  Sources: BLS, NACS  1 – “Cents per gallon”, or “CPG”, is defined as revenue less cost of goods sold exclusive of depreciation and amortization divided by fuel gallons sold.  30  C-STORE OPERATORS RELYING MORE ON HIGHER FUEL MARGINS  41%  16  cpg  41%  R-squared = .94  37  cpg  2  Many C-Stores Rely on Fuel CPG Increases to Offset Cost Pressures  …Pressuring Traffic and Earnings   Accelerating Wages Driving Higher Industry CPGs1…  EARNINGS PRESSURED   INFLATION INCREASES COSTS  TRAFFIC DECREASES  CIGARETTE SECULAR DECLINE  INCREASE FUEL PRICES 
 

 31  STORES WITH RESTAURANT-QUALITY FOOD ARE LEADERS IN THE INDUSTRY  EBITDA Outperformance   Average per store  ~2x  Advantaged business mix is driving outperformance   ~70% of NACS respondents are not profitable without fuel  Less Reliant on Cigarettes  Prepared Food Boosts Sales  % of total inside sales  % of total inside sales  ~+11 ppts  ~(5) ppts  3  Source: 2026 NACS State of the Industry survey submissions , “Marginal Operators” represent simple average of bottom seven deciles of the 2026 NACS State of the Industry survey submissions 
 

 CONSOLIDATION  FRAGMENTATION  Ownership Breakout (Number of Stores)  US Convenience Store Count1  # OF STORES  2025  2022  Unit Change  % Change  1-10  95,672  94,928  744  0.8%  11-50  9,038  9,047  (9)  (0.1)%  51-200  8,043  8,791  (748)  (8.5)%  201-500  5,412  5,747  (335)  (5.8)%  501+  33,810  31,661  2,149  6.8%  Total  151,975  150,174  1,801  1.2%  Over the past 10 years, Casey’s has acquired 736 stores… WITH 387 STORES IN JUST THE PAST 3 YEARS   Source: 2026 NACS State of the Industry  32  AS A RESULT, THE FRAGMENTED C-STORE INDUSTRY IS CONSOLIDATING  Smaller operators are strategic acquisition targets   4 
 

 33  CASEY’S ADVANTAGED POSITION  OPERATINGCOSTS  PREPARED FOOD &DISPENSED BEVERAGES  GROCERY & GENERAL MERCHANDISE  FUEL 
 

 Scale, 100% company owned and operated, rural Midwest footprint  Unique restaurant-quality foodservice offer  Robust private brand and center store offer  Sophisticated fuel capabilities  Far less reliant on fuel and cigarettes  34  CASEY’S HAS AN ADVANTAGED “CONVENIENCE QSR” FLYWHEEL  Casey’s “Convenience QSR” Profile  3. OPERATING LEVERAGE IMPROVES  4. EARNINGS GROW  1. REINVEST INTO VALUE PROPOSITION   2. TRAFFIC INCREASES  PREPARED FOOD &DISPENSED BEVERAGES  GROCERY & GENERAL MERCHANDISE  FUEL  OPERATINGCOSTS 
 

 Fuel   CPGs   40 39 39 43  3  …And Gallons Share From C-store Industry…  +10  CASEY’S ADVANTAGED FLYWHEEL IN MOTION (1/4)   35  4  …Driving EBITDA to Grow More than OpEx.  2  …And Taking Food Share From QSR Industry…  +14  (9)  PF&DB MARGIN  57% 59% 58% 59%  1  Casey’s Food Value Proposition Is Widening...  Sources: BLS, Circana, Oil Price Information Service (OPIS)  Note: Casey’s APSD PF&DB Traffic is defined as average per store day PF&DB transactions for all Casey’s stores 
 

 Fuel   CPGs   40 39 39 43  3  …And Gallons Share From C-store Industry…  +10  CASEY’S ADVANTAGED FLYWHEEL IN MOTION (2/4)   36  4  …Driving EBITDA to Grow More than OpEx.  (9)  PF&DB MARGIN  57% 59% 58% 59%  1  Casey’s Food Value Proposition Is Widening...  2  …And Taking Food Share From QSR Industry…  +14  Sources: BLS, Circana, OPIS  Note: Casey’s APSD PF&DB Traffic is defined as average per store day PF&DB transactions for all Casey’s stores 
 

 (9)  PF&DB MARGIN  57% 59% 58% 59%  1  Casey’s Food Value Proposition Is Widening...  2  …And Taking Food Share From QSR Industry…  +14  4  …Driving EBITDA to Grow More than OpEx.  Fuel   CPGs   40 39 39 43  3  …And Gallons Share From C-store Industry…  +10  CASEY’S ADVANTAGED FLYWHEEL IN MOTION (3/4)   37  Sources: BLS, Circana, OPIS  Note: Casey’s APSD PF&DB Traffic is defined as average per store day PF&DB transactions for all Casey’s stores 
 

 Fuel   CPGs   40 39 39 43  3  …And Gallons Share From C-store Industry…  +10  CASEY’S ADVANTAGED FLYWHEEL IN MOTION (4/4)   38  (9)  PF&DB MARGIN  57% 59% 58% 59%  1  Casey’s Food Value Proposition Is Widening...  2  …And Taking Food Share From QSR Industry…  +14  4  …Driving EBITDA to Grow More than OpEx.  Sources: BLS, Circana, OPIS  Note: Casey’s APSD PF&DB Traffic is defined as average per store day PF&DB transactions for all Casey’s stores 
 

 Fuel   CPGs   40 39 39 43  3  …And Gallons Share From C-store Industry…  +10  CASEY’S ADVANTAGED FLYWHEEL IN MOTION   39  (9)  PF&DB MARGIN  57% 59% 58% 59%  1  Casey’s Food Value Proposition Is Widening...  2  …And Taking Food Share From QSR Industry…  +14  4  …Driving EBITDA to Grow More than OpEx.  Sources: BLS, Circana, OPIS  Note: Casey’s APSD PF&DB Traffic is defined as average per store day PF&DB transactions for all Casey’s stores 
 

 ENTERING THE NEXT 3-YEAR GROWTH STRATEGY  40  From A Position Of Strength  The benefits of a ~3,000 (scale) store 100% company owned and operated retail chain with a self-distributed, rural footprint, “Convenience QSR” operating model have never been greater 
 

 1 – For the FY27-FY29 Plan: Top quintile defined as all S&P 500 and 400 retail and restaurant, excluding retail REIT, constituents, who have grown EBITDA 8% (CAGR) or greater over a 1-year, 5-year, and 10-year period as of calendar year end 2025. Source: S&P Global Capital IQ.  PROVEN STRATEGY DRIVING CONTINUED PROFITABLE GROWTH  41  Deliver top quintile1 EBITDA growth of 8-10%  ACCELERATEFOOD AND BEVERAGE  SCALABLE Foundation  Team Member Value Proposition  GROW THE NUMBER OF UNITS  ENHANCE   OPERATIONALEFFICIENCY  THE GUEST 
 

 20 of 53met criteria   Met criteria  Did not meet criteria  42  CASEY’S IS COMPOUNDING EBITDA GROWTH LIKE FEW OTHERS  1 YEAR  1 & 5 YEAR  1, 5, & 10 YEAR  Retailers and Restaurants with   8% EBITDA CAGR or Greater over Defined Time Period   10 of 53 met criteria   7 of 53 met criteria   Source: S&P Global Capital IQ; includes S&P 500 and 400 retailers and restaurants, excluding retail REITs as of calendar year end 2025. 
 

 43  CASEY’S IS A CATEGORY OF ONE  QUICK-SERVICE RESTAURANT  CONVENIENCE STORE 
 

 PROVEN FINANCIAL EXECUTION  STEVE BRAMLAGE   CHIEF FINANCIAL OFFICER  Deliver top quintile EBITDA growth of 8-10%  ACCELERATEFOOD AND BEVERAGE  SCALABLE Foundation  Team Member Value Proposition  THE GUEST  GROW THE NUMBER OF UNITS  ENHANCE   OPERATIONALEFFICIENCY   44 
 

 45  EXCEEDED ALL 3-YEAR TARGETS   SAME-STORE SALES  RESULTS  GUIDANCE  FREE CASH FLOW  FY24-FY26  EBITDA % GROWTH  STORE GROWTH  GROSS PROFIT MARGIN   OPERATIONAL EFFICIENCIES  8%-10% CAGR  350+ stores  via new builds & acquisitions   ~$1.25B  ~$1.68B  INSIDE SALES GROWTH  mid single digit  FUEL GALLON GROWTH  flat to low single digit  INSIDE STORE MARGIN EXPANSION  FUEL MARGIN mid-30s CPG   10%   CAGR  <  16% CAGR   EBITDA   growth   OpEx   growth  <  16%   CAGR  504  STORES  4%  AVG  1%  AVG  40  CPG AVG  +230  BPS 
 

 Note: A reconciliation of free cash flow is included in the Appendix.  46  FREE CASH FLOW HAS ACCELERATED…  $217M  $1.23B  $1.68B 
 

 AVAILABLE LIQUIDITY  $1.4B  Provides significant flexibility  LOW-COST DEBT  4.3%  Weighted average interest rate on debt  1 – Debt | EBITDA, calculated in accordance with our credit facilities, is consolidated total debt as defined therein (including cash netting of up to $150 million) divided by consolidated total EBITDA as defined therein.   47  …STRENGTHENING OUR BALANCE SHEET, ADDING LIQUIDITY  DEBT│EBITDA RATIO  1.5x  Long-term target ~2.0x  1 
 

 48  NEW 3-YEAR GROWTH PLAN CONTINUES STRONG MOMENTUM…   EBITDA % GROWTH  STORE GROWTH  SAME-STORE SALES  GROSS PROFIT MARGIN %  OPERATIONAL EFFICIENCIES  FREE CASH FLOW  8%-10%CAGR  At least 400 stores   via new builds & acquisitions  ~$2B  Inside store margin expansion  Fuel margin: mid 40s CPG1  FY27-FY29 GUIDANCE  EBITDA growth  OpEx   growth  <  Inside sales: mid single digit increase  Fuel gallons: ~flat  PROVEN FINANCIAL EXECUTION  1 – Included for modeling purposes only 
 

 49  …FUELED BY A PROVEN EBITDA GROWTH ALGORITHM  Small deal M&A  New builds  Disciplined approach to larger M&A  Capture expanded M&A synergies  ACCELERATINGUNIT GROWTH  OPERATIONAL EFFICIENCIES  Store simplification  Supply chain efficiency  Kitchen optimization  Centralized scalable support model  Enhanced fuel capabilities  Joint business planning  Centralized procurement  Private brands & mix management  GROSS MARGINEXPANSION  Relevant assortment  Culinary innovation  Strong value proposition  Omnichannel marketing  SAME-STORE SALES GROWTH  FUNDS ACCELERATING GROWTH  EXISTING BUSINESS  UNIT GROWTH  4%+  4%+ 
 

 50  OUR BALANCED CAPITAL ALLOCATION PRIORITIZES LONG-TERM SHAREHOLDER VALUE…  1  DRIVE UNIT GROWTH  First priority is EBITDA and ROIC accretive unit growth  Balance of new store builds and M&A  2  MAINTAIN STRONG BALANCE SHEET  3  TEND TO THE DIVIDEND  4  REPURCHASE SHARES  Repayment of debt when above ~2.0x Debt|EBITDA1  Ample borrowing capacity for the right deal  27 consecutive years of dividend increases  Grow dividend consistent with medium-term EBITDA growth  Target payout ratio of 15-20%  Repurchased approximately $200 million in FY26  $1 billion new authorization  1 – Debt | EBITDA, calculated in accordance with our credit facilities, is consolidated total debt as defined therein (including cash netting of up to $150 million) divided by consolidated total EBITDA as defined therein.  
 

 A reconciliation of ROIC is included in the Appendix.  51  …GENERATING RETURNS GREATER THAN OUR COST OF CAPITAL  Double-digit ROIC expectation  Expectation of 15% return by steady state in year 5-6  ACCELERATING VALUE CREATION  
 

 EXECUTING ON THE NEXT PHASE OF GROWTH  52  Long and Consistent Track Record of Compounding Performance  Backed by a Strong Balance Sheet with Ample Liquidity  AttractiveGrowth Outlook  Capital Allocation Strategy that Prioritizes Driving Long-Term Shareholder Value  DELIVERING TOP QUINTILE EBITDA GROWTH OF 8-10%  $  KEY MESSAGES   PROVEN FINANCIAL EXECUTION 
 

 THE GUEST  TOM BRENNAN  CHIEF MERCHANDISING OFFICER  Deliver top quintile EBITDA growth of 8-10%  SCALABLE Foundation  Team Member Value Proposition  THE GUEST  ACCELERATEFOOD AND BEVERAGE  GROW THE NUMBER OF UNITS  ENHANCE   OPERATIONALEFFICIENCY   53 
 

 54  Omni-Channel   Marketing   The Guest   Category Management   TODAY’S KEY MESSAGES  Our strong wallet share and favorable guest demographics support compounding growth.   Our loyal guests are our focus, and our business model drives coverage across all dayparts.  Vendor partnerships plus company owned and operated stores and supply chain unlock exclusives and product launches that bring new guests.   Loyalty and hyper-personalization is a structural advantage, increasing traffic and basket size.  Nimble category management reallocates space and capital to meet evolving guest needs. 
 

 CASEY’S GUEST MIX  1 – Based on Casey’s Rewards and Circana data  2 – Based on demographics data from the US Census Bureau for the 19 states where Casey’s operates   55  THE CASEY’S GUEST  Casey’s guest mix supports long-term compounding with growing engagement from Gen Z  RURAL BUT WITH STRONG INCOME  ~70% of Casey’s Rewards guests earn > $50k per year  LOYAL  Casey’s Rewards guests on average frequented the store and spent 4x more than non-rewards members  SATISFIED  FY26 ended with guest overall satisfaction at an all-time high  1  2 
 

 G  56  THE GUEST IS OUR FOCUS OF WHAT WE DO  U  E  S  T  GUESTS WANT…  Great Taste  Uncompromising Quality & Value  Easy & Convenient  Satisfying Experience  Tailored Assortments  Handcrafted Food And Beverage  Proprietary Innovation  Incredible Flavor  Affordable And Abundant  Real Kitchens, Quality Ingredients  Frictionless Experience  Relevant Locations  Clean And Orderly  Fast And Friendly  Consistently Reliable  Safe  Optimized Offer  Always Available  Regionally Relevant  First, Best And Only 
 

 57  OUR “CONVENIENCE QSR” OPERATING MODEL DRIVESCOVERAGE ACROSS ALL DAYPARTS  Start My Day   Quick Lunch  Need a Pick Me Up  Family Dinner  Fill in Trip  Alcohol Run  Nicotine Restock  Lottery  Fuel Stop  TRADITIONAL QSR  TRADITIONAL C-STORES  5am – 10:59am  11am – 1:59pm  After 11am  5pm or Later  All Day  2pm – 11:59pm  All Day   All Day   All Day   TRIP MISSION  CASEY’S  Inside guest visitsdo not include a fuel purchase  70%   PF&DB sales ($) in dinner daypart  31%   3YR CAGR in average per store day energy drink sales ($)  16%   Note: 3YR CAGR represents performance from FY23 to FY26. 
 

 58  CATEGORY MANAGEMENT STRATEGY: RAPIDLY SCALING AND ADAPTING TO DEMAND   Focused capital & resource allocation  Faster scaling of winning categories  Quicker exits from underperformers  Improving returns on invested capital  Destination / Core Focus   Drive Traffic & Market Share  Basket Builders  Increase Basket & Frequency  Margin Enhancers  Improve Overall Returns  Laggards   Reduce Capital and  Space Allocation  Optimize/Exit  Maintain  Grow  Aggressively Expand  CATEGORY ECOSYSTEM   Marketing Focus  Capital & Resource Allocation  Future Growth Optionality  Emerging Opportunities  
 

 3 Doors | 24 Shelves   Energy space allocation  Note: Space allocation example represents most common store planogram. 3YR CAGRs represent performance from FY23 to FY26.  59  CASE STUDY | EXPANDED COLD VAULT SPACE TO MEET ACCELERATING ENERGY DRINK DEMAND FROM OUR GUESTS  FY23  FY26  2 Doors | 17 Shelves  2.1 Doors  17 Shelves  +16%  Average Per Store Day Sales ($)   +14%  Average Per Store Day Sales (Units)   3YR CAGR 
 

 60  EXCLUSIVE AND NEW MARKET LAUNCHES ARE DRIVING INCREMENTAL TRAFFIC  28% of new buyers had never purchased an energy drink at Casey’s  Joint business planning, vertical integration and company owned and operated stores at scale drives opportunities for exclusive and new product launches  Number of Casey’s Exclusive and Lead Market Launch Items 
 

 61  OUR ROBUST OMNI-CHANNEL MARKETING IS A STRATEGIC DIFFERENTIATOR  Social Media   Internal team partners with external agency on Social Strategy, Influencer Partnerships, and Content Creation  Loyalty  Manages day to day operations of Casey’s Rewards and partner with merchant teams on offer strategy  Paid Media & Analytics  Internal team partners with external agency to purchase and execute all broadcast, out of home and digital advertising  Digital Merchandising & Delivery  Manages owned digital properties, e-commerce, SEO, local listings and delivery   Caseys Access/Owned Channel Messaging  Manages Casey’s Access Retail Media Network and executes all owned channel communication   Communications & PR  Internal and external teams develop and shape company narrative, earned media strategy, communications, and public relations initiatives  Brand Marketing & Marketing Operations  Internal and external teams produce and traffic all creative inclusive of commercials, digital ads and in-store signage 
 

 OUR OMNI-CHANNEL FLYWHEEL DRIVES TRAFFIC AND SALES  62  Invest In The Digital Experience  Enable personalized experiences at scale  1  2  Accelerate Casey’s Rewards Loyalty Participation  New features to provide more guest value and drive loyalty  Grow E-commerce & Delivery  Elevate e-commerce and delivery experiences to increase transactions  Scale Casey’s Access Retail Media Network  Become a preferred performance-led retail media network, reinvesting proceeds back into digital experience   3  SCALE ACCESS MEDIA NETWORK  INVEST IN DIGITAL EXPERIENCE  ACCELERATE LOYALTY  GROW E-COMMERCE  2  1  3  Reinvest proceeds from Access Media Network   $ 
 

 Rewrote all guest facing experiences in web and app  Enabled deeper personalization at scale  Modernized frontend tech stack reduces time to market for future enhancements  Continued simplification of user experiences   Expand rewards functionality creating additional ways to deliver personalized value  Invest in backend systems to ensure stability as we grow  63  INVESTMENT IN DIGITAL EXPERIENCE IS REMOVING FRICTION AND ENABLING HYPER-PERSONALIZATION  Recent Accomplishments  Future Roadmap  Upgraded Experience  Single click into the cart  Legacy Experience  Numerous clicks into the cart 
 

 64  CASE STUDY | DATA-DRIVEN PERSONALIZED PIZZA JOURNEY AT SCALE  Marketing automation delivers differentiated messages in real time as guests move through segments  Guest Segmentation Refreshed Multiple Times a Day   Segment  Recent Active   Recently Lapsed   Extended Lapsed   Objective  PREVENT GUEST CHURN   REVIVE LAPSED GUESTS   BRING BACK LOST GUESTS   INCREASE ORDER FREQUENCY 
 

 Continued investment in campaigns structured to accelerate enrollments  Expanded offers and fuel savings driving enrollment  ~11M members, +29% enrollments in FY26  65  HIGH-RETURN LOYALTY INVESTMENTS ARE ACCELERATING MEMBER GROWTH AND ENGAGEMENT…  Expand rewards functionality to create new ways to save  Personalized rewards drive cross-category trial  Additional gamification capabilities boosts engagement and usage  +140% 90-day active members since FY23 
 

 DIGITAL SALES  DELIVERY  Track record of converting guests from offline ordering to digital channels  Modernized experience reduced clicks to order a pizza from 11 to 3  Continuing to expand digital assortment to include full liquor, wine, and nicotine alternative assortment where permitted  Marketplace pricing and promotion investments providing value, attracting new guests to Casey’s  Expanded delivery to over 2,000 locations  Delivery orders up 30% in FY26  66  …WHILE GROWING OUR E-COMMERCE AND DELIVERY BUSINESSES… 
 

 67  …DRIVING INCREASED INVESTMENT IN CASEY’S ACCESS FROM OUR VENDOR PARTNERS  Traditional CPG Activations  Food Forward Activations  DRIVING IN-STORE AND DIGITAL SALES   Brands continuing to invest in traditional retail media activations   Promotion of exclusive products  Food forward activations difficult to replicate by convenience or QSR competitors  Expanding additional in store touch points: digital screens, fuel pumps, in-store audio, etc.   Reinvestment of Casey’s Access earnings has increased corporate media budget by over 70% since FY23 
 

 68  OMNI-CHANNEL STRATEGY IS ACCELERATING DIGITAL SALES  Our guest-centric category management, marketing, and digital are driving growth  MOBILE APP +16% 3YR CAGR  ALL DIGITAL CHANNELS+18% 3YR CAGR  DOORDASH  MARKETPLACE+48% YoY  Digital Order Same-Store Sales  Digital vs Call-in Mix  FY23  FY26  Digital sales  Offline sales 
 

 Deliver top quintile EBITDA growth of 8-10%  SCALABLE Foundation  Team Member Value Proposition  ACCELERATEFOOD AND BEVERAGE  GROW THE NUMBER OF UNITS  ENHANCE   OPERATIONALEFFICIENCY   69  ACCELERATE FOOD AND BEVERAGE  BRAD HAGA  SVP, PREPARED FOOD & DISPENSED BEVERAGE  THE GUEST 
 

 70  ACCELERATE FOOD AND BEVERAGE  Wings is the next platform, and it is winning us another occasion   Other food and beverage items are now at a Casey’s level of quality  Pizza has been successful for a long-time, yet still innovating to great results  TODAY’S KEY MESSAGES  Casey’s branded products are high quality and deliver exceptional value to guests 
 

 OUR MENU HAS GROWN BEYOND PIZZA  WINNING EVERY OCCASION  71  ACCELERATE FOOD AND BEVERAGE 
 

 1 – Represents average per store day sales dollars during FY26.   2 – Represents average per store day units during FY26.  72  PIZZA IS THE CROWN JEWEL, AND WE ARE INNOVATING AND EXECUTING AT A HIGH-LEVEL…  Twisted Pepperoni  Ultimate Meat  Four Cheese  Sweet Heat  BBQ Brisket  Jalapeno Popper  Chorizo Breakfast  Bacon Cheeseburger   1  SPECIALTY INNOVATION  of Whole Pie Growth1  coming from specialty pizzas  80%  Pizza Certification  Asset Improvements  Kitchen Simplification  3  CONSISTENT EXECUTION  $10 Any Large  40% off during College Football  40% off during College Basketball Tournament  Thin Crust Thursday  2  VALUE  Growth on Saturdays2  during college football  +43%  Team Members Certified  15k+ 
 

 Casey’s Is Outperforming Pizza QSR Competition  1 – Source: Public company filings of 3 publicly traded Pizza QSRs. Results represent simple average of most recent 4 quarters nearest Casey’s fiscal year ends.  2 – Based on Casey’s internal research using Casey’s PB&DB revenue, public pizza peer revenues from company filings, and Chain XY for number of store locations.  73  … RESULTING IN STRONG PERFORMANCE AND SHARE GAINS  Casey’s vs. Pizza QSR Peers1 same-store sales  ~60%  of Casey’s stores in DMAs with #1 pizza market share2  ~40%  of Casey’s stores growing whole pie units double-digits % 
 

 Note: 3YR CAGRs represent average per store day sales dollars from FY23 to FY26.  74  WE HAVE HIGH-QUALITY AND ABUNDANT PRODUCTS OUTSIDE OF PIZZA   Quality Offering  Innovative LTO's: Breakfast & Lunch  BBQ Bacon Cheeseburger Sliders  Ultimate Waffle Sandwich  1  HOT SANDWICHES  LUNCH SANDWICHES   3YR CAGR   +26%   Premium Focus: Cookies and Pastries  National brand partnerships: Reese’s, Snickers, Hershey  Quality Improvements across Menu  Started with Cookies  Now onto Donuts  2  BAKERY  BAKERY GROWTH  3YR CAGR   +8%   “Darn Good Coffee” Launch  “Frostbite” by Casey’s  Optimize assets: fountain, frozen carbonated beverages  3  DISPENSED BEVERAGES  DISPENSED GROWTH   3YR CAGR   +5%  
 

 Video:  Casey’s Innovation Process  75 
 

 Scale to remainder of Casey’s stores over next 2 years  76  WE ARE WINNING ANOTHER OCCASION WITH WINGS  Low competition = high opportunity  Wings as a meal  Wings with pizza  ~50% of Casey’s stores do not have a national pizza or wing chain competitor within 5 miles  Guests with a wings-only basket have increased their prepared food order frequency by 30% since their first wings order  Guest who add wings to their pizza purchase have 50% larger baskets  Plan: Scale to remainder of Casey’s over next two fiscal years 
 

 77  THE CASEY’S BRAND IS HIGH-QUALITY AT A GREAT VALUE FOR GUESTS  Growing SKU Count  ~20% Growth In Past 3 Years  in the Grocery & General   Merchandise Categories  Scaling Across The Store  Participate In  ~50%  of Grocery & General Merchandise Categories  Meaningful Contributions  Total Inside Sales  Total Inside Gross Profit  National brands  Casey’s brand:PF&DB  Casey’s brand:G&GM 
 

 HOW CASEY’S BRANDED PRODUCTS WIN  PF&DB Best Practices  PRODUCT  Culinary Resources  Guest Research  Quality Reviews  Quality Ingredients  Redefining Packaging Strategy  Clearly Articulate Brand Messaging  BRAND  Appropriate Label Callouts/Claims  Label Redesigns  Aggressive Retail Pricing  VALUE  Easy Math Principles  Volume Driving Promotions  78 
 

 OUR PROVEN MERCHANDISING STRATEGY IS TAKING SHARE ACROSS THE QSR AND CONVENIENCE INDUSTRIES  79  PF&DB Traffic  (1%)  13%  1 – Source: Circana  2 – Source: Public company filings of 13 publicly traded QSRs and 3 publicly traded Pizza QSRs. Results represent simple average of most recent 4 quarters nearest Casey’s fiscal year ends.  Note: Casey’s APSD PF&DB Traffic is defined as average per store day PF&DB transactions for all Casey’s stores  PF&DB Sales ($)  4%  (3%)  16%  2  2  1 
 

 80  GROW THE NUMBER OF UNITS  ENA WILLIAMS  CHIEF OPERATING OFFICER  Deliver top quintile EBITDA growth of 8-10%  SCALABLE Foundation  Team Member Value Proposition  THE GUEST  ACCELERATEFOOD AND BEVERAGE  GROW THE NUMBER OF UNITS  ENHANCE   OPERATIONALEFFICIENCY  
 

 Significant white space opportunity supports long runway of future growth  3  Dual-engine approach delivers consistent unit growth at highly attractive economics  2  Long track record of ratable unit growth  1  KEY MESSAGES  81 
 

 82  LONG TRACK RECORD OF RATABLE UNIT GROWTH  Actual Growth  LAST 3 YEARS  Projected Growth  NEXT 3 YEARS  Number of Stores by Fiscal Year  Acquisitions  New Builds   Ending Store Count  400+   IN 3 YEARS  FY27 – FY29  Actual Growth  PREVIOUS 3 YEARS  504 stores  354 stores 
 

 1 – Represents all-in investment including acquisition purchase price, rebranding, and remodel  2 – Based on seller-provided trailing 12 months (TTM) EBITDA prior to transaction and pre-Casey’s synergies   83  DUAL-ENGINE UNIT GROWTH: DISCIPLINED SMALL DEAL M&A  Average Single Site Investment  $4.5M1  $5.5M  New build-equivalent returns at below replacement cost  <10x purchase price multiples2 significantly lower than Casey’s trading multiple driving low-risk value creation  Typical synergies 30% - 50% of seller’s TTM EBITDA2  Prepared foods and private brands  Self-distribution  Leverage scale  Advantages  Highly fragmented convenience store market provides long runway for unit growth at attractive economics  1  2  3 
 

 84  CASE STUDY | SINGLE STORE ACQUISITIONS  CASEY’S M&A STRATEGY IS A DIFFERENTIATED GROWTH LEVER THAT ACCELERATES UNIT AND EARNINGS GROWTH  Seller before transaction   Conversion Playbook Success  Acquired at attractive economics below replacement cost  Converted to full Casey’s offering with rebranding and remodel   Meaningful inside performance uplift driven by introduction of proprietary prepared food program  Attractive return profile delivers mid-teen returns by year three  Scalable playbook with significant runway in a highly fragmented convenience store industry  Casey’s post-remodel  +10%  vs. pre-remodel  +75%  vs. pre-remodel  Walnut, IL  BEFORE  AFTER  Note: Seller before transaction represents most recent seller provided financials before transaction. Casey’s post-remodel represents trailing 12 months performance as of April 30, 2026.  
 

 Data-Driven New Store Growth   Note: New builds represent TTM (as of April 30, 2026) performance for stores built between FY21 and FY23. Existing stores represents TTM performance (as of April 30, 2026) for all remaining Casey’s branded stores opened prior to FY21.   85  DUAL-ENGINE UNIT GROWTH: NEW BUILDS  Existing Stores  New Builds vs Existing Store Performance  New Builds   1  Prioritize highest impact marketsusing robust network planning  2  Select best sitesidentified by sophisticated data models  3  Optimize formatsfor populationand traffic  ~+98%  ~+70%  ~+22% 
 

 SIGNIFICANT WHITE SPACE TO GROW CASEY’S STORE COUNT   86  Note: Boundaries represent 500 truck driving miles from our three distribution centers.  Existing store network efficiently serviced primarily by three company-owned distribution centers   Existing Casey’s stores  Distribution Centers 
 

 SIGNIFICANT WHITE SPACE TO GROW CASEY’S STORE COUNT   87  Note: Boundaries represent 500 truck driving miles from our three distribution centers. Dots are illustrative of white space growth opportunities.  White space inside existing distribution footprint  ~75% of towns up to 20,000 people within existing DC footprint do NOT have a Casey’s  Towns < 20,000 population without Casey’s inside DC footprint  Distribution Centers 
 

 SIGNIFICANT WHITE SPACE TO GROW CASEY’S STORE COUNT   88  Note: Dots are illustrative of white space growth opportunities.  New third-party distribution capability adds even more whitespace for disciplined pursuit of highly strategic acquisitions  Towns < 20,000 population without Casey’s inside DC footprint  Towns < 20,000 population without Casey’s outside DC footprint 
 

 Video:  Built the Casey’s Way  89 
 

 90  ENHANCE OPERATIONAL EFFICIENCY  ENA WILLIAMS  CHIEF OPERATING OFFICER  Deliver top quintile EBITDA growth of 8-10%  ACCELERATEFOOD AND BEVERAGE  SCALABLE Foundation  Team Member Value Proposition  GROW THE NUMBER OF UNITS  ENHANCE   OPERATIONALEFFICIENCY   THE GUEST 
 

 Kitchen transformation to make kitchens more efficient to support accelerating food and beverages.  3  Store CI disciplines are scaling enterprise-wide with robust pipeline of identified projects.  2  Store continuous improvement (CI) is enhancing operating leverage.  1  KEY MESSAGES  91 
 

 92  HIGHLIGHTING OUR SUCCESSES FROM STORE CONTINUOUS IMPROVEMENT  GOALS FROM 2023 INVESTOR DAY  OBJECTIVES  Continue making the store more efficient by simplifying operations at scale to drive significant cost savings   Voice of our stores   Streamline communications  Eliminate complexity   Labor management   OpEx % growth < EBITDA % growth  Completed ~50 process improvements focused on reducing non-value-added complexity  Smart Safe  Label maker  Outsource laundry  5% cumulative reduction in same-store labor hours  ~70ppt reduction in store team member turnover  Guest OSAT and team member engagement reached all-time highs  ACTIONS TAKEN  RESULTS  FY26 OpEx  Store Employee OpEx 
 

 EXPANDING FROM STORE TO ENTERPRISE CONTINUOUS IMPROVEMENT  FY26 Operating Expenses  Store Employee OpEx  All Other OpEx  43%  57%  Next 3YR Objective  Create capacity for accelerating food and beverage sales without 1:1 OpEx increase  Workstreams  Simplify store employee operations  Prepared Food packaging optimization  Digitize cigarette audits  Windshield washer fluid automatic refill  Transform our kitchens  >30 projects identified  Next 3YR Objective  Enhance operating leverage to grow store count without 1:1 OpEx increase  Workstreams  Optimize store non-employee OpEx  >150 projects identified  Streamline merchandising & supply chain processes  Automate more admin & transactional work  Reassess how work gets done  OpEx % Growth < EBITDA % Growth  93 
 

 94  TRANSFORM OUR KITCHENS:  SIMPLIFICATION IS ESSENTIAL TO NEW PLATFORM GROWTH   RIGHT EQUIPMENT  EFFICIENTLAYOUTS  ENHANCE SYSTEMS  Equip our kitchens with the right tools to efficiently accelerate food and beverage  Make the kitchen more efficient by putting the right equipment in the right place  Use our robust tech stack to optimize ordering, planning, and timing 
 

 95  SCALABLE FOUNDATION  ENA WILLIAMS  CHIEF OPERATING OFFICER  Deliver top quintileEBITDA growth of 8-10%  SCALABLE Foundation  Team Member Value Proposition  GROW THE NUMBER OF UNITS  ENHANCE   OPERATIONALEFFICIENCY   ACCELERATEFOOD AND BEVERAGE  THE GUEST 
 

 96  Fuel is both a business unit and a facilitator of optionality across the business.  3  AI is a tool in our toolbox already being used.  2  Existing centralized foundation enables store growth without linear cost growth.  1  KEY MESSAGES  SCALABLE FOUNDATION 
 

 97  CENTRALIZED, SCALABLE FOUNDATION SUPPORTS GROWING UNIT COUNT   INCREASING OPERATING LEVERAGE / PROFITABILITY   Fuel  Field Leadership   Supply Chain   Store Support Center   STORE COUNT  SCALABLE Foundation  Requires less incremental investment as stores are added, improving efficiency and profitability 
 

 98  TARGETED USE OF AI TO INCREASE OPERATING LEVERAGE AND PROFITABILITY  AI as a Developer Assistant  Improve standards, replace tech debt and increase throughput  Resilient and Agile Technology  AI in Support of Enterprise Continuous Improvement  Prioritize opportunities, remove friction and implement solutions   Enhance Productivity  AI-enabled insights for decision making  Faster, clearer and more consistent insights generation  Actionable Insights  AI in Action  Guest hyper-personalization  1  Real estate site selection  2  Demand forecasting and planning  3  Actionable store insights  4  Fuel procurement optimization  5 
 

 Improve store in-stock levels  99  CASE STUDY 1 | AI-ENABLED DEMAND FORECASTING AND PLANNING  Goals  Distribution Center replenishment  Store replenishment – center store  COMPLETED  NEXT STEPS  From: fragmented, manual replenishment model  To: fully integrated, forecast-driven operating platform  Simplify store ordering process  Reduce working capital  Reduce material handling costs  Outcomes  The availability of forward-looking data is transforming our supply chain from reacting to orchestrating  550  94%  33%  4%  Store replenishment – food ingredients  Direct to store delivery suppliers  3rd party distribution partners  bps improvement in merchandise availability  reduction in store order lines manually adjusted  reduction in warehouse inventory dollars  decrease in average order size  Increase DC capacity  ~300  more stores from existing facilities 
 

 100  CASE STUDY 2 | AI-ENABLED ACTIONABLE STORE INSIGHTS  Opportunity: Field Leadership is spending time and energy identifying stores to visit throughout the week  synthesizes multiple pieces of data into a digestible deliverable for Field Leadership, in a fraction of the time  AI TOOL  OUTCOME   Reduced field leadership time spent on weekly planning  more impactful site visits for better action planning and problem solving  
 

 Fuel  NATHANIEL DODDRIDGE  SVP, FUELS  SCALABLE FOUNDATION  101 
 

 102  A RESILIENT, INTEGRATED FUEL SUPPLY CHAIN FOUNDATION  1  Robust supply contracting with advantaged rack supply to optimize procurement cost and flexibility  2  Self-supply capability, supported by risk management, generating additional optionality and value  3  Proprietary transportation fleet and logistics coupled with terminal and midstream access; including Waco terminal asset  Lower cost of gallons procured  More resilience with volatility  Benefits scale with growth  Results-to-date  SUPPLY  SELF-SUPPLY AND RISK MANAGEMENT  PHYSICAL NETWORK  FUEL  OPERATINGCOSTS 
 

 3,515  2,672  103  FROM CAPABILITY TO COMPOUNDING GROWTH  Advantaged cost driven by procurement capabilities  Transportation network allows for flexibility and value generation  Self-supply unlocks another value driver and adds flexibility  PROCUREMENT & TRANSPORTATION  Strategic pricing optimizes market positioning  Consistent value proposition  Allows for third-party marketing relationships  RETAIL PRICING & PROGRAMS  More stores, more gallons, more scale benefits  B2B opportunities: fleet, dealer, and wholesale  Fuel integration is typically   an M&A synergy  SCALE  Capabilities are amplified with scale, driving ratable total gallon growth and asset utilization  Total Gallons Sold  In Millions  +32%  ~2B gallons   delivered by Casey’s fleet,  +20% YoY  ~370  stores with high speed   diesel fuel lanes  ~275  dealer and commercial   customers 
 

 Over the next three years, we plan to further leverage our scale and capabilities to help deliver on our winning fuel strategy   FUEL AS PART OF THE SCALABLE FOUNDATION: NEXT THREE YEARS  SCALABLE FOUNDATION  NEXT 3-YEAR FOCUS AREAS  OUR PLAN TO GET THERE  Optimize supply economics, pricing strategy and execution across the portfolio  OPTIMIZE THE PORTFOLIO  SCALE PHYSICAL SUPPLY CHAIN ADVANTAGE  INTEGRATION BENEFIT  GROW TOTAL GALLONS RATABLY WITH DISCIPLINE  Expand throughput, transportation logistics productivity, and network optionality resulting in lower delivered cost  Refine the repeatable and accretive fuel integration process, enhancing synergy capture   Expand fleet, dealer, and wholesale B2B engines to improve asset utilization, compounding scale benefits  104 
 

 x  FUEL AS PART OF THE SCALABLE FOUNDATION  KEY TAKEAWAYS  The foundation is in place and proven successful driving performance, but evolving  Fuel capabilities enable favorable pricing and procurement  Growth amplifies scale benefits, driving returns  FUEL IS AN ENGINE FOR VALUE CREATION  SCALABLE FOUNDATION  $  105 
 

 106  TEAM MEMBER VALUE PROPOSITION  CHAD FRAZELL  CHIEF HUMAN RESOURCES OFFICER  Deliver top quintile EBITDA growth of 8-10%  ACCELERATEFOOD AND BEVERAGE  SCALABLE Foundation  Team Member Value Proposition  THE GUEST  GROW THE NUMBER OF UNITS  ENHANCE   OPERATIONALEFFICIENCY  
 

 107  TMVP IS FOUNDATIONAL TO SUSTAINING EXCELLENCE  GROW TEAM MEMBER ENGAGEMENT  Develop deeper insights to sustain or improve engagement and commitment  Elevate and modernize the recognition culture  LIVE  CASEY’S CARES  SUPPORT  TOTAL WELLBEING  PROVIDE CAREER GROWTH  Embed culture of continuous improvement  Continued focus on simplification  Provide meaningful benefits while controlling costs  Communication campaigns that drive engagement in total rewards offer  Strengthen talent management practices  Hyper-personalized, user-generated and locally delivered leader development 
 

 RESULTS  75%  GUEST OVERALL SATISFACTION  (All-time High)  5%  FEWER HOURS  3-year cumulative same-store labor hours  70ppt  LOWER TURNOVER  in store team members from FY24 to FY26   80%+  HIGHER ENGAGEMENT   team member scores all 3 years   108  DELIVERING POSITIVE RESULTS FOR ALL STAKEHOLDERS  WHAT WE ACCOMPLISHED  Centralized hiring  Removed non-value-added tasks  Streamlined processes  Digitized store experiences  Established store, driver, and service tech advisory boards  Added kitchen manager bonus program  New and enhanced leader development programs  Store, district, and regional leader pay investments 
 

 109  STRONG LEADERSHIP PIPELINE SUPPORTSFUTURE STORE GROWTH  STORE MANAGER  KITCHEN MANAGER  CENTER STORE MANAGER  STORE TEAM MEMBER  4  3  2  1  Centralized Hiring   Leaders can focus on the job and quality of hires improve  District Manager in Training Program   Equips leaders to coach and develop the bench  Role Clarity   Clear definitions for advancement 
 

 110  PROVIDE CAREER GROWTH  Extended Leadership Team  INTENTIONAL MOVES equipping our future leaders  STRONG EXTERNAL PARTNERS delivering outstanding training and leadership  GREAT TENURE resulting in a dedicated and motivated leadership team  
 

 CULTURE  COMPENSATION  Casey’s CARES &Engagement  TALENT MANAGEMENT & DEVELOPMENT  Career Growth  Total Wellbeing  111  BUILDING THE TALENT MACHINE 
 

 112  Clear competitive advantages, including unique rural footprint, restaurant-quality prepared food, vertical integration, 100% company owned and operated retail stores, and consolidated scale  High quality products at a great value help grow loyal guest base, supported by ~11 million Casey’s Rewards members  Substantial whitespace opportunity with proven ability to grow units via our dual-engine approach of new store builds and acquisitions, with a track record of successful integration of larger deals  The result has been durable, ratable growth that has created long-term shareholder value  Category-of-one at the intersection of convenience and QSR with a proven three-legged stool operating model that creates an unmatched flywheel for growth  1  WHY INVEST IN  3-YEAR GROWTH STRATEGY   Tenured leadership team with deep industry experience and a proven track record of delivering results 
 

 Q&A  113 
 

 Appendix  114 
 

 Note: figures in thousands  RECONCILIATION OF NON-GAAP FINANCIAL MEASURES: NET INCOME TO EBITDA  115 
 

 Note: figures in thousands  1 - EBIT is tax effected using the effective tax rate for the reported period. Effective tax rate is Federal and state income taxes divided by Income before income taxes.  2 - Fiscal year 2018 ROIC is inclusive of the one-time benefit from the Tax Cuts and Jobs Act. Removing this benefit ROIC is 7.9% for fiscal year 2018.   RECONCILIATION OF NON-GAAP FINANCIAL MEASURES: ROIC AND FREE CASH FLOW  116