Performance Management
|
Jun. 24, 2026 |
| Monarch Ambassador Income Index ETF |
|
| Prospectus [Line Items] |
|
| Bar Chart and Performance Table [Heading] |
Performance:
|
| Performance Narrative [Text Block] |
The bar chart and performance table below show the variability of the Fund’s returns, which is some indication of the risks
of investing in the Fund. The bar chart shows performance of the Fund’s shares for each calendar year since the Fund’s inception.
The performance table compares the performance of the Fund over time to the performance of the Index and a broad-based securities market
index. You should be aware that the Fund’s past performance (before and after taxes) is not necessarily an indication of how the
Fund will perform in the future. Updated performance information is available at no cost by visiting www.monarchfunds.com or by
calling toll free at (541) 291-4405.
|
| Performance Past Does Not Indicate Future [Text] |
You should be aware that the Fund’s past performance (before and after taxes) is not necessarily an indication of how the
Fund will perform in the future.
|
| Performance Information Illustrates Variability of Returns [Text] |
The bar chart and performance table below show the variability of the Fund’s returns, which is some indication of the risks
of investing in the Fund. The bar chart shows performance of the Fund’s shares for each calendar year since the Fund’s inception.
|
| Bar Chart [Heading] |
Performance
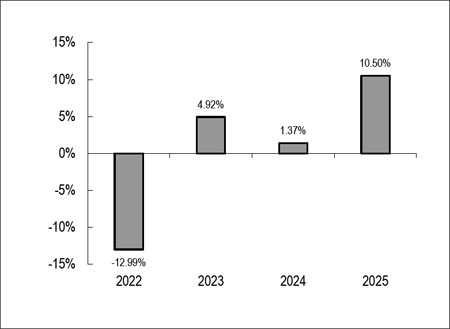
Bar Chart For Calendar Year Ended December 31
|
| Bar Chart [Table] |
| |
2022 |
2023 |
2024 |
2025 |
| |
-12.99% |
4.92% |
1.37% |
10.50% |
|
| Bar Chart Closing [Text Block] |
| Best
Quarter: |
4th
Quarter 2023 |
7.67% |
| Worst
Quarter: |
3rd
Quarter 2022 |
(6.60)% |
The
Fund’s year-to-date return as of the most recent calendar quarter, which ended March 31, 2026 was 1.18%.
|
| Year to Date Return, Label [Optional Text] |
The
Fund’s year-to-date return as of the most recent calendar quarter
|
| Bar Chart, Year to Date Return |
1.18%
|
| Bar Chart, Year to Date Return, Date |
Mar. 31, 2026
|
| Highest Quarterly Return, Label [Optional Text] |
Best
Quarter:
|
| Highest Quarterly Return |
7.67%
|
| Highest Quarterly Return, Date |
Dec. 31, 2023
|
| Lowest Quarterly Return, Label [Optional Text] |
Worst
Quarter:
|
| Lowest Quarterly Return |
(6.60%)
|
| Lowest Quarterly Return, Date |
Sep. 30, 2022
|
| Performance Table Heading |
Performance
Table
Average
Annual Total Returns
(For
periods ended December 31, 2025)
|
| Performance Table Uses Highest Federal Rate |
After-tax
returns are calculated using the historical highest individual federal marginal income tax rates and do not reflect the impact of state
and local taxes.
|
| Performance Table Not Relevant to Tax Deferred |
Actual after-tax returns depend on an investor’s tax situation and may differ from those shown, and after-tax
returns shown are not relevant to investors who hold their Shares through tax-deferred arrangements, such as 401(k) plans or individual
retirement accounts.
|
| Performance [Table] |
| |
One
Year |
Since
Inception
(3/23/21) |
| Return
before taxes |
10.50% |
0.74% |
| Return
after taxes on distributions |
9.38% |
0.07% |
| Return
after taxes on distributions and sale of Fund shares |
6.20% |
0.27% |
| Monarch
Ambassador Income Index |
10.58% |
0.94% |
| Bloomberg
U.S. Aggregate Bond Index* |
7.30% |
0.28% |
| * | The
Bloomberg U.S. Aggregate Bond Index is a broad-based, market capitalization-weighted bond
market index representing intermediate term investment grade bonds traded in the United States.
Investors cannot invest directly in an index. Unlike the Fund’s returns, the index
does not reflect any fees or expenses. |
|
| Index No Deduction for Fees, Expenses, or Taxes [Text] |
index
does not reflect any fees or expenses.
|
| Performance Table Closing [Text Block] |
After-tax
returns are calculated using the historical highest individual federal marginal income tax rates and do not reflect the impact of state
and local taxes. Actual after-tax returns depend on an investor’s tax situation and may differ from those shown, and after-tax
returns shown are not relevant to investors who hold their Shares through tax-deferred arrangements, such as 401(k) plans or individual
retirement accounts.
|
| Performance Availability Website Address [Text] |
www.monarchfunds.com
|
| Performance Availability Phone [Text] |
(541) 291-4405
|
| Monarch Blue Chips Elite Index ETF |
|
| Prospectus [Line Items] |
|
| Bar Chart and Performance Table [Heading] |
Performance:
|
| Performance Narrative [Text Block] |
The
bar chart and performance table below show the variability of the Fund’s returns, which is some indication of the risks of investing
in the Fund. The bar chart shows performance of the Fund’s shares for each calendar year since the Fund’s inception. The
performance table compares the performance of the Fund over time to the performance of the Index and a broad-based securities market
index. You should be aware that the Fund’s past performance (before and after taxes) is not necessarily an indication of how the
Fund will perform in the future. The Fund changed its principal investment strategies on June 3, 2026. Performance prior to that date
reflects the Fund’s prior principal investment strategies. Updated performance information is available at no cost by visiting
www.monarchfunds.com or by calling toll free at (541) 291-4405.
|
| Performance Past Does Not Indicate Future [Text] |
You should be aware that the Fund’s past performance (before and after taxes) is not necessarily an indication of how the
Fund will perform in the future.
|
| Performance Information Illustrates Variability of Returns [Text] |
The
bar chart and performance table below show the variability of the Fund’s returns, which is some indication of the risks of investing
in the Fund. The bar chart shows performance of the Fund’s shares for each calendar year since the Fund’s inception.
|
| Bar Chart [Heading] |
Performance
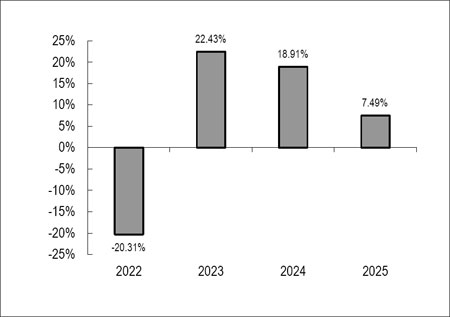
Bar Chart For Calendar Year Ended December 31
|
| Bar Chart [Table] |
| |
2022 |
2023 |
2024 |
2025 |
| |
-20.31% |
22.43% |
18.91% |
7.49% |
|
| Bar Chart Closing [Text Block] |
| Best
Quarter: |
4th
Quarter 2023 |
12.70% |
| Worst
Quarter: |
2nd
Quarter 2022 |
(15.02)% |
The
Fund’s year-to-date return as of the most recent calendar quarter, which ended March 31, 2026 was (6.57)%.
|
| Year to Date Return, Label [Optional Text] |
The
Fund’s year-to-date return as of the most recent calendar quarter
|
| Bar Chart, Year to Date Return |
(6.57%)
|
| Bar Chart, Year to Date Return, Date |
Mar. 31, 2026
|
| Highest Quarterly Return, Label [Optional Text] |
Best
Quarter:
|
| Highest Quarterly Return |
12.70%
|
| Highest Quarterly Return, Date |
Dec. 31, 2023
|
| Lowest Quarterly Return, Label [Optional Text] |
Worst
Quarter:
|
| Lowest Quarterly Return |
(15.02%)
|
| Lowest Quarterly Return, Date |
Jun. 30, 2022
|
| Performance Table Heading |
Performance
Table
Average
Annual Total Returns
(For
periods ended December 31, 2025)
|
| Performance Table Market Index Changed |
Effective
June 3, 2026, the benchmark changed from the Monarch Blue Chips Core Index to the Monarch
Blue Chips Elite Index.
|
| Performance Table Uses Highest Federal Rate |
After-tax
returns are calculated using the historical highest individual federal marginal income tax rates and do not reflect the impact of state
and local taxes.
|
| Performance Table Not Relevant to Tax Deferred |
Actual after-tax returns depend on an investor’s tax situation and may differ from those shown, and after-tax
returns shown are not relevant to investors who hold their Shares through tax-deferred arrangements, such as 401(k) plans or individual
retirement accounts.
|
| Performance [Table] |
| |
One
Year |
Since
Inception
(3/23/21) |
| Return
before taxes |
7.49% |
8.76% |
| Return
after taxes on distributions |
7.37% |
8.72% |
| Return
after taxes on distributions and sale of Fund shares |
4.43% |
6.89% |
| Monarch
Blue Chips Core Index* |
7.56% |
9.00% |
| S&P
500® Index** |
17.88% |
14.10% |
| * | Effective
June 3, 2026, the benchmark changed from the Monarch Blue Chips Core Index to the Monarch
Blue Chips Elite Index. |
| ** | The
S&P 500® Index is an unmanaged free-float capitalization-weighted index
which measures the performance of 500 large-cap common stocks actively traded in the United
States. Index returns assume reinvestment of dividends. Investors may not invest in the Index
directly; unlike the Fund’s returns, the Index does not reflect any fees or expenses. |
|
| Index No Deduction for Fees, Expenses, or Taxes [Text] |
Index does not reflect any fees or expenses.
|
| Performance Table Closing [Text Block] |
After-tax
returns are calculated using the historical highest individual federal marginal income tax rates and do not reflect the impact of state
and local taxes. Actual after-tax returns depend on an investor’s tax situation and may differ from those shown, and after-tax
returns shown are not relevant to investors who hold their Shares through tax-deferred arrangements, such as 401(k) plans or individual
retirement accounts.
|
| Performance Availability Website Address [Text] |
www.monarchfunds.com
|
| Performance Availability Phone [Text] |
(541) 291-4405
|
| Monarch Dividend Plus Index ETF |
|
| Prospectus [Line Items] |
|
| Bar Chart and Performance Table [Heading] |
Performance:
|
| Performance Narrative [Text Block] |
The bar chart and performance table below show the variability of the Fund’s returns, which is some indication of the risks
of investing in the Fund. The bar chart shows performance of the Fund’s shares for each calendar year since the Fund’s inception.
The performance table compares the performance of the Fund over time to the performance of the Index, a broad-based securities market
index, and a supplemental index. You should be aware that the Fund’s past performance (before and after taxes) is not necessarily
an indication of how the Fund will perform in the future. Updated performance information is available at no cost by visiting www.monarchfunds.com
or by calling toll free at (541) 291-4405.
|
| Performance Past Does Not Indicate Future [Text] |
You should be aware that the Fund’s past performance (before and after taxes) is not necessarily
an indication of how the Fund will perform in the future.
|
| Performance Information Illustrates Variability of Returns [Text] |
The bar chart and performance table below show the variability of the Fund’s returns, which is some indication of the risks
of investing in the Fund. The bar chart shows performance of the Fund’s shares for each calendar year since the Fund’s inception.
|
| Bar Chart [Heading] |
Performance
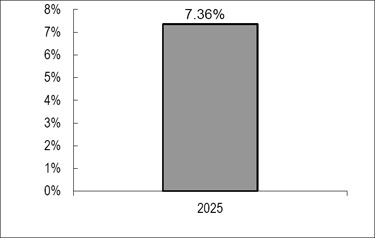
Bar Chart For Calendar Year Ended December 31
|
| Bar Chart [Table] |
|
| Bar Chart Closing [Text Block] |
| Best
Quarter: |
1st
Quarter 2025 |
4.14% |
| Worst
Quarter: |
2nd
Quarter 2025 |
(0.86)% |
The
Fund’s year-to-date return as of the most recent calendar quarter, which ended March 31, 2026 was (3.89)%.
|
| Year to Date Return, Label [Optional Text] |
The
Fund’s year-to-date return as of the most recent calendar quarter
|
| Bar Chart, Year to Date Return |
(3.89%)
|
| Bar Chart, Year to Date Return, Date |
Mar. 31, 2026
|
| Highest Quarterly Return, Label [Optional Text] |
Best
Quarter:
|
| Highest Quarterly Return |
4.14%
|
| Highest Quarterly Return, Date |
Mar. 31, 2025
|
| Lowest Quarterly Return, Label [Optional Text] |
Worst
Quarter:
|
| Lowest Quarterly Return |
(0.86%)
|
| Lowest Quarterly Return, Date |
Jun. 30, 2025
|
| Performance Table Heading |
Performance
Table
Average
Annual Total Returns
(For
periods ended December 31, 2025)
|
| Performance Table Uses Highest Federal Rate |
After-tax
returns are calculated using the historical highest individual federal marginal income tax rates and do not reflect the impact of state
and local taxes.
|
| Performance Table Not Relevant to Tax Deferred |
Actual after-tax returns depend on an investor’s tax situation and may differ from those shown, and after-tax
returns shown are not relevant to investors who hold their Shares through tax-deferred arrangements, such as 401(k) plans or individual
retirement accounts.
|
| Performance [Table] |
| |
One
Year |
Since
Inception
(3/06/24) |
| Return
before taxes |
7.36% |
4.94% |
| Return
after taxes on distributions |
6.74% |
4.47% |
| Return
after taxes on distributions and sale of Fund shares |
4.35% |
3.63% |
| Monarch
Dividend Plus Index |
7.69% |
5.18% |
| Dow
Jones Industrial Average®* |
14.92% |
14.66% |
| S&P
500 Composite 1500 Value Index USD TR** |
12.72% |
11.41% |
| * | The
Dow Jones Industrial Average® is a price-weighted stock market index tracking 30 large, well-established U.S. companies across various
industries, serving as a key benchmark for overall market performance. Index returns assume reinvestment of dividends. Investors may
not invest in the Index directly; unlike the Fund’s returns, the Index does not reflect any fees or expenses. |
| ** | The
S&P Composite 1500® Value measures constituents from the S&P Composite 1500 that are classified as value stocks based on
three factors: the ratios of book value, earnings and sales to price. Index returns assume reinvestment of dividends. Investors may not
invest in the Index directly; unlike the Fund’s returns, the Index does not reflect any fees or expenses. |
|
| Index No Deduction for Fees, Expenses, or Taxes [Text] |
Index does not reflect any fees or expenses.
|
| Performance Table Closing [Text Block] |
After-tax
returns are calculated using the historical highest individual federal marginal income tax rates and do not reflect the impact of state
and local taxes. Actual after-tax returns depend on an investor’s tax situation and may differ from those shown, and after-tax
returns shown are not relevant to investors who hold their Shares through tax-deferred arrangements, such as 401(k) plans or individual
retirement accounts.
|
| Performance Availability Website Address [Text] |
www.monarchfunds.com
|
| Performance Availability Phone [Text] |
(541) 291-4405
|
| Monarch ProCap Index ETF |
|
| Prospectus [Line Items] |
|
| Bar Chart and Performance Table [Heading] |
Performance:
|
| Performance Narrative [Text Block] |
The bar chart and performance table below show the variability of the Fund’s returns, which is some indication of the risks
of investing in the Fund. The bar chart shows performance of the Fund’s shares for each calendar year since the Fund’s inception.
The performance table compares the performance of the Fund over time to the performance of the Index, a broad-based securities market
index, and a supplemental index. You should be aware that the Fund’s past performance (before and after taxes) is not necessarily
an indication of how the Fund will perform in the future. Updated performance information is available at no cost by visiting www.monarchfunds.com
or by calling toll-free at (541) 291-4405.
|
| Performance Past Does Not Indicate Future [Text] |
You should be aware that the Fund’s past performance (before and after taxes) is not necessarily
an indication of how the Fund will perform in the future.
|
| Performance Information Illustrates Variability of Returns [Text] |
The bar chart and performance table below show the variability of the Fund’s returns, which is some indication of the risks
of investing in the Fund. The bar chart shows performance of the Fund’s shares for each calendar year since the Fund’s inception.
|
| Bar Chart [Heading] |
Performance
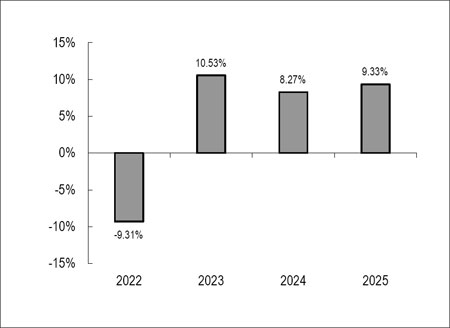
Bar Chart For Calendar Years Ended December 31
|
| Bar Chart [Table] |
| |
2022 |
2023 |
2024 |
2025 |
| |
-9.31% |
10.53% |
8.27% |
9.33% |
|
| Bar Chart Closing [Text Block] |
| Best
Quarter: |
4th
Quarter 2023 |
9.94% |
| Worst
Quarter: |
2nd
Quarter 2022 |
(7.22)% |
The
Fund’s year-to-date return as of the most recent calendar quarter, which ended March 31, 2026 was 2.30%.
|
| Year to Date Return, Label [Optional Text] |
The
Fund’s year-to-date return as of the most recent calendar quarter
|
| Bar Chart, Year to Date Return |
2.30%
|
| Bar Chart, Year to Date Return, Date |
Mar. 31, 2026
|
| Highest Quarterly Return, Label [Optional Text] |
Best
Quarter:
|
| Highest Quarterly Return |
9.94%
|
| Highest Quarterly Return, Date |
Dec. 31, 2023
|
| Lowest Quarterly Return, Label [Optional Text] |
Worst
Quarter:
|
| Lowest Quarterly Return |
(7.22%)
|
| Lowest Quarterly Return, Date |
Jun. 30, 2022
|
| Performance Table Heading |
Performance
Table
Average
Annual Total Returns
(For
periods ended December 31, 2025)
|
| Performance Table Uses Highest Federal Rate |
After-tax
returns are calculated using the historical highest individual federal marginal income tax rates and do not reflect the impact of state
and local taxes.
|
| Performance Table Not Relevant to Tax Deferred |
Actual after-tax returns depend on an investor’s tax situation and may differ from those shown, and after-tax
returns shown are not relevant to investors who hold their Shares through tax-deferred arrangements, such as 401(k) plans or individual
retirement accounts.
|
| Performance [Table] |
| |
One
Year |
Since
Inception
(3/23/21) |
| Return
before taxes |
9.33% |
6.11% |
| Return
after taxes on distributions |
8.46% |
5.53% |
| Return
after taxes on distributions and sale of Fund shares |
5.51% |
4.53% |
| Monarch
ProCap Index |
9.34% |
6.23% |
| Bloomberg
U.S. Aggregate Bond Index* |
7.30% |
0.28% |
| S&P
Target Risk Moderate Index** |
13.38% |
4.91% |
| * | The
Bloomberg U.S. Aggregate Bond Index is a broad-based, market capitalization-weighted bond
market index representing intermediate term investment grade bonds traded in the United States.
Index returns assume reinvestment of dividends. Investors may not invest in the Index directly;
unlike the Fund’s returns, the Index does not reflect any fees or expenses. |
| ** | The
S&P Target Risk Moderate Index is designed to measure the performance of moderate stock-bond
allocations to fixed income while seeking to increase opportunities for higher returns through
equities. Index returns assume reinvestment of dividends. Investors may not invest in the
Index directly; unlike the Fund’s returns, the Index does not reflect any fees or expenses. |
|
| Index No Deduction for Fees, Expenses, or Taxes [Text] |
the Index does not reflect any fees or expenses
|
| Performance Table Closing [Text Block] |
After-tax
returns are calculated using the historical highest individual federal marginal income tax rates and do not reflect the impact of state
and local taxes. Actual after-tax returns depend on an investor’s tax situation and may differ from those shown, and after-tax
returns shown are not relevant to investors who hold their Shares through tax-deferred arrangements, such as 401(k) plans or individual
retirement accounts.
|
| Performance Availability Website Address [Text] |
www.monarchfunds.com
|
| Performance Availability Phone [Text] |
(541) 291-4405
|
| Monarch Select Subsector Index ETF |
|
| Prospectus [Line Items] |
|
| Bar Chart and Performance Table [Heading] |
Performance:
|
| Performance Narrative [Text Block] |
The bar chart and performance table below show the variability of the Fund’s returns, which is some indication of the risks
of investing in the Fund. The bar chart shows performance of the Fund’s shares for each calendar year since the Fund’s inception.
The performance table compares the performance of the Fund over time to the performance of the Index and a broad-based securities market
index. You should be aware that the Fund’s past performance (before and after taxes) is not necessarily an indication of how the
Fund will perform in the future. Updated performance information is available at no cost by visiting www.monarchfunds.com or by
calling toll free at (541) 291-4405.
|
| Performance Past Does Not Indicate Future [Text] |
You should be aware that the Fund’s past performance (before and after taxes) is not necessarily an indication of how the
Fund will perform in the future.
|
| Performance Information Illustrates Variability of Returns [Text] |
The bar chart and performance table below show the variability of the Fund’s returns, which is some indication of the risks
of investing in the Fund. The bar chart shows performance of the Fund’s shares for each calendar year since the Fund’s inception.
|
| Bar Chart [Heading] |
Performance
Bar Chart For Calendar Year Ended December 31
|
| Bar Chart [Table] |

|
| Bar Chart Closing [Text Block] |
| Best
Quarter: |
2nd
Quarter 2025 |
8.99% |
| Worst
Quarter: |
1st
Quarter 2025 |
(1.63)% |
The
Fund’s year-to-date return as of the most recent calendar quarter, which ended March 31, 2026 was (0.75)%.
|
| Year to Date Return, Label [Optional Text] |
The
Fund’s year-to-date return as of the most recent calendar quarter
|
| Bar Chart, Year to Date Return |
(0.75%)
|
| Bar Chart, Year to Date Return, Date |
Mar. 31, 2026
|
| Highest Quarterly Return, Label [Optional Text] |
Best
Quarter:
|
| Highest Quarterly Return |
8.99%
|
| Highest Quarterly Return, Date |
Jun. 30, 2025
|
| Lowest Quarterly Return, Label [Optional Text] |
Worst
Quarter:
|
| Lowest Quarterly Return |
(1.63%)
|
| Lowest Quarterly Return, Date |
Mar. 31, 2025
|
| Performance Table Heading |
Performance
Table
Average
Annual Total Returns
(For
periods ended December 31, 2025)
|
| Performance Table Uses Highest Federal Rate |
After-tax
returns are calculated using the historical highest individual federal marginal income tax rates and do not reflect the impact of state
and local taxes.
|
| Performance Table Not Relevant to Tax Deferred |
Actual after-tax returns depend on an investor’s tax situation and may differ from those shown, and after-tax
returns shown are not relevant to investors who hold their Shares through tax-deferred arrangements, such as 401(k) plans or individual
retirement accounts.
|
| Performance [Table] |
| |
One
Year |
Since
Inception
(3/06/24) |
| Return
before taxes |
9.85% |
11.28% |
| Return
after taxes on distributions |
9.76% |
11.16% |
| Return
after taxes on distributions and sale of Fund shares |
5.83% |
8.65% |
| Monarch
Select Subsector Index |
9.88% |
11.33% |
| S&P
500 Index®* |
17.88% |
19.02% |
| * | The
S&P 500® Index is an unmanaged free-float capitalization-weighted index which measures the performance of 500 large-cap
common stocks actively traded in the United States. Index returns assume reinvestment of dividends. Investors may not invest in the Index
directly; unlike the Fund’s returns, the Index does not reflect any fees or expenses. |
|
| Index No Deduction for Fees, Expenses, or Taxes [Text] |
the Index does not reflect any fees or expenses
|
| Performance Table Closing [Text Block] |
After-tax
returns are calculated using the historical highest individual federal marginal income tax rates and do not reflect the impact of state
and local taxes. Actual after-tax returns depend on an investor’s tax situation and may differ from those shown, and after-tax
returns shown are not relevant to investors who hold their Shares through tax-deferred arrangements, such as 401(k) plans or individual
retirement accounts.
|
| Performance Availability Website Address [Text] |
www.monarchfunds.com
|
| Performance Availability Phone [Text] |
(541) 291-4405
|
| Monarch Volume Factor Dividend Tree Index ETF |
|
| Prospectus [Line Items] |
|
| Bar Chart and Performance Table [Heading] |
Performance:
|
| Performance Narrative [Text Block] |
The bar chart and performance table below show the variability of the Fund’s returns, which is some indication of the risks
of investing in the Fund. The bar chart shows performance of the Fund’s shares for each calendar year since the Fund’s inception.
The performance table compares the performance of the Fund over time to the performance of the Index and a broad-based securities market
index. You should be aware that the Fund’s past performance (before and after taxes) is not necessarily an indication of how the
Fund will perform in the future. Updated performance information is available at no cost by visiting www.monarchfunds.com or by
calling toll free at (541) 291-4405.
|
| Performance Past Does Not Indicate Future [Text] |
You should be aware that the Fund’s past performance (before and after taxes) is not necessarily an indication of how the
Fund will perform in the future.
|
| Performance Information Illustrates Variability of Returns [Text] |
The bar chart and performance table below show the variability of the Fund’s returns, which is some indication of the risks
of investing in the Fund. The bar chart shows performance of the Fund’s shares for each calendar year since the Fund’s inception.
|
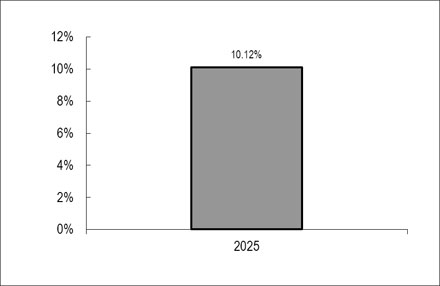
| Bar Chart [Heading] |
Performance
Bar Chart For Calendar Year Ended December 31
|
| Bar Chart [Table] |
|
| Bar Chart Closing [Text Block] |
| Best
Quarter: |
3rd
Quarter 2025 |
4.97% |
| Worst
Quarter: |
1st
Quarter 2025 |
(0.86)% |
The
Fund’s year-to-date return as of the most recent calendar quarter, which ended March 31, 2026 was 4.33%.
|
| Year to Date Return, Label [Optional Text] |
The
Fund’s year-to-date return as of the most recent calendar quarter
|
| Bar Chart, Year to Date Return |
4.33%
|
| Bar Chart, Year to Date Return, Date |
Mar. 31, 2026
|
| Highest Quarterly Return, Label [Optional Text] |
Best
Quarter:
|
| Highest Quarterly Return |
4.97%
|
| Highest Quarterly Return, Date |
Sep. 30, 2025
|
| Lowest Quarterly Return, Label [Optional Text] |
Worst
Quarter:
|
| Lowest Quarterly Return |
(0.86%)
|
| Lowest Quarterly Return, Date |
Mar. 31, 2025
|
| Performance Table Heading |
Performance
Table
Average
Annual Total Returns
(For
periods ended December 31, 2025)
|
| Performance Table Uses Highest Federal Rate |
After-tax
returns are calculated using the historical highest individual federal marginal income tax rates and do not reflect the impact of state
and local taxes.
|
| Performance Table Not Relevant to Tax Deferred |
Actual after-tax returns depend on an investor’s tax situation and may differ from those shown, and after-tax
returns shown are not relevant to investors who hold their Shares through tax-deferred arrangements, such as 401(k) plans or individual
retirement accounts.
|
| Performance [Table] |
| |
One
Year |
Since
Inception
(3/06/24) |
| Return
before taxes |
10.12% |
8.37% |
| Return
after taxes on distributions |
9.50% |
7.83% |
| Return
after taxes on distributions and sale of Fund shares |
5.97% |
6.26% |
| Monarch
Volume Factor Dividend Tree Index |
10.28% |
8.55% |
| S&P
Composite 1500 Index* |
17.02% |
18.16% |
| * | The
S&P Composite 1500 Index® is a broad U.S. stock market index combining
large, mid, and small-cap stocks, covering approximately 90% of U.S. market capitalization.
Index returns assume reinvestment of dividends. Investors may not invest in the Index directly;
unlike the Fund’s returns, the Index does not reflect any fees or expenses. |
|
| Index No Deduction for Fees, Expenses, or Taxes [Text] |
the Index does not reflect any fees or expenses
|
| Performance Table Closing [Text Block] |
After-tax
returns are calculated using the historical highest individual federal marginal income tax rates and do not reflect the impact of state
and local taxes. Actual after-tax returns depend on an investor’s tax situation and may differ from those shown, and after-tax
returns shown are not relevant to investors who hold their Shares through tax-deferred arrangements, such as 401(k) plans or individual
retirement accounts.
|
| Performance Availability Website Address [Text] |
www.monarchfunds.com
|
| Performance Availability Phone [Text] |
(541) 291-4405
|
| Monarch Volume Factor Global Unconstrained Index ETF |
|
| Prospectus [Line Items] |
|
| Bar Chart and Performance Table [Heading] |
Performance:
|
| Performance Narrative [Text Block] |
The bar chart and performance table below show the variability of the Fund’s returns, which is some indication of the risks
of investing in the Fund. The bar chart shows performance of the Fund’s shares for each calendar year since the Fund’s inception.
The performance table compares the performance of the Fund over time to the performance of the Index and a broad-based securities market
index. You should be aware that the Fund’s past performance (before and after taxes) is not necessarily an indication of how the
Fund will perform in the future. Updated performance information is available at no cost by visiting www.monarchfunds.com or by
calling toll free at (541) 291-4405.
|
| Performance Past Does Not Indicate Future [Text] |
You should be aware that the Fund’s past performance (before and after taxes) is not necessarily an indication of how the
Fund will perform in the future.
|
| Performance Information Illustrates Variability of Returns [Text] |
The bar chart and performance table below show the variability of the Fund’s returns, which is some indication of the risks
of investing in the Fund. The bar chart shows performance of the Fund’s shares for each calendar year since the Fund’s inception.
|
| Bar Chart [Heading] |
Performance
Bar Chart For Calendar Year Ended December 31
|
| Bar Chart [Table] |

|
| Bar Chart Closing [Text Block] |
| Best
Quarter: |
2nd
Quarter 2025 |
12.64% |
| Worst
Quarter: |
1st
Quarter 2025 |
(3.78)% |
The
Fund’s year-to-date return as of the most recent calendar quarter, which ended March 31, 2026 was 4.16%.
|
| Year to Date Return, Label [Optional Text] |
The
Fund’s year-to-date return as of the most recent calendar quarter
|
| Bar Chart, Year to Date Return |
4.16%
|
| Bar Chart, Year to Date Return, Date |
Mar. 31, 2026
|
| Highest Quarterly Return, Label [Optional Text] |
Best
Quarter:
|
| Highest Quarterly Return |
12.64%
|
| Highest Quarterly Return, Date |
Jun. 30, 2025
|
| Lowest Quarterly Return, Label [Optional Text] |
Worst
Quarter:
|
| Lowest Quarterly Return |
(3.78%)
|
| Lowest Quarterly Return, Date |
Mar. 31, 2025
|
| Performance Table Heading |
Performance
Table
Average
Annual Total Returns
(For
periods ended December 31, 2025)
|
| Performance Table Uses Highest Federal Rate |
After-tax
returns are calculated using the historical highest individual federal marginal income tax rates and do not reflect the impact of state
and local taxes.
|
| Performance Table Not Relevant to Tax Deferred |
Actual after-tax returns depend on an investor’s tax situation and may differ from those shown, and after-tax
returns shown are not relevant to investors who hold their Shares through tax-deferred arrangements, such as 401(k) plans or individual
retirement accounts.
|
| Performance [Table] |
| |
One
Year |
Since
Inception
(3/06/24) |
| Return
before taxes |
20.92% |
14,78% |
| Return
after taxes on distributions |
19.93% |
13.96% |
| Return
after taxes on distributions and sale of Fund shares |
12.34% |
11.08% |
| Monarch
Volume Factor Global Unconstrained Index |
21.14% |
15.06% |
| S&P
Global 1200 Index* |
23.03% |
19.25% |
| * | The
S&P Global 1200 Index is a free-float weighted stock market index composed of seven regional
indices: S&P 500 Index, S&P Asia 50 Index, S&P/ASX 50 Index, S&P Europe 350
Index, S&P Latin America 40 Index, S&P/TOPIX 150 Index and S&P/TSX 60 Index. |
|
| Performance Table Closing [Text Block] |
After-tax
returns are calculated using the historical highest individual federal marginal income tax rates and do not reflect the impact of state
and local taxes. Actual after-tax returns depend on an investor’s tax situation and may differ from those shown, and after-tax
returns shown are not relevant to investors who hold their Shares through tax-deferred arrangements, such as 401(k) plans or individual
retirement accounts.
|
| Performance Availability Website Address [Text] |
www.monarchfunds.com
|
| Performance Availability Phone [Text] |
(541) 291-4405
|