The following performance information provides some indication of the risks of investing in the Fund. The Fund is the successor to the Predecessor Fund, a mutual fund with identical investment objectives, policies, and restrictions, as a result of the reorganization of the Predecessor Fund into the Fund on February 13, 2026. The performance provided in the bar chart and table is that of the Predecessor Fund. The bar chart illustrates how the Predecessor Fund’s average annual returns have varied from year to year for the past ten calendar years. The table below illustrates how the Predecessor Fund’s average annual total returns over time compare with a domestic broad-based market index. The Predecessor Fund’s past performance, before and after taxes, is not necessarily an indication of how the Fund will perform in the future. Updated performance information is available at no cost by visiting www.beaconinvestingfunds.com or by calling (866) 439-9093.
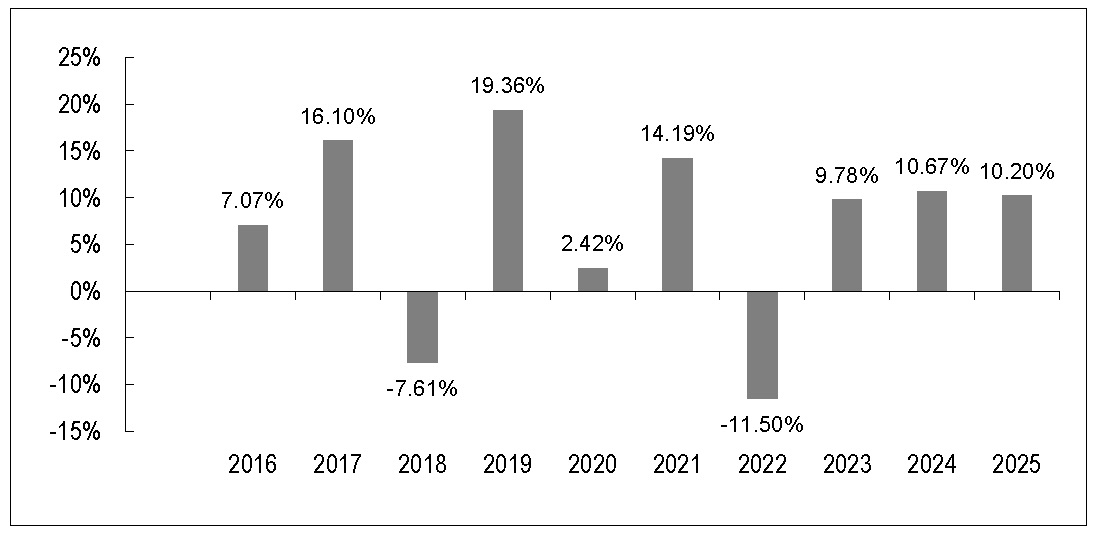
| Best Quarter | 3/31/19 | 11.15% |
| Worst Quarter | 12/31/18 | (13.21)% |
The Predecessor Fund’s year-to-date return for Class I Shares as of June 30, 2025, was 3.05%.
|
|
One Year |
Five Years |
Ten Years |
| Class I Return before taxes* | 10.20% | 6.23% | 6.63% |
| Return after taxes on distributions | 8.37% | 3.74% | 5.01% |
| Return after taxes on distributions and sale of Fund shares | 6.71% | 3.94% | 4.76% |
| Class A Return before taxes** | 4.62% | 4.94% | 5.85% |
| Class C Return before taxes*** | 9.07% | 5.17% | 5.56% |
| S&P 500® Total Return Index(1) | 17.88% | 14.42% | 14.82% |
| S&P 500/40% Bloomberg U.S. Aggregate Bond Index(2) | 13.70% | 8.47% | 9.78% |
| * | Class I shares of the Predecessor Fund commenced operations on October 19, 2009. |
| ** | Class A shares of the Predecessor Fund commenced operations on November 30, 2011. |
| *** | Class C shares of the Predecessor Fund commenced operations on March 12, 2010. |
| (1) | The S&P 500® Total Return Index is an unmanaged market capitalization-weighted index of 500 of the largest capitalized U.S. domiciled companies. Index returns assume reinvestment of dividends. Unlike the Fund’s returns, however, they do not reflect any fees or expenses. Investors cannot directly invest in an index. |
| (2) | S&P 500/40% Bloomberg U.S. Aggregate Bond Index is a custom benchmark consisting of the summed returns of 60% of the S&P 500 Total Return Index and 40% of the Bloomberg U.S. Aggregate Bond Index on a monthly basis. Index returns are calculated with dividends reinvested. This custom benchmark is often used for comparison purposes as it represents a “balanced” portfolio of equities and fixed income. |
After-tax returns were calculated using the historical highest individual federal marginal income tax rates and do not reflect the impact of state and local taxes. Actual after-tax returns depend on an investor’s tax situation and may differ from those shown, and after-tax returns shown are not relevant to investors who hold shares of the Fund through tax-deferred arrangements, such as 401(k) plans or individual retirement accounts. After-tax returns are shown for only Class I shares, and after-tax returns for other classes will vary.