Pay Versus Performance
As required by Section 953(a) of the Dodd-Frank Wall Street Reform and Consumer Protection Act and Item 402(v) of SEC Regulation S-K, we are providing the following information regarding the relationship between executive compensation actually paid (CAP) and certain financial performance measures of the Company for the fiscal years shown.
| Value of Initial Fixed $100 Investment Based on: | ||||||||||||||||
| Fiscal Year (a) | Summary Compensation Table Total ($) (b) | Compensation Actually Paid to CEO ($) (c) | Average Summary Compensation Table Total for Non-CEO NEOs ($) (d) | Average Compensation Actually Paid to Non-CEO NEOs ($) (e) | Flex TSR ($) (f) | Peer Group TSR ($) (g) | GAAP Net Income ($ Millions) (h) | Adjusted EPS ($) (i) | ||||||||
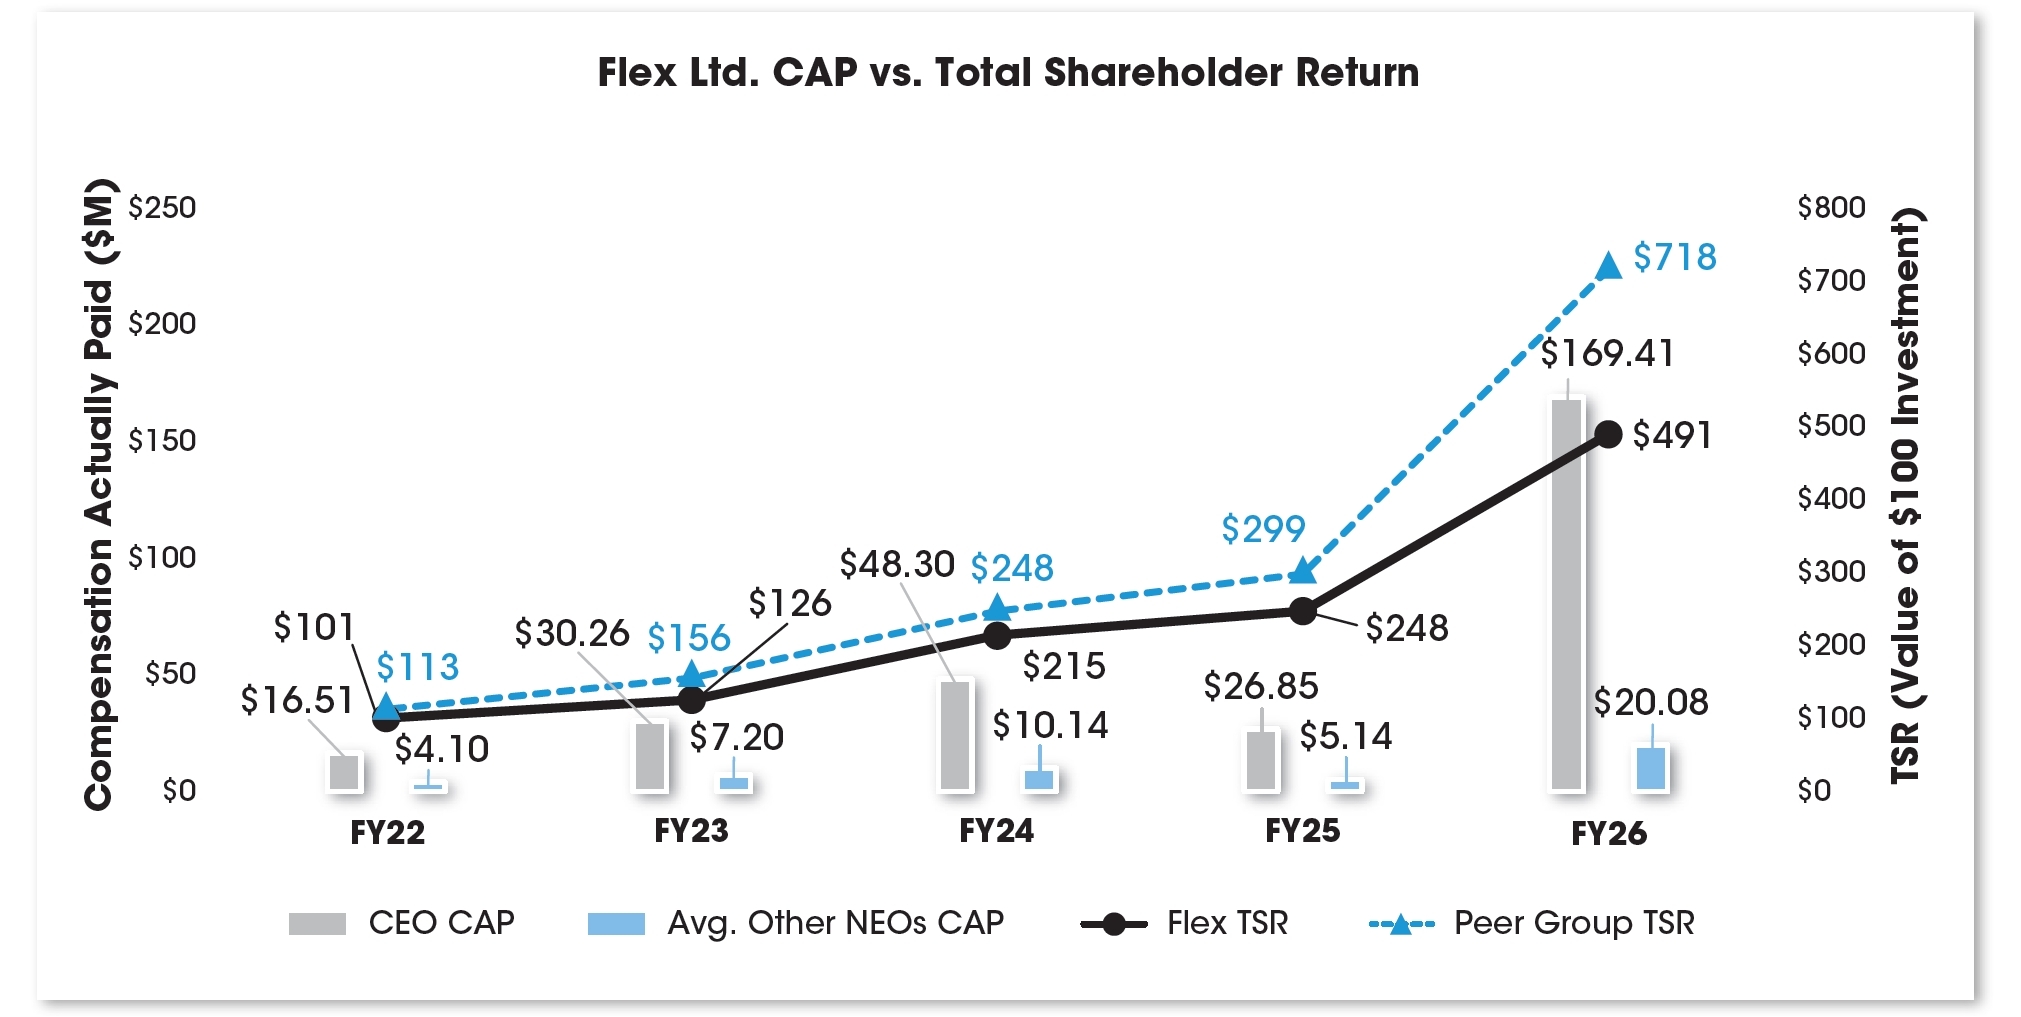
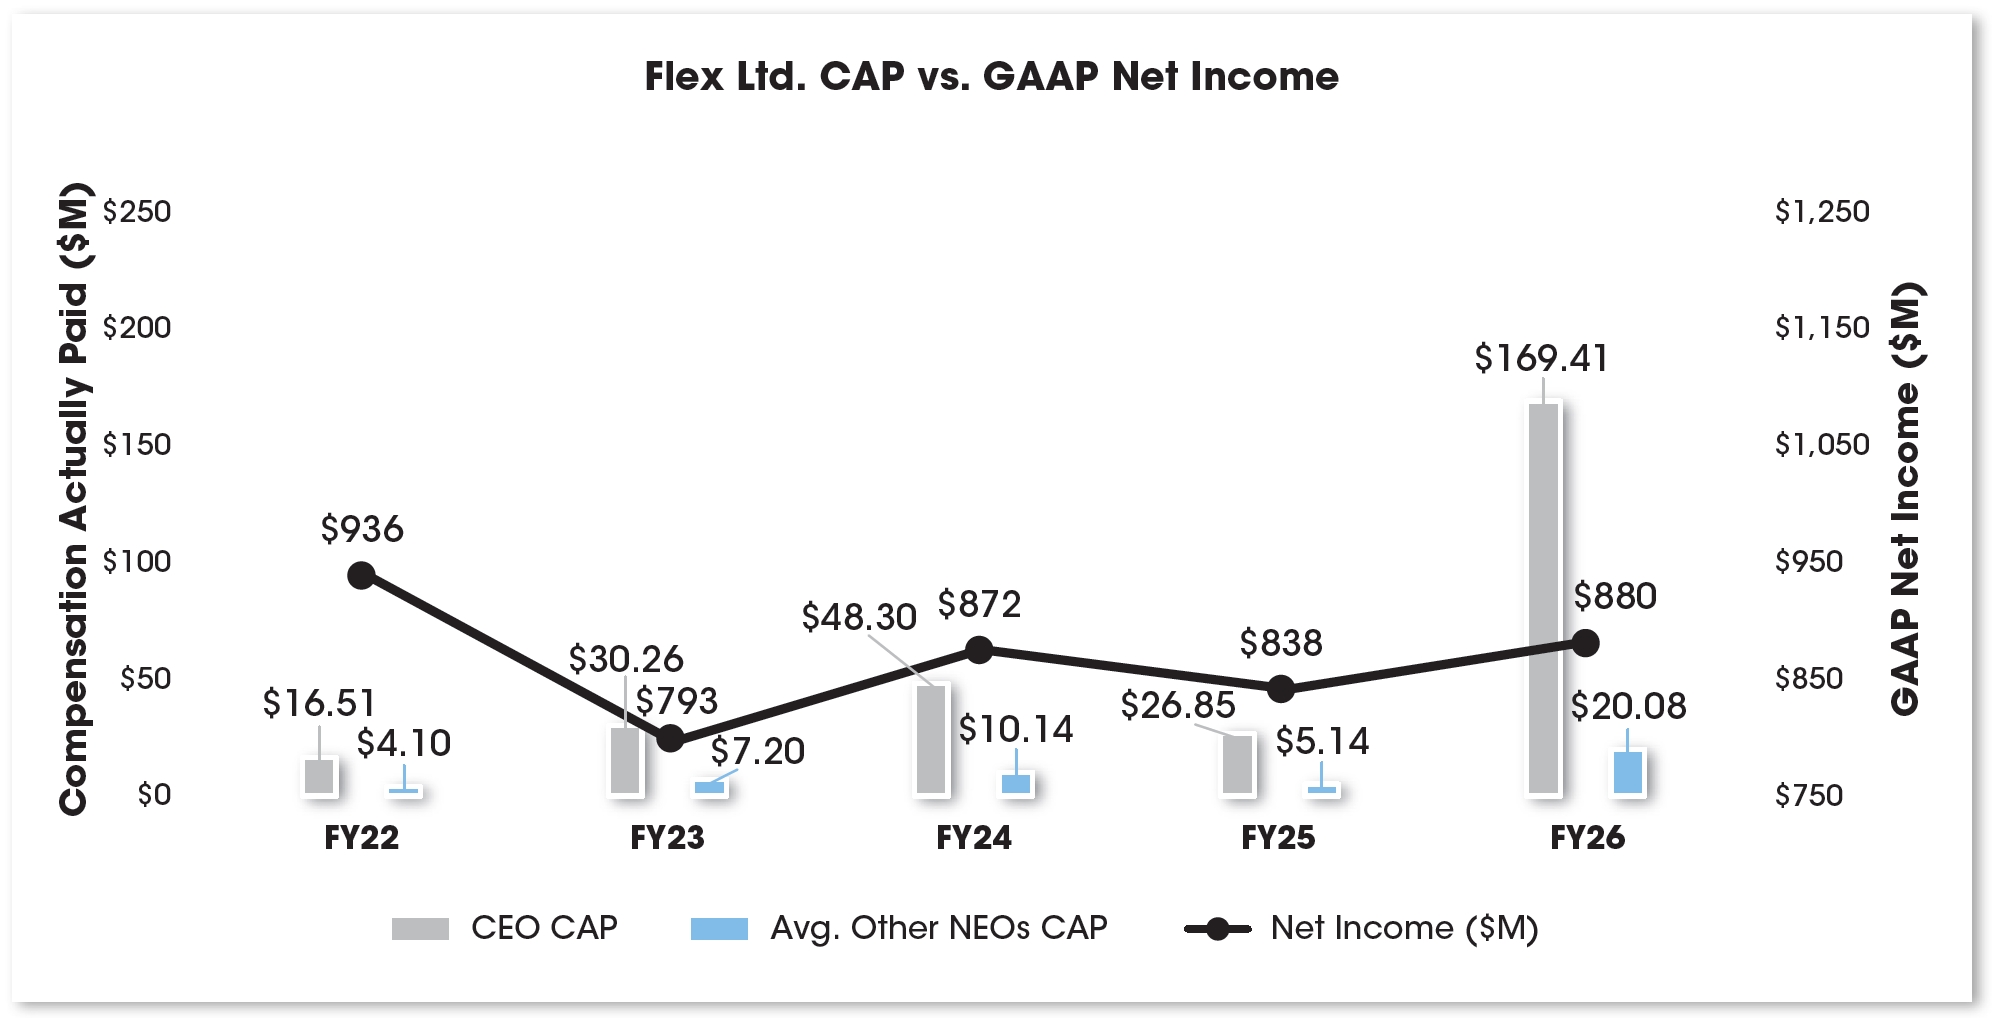
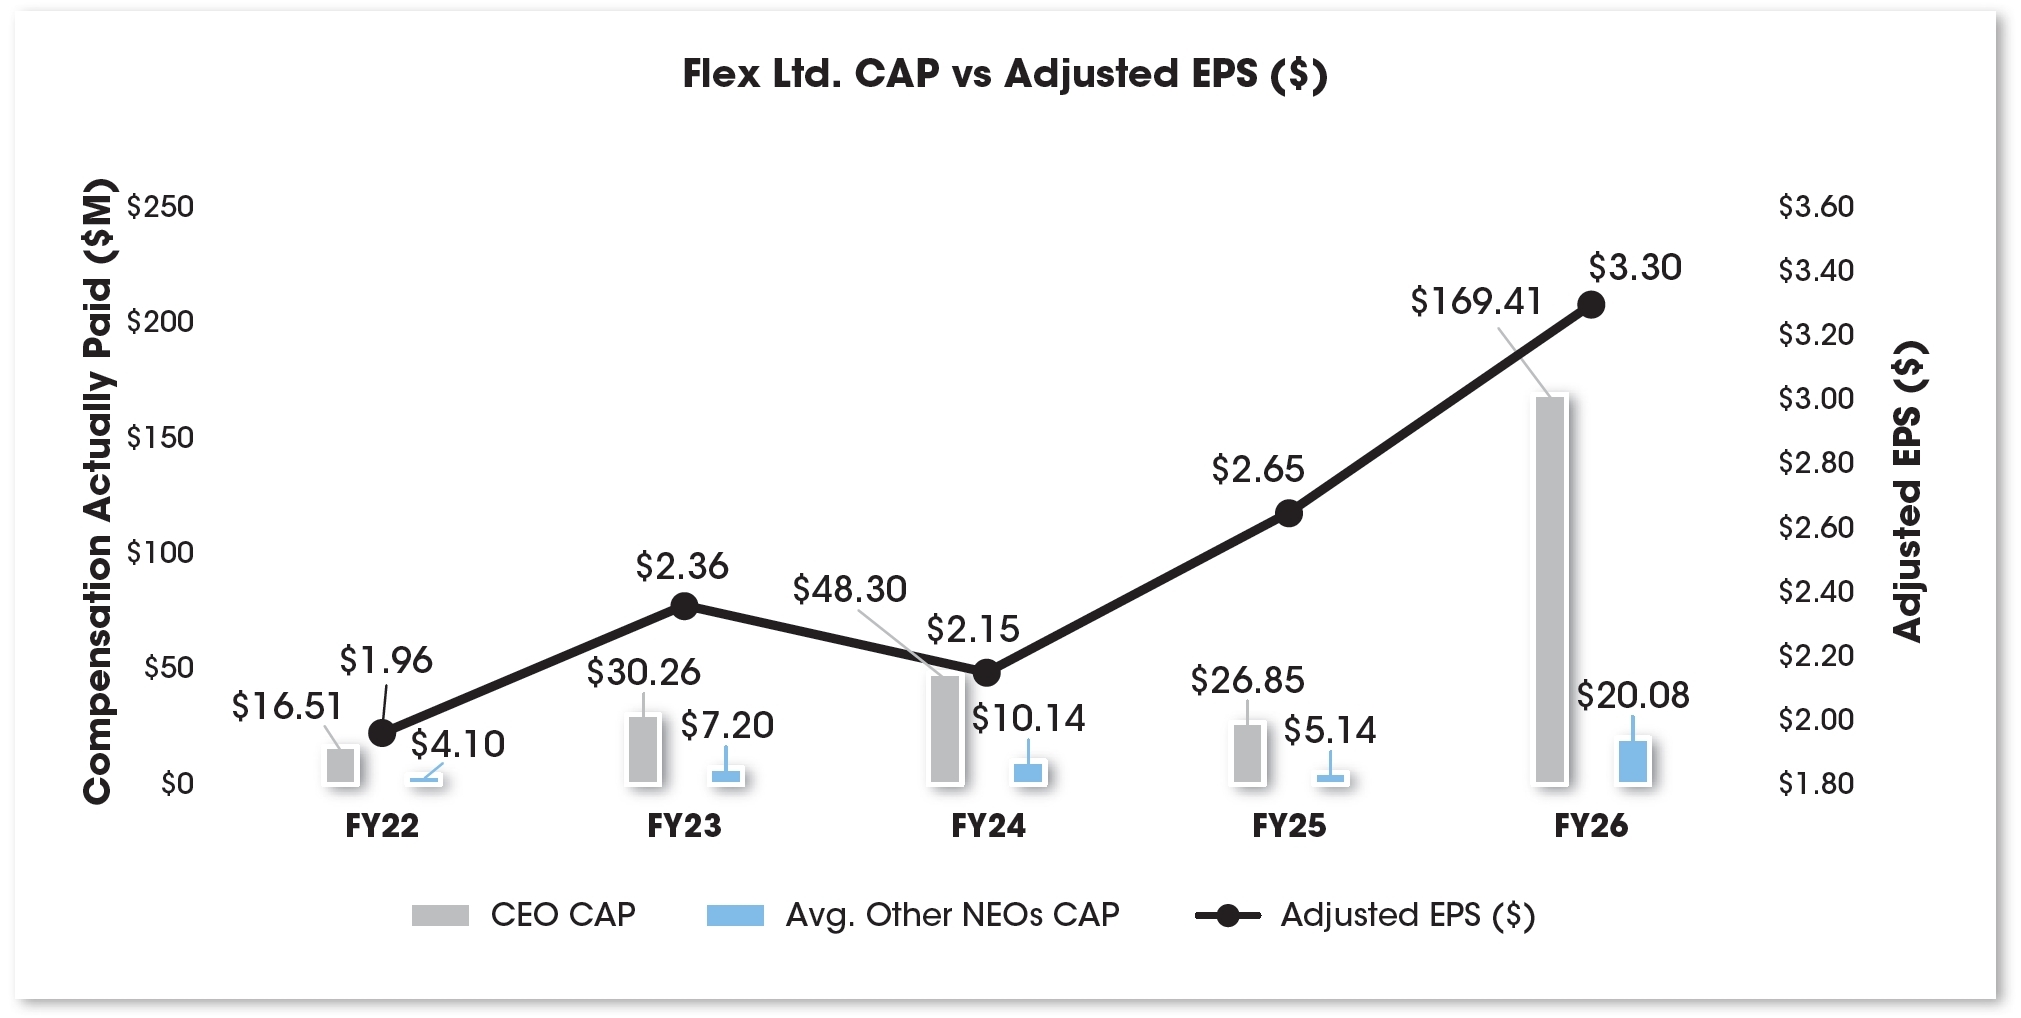
| 2026 | 44,391,138 | 169,414,161 | 5,491,551 | 20,075,135 | 491 | 718 | 880 | 3.30 | ||||||||
| 2025 | 16,422,136 | 26,845,235 | 6,206,790 | 5,142,055 | 248 | 299 | 838 | 2.65 | ||||||||
| 2024 | 15,118,250 | 48,297,494 | 3,898,116 | 10,135,211 | 215 | 248 | 872 | 2.15 | ||||||||
| 2023 | 15,597,911 | 30,258,936 | 4,097,332 | 7,197,637 | 126 | 156 | 793 | 2.36 | ||||||||
| 2022 | 14,375,624 | 16,510,494 | 4,015,753 | 4,098,165 | 101 | 113 | 936 | 1.96 | ||||||||
Column (b). Reflects compensation amounts reported in the “Summary Compensation Table” for Revathi Advaithi, the CEO for the respective years shown.
Column (c).“Compensation actually paid” to the CEO in each of FY26, FY25, FY24, FY23, and FY22 reflects the respective amounts set forth in column (b) of the table above, adjusted as set forth in the table below, as determined in accordance with SEC rules. The dollar amounts reflected in column (b) of the table above do not reflect the actual amount of compensation earned by or paid to our CEO during the applicable year. For information regarding the decisions made by the Compensation and People Committee in regard to the CEO’s compensation for each fiscal year, please see the “Compensation Discussion and Analysis” sections of the proxy statements reporting pay for the fiscal years covered in the table above.
| Fiscal Year CEO | 2022 | 2023 | 2024 | 2025 | 2026 | |||||||||||||||
| SCT Total Compensation ($) | $ | 14,375,624 | $ | 15,597,911 | $ | 15,118,250 | $ | 16,422,136 | $ | 44,391,138 | ||||||||||
| Less: Stock Award Values Reported in SCT for the Covered Year ($) | $ | 10,484,149 | $ | 11,020,718 | $ | 11,382,142 | $ | 11,353,074 | $ | 38,446,348 | ||||||||||
| Plus: Fair Value for Stock Awards Granted in the Covered Year ($) | $ | 11,372,194 | $ | 16,892,976 | $ | 17,276,728 | $ | 12,272,574 | $ | 114,288,067 | ||||||||||
| Change in Fair Value of Outstanding Unvested Stock Awards from Prior Years ($) | $ | 1,275,446 | $ | 10,802,925 | $ | 23,895,484 | $ | 7,390,003 | $ | 38,484,443 | ||||||||||
| Change in Fair Value of Stock Awards from Prior Years that Vested in the Covered Year ($) | $ | (28,621 | ) | $ | (1,987,549 | ) | $ | 3,462,720 | $ | 2,194,246 | $ | 10,696,861 | ||||||||
| Less: Fair Value as of Prior Fiscal Year End of Stock Awards Forfeited during the Covered Year ($) | $ | 0 | $ | 0 | $ | 0 | $ | 0 | $ | 0 | ||||||||||
| Less: Aggregate Change in Actuarial Present Value of Accumulated Benefit Under Pension Plans ($) | $ | 0 | $ | 26,607 | $ | 73,545 | $ | 80,649 | $ | 0 | ||||||||||
| Plus: Aggregate Service Cost and Prior Service Cost for Pension Plans ($) | $ | 0 | $ | 0 | $ | 0 | $ | 0 | $ | 0 | ||||||||||
| Compensation Actually Paid ($) | $ | 16,510,494 | $ | 30,258,936 | $ | 48,297,494 | $ | 26,845,235 | $ | 169,414,161 | ||||||||||
Equity Valuations:
| • | EPS-based PSU grant date fair values are calculated using the stock price as of the date of grant and are assumed at target performance, while TSR-based PSU grant date fair values are calculated using the Monte Carlo fair value, developed in accordance with FASB ASC 718, and are also assumed at target performance. |
| • | The EPS-based PSUs are valued after the grant date assuming estimated performance results as of the end of each measurement date and Flex’s stock price on that date, while the value of TSR-based PSUs assume target-level performance and are multiplied by the corresponding Monte Carlo value. |
| • | Time-based RSUs are valued after grant based on Flex’s stock price on each measurement date, in accordance with FASB ASC 718. |
| • | For all time-based RSUs, the vest date fair value is equal to the number of units that actually vest and Flex’s stock price on that date. |
| Fiscal Year | 2022 | 2023 | 2024 | 2025 | 2026 | |||||||||||||||
| Non-CEO NEOs | See Column (d) Note | See Column (d) Note | See Column (d) Note | See Column (d) Note | See Column (d) Note | |||||||||||||||
| SCT Total Compensation ($) | $ | 4,015,753 | $ | 4,097,332 | $ | 3,898,116 | $ | 6,206,790 | $ | 5,491,551 | ||||||||||
| Less: Stock Award Values Reported in SCT for the Covered Year ($) | $ | 2,262,366 | $ | 2,169,700 | $ | 2,188,321 | $ | 4,225,425 | $ | 3,032,512 | ||||||||||
| Plus: Fair Value for Stock Awards Granted in the Covered Year ($) | $ | 2,453,994 | $ | 3,325,800 | $ | 3,321,609 | $ | 3,768,606 | $ | 5,766,967 | ||||||||||
| Change in Fair Value of Outstanding Unvested Stock Awards from Prior Years ($) | $ | 165,239 | $ | 2,187,616 | $ | 4,471,749 | $ | 709,604 | $ | 10,036,613 | ||||||||||
| Change in Fair Value of Stock Awards from Prior Years that Vested in the Covered Year ($) | $ | (270,811 | ) | $ | (239,733 | ) | $ | 731,844 | $ | (73,967 | ) | $ | 1,812,516 | |||||||
| Less: Fair Value as of Prior Fiscal Year End of Stock Awards Forfeited during the Covered Year ($) | $ | 0 | $ | 0 | $ | 0 | $ | 1,218,563 | $ | 0 | ||||||||||
| Less: Aggregate Change in Actuarial Present Value of Accumulated Benefit Under Pension Plans ($) | $ | 3,645 | $ | 3,678 | $ | 99,786 | $ | 24,990 | $ | 0 | ||||||||||
| Plus: Aggregate Service Cost and Prior Service Cost for Pension Plans ($) | $ | 0 | $ | 0 | $ | 0 | $ | 0 | $ | 0 | ||||||||||
| Compensation Actually Paid ($) | $ | 4,098,165 | $ | 7,197,637 | $ | 10,135,211 | $ | 5,142,055 | $ | 20,075,135 | ||||||||||
Equity Valuations: equity valuation assumptions are the same as those stated above under the CEO table.
Column (d). The following non-CEO NEOs (collectively, the “Non-CEO NEOs”) are included in the average figures shown:
| • | FY22: Francois P. Barbier, Michael P. Hartung, Paul R. Lundstrom, and Scott Offer |
| • | FY23: Michael P. Hartung, Paul R. Lundstrom, Scott Offer, and Hooi Tan |
| • | FY24: Michael P. Hartung, Paul R. Lundstrom, Scott Offer, and Hooi Tan |
| • | FY25: Kevin Krumm, Michael P. Hartung, Scott Offer, Hooi Tan, Paul R. Lundstrom and Jaime Martinez |
| • | FY26: Kevin Krumm, Michael P. Hartung, Scott Offer and Hooi Tan |
Column (e). Average “compensation actually paid” for our Non-CEO NEOs in each of FY26, FY25, FY24, FY23 and FY22 reflects the respective amounts set forth in column (d) of the table above, adjusted as set forth in the table below, as determined in accordance with SEC rules. The dollar amounts reflected in column (d) of the table above do not reflect the actual amount of compensation earned by or paid to our Non-CEO NEOs during the applicable year. For information regarding the decisions made by our Compensation and People Committee in regard to the Non-CEO NEOs’ compensation for each fiscal year, please see the “Compensation Discussion and Analysis” sections of the proxy statements reporting pay for the fiscal years covered in the table above.
Column (f). For the relevant fiscal year, represents the cumulative total shareholder return (TSR) of Flex for the measurement periods beginning on the last trading day of the Company’s 2021 fiscal year and ending on March 31 of each of 2026, 2025, 2024, 2023 and 2022, respectively.
Column (g). For the relevant fiscal year, represents the cumulative TSR of the peer group consisting of Benchmark Electronics, Celestica Inc., Jabil Inc., and Sanmina Corporation (“Peer Group TSR”) for the measurement periods beginning on the last trading day of the Company’s 2021 fiscal year and ending on March 31 of each of 2026, 2025, 2024, 2023 and 2022, respectively.
Column (h). Reflects “Net Income” in the Company’s Consolidated Income Statements included in the Company’s Annual Reports on Form 10-K for each of the years ended March 31, 2026, 2025, 2024, 2023 and 2022, respectively.
Column (i). Company-selected Measure is Adjusted Earnings Per Share (EPS) which is described below. Adjusted EPS is a non-GAAP financial measure. See Annex A to this proxy statement for a reconciliation of GAAP to non-GAAP financial measures.
Column (d). The following non-CEO NEOs (collectively, the “Non-CEO NEOs”) are included in the average figures shown:
| • | FY22: Francois P. Barbier, Michael P. Hartung, Paul R. Lundstrom, and Scott Offer |
| • | FY23: Michael P. Hartung, Paul R. Lundstrom, Scott Offer, and Hooi Tan |
| • | FY24: Michael P. Hartung, Paul R. Lundstrom, Scott Offer, and Hooi Tan |
| • | FY25: Kevin Krumm, Michael P. Hartung, Scott Offer, Hooi Tan, Paul R. Lundstrom and Jaime Martinez |
| • | FY26: Kevin Krumm, Michael P. Hartung, Scott Offer and Hooi Tan |
Column (g). For the relevant fiscal year, represents the cumulative TSR of the peer group consisting of Benchmark Electronics, Celestica Inc., Jabil Inc., and Sanmina Corporation (“Peer Group TSR”) for the measurement periods beginning on the last trading day of the Company’s 2021 fiscal year and ending on March 31 of each of 2026, 2025, 2024, 2023 and 2022, respectively.
| Fiscal Year CEO | 2022 | 2023 | 2024 | 2025 | 2026 | |||||||||||||||
| SCT Total Compensation ($) | $ | 14,375,624 | $ | 15,597,911 | $ | 15,118,250 | $ | 16,422,136 | $ | 44,391,138 | ||||||||||
| Less: Stock Award Values Reported in SCT for the Covered Year ($) | $ | 10,484,149 | $ | 11,020,718 | $ | 11,382,142 | $ | 11,353,074 | $ | 38,446,348 | ||||||||||
| Plus: Fair Value for Stock Awards Granted in the Covered Year ($) | $ | 11,372,194 | $ | 16,892,976 | $ | 17,276,728 | $ | 12,272,574 | $ | 114,288,067 | ||||||||||
| Change in Fair Value of Outstanding Unvested Stock Awards from Prior Years ($) | $ | 1,275,446 | $ | 10,802,925 | $ | 23,895,484 | $ | 7,390,003 | $ | 38,484,443 | ||||||||||
| Change in Fair Value of Stock Awards from Prior Years that Vested in the Covered Year ($) | $ | (28,621 | ) | $ | (1,987,549 | ) | $ | 3,462,720 | $ | 2,194,246 | $ | 10,696,861 | ||||||||
| Less: Fair Value as of Prior Fiscal Year End of Stock Awards Forfeited during the Covered Year ($) | $ | 0 | $ | 0 | $ | 0 | $ | 0 | $ | 0 | ||||||||||
| Less: Aggregate Change in Actuarial Present Value of Accumulated Benefit Under Pension Plans ($) | $ | 0 | $ | 26,607 | $ | 73,545 | $ | 80,649 | $ | 0 | ||||||||||
| Plus: Aggregate Service Cost and Prior Service Cost for Pension Plans ($) | $ | 0 | $ | 0 | $ | 0 | $ | 0 | $ | 0 | ||||||||||
| Compensation Actually Paid ($) | $ | 16,510,494 | $ | 30,258,936 | $ | 48,297,494 | $ | 26,845,235 | $ | 169,414,161 | ||||||||||
| Fiscal Year | 2022 | 2023 | 2024 | 2025 | 2026 | |||||||||||||||
| Non-CEO NEOs | See Column (d) Note | See Column (d) Note | See Column (d) Note | See Column (d) Note | See Column (d) Note | |||||||||||||||
| SCT Total Compensation ($) | $ | 4,015,753 | $ | 4,097,332 | $ | 3,898,116 | $ | 6,206,790 | $ | 5,491,551 | ||||||||||
| Less: Stock Award Values Reported in SCT for the Covered Year ($) | $ | 2,262,366 | $ | 2,169,700 | $ | 2,188,321 | $ | 4,225,425 | $ | 3,032,512 | ||||||||||
| Plus: Fair Value for Stock Awards Granted in the Covered Year ($) | $ | 2,453,994 | $ | 3,325,800 | $ | 3,321,609 | $ | 3,768,606 | $ | 5,766,967 | ||||||||||
| Change in Fair Value of Outstanding Unvested Stock Awards from Prior Years ($) | $ | 165,239 | $ | 2,187,616 | $ | 4,471,749 | $ | 709,604 | $ | 10,036,613 | ||||||||||
| Change in Fair Value of Stock Awards from Prior Years that Vested in the Covered Year ($) | $ | (270,811 | ) | $ | (239,733 | ) | $ | 731,844 | $ | (73,967 | ) | $ | 1,812,516 | |||||||
| Less: Fair Value as of Prior Fiscal Year End of Stock Awards Forfeited during the Covered Year ($) | $ | 0 | $ | 0 | $ | 0 | $ | 1,218,563 | $ | 0 | ||||||||||
| Less: Aggregate Change in Actuarial Present Value of Accumulated Benefit Under Pension Plans ($) | $ | 3,645 | $ | 3,678 | $ | 99,786 | $ | 24,990 | $ | 0 | ||||||||||
| Plus: Aggregate Service Cost and Prior Service Cost for Pension Plans ($) | $ | 0 | $ | 0 | $ | 0 | $ | 0 | $ | 0 | ||||||||||
| Compensation Actually Paid ($) | $ | 4,098,165 | $ | 7,197,637 | $ | 10,135,211 | $ | 5,142,055 | $ | 20,075,135 | ||||||||||
Listed below are the performance measures which in our assessment represent the three most important financial performance measures we use to link compensation actually paid to our NEOs, for FY26, to Company performance.
| Measure | Nature |
| Stock Price | Financial |
| Relative TSR | Financial |
| Adjusted EPS Growth | Financial |