Pay vs Performance Disclosure - USD ($)
|
12 Months Ended |
Feb. 28, 2026 |
Feb. 28, 2025 |
Feb. 29, 2024 |
Feb. 28, 2023 |
Feb. 28, 2022 |
| Pay vs Performance Disclosure |
|
|
|
|
|
| Pay vs Performance Disclosure, Table |
| | | | | | | | | | | | | | | | | | | | | | | | | | | | | | | | | | | | | | | | | | | | | Fiscal
Year | SCT Total for G. Scott Uzzell ($)(1) | CAP to G. Scott Uzzell ($)(2) | SCT Total for Brian L. Grass ($)(1) | CAP to Brian L. Grass ($)(2) | SCT Total for Noel M. Geoffroy ($)(1) | CAP to Noel M. Geoffroy ($)(2) | SCT Total for Julien R. Mininberg ($)(1) | CAP to Julien R. Mininberg ($)(2) | Average SCT Total for Non-CEO NEOs ($)(1) | Average CAP to Non-CEO NEOs ($)(2) | Value of Fixed $100 Investment Based On: | Net (Loss) Income (in millions) ($) | Adjusted Income (in millions) ($)(5) | TSR ($)(3) | Peer Group TSR ($)(4) | | 2026 | 4,433,124 | | 2,698,592 | | 5,799,794 | | 2,583,675 | | 4,070,466 | | (1,503,981) | | — | | — | | 1,502,387 | | 567,573 | | 8 | | 69 | | (899) | | 82 | | | 2025 | — | | — | | — | | — | | 5,311,324 | | 1,192,030 | | — | | — | | 2,004,229 | | 478,893 | | 25 | | 67 | | 124 | | 162 | | | 2024 | — | | — | | — | | — | | — | | — | | 10,006,422 | | 11,524,531 | | 2,255,143 | | 2,119,573 | | 58 | | 84 | | 169 | | 213 | | | 2023 | — | | — | | — | | — | | — | | — | | 7,965,812 | | (5,703,304) | | 1,703,795 | | 663,458 | | 52 | | 96 | | 143 | | 228 | | | 2022 | — | | — | | — | | — | | — | | — | | 9,746,177 | | 12,841,678 | | 1,725,119 | | 1,637,221 | | 95 | | 105 | | 224 | | 296 | |
|
|
|
|
|
| Company Selected Measure Name |
adjusted income
|
|
|
|
|
| Named Executive Officers, Footnote |
The amounts represent the total compensation paid to our NEOs for each reported fiscal year as reflected in the “Total” column of the Summary Compensation Table (“SCT”). The following table lists the CEO(s) and Non-CEO NEOs for each fiscal year: | | | | | | | | | Fiscal
Year | CEO | Non-CEO NEOs | | 2026 | G. Scott Uzzell, Brian L. Grass and Noel M. Geoffroy(A) | Tessa N. Judge and Tracy L. Scheuerman | | 2025 | Noel M. Geoffroy | Brian L. Grass and Tessa N. Judge | | 2024 | Julien R. Mininberg | Brian L. Grass, Noel M. Geoffroy, Tessa N. Judge and Matthew J. Osberg | | 2023 | Julien R. Mininberg | Noel M. Geoffroy, Tessa N. Judge and Matthew J. Osberg | | 2022 | Julien R. Mininberg | Brian L. Grass and Matthew J. Osberg |
(A) Ms. Geoffroy ceased serving as CEO effective May 2, 2025 and Mr. Grass served as Interim CEO from May 2, 2025 until Mr. Uzzell’s appointment effective September 1, 2025.
|
|
|
|
|
| Peer Group Issuers, Footnote |
Reflects the cumulative total shareholder return of the Dow Jones U.S. Personal Products Index (“Peer Group TSR”). Total shareholder return is calculated based on an assumed $100 investment as of February 28, 2021 and the reinvestment of any issued dividends. This peer group is used by the Company for purposes of Item 201(e) of Regulation S-K under the Exchange Act in the Company’s Annual Report on Form 10-K for fiscal year 2026.
|
|
|
|
|
| Adjustment To PEO Compensation, Footnote |
The amounts reported represent the CAP to our NEOs, computed in accordance with the PvP Rules. These amounts do not reflect the actual amount of compensation earned or received by or paid to our NEOs in the applicable fiscal year (“FY”). In accordance with the PvP Rules, below are the adjustments made to the amounts reported for each of our CEOs and the average of the amounts reported for our Non-CEO NEOs as a group in the “Total” column of the SCT for fiscal year 2026 to arrive at CAP: | | | | | | | | | | | | | | | | | | | | | Compensation Element | G. Scott Uzzell | Brian L. Grass | Noel M. Geoffroy | Average for Non-CEO NEOs | SCT Reported Total Compensation(A) | $4,433,124 | | $5,799,794 | | $4,070,466 | | $1,502,387 | | Minus Aggregate SCT Reported Equity Compensation(B) | (3,250,000) | | (4,800,000) | | (3,800,000) | | (975,000) | | Plus Year-End Fair Value of Awards Granted During Fiscal Year 2026 & Outstanding(C) | 1,515,468 | | 2,313,351 | | 46,968 | | 115,022 | | Plus or Minus (as applicable) Year-Over-Year Change in Fair Value of Awards Granted During Prior Fiscal Year(s) & Outstanding(C) | — | | (699,079) | | (1,507,034) | | — | | Plus Vesting Date Fair Value of Awards Granted & Vested During Fiscal Year 2026(C) | — | | — | | 50,496 | | 214,627 | | Plus or Minus (as applicable) Year-Over-Year Change in Fair Value of Awards Granted During Prior Fiscal Year(s) & Vesting During Fiscal Year 2026(C) | — | | (30,391) | | (364,877) | | — | | Minus Prior Fiscal Year End Value of Awards Determined to Fail to Meet Vesting Conditions During Fiscal Year 2026(C) | — | | — | | — | | (289,463) | | Plus Value of Dividends or Other Earnings Paid on Stock Awards Not Otherwise Included(C) | — | | — | | — | | — | | | Compensation Actually Paid | $2,698,592 | | $2,583,675 | | ($1,503,981) | | $567,573 | |
(A) We have not reported any amounts in our SCT with respect to “Change in Pension and Nonqualified Deferred Compensation.” Consequently, we have no adjustments with respect to such items prescribed by the PvP Rules. (B) This amount reflects the aggregate grant date fair value computed in accordance with FASB ASC Topic 718 of awards granted during fiscal year 2026 as reported in the “Stock Awards” column of the SCT. (C) In accordance with the PvP Rules, the fair values of our NEOs unvested and outstanding equity awards were remeasured as of February 28, 2026, and as of each vesting date during fiscal year 2026 and reflect performance achievement projections (as applicable). The fair value of these stock awards included in CAP to our NEOs is calculated consistent with the approach used to value the awards at the grant date as described in the Company’s Annual Report on Form 10-K for fiscal year 2026. For further information regarding the assumptions and methodologies used in determining the grant date fair values, see Notes 1 and 8 to the consolidated financial statements accompanying the Company’s Annual Report on Form 10-K for fiscal year 2026.
|
|
|
|
|
| Non-PEO NEO Average Total Compensation Amount |
$ 1,502,387
|
$ 2,004,229
|
$ 2,255,143
|
$ 1,703,795
|
$ 1,725,119
|
| Non-PEO NEO Average Compensation Actually Paid Amount |
$ 567,573
|
478,893
|
2,119,573
|
663,458
|
1,637,221
|
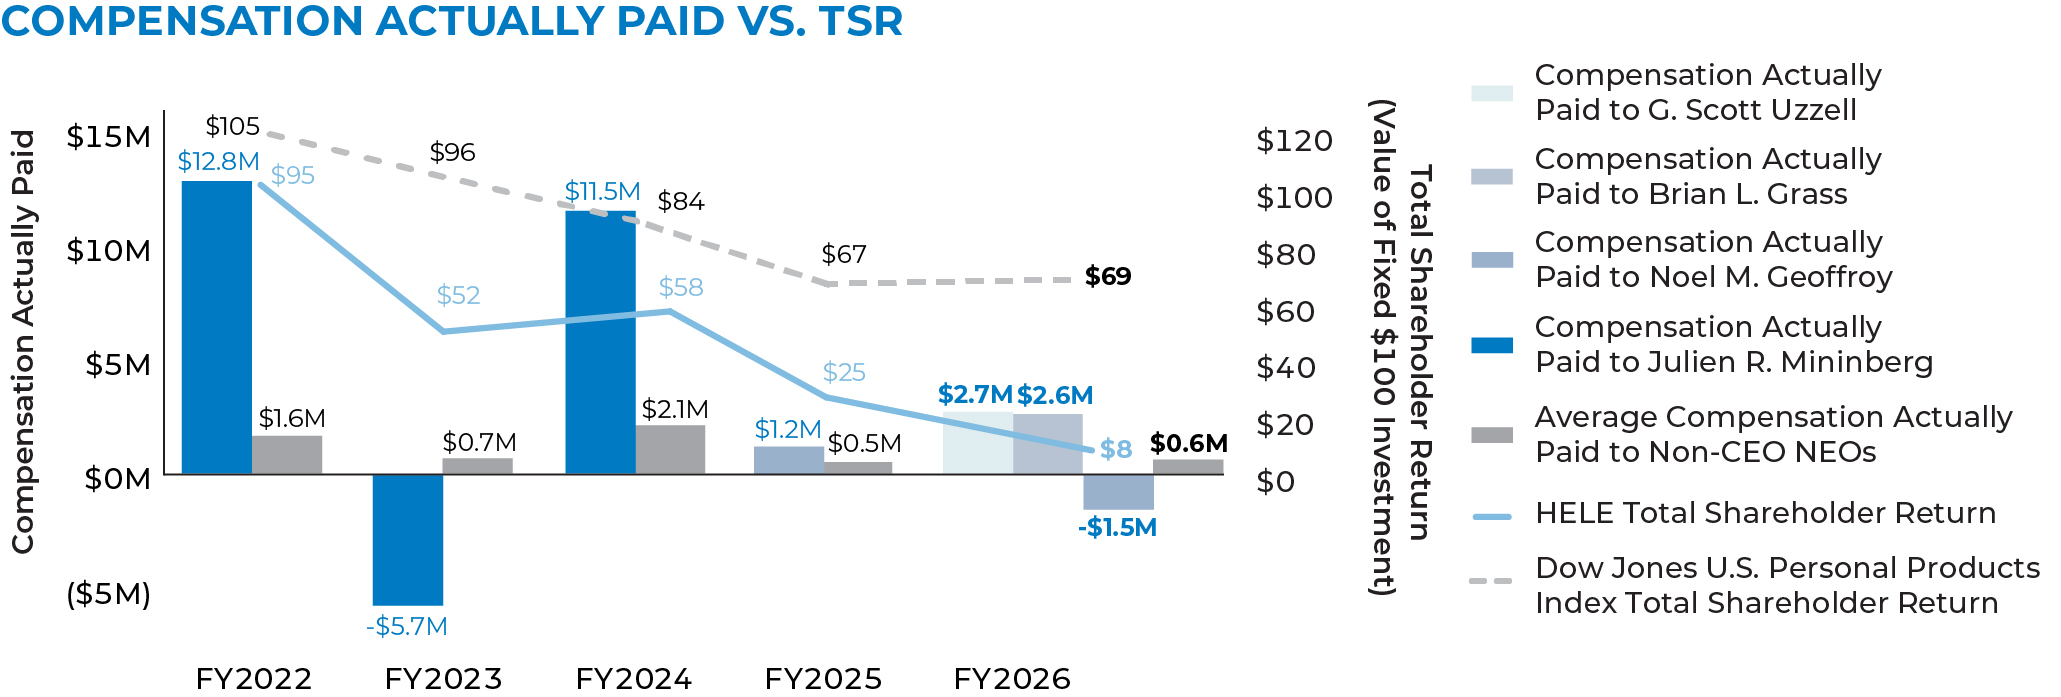
| Compensation Actually Paid vs. Total Shareholder Return |
|
|
|
|
|
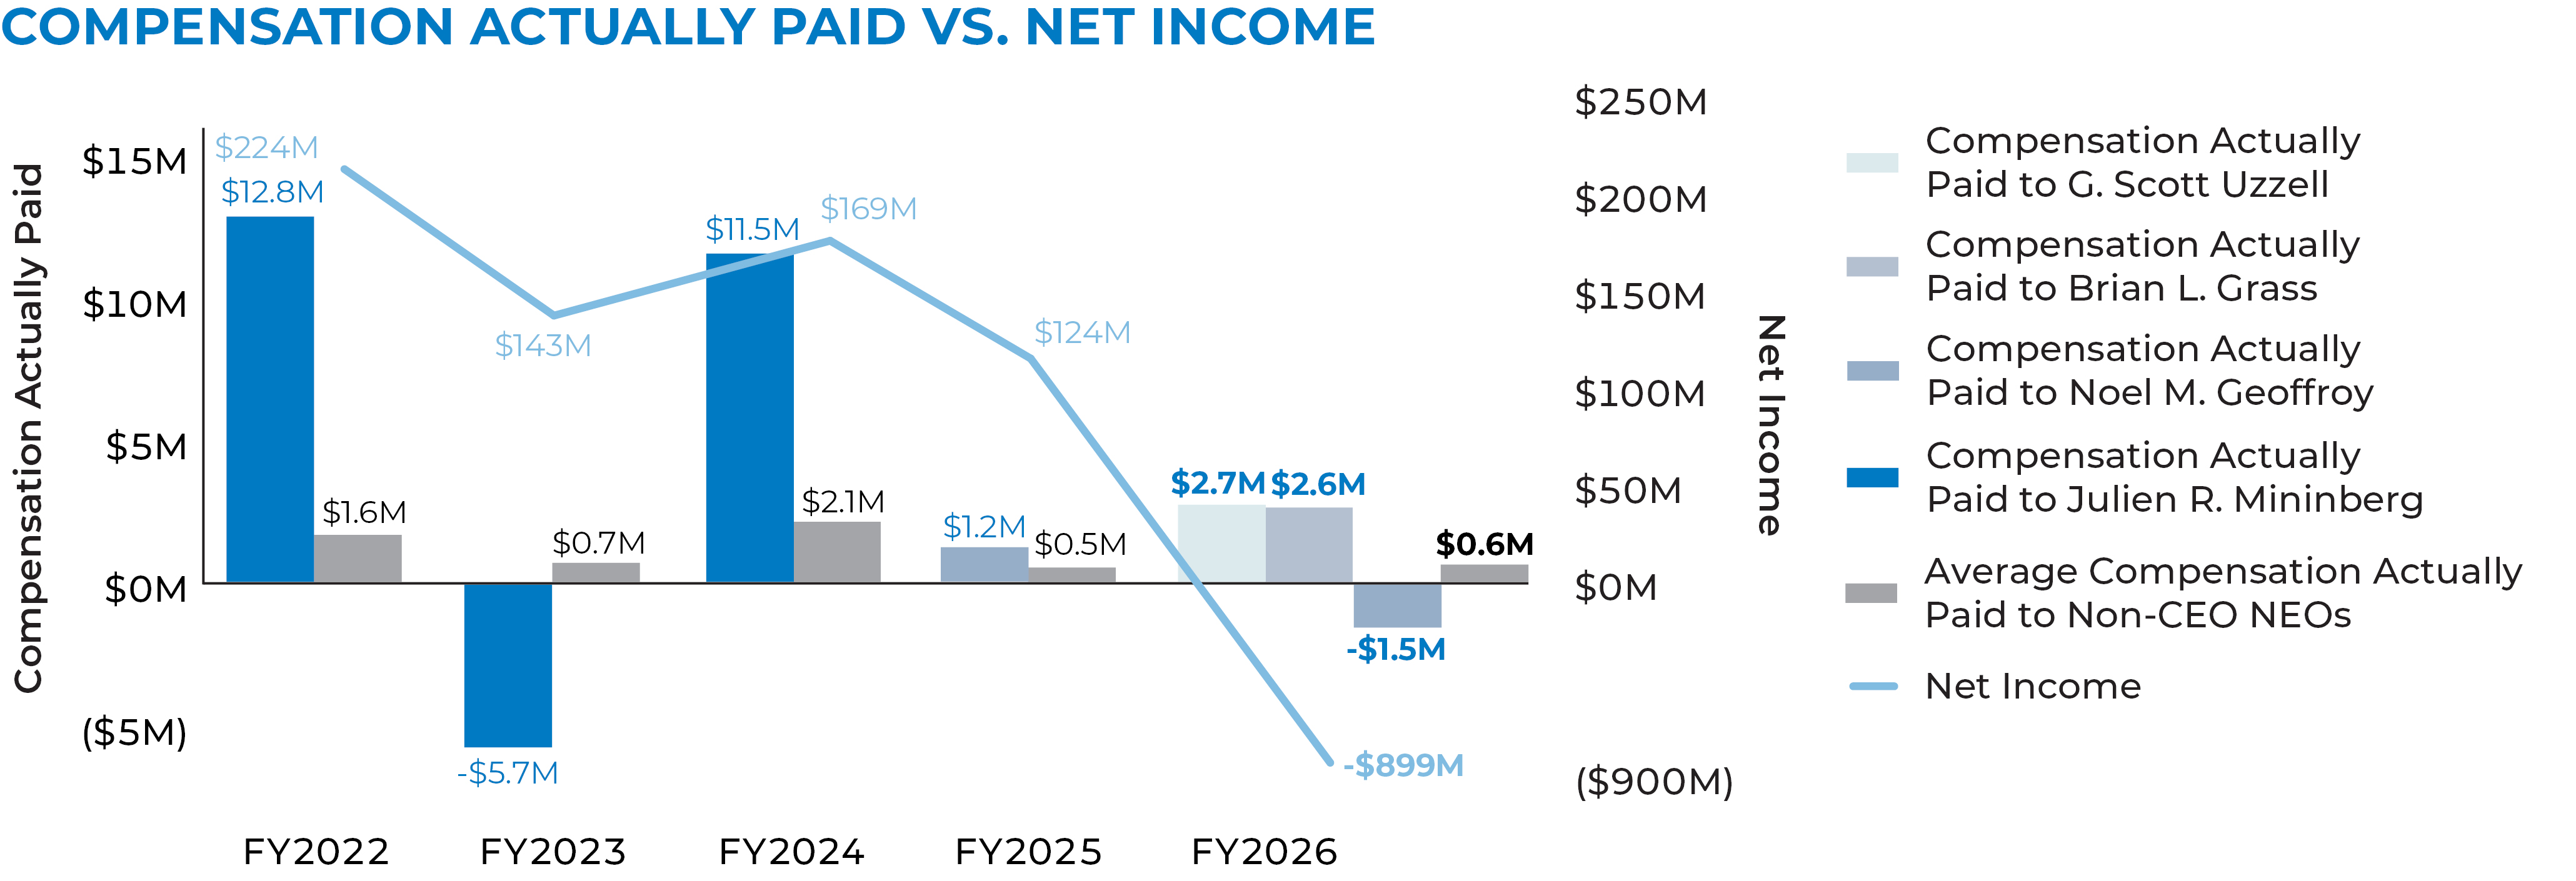
| Compensation Actually Paid vs. Net Income |
|
|
|
|
|
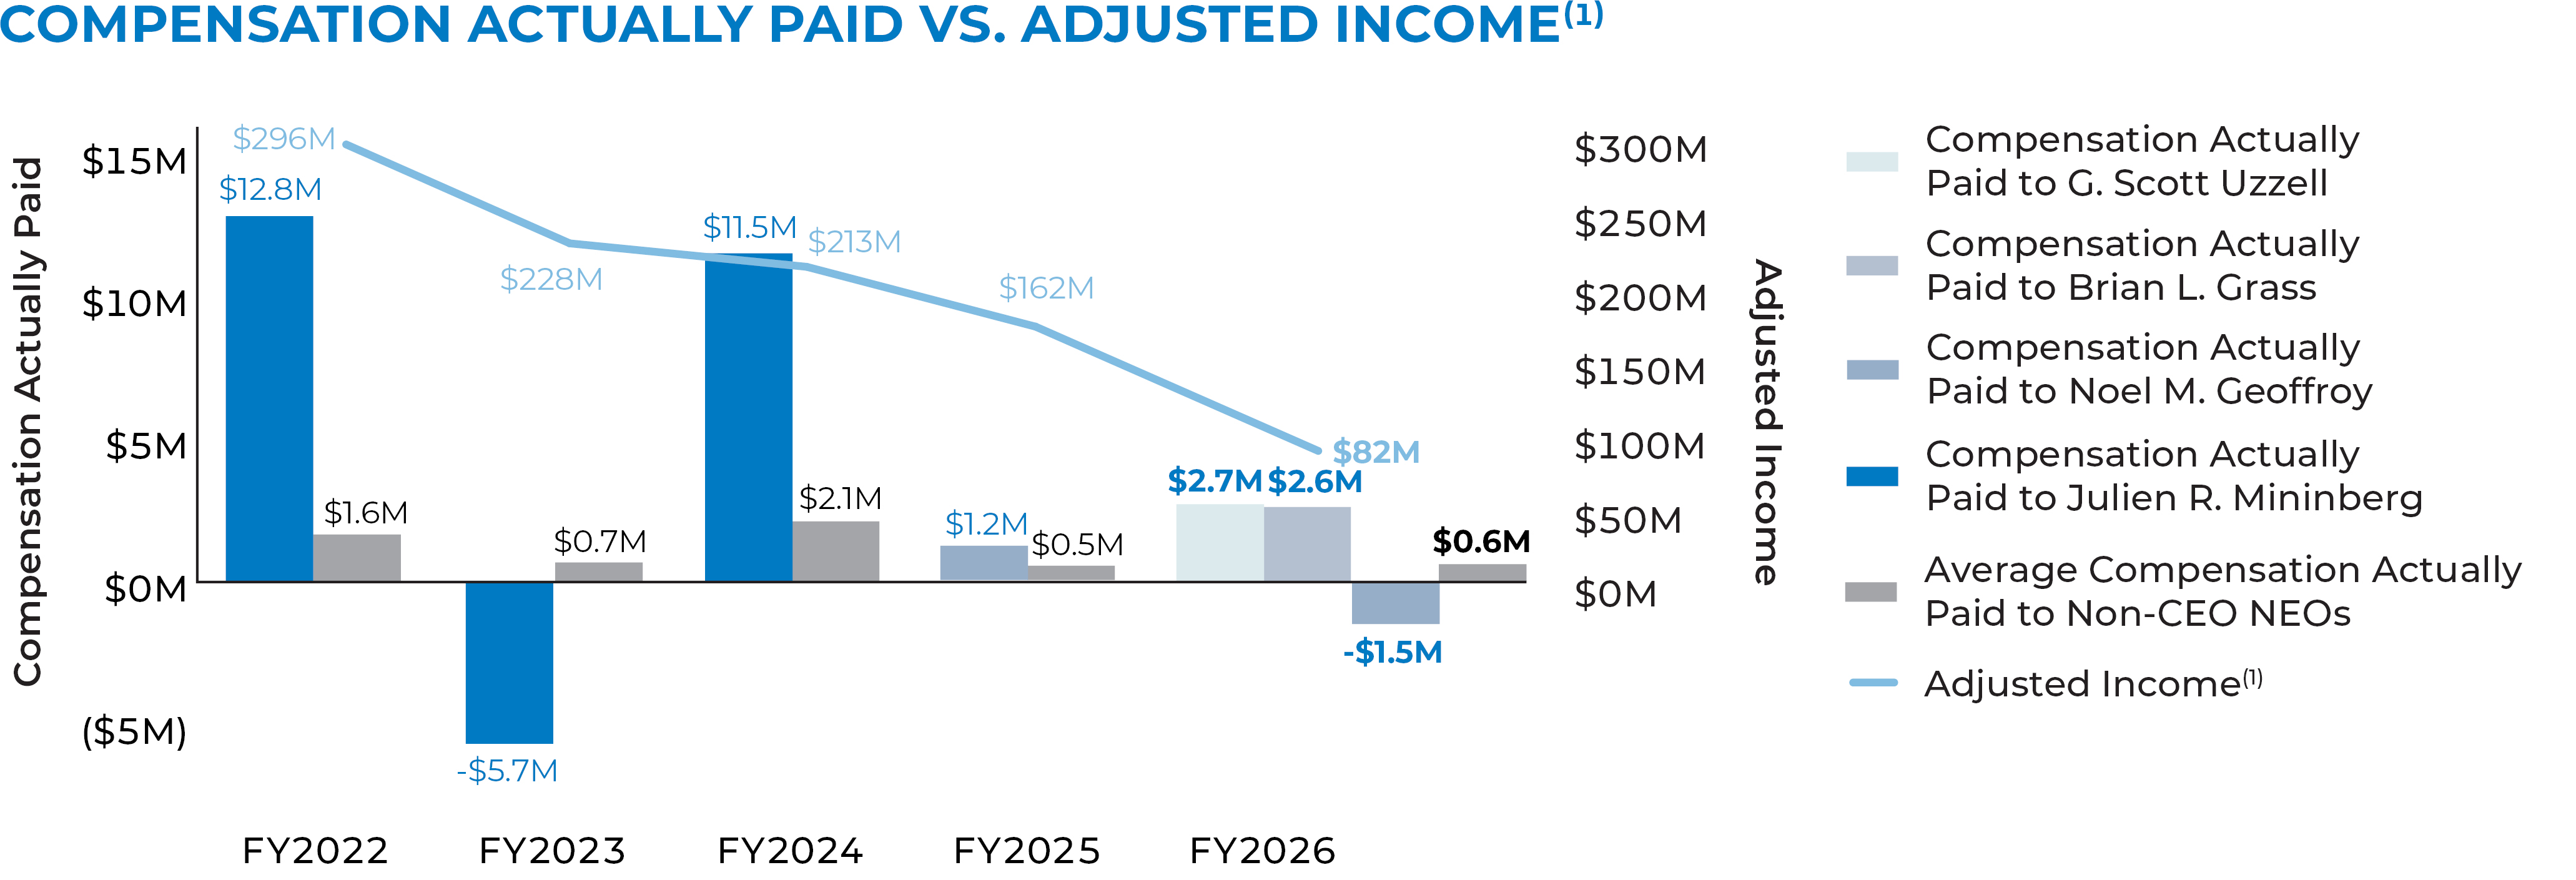
| Compensation Actually Paid vs. Company Selected Measure |
(1)For the PvP analysis, adjusted income aligns with the adjusted income values for our incentive awards.
|
|
|
|
|
| Total Shareholder Return Vs Peer Group |
|
|
|
|
|
| Tabular List, Table |
| | | | | | | Incentive Award | Financial Metric | | Annual Incentive Awards | ▪Adjusted Income | ▪Net Sales | | Long-Term Incentive Awards | ▪Adjusted Diluted EPS | ▪Adjusted Cash Flow Productivity | ▪Relative TSR | ▪Stock Price |
|
|
|
|
|
| Total Shareholder Return Amount |
$ 8
|
25
|
58
|
52
|
95
|
| Peer Group Total Shareholder Return Amount |
69
|
67
|
84
|
96
|
105
|
| Net Income (Loss) |
$ (899,000,000)
|
$ 124,000,000
|
$ 169,000,000
|
$ 143,000,000
|
$ 224,000,000
|
| Company Selected Measure Amount |
82,000,000
|
162,000,000
|
213,000,000
|
228,000,000
|
296,000,000
|
| PEO Name |
G. Scott Uzzell, Brian L. Grass and Noel M. Geoffroy(A)
|
Noel M. Geoffroy
|
Julien R. Mininberg
|
Julien R. Mininberg
|
Julien R. Mininberg
|
| Additional 402(v) Disclosure |
Reflects the Company’s total shareholder return (“TSR”) calculated based on an assumed $100 investment as of February 28, 2021.
|
|
|
|
|
| Measure:: 1 |
|
|
|
|
|
| Pay vs Performance Disclosure |
|
|
|
|
|
| Name |
▪Adjusted Income
|
|
|
|
|
| Non-GAAP Measure Description |
For the PvP analysis, adjusted income aligns with the adjusted income values for our incentive awards. Adjusted income is calculated as net (loss) income excluding the after-tax impact of acquisition-related expenses, asset impairment charges, Barbados tax reform, a charge for uncollectible receivables due to the bankruptcy of Bed, Bath & Beyond, CEO succession costs, Environmental Protection Agency compliance costs, gain on insurance recoveries, gain on sale of distribution and office facilities, intangible asset reorganization, restructuring charges, tax reform, amortization of intangible assets and non-cash share-based compensation, as applicable. Adjusted income is subject to adjustment in the event the Company completes an acquisition of any stock or assets. Accordingly, the financial results from the acquisition of Osprey Pack, Inc. (“Osprey”) and Olive & June were excluded from adjusted income in fiscal year 2022 and fiscal year 2025, respectively, which is consistent with the determination of adjusted income for purposes of our annual incentive award for those fiscal years.
|
|
|
|
|
| Measure:: 2 |
|
|
|
|
|
| Pay vs Performance Disclosure |
|
|
|
|
|
| Name |
▪Net Sales
|
|
|
|
|
| Measure:: 3 |
|
|
|
|
|
| Pay vs Performance Disclosure |
|
|
|
|
|
| Name |
▪Adjusted Diluted EPS
|
|
|
|
|
| Measure:: 4 |
|
|
|
|
|
| Pay vs Performance Disclosure |
|
|
|
|
|
| Name |
▪Adjusted Cash Flow Productivity
|
|
|
|
|
| Measure:: 5 |
|
|
|
|
|
| Pay vs Performance Disclosure |
|
|
|
|
|
| Name |
▪Relative TSR
|
|
|
|
|
| Measure:: 6 |
|
|
|
|
|
| Pay vs Performance Disclosure |
|
|
|
|
|
| Name |
▪Stock Price
|
|
|
|
|
| G. Scott Uzzell [Member] |
|
|
|
|
|
| Pay vs Performance Disclosure |
|
|
|
|
|
| PEO Total Compensation Amount |
$ 4,433,124
|
|
|
|
|
| PEO Actually Paid Compensation Amount |
2,698,592
|
|
|
|
|
| Brian L. Grass [Member] |
|
|
|
|
|
| Pay vs Performance Disclosure |
|
|
|
|
|
| PEO Total Compensation Amount |
5,799,794
|
|
|
|
|
| PEO Actually Paid Compensation Amount |
2,583,675
|
|
|
|
|
| Noel M. Geoffroy [Member] |
|
|
|
|
|
| Pay vs Performance Disclosure |
|
|
|
|
|
| PEO Total Compensation Amount |
4,070,466
|
$ 5,311,324
|
|
|
|
| PEO Actually Paid Compensation Amount |
(1,503,981)
|
$ 1,192,030
|
|
|
|
| Julien R. Mininberg [Member] |
|
|
|
|
|
| Pay vs Performance Disclosure |
|
|
|
|
|
| PEO Total Compensation Amount |
|
|
$ 10,006,422
|
$ 7,965,812
|
$ 9,746,177
|
| PEO Actually Paid Compensation Amount |
|
|
$ 11,524,531
|
$ (5,703,304)
|
$ 12,841,678
|
| PEO | G. Scott Uzzell [Member] | Aggregate Grant Date Fair Value of Equity Award Amounts Reported in Summary Compensation Table |
|
|
|
|
|
| Pay vs Performance Disclosure |
|
|
|
|
|
| Adjustment to Compensation, Amount |
(3,250,000)
|
|
|
|
|
| PEO | G. Scott Uzzell [Member] | Year-end Fair Value of Equity Awards Granted in Covered Year that are Outstanding and Unvested |
|
|
|
|
|
| Pay vs Performance Disclosure |
|
|
|
|
|
| Adjustment to Compensation, Amount |
1,515,468
|
|
|
|
|
| PEO | G. Scott Uzzell [Member] | Year-over-Year Change in Fair Value of Equity Awards Granted in Prior Years That are Outstanding and Unvested |
|
|
|
|
|
| Pay vs Performance Disclosure |
|
|
|
|
|
| Adjustment to Compensation, Amount |
0
|
|
|
|
|
| PEO | G. Scott Uzzell [Member] | Vesting Date Fair Value of Equity Awards Granted and Vested in Covered Year |
|
|
|
|
|
| Pay vs Performance Disclosure |
|
|
|
|
|
| Adjustment to Compensation, Amount |
0
|
|
|
|
|
| PEO | G. Scott Uzzell [Member] | Change in Fair Value as of Vesting Date of Prior Year Equity Awards Vested in Covered Year |
|
|
|
|
|
| Pay vs Performance Disclosure |
|
|
|
|
|
| Adjustment to Compensation, Amount |
0
|
|
|
|
|
| PEO | G. Scott Uzzell [Member] | Prior Year End Fair Value of Equity Awards Granted in Any Prior Year that Fail to Meet Applicable Vesting Conditions During Covered Year |
|
|
|
|
|
| Pay vs Performance Disclosure |
|
|
|
|
|
| Adjustment to Compensation, Amount |
0
|
|
|
|
|
| PEO | G. Scott Uzzell [Member] | Dividends or Other Earnings Paid on Equity Awards not Otherwise Reflected in Total Compensation for Covered Year |
|
|
|
|
|
| Pay vs Performance Disclosure |
|
|
|
|
|
| Adjustment to Compensation, Amount |
0
|
|
|
|
|
| PEO | Brian L. Grass [Member] | Aggregate Grant Date Fair Value of Equity Award Amounts Reported in Summary Compensation Table |
|
|
|
|
|
| Pay vs Performance Disclosure |
|
|
|
|
|
| Adjustment to Compensation, Amount |
(4,800,000)
|
|
|
|
|
| PEO | Brian L. Grass [Member] | Year-end Fair Value of Equity Awards Granted in Covered Year that are Outstanding and Unvested |
|
|
|
|
|
| Pay vs Performance Disclosure |
|
|
|
|
|
| Adjustment to Compensation, Amount |
2,313,351
|
|
|
|
|
| PEO | Brian L. Grass [Member] | Year-over-Year Change in Fair Value of Equity Awards Granted in Prior Years That are Outstanding and Unvested |
|
|
|
|
|
| Pay vs Performance Disclosure |
|
|
|
|
|
| Adjustment to Compensation, Amount |
(699,079)
|
|
|
|
|
| PEO | Brian L. Grass [Member] | Vesting Date Fair Value of Equity Awards Granted and Vested in Covered Year |
|
|
|
|
|
| Pay vs Performance Disclosure |
|
|
|
|
|
| Adjustment to Compensation, Amount |
0
|
|
|
|
|
| PEO | Brian L. Grass [Member] | Change in Fair Value as of Vesting Date of Prior Year Equity Awards Vested in Covered Year |
|
|
|
|
|
| Pay vs Performance Disclosure |
|
|
|
|
|
| Adjustment to Compensation, Amount |
(30,391)
|
|
|
|
|
| PEO | Brian L. Grass [Member] | Prior Year End Fair Value of Equity Awards Granted in Any Prior Year that Fail to Meet Applicable Vesting Conditions During Covered Year |
|
|
|
|
|
| Pay vs Performance Disclosure |
|
|
|
|
|
| Adjustment to Compensation, Amount |
0
|
|
|
|
|
| PEO | Brian L. Grass [Member] | Dividends or Other Earnings Paid on Equity Awards not Otherwise Reflected in Total Compensation for Covered Year |
|
|
|
|
|
| Pay vs Performance Disclosure |
|
|
|
|
|
| Adjustment to Compensation, Amount |
0
|
|
|
|
|
| PEO | Noel M. Geoffroy [Member] | Aggregate Grant Date Fair Value of Equity Award Amounts Reported in Summary Compensation Table |
|
|
|
|
|
| Pay vs Performance Disclosure |
|
|
|
|
|
| Adjustment to Compensation, Amount |
(3,800,000)
|
|
|
|
|
| PEO | Noel M. Geoffroy [Member] | Year-end Fair Value of Equity Awards Granted in Covered Year that are Outstanding and Unvested |
|
|
|
|
|
| Pay vs Performance Disclosure |
|
|
|
|
|
| Adjustment to Compensation, Amount |
46,968
|
|
|
|
|
| PEO | Noel M. Geoffroy [Member] | Year-over-Year Change in Fair Value of Equity Awards Granted in Prior Years That are Outstanding and Unvested |
|
|
|
|
|
| Pay vs Performance Disclosure |
|
|
|
|
|
| Adjustment to Compensation, Amount |
(1,507,034)
|
|
|
|
|
| PEO | Noel M. Geoffroy [Member] | Vesting Date Fair Value of Equity Awards Granted and Vested in Covered Year |
|
|
|
|
|
| Pay vs Performance Disclosure |
|
|
|
|
|
| Adjustment to Compensation, Amount |
50,496
|
|
|
|
|
| PEO | Noel M. Geoffroy [Member] | Change in Fair Value as of Vesting Date of Prior Year Equity Awards Vested in Covered Year |
|
|
|
|
|
| Pay vs Performance Disclosure |
|
|
|
|
|
| Adjustment to Compensation, Amount |
(364,877)
|
|
|
|
|
| PEO | Noel M. Geoffroy [Member] | Prior Year End Fair Value of Equity Awards Granted in Any Prior Year that Fail to Meet Applicable Vesting Conditions During Covered Year |
|
|
|
|
|
| Pay vs Performance Disclosure |
|
|
|
|
|
| Adjustment to Compensation, Amount |
0
|
|
|
|
|
| PEO | Noel M. Geoffroy [Member] | Dividends or Other Earnings Paid on Equity Awards not Otherwise Reflected in Total Compensation for Covered Year |
|
|
|
|
|
| Pay vs Performance Disclosure |
|
|
|
|
|
| Adjustment to Compensation, Amount |
0
|
|
|
|
|
| Non-PEO NEO | Aggregate Grant Date Fair Value of Equity Award Amounts Reported in Summary Compensation Table |
|
|
|
|
|
| Pay vs Performance Disclosure |
|
|
|
|
|
| Adjustment to Compensation, Amount |
(975,000)
|
|
|
|
|
| Non-PEO NEO | Year-end Fair Value of Equity Awards Granted in Covered Year that are Outstanding and Unvested |
|
|
|
|
|
| Pay vs Performance Disclosure |
|
|
|
|
|
| Adjustment to Compensation, Amount |
115,022
|
|
|
|
|
| Non-PEO NEO | Year-over-Year Change in Fair Value of Equity Awards Granted in Prior Years That are Outstanding and Unvested |
|
|
|
|
|
| Pay vs Performance Disclosure |
|
|
|
|
|
| Adjustment to Compensation, Amount |
0
|
|
|
|
|
| Non-PEO NEO | Vesting Date Fair Value of Equity Awards Granted and Vested in Covered Year |
|
|
|
|
|
| Pay vs Performance Disclosure |
|
|
|
|
|
| Adjustment to Compensation, Amount |
214,627
|
|
|
|
|
| Non-PEO NEO | Change in Fair Value as of Vesting Date of Prior Year Equity Awards Vested in Covered Year |
|
|
|
|
|
| Pay vs Performance Disclosure |
|
|
|
|
|
| Adjustment to Compensation, Amount |
0
|
|
|
|
|
| Non-PEO NEO | Prior Year End Fair Value of Equity Awards Granted in Any Prior Year that Fail to Meet Applicable Vesting Conditions During Covered Year |
|
|
|
|
|
| Pay vs Performance Disclosure |
|
|
|
|
|
| Adjustment to Compensation, Amount |
(289,463)
|
|
|
|
|
| Non-PEO NEO | Dividends or Other Earnings Paid on Equity Awards not Otherwise Reflected in Total Compensation for Covered Year |
|
|
|
|
|
| Pay vs Performance Disclosure |
|
|
|
|
|
| Adjustment to Compensation, Amount |
$ 0
|
|
|
|
|