Pay vs Performance Disclosure - USD ($)
|
12 Months Ended |
Mar. 31, 2026 |
Mar. 31, 2025 |
Mar. 31, 2024 |
Mar. 31, 2023 |
Mar. 31, 2022 |
| Pay vs Performance Disclosure |
|
|
|
|
|
| Pay vs Performance Disclosure, Table |
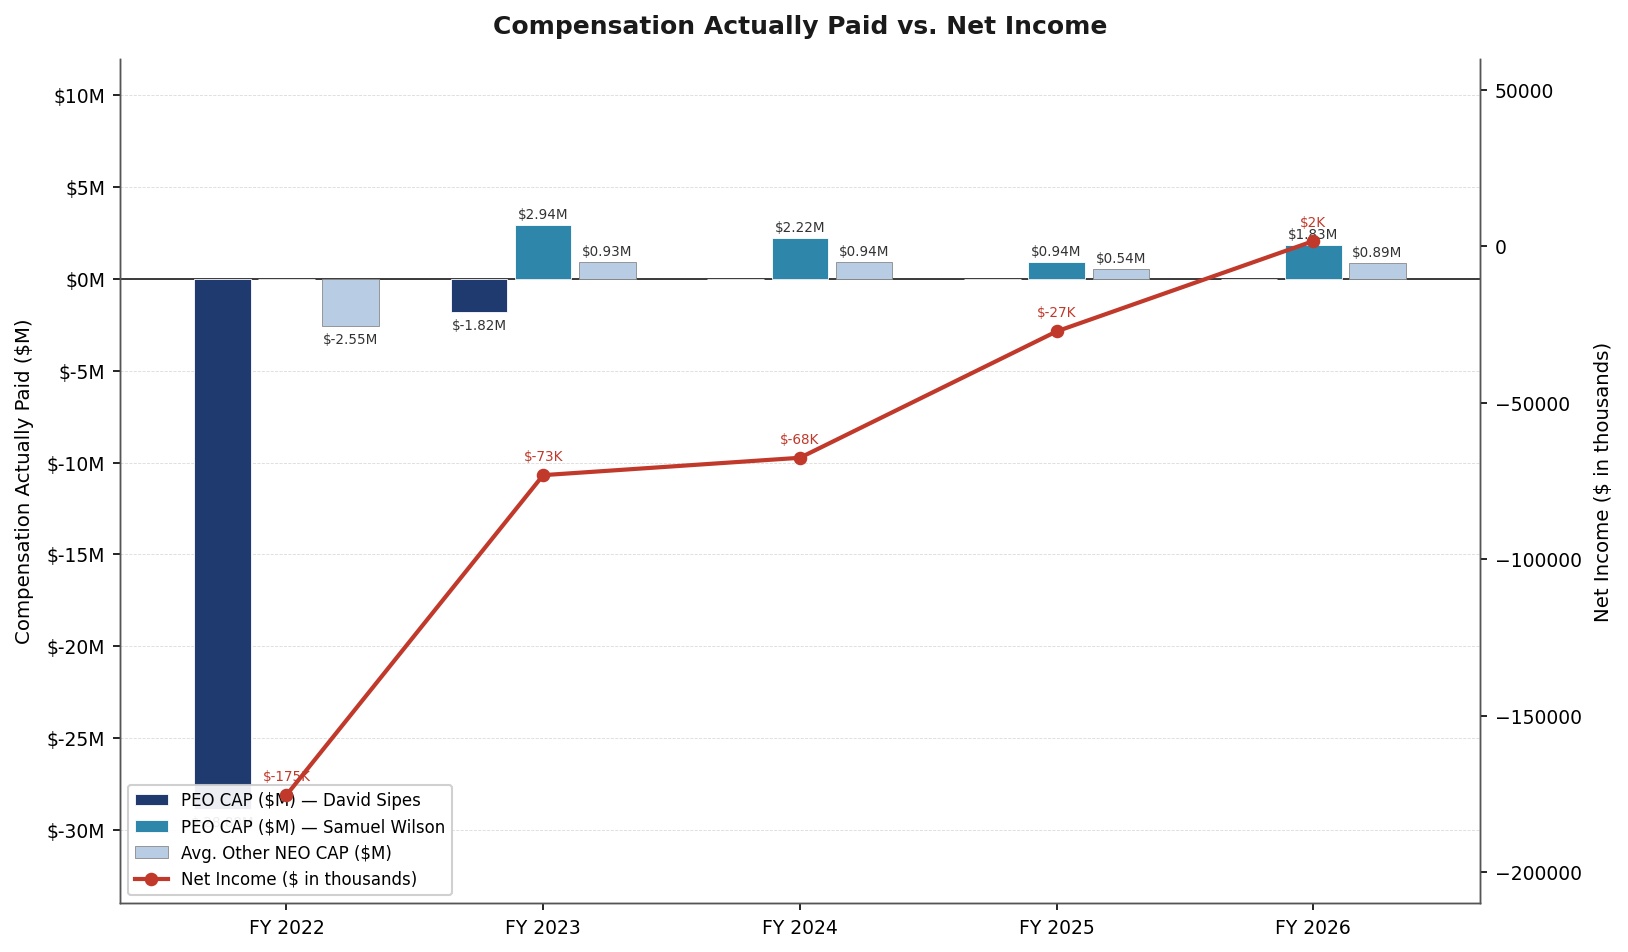
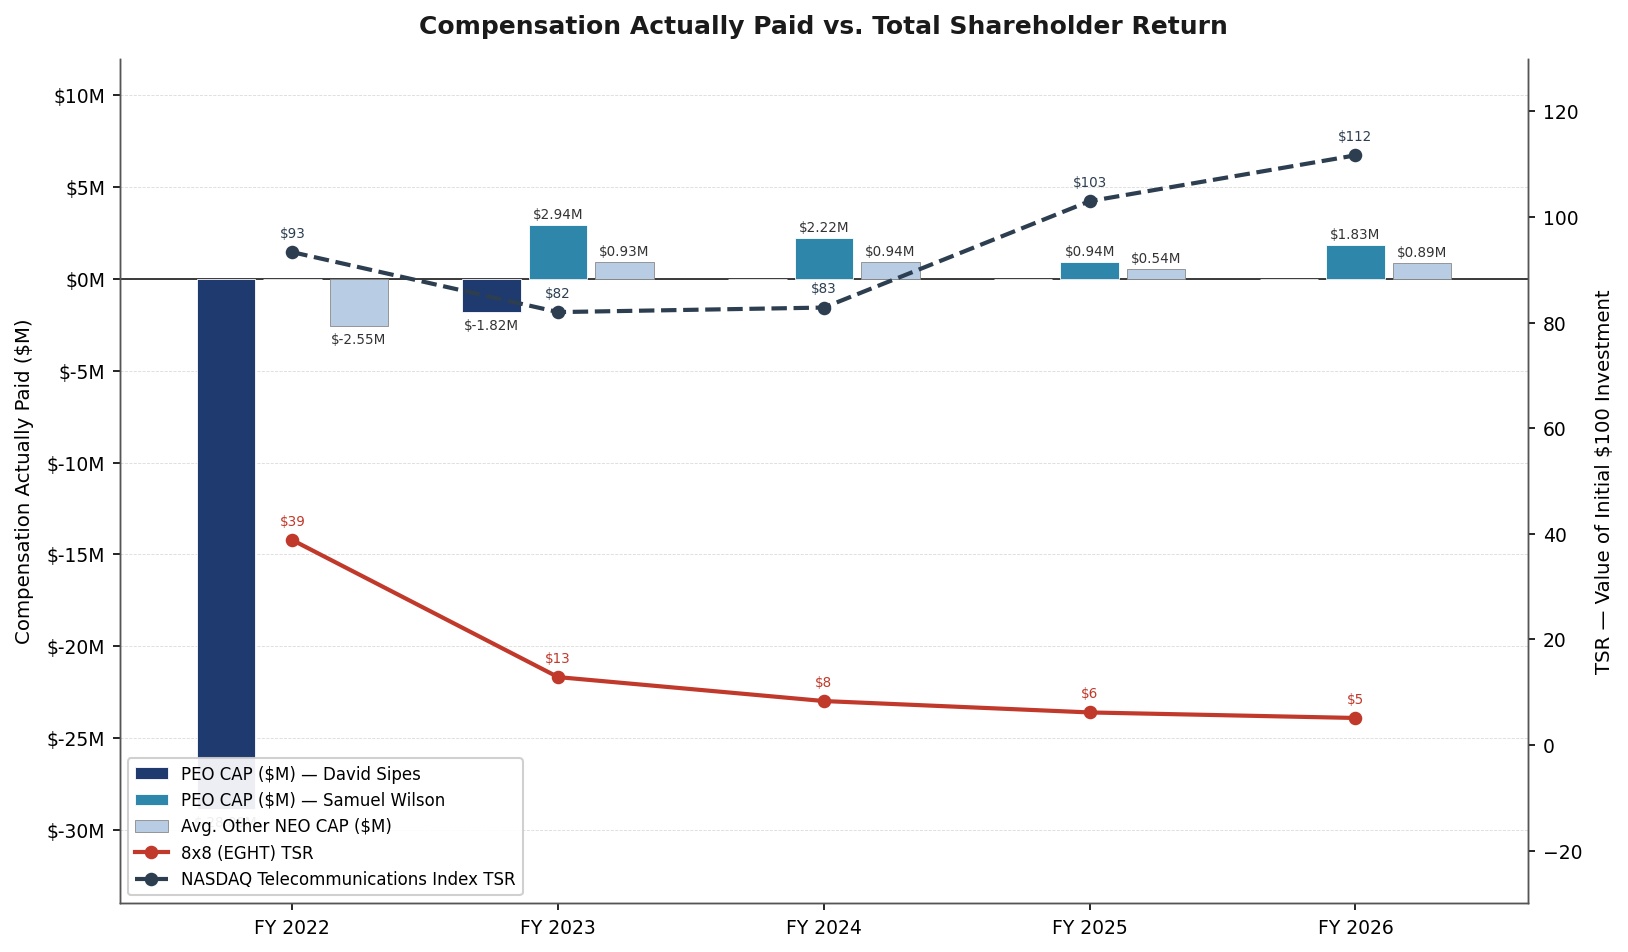
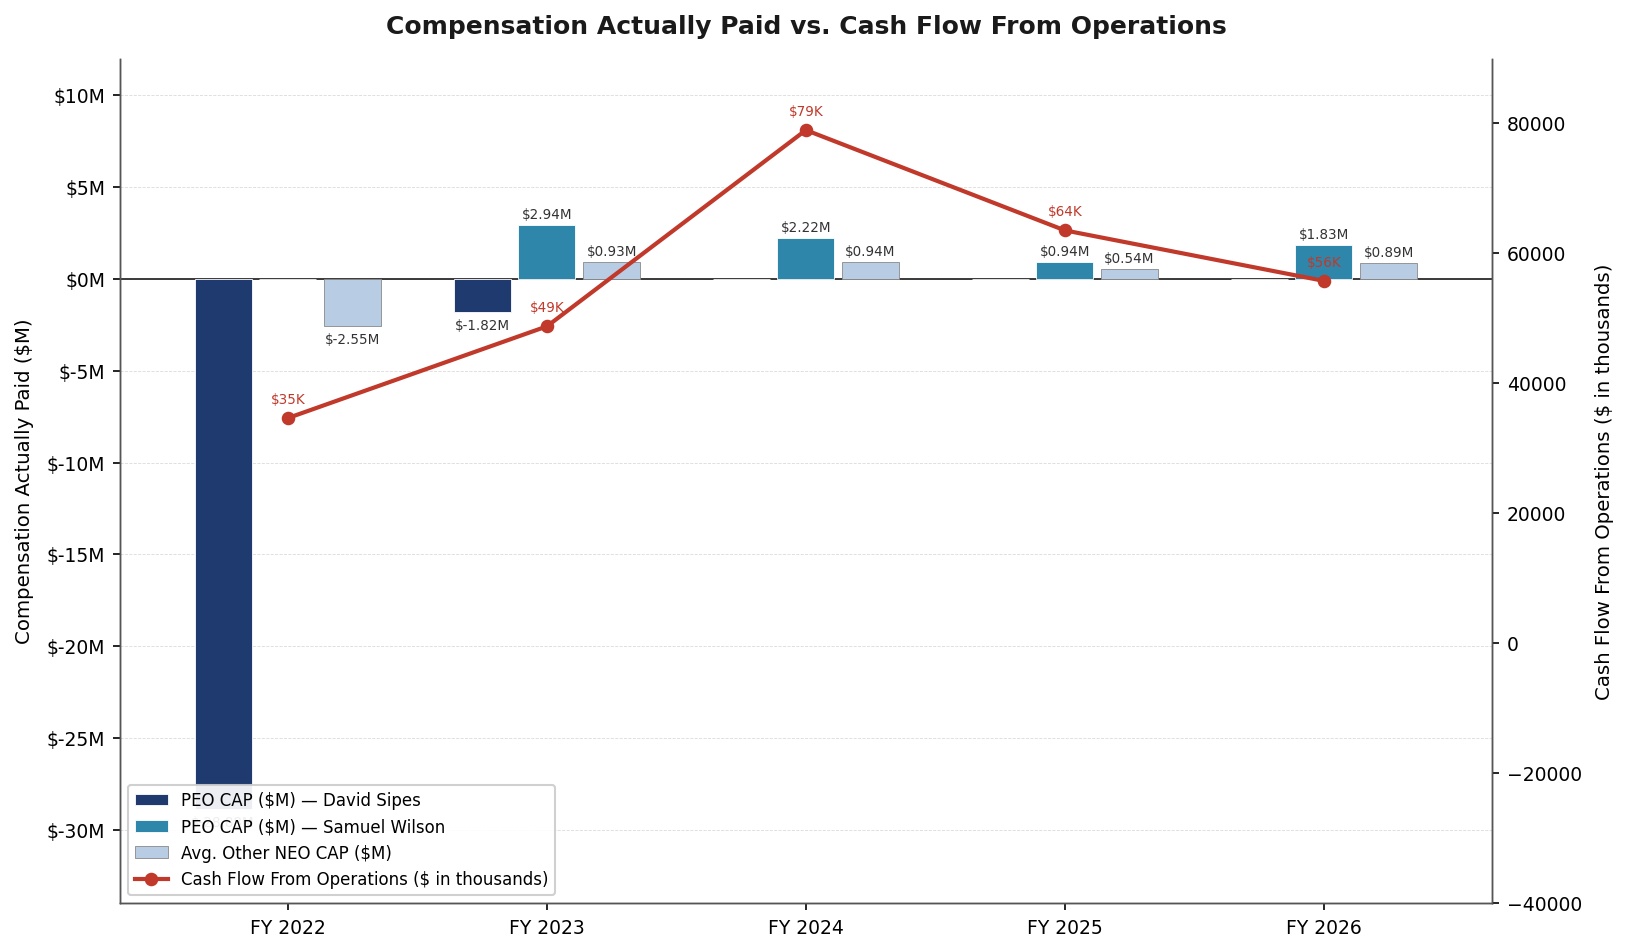
| | | | | | | | | | | | | | | | | | | | | | | | | | | | | | | | | | | | | | | | Summary Compensation Table Total for PEO(1) | | | Compensation Actually Paid to PEO(1)(2) | Average Summary Compensation Table Total for Non-PEO NEOs(3) ($) | Average Compensation Actually Paid to Non-PEO NEOs(2)(3) ($) | Value of Initial
Fixed $100 Investment Based on: | | Cash Flow From Operations(5) ($K) | Fiscal Year | | David Sipes
($) | Samuel
Wilson
($) | | | David
Sipes
($) | Samuel Wilson
($) | Total Shareholder Return(4) ($) | Peer Group Total Shareholder Return(4) ($) | Net Income (Loss)
($K) | | 2026 | | — | | 2,495,614 | | | | — | | 1,833,602 | | 1,094,310 | | 888,129 | | 5.12 | | 111.66 | | 1,648 | | 55,786 | | | 2025 | | — | | 2,240,142 | | | | — | | 939,474 | | 952,146 | | 538,241 | | 6.17 | | 102.98 | | (27,212) | | 63,554 | | | 2024 | | — | | 4,664,103 | | | | — | | 2,216,979 | | 1,711,212 | | 938,524 | | 8.32 | | 82.84 | | (67,592) | | 78,985 | | | 2023 | | 5,089,550 | | 5,044,815 | | | | (1,816,449) | | 2,935,365 | | 1,839,966 | | 929,226 | | 12.85 | | 81.98 | | (73,143) | | 48,786 | | | 2022 | | 6,670,866 | | — | | | | (28,882,064) | | — | | 2,757,663 | | (2,549,356) | | 38.81 | | 93.33 | | (175,383) | | 34,680 | |
|
|
|
|
|
| Company Selected Measure Name |
cash flow from operations
|
|
|
|
|
| Named Executive Officers, Footnote |
Our PEOs were as follows: (a) David Sipes was our PEO for fiscal 2022; (b) Mr. Sipes and Samuel Wilson were our PEOs for fiscal 2023 and (c) Mr. Wilson was our PEO for fiscal 2024, 2025 and 2026.The Non-PEO NEOs for each fiscal year shown in the table were as follows: 2022 — Dejan Deklich, Stephanie Garcia, Matthew Zinn, Hunter Middleton, and Samuel Wilson; 2023 — Kevin Kraus, Matthew Zinn, Laurence Denny, Suzy Seandel, and Hunter Middleton; 2024 and 2025 — Kevin Kraus, Laurence Denny, Hunter Middleton, and Suzy Seandel; 2026 — Kevin Kraus, Laurence Denny, Hunter Middleton, and Suzy Seandel.
|
|
|
|
|
| Peer Group Issuers, Footnote |
The peer group used for this data is the S&P Software and Services Index. The comparison assumes $100 was invested for the period starting March 31, 2021, through the end of the listed fiscal year in each of 8x8 and the comparison index, and that all dividends were reinvested.
|
|
|
|
|
| Adjustment To PEO Compensation, Footnote |
The following are the adjustments made to the Summary Compensation Table totals for fiscal 2026 to determine the amounts shown as Compensation Actually Paid for the PEO and Non-PEO NEOs: | | | | | | | | | | | | | | | | | | | Adjustment | | | | | | | Samuel Wilson | Non-PEO
NEOs (Average) | | (A) Pension Plans—Present Value: Deduct present value of pension benefit accruals | | | | | | | N/A | N/A | | (B) Pension Plans—Add pension service cost and prior service cost | | | | | | | N/A | N/A | | (i) Add: Year-end fair value of equity awards granted in FY2026 that are outstanding and unvested at FYE | | | | | | | 1,540,958 | | 512,426 | | | (ii) Add: Change in year-end fair value of equity awards granted in prior years that are outstanding and unvested at FYE | | | | | | | (483,261) | | (146,043) | | | (iii) Add: Change in fair value from prior FYE to vesting date of awards granted in prior years that vested in FY2026 | | | | | | | (59,595) | | (20,514) | | | (iv) Add: Fair value as of vesting date of awards granted and vested in the same fiscal year | | | | | | | — | | — | | | (v) Deduct: Fair value at prior FYE of awards that failed to meet vesting conditions in FY2026 | | | | | | | — | | — | | (C) = (i)+(ii)+(iii)+(iv)+(v) Total equity award adjustments | | | | | | | 998,102 | | 345,869 | | | (a) SCT Total | | | | | | | 2,495,614 | | 1,094,310 | | | (b) Deduct: Grant date fair value of equity awards granted in FY2026 | | | | | | | (1,660,114) | | (552,050) | | | Compensation Actually Paid = (a) + (b) + (C) | | | | | | | 1,833,602 | | 888,129 | |
|
|
|
|
|
| Non-PEO NEO Average Total Compensation Amount |
$ 1,094,310
|
$ 952,146
|
$ 1,711,212
|
$ 1,839,966
|
$ 2,757,663
|
| Non-PEO NEO Average Compensation Actually Paid Amount |
$ 888,129
|
538,241
|
938,524
|
929,226
|
(2,549,356)
|
| Compensation Actually Paid vs. Total Shareholder Return |
|
|
|
|
|
| Compensation Actually Paid vs. Net Income |
|
|
|
|
|
| Compensation Actually Paid vs. Company Selected Measure |
|
|
|
|
|
| Total Shareholder Return Vs Peer Group |
|
|
|
|
|
| Tabular List, Table |
| | | | | | | Measure | Explanation | | Cash Flow From Operations | Represents the cash generated or used by the Company's business activities and is presented as net cash provided by operating activities in our Form 10-K. | | Service Revenue | Consists of revenue generated from communication services subscriptions, platform usage revenue, and related fees from our UCaaS, CCaaS, and CPaaS offerings. | | Non-GAAP Operating Profit | Non-GAAP Operating Profit excludes amortization of acquired intangible assets, stock-based compensation expense and related employer payroll taxes, transaction-related costs, certain legal and regulatory costs, and certain severance, transition and contract exit costs from GAAP Income from Operations. Management believes that these exclusions help capture the Company’s ongoing operating performance. | | Net New Annual Subscription Revenue | Net new annual subscription revenue is an internal operating metric equal to new subscription bookings minus revenue lost to full cancellations (churn) and partial reductions (down-sells, such as tier drops or reduced seat counts). |
|
|
|
|
|
| Total Shareholder Return Amount |
$ 5.12
|
6.17
|
8.32
|
12.85
|
38.81
|
| Peer Group Total Shareholder Return Amount |
111.66
|
102.98
|
82.84
|
81.98
|
93.33
|
| Net Income (Loss) |
$ 1,648,000
|
$ (27,212,000)
|
$ (67,592,000)
|
$ (73,143,000)
|
$ (175,383,000)
|
| Company Selected Measure Amount |
55,786,000
|
63,554,000
|
78,985,000
|
48,786,000
|
34,680,000
|
| Additional 402(v) Disclosure |
Equity values are calculated in accordance with FASB ASC Topic 718. In fiscal 2026, the Company reinstated its annual cash incentive plan. As a result, our NEOs' compensation consisted of base salary, cash incentive plan awards, time-based restricted stock units (“RSUs”), and Executive Performance Plan PSUs (“EPP PSUs”). The EPP PSUs are subject to performance conditions tied to cumulative cash flow from operations (“CFFO”) and service revenue over three annual measurement periods (fiscal years 2026, 2027, and 2028), with time-based vesting following the Board's certification of each fiscal year's performance results.
|
|
|
|
|
| Measure:: 1 |
|
|
|
|
|
| Pay vs Performance Disclosure |
|
|
|
|
|
| Name |
Cash Flow From Operations
|
|
|
|
|
| Non-GAAP Measure Description |
We determined cash flow from operations to be the most important financial performance measure used to link Company performance to compensation actually paid to our PEOs and Non-PEO NEOs for our most recently completed fiscal year.
|
|
|
|
|
| Measure:: 2 |
|
|
|
|
|
| Pay vs Performance Disclosure |
|
|
|
|
|
| Name |
Service Revenue
|
|
|
|
|
| Measure:: 3 |
|
|
|
|
|
| Pay vs Performance Disclosure |
|
|
|
|
|
| Name |
Non-GAAP Operating Profit
|
|
|
|
|
| Measure:: 4 |
|
|
|
|
|
| Pay vs Performance Disclosure |
|
|
|
|
|
| Name |
Net New Annual Subscription Revenue
|
|
|
|
|
| Samuel Wilson [Member] |
|
|
|
|
|
| Pay vs Performance Disclosure |
|
|
|
|
|
| PEO Total Compensation Amount |
$ 2,495,614
|
$ 2,240,142
|
$ 4,664,103
|
$ 5,044,815
|
|
| PEO Actually Paid Compensation Amount |
$ 1,833,602
|
$ 939,474
|
$ 2,216,979
|
$ 2,935,365
|
|
| PEO Name |
Mr. Wilson
|
Mr. Wilson
|
|
Samuel Wilson
|
|
| David Sipes [Member] |
|
|
|
|
|
| Pay vs Performance Disclosure |
|
|
|
|
|
| PEO Total Compensation Amount |
|
|
|
$ 5,089,550
|
$ 6,670,866
|
| PEO Actually Paid Compensation Amount |
|
|
|
$ (1,816,449)
|
$ (28,882,064)
|
| PEO Name |
|
|
|
Mr. Sipes
|
David Sipes
|
| PEO | Samuel Wilson [Member] | Aggregate Grant Date Fair Value of Equity Award Amounts Reported in Summary Compensation Table |
|
|
|
|
|
| Pay vs Performance Disclosure |
|
|
|
|
|
| Adjustment to Compensation, Amount |
$ (1,660,114)
|
|
|
|
|
| PEO | Samuel Wilson [Member] | Equity Awards Adjustments, Excluding Value Reported in Compensation Table |
|
|
|
|
|
| Pay vs Performance Disclosure |
|
|
|
|
|
| Adjustment to Compensation, Amount |
998,102
|
|
|
|
|
| PEO | Samuel Wilson [Member] | Year-end Fair Value of Equity Awards Granted in Covered Year that are Outstanding and Unvested |
|
|
|
|
|
| Pay vs Performance Disclosure |
|
|
|
|
|
| Adjustment to Compensation, Amount |
1,540,958
|
|
|
|
|
| PEO | Samuel Wilson [Member] | Year-over-Year Change in Fair Value of Equity Awards Granted in Prior Years That are Outstanding and Unvested |
|
|
|
|
|
| Pay vs Performance Disclosure |
|
|
|
|
|
| Adjustment to Compensation, Amount |
483,261
|
|
|
|
|
| PEO | Samuel Wilson [Member] | Vesting Date Fair Value of Equity Awards Granted and Vested in Covered Year |
|
|
|
|
|
| Pay vs Performance Disclosure |
|
|
|
|
|
| Adjustment to Compensation, Amount |
0
|
|
|
|
|
| PEO | Samuel Wilson [Member] | Change in Fair Value as of Vesting Date of Prior Year Equity Awards Vested in Covered Year |
|
|
|
|
|
| Pay vs Performance Disclosure |
|
|
|
|
|
| Adjustment to Compensation, Amount |
59,595
|
|
|
|
|
| PEO | Samuel Wilson [Member] | Prior Year End Fair Value of Equity Awards Granted in Any Prior Year that Fail to Meet Applicable Vesting Conditions During Covered Year |
|
|
|
|
|
| Pay vs Performance Disclosure |
|
|
|
|
|
| Adjustment to Compensation, Amount |
0
|
|
|
|
|
| Non-PEO NEO | Aggregate Grant Date Fair Value of Equity Award Amounts Reported in Summary Compensation Table |
|
|
|
|
|
| Pay vs Performance Disclosure |
|
|
|
|
|
| Adjustment to Compensation, Amount |
(552,050)
|
|
|
|
|
| Non-PEO NEO | Equity Awards Adjustments, Excluding Value Reported in Compensation Table |
|
|
|
|
|
| Pay vs Performance Disclosure |
|
|
|
|
|
| Adjustment to Compensation, Amount |
345,869
|
|
|
|
|
| Non-PEO NEO | Year-end Fair Value of Equity Awards Granted in Covered Year that are Outstanding and Unvested |
|
|
|
|
|
| Pay vs Performance Disclosure |
|
|
|
|
|
| Adjustment to Compensation, Amount |
512,426
|
|
|
|
|
| Non-PEO NEO | Year-over-Year Change in Fair Value of Equity Awards Granted in Prior Years That are Outstanding and Unvested |
|
|
|
|
|
| Pay vs Performance Disclosure |
|
|
|
|
|
| Adjustment to Compensation, Amount |
146,043
|
|
|
|
|
| Non-PEO NEO | Vesting Date Fair Value of Equity Awards Granted and Vested in Covered Year |
|
|
|
|
|
| Pay vs Performance Disclosure |
|
|
|
|
|
| Adjustment to Compensation, Amount |
0
|
|
|
|
|
| Non-PEO NEO | Change in Fair Value as of Vesting Date of Prior Year Equity Awards Vested in Covered Year |
|
|
|
|
|
| Pay vs Performance Disclosure |
|
|
|
|
|
| Adjustment to Compensation, Amount |
20,514
|
|
|
|
|
| Non-PEO NEO | Prior Year End Fair Value of Equity Awards Granted in Any Prior Year that Fail to Meet Applicable Vesting Conditions During Covered Year |
|
|
|
|
|
| Pay vs Performance Disclosure |
|
|
|
|
|
| Adjustment to Compensation, Amount |
$ 0
|
|
|
|
|