| Year | Summary Compensation Table Total for PEO(1) ($) | Compensation Actually Paid to PEO(2)(3) ($) | Average Summary Compensation Table Total for Non-PEO Named Executive Officers(4) ($) | Average Compensation Actually Paid to Non-PEO Named Executive Officers(5)(6) ($) | Value of Initial Fixed $100 Investment Based On Total Shareholder Return(7) ($) | Net
Income ($) | ||||||||||||||||||
| 2025 | 1,351,676 | 1,653,976 | 1,024,950 | 1,027,089 | 118.79 | 4,973 | ||||||||||||||||||
| 2024 | 2,461,736 | 151,240 | 997,723 | (20,190 | ) | 67.12 | (16,449 | ) | ||||||||||||||||
| 2023 | 1,712,158 | 2,367,852 | 1,060,996 | 1,244,649 | 171.21 | 660 | ||||||||||||||||||
| PEO | |||||
| Summary Compensation Table Total for 2025 | $ | 1,351,676 | |||
| Deduct: | Stock awards(a) | (588,812 | ) | ||
| Deduct: | Option awards(b) | 0 | |||
Add: |
Year-end value of equity awards granted during the year that are outstanding and unvested(c) | 308,051 | |||
| Add: | Change in fair value of equity awards granted in prior years that are outstanding and unvested(d) | 567,538 | |||
| Add: | Change in fair value of equity awards granted in prior years that vested during the year(e) | 15,523 | |||
Deduct: |
Average fair value of equity awards granted in prior years that fail to meet the applicable vesting conditions during the year | 0 | |||
| Add: | Value of dividend equivalents accrued on equity awards during the year | 0 | |||
| Compensation Actually Paid for 2025 | 1,653,976 | ||||
| Summary Compensation Table Total for 2024 | $ | 2,461,736 | |||
| Deduct: | Stock awards(a) | (1,807,132 | ) | ||
| Deduct: | Option awards(b) | 0 | |||
| Add: | Year-end value of equity awards granted during the year that are outstanding and unvested(c) | 321,918 | |||
| Add: | Change in fair value of equity awards granted in prior years that are outstanding and unvested(d) | (178,969 | ) | ||
| Add: | Change in fair value of equity awards granted in prior years that vested during the year(e) | (646,313 | ) | ||
Deduct: |
Average fair value of equity awards granted in prior years that fail to meet the applicable vesting conditions during the year | 0 | |||
| PEO | |||||
| Add: Value of dividend equivalents accrued on equity awards during the year | 0 | ||||
| Compensation Actually Paid for 2024 | 151,240 | ||||
| Summary Compensation Table Total for 2023 | $ | 1,712,158 | |||
| Deduct: | Stock awards(a) | (209,059 | ) | ||
| Deduct: | Option awards(b) | (209,266 | ) | ||
| Add: | Year-end value of equity awards granted during the year that are outstanding and unvested(c) | 381,459 | |||
| Add: | Change in fair value of equity awards granted in prior years that are outstanding and unvested(d) | 346,348 | |||
| Add: | Change in fair value of equity awards granted in prior years that vested during the year(e) | 346,212 | |||
Deduct: |
Average fair value of equity awards granted in prior years that fail to meet the applicable vesting conditions during the year | 0 | |||
| Add: | Value of dividend equivalents accrued on equity awards during the year | 0 | |||
| Compensation Actually Paid for 2023 | 2,367,852 | ||||
| (a) | Represents the total of the amounts reported in the “Stock Awards” column in the Summary Compensation Table for the applicable year. |
| (b) | Represents the total of the amounts reported in the “Option Awards” column in the Summary Compensation Table for the applicable year. |
| (c) | Represents the year-end value of equity awards granted during the applicable year that are outstanding and unvested as of the end of such applicable year. |
| (d) | Represents the amount of change as of the end of the applicable year (from the end of the prior fiscal year) in fair value of any equity awards granted in prior years that are outstanding and unvested as of the end of such applicable year. |
| (e) | Represents the amount of change as of the vesting date (from the end of the prior fiscal year) in fair value of any equity awards granted in prior years that vested during the applicable year. |
| Average Non-PEO Named Executive Officers | |||||
| Average Summary Compensation Table Total for 2025 | $ | 1,024,950 | |||
| Deduct: | Average stock awards(a) | (414,131 | ) | ||
| Deduct: | Average option awards(b) | 0 | |||
| Add: | Average year-end value of equity awards granted during the year that are outstanding and unvested(c) | 216,662 | |||
| Add: | Average change in fair value of equity awards granted in prior years that are outstanding and unvested(d) | 177,626 | |||
| Add: | Average change in fair value of equity awards granted in prior years that vested during the year(e) | 21,982 | |||
| Deduct: | Average fair value of equity awards granted in prior years that fail to meet the applicable vesting conditions during the year | 0 | |||
| Add: | Average value of dividend equivalents accrued on equity awards during the year | 0 | |||
| Average Compensation Actually Paid for 2025 | 1,027,089 | ||||
| Average Summary Compensation Table Total for 2024 | $ | 997,723 | |||
| Deduct: | Average stock awards(a) | (440,672 | ) | ||
| Deduct: | Average option awards(b) | 0 | |||
| Add: | Average year-end value of equity awards granted during the year that are outstanding and unvested(c) | 51,483 | |||
| Add: | Average change in fair value of equity awards granted in prior years that are outstanding and unvested(d) | (164,116 | ) | ||
| Add: | Average change in fair value of equity awards granted in prior years that vested during the year(e) | (50,094 | ) | ||
| Deduct: | Average fair value of equity awards granted in prior years that fail to meet the applicable vesting conditions during the year(f) | 414,514 | |||
| Add: | Average value of dividend equivalents accrued on equity awards during the year | 0 | |||
| Average Compensation Actually Paid for 2024 | (20,190 | ) | |||
| Average Summary Compensation Table Total for 2023 | $ | 1,060,996 | |||
| Deduct: | Average stock awards(a) | (174,872 | ) | ||
| Deduct: | Average option awards(b) | (176,503 | ) | ||
| Add: | Average year-end value of equity awards granted during the year that are outstanding and unvested(c) | 382,803 | |||
| Add: | Average change in fair value of equity awards granted in prior years that are outstanding and unvested(d) | 94,066 | |||
| Add: | Average change in fair value of equity awards granted in prior years that vested during the year(e) | 58,159 | |||
| Deduct: | Average fair value of equity awards granted in prior years that fail to meet the applicable vesting conditions during the year | 0 | |||
| Add: Average value of dividend equivalents accrued on equity awards during the year | 0 | ||||
| Average Compensation Actually Paid for 2023 | 1,244,649 | ||||
| (a) | Represents the average of the total of the amounts reported in the “Stock Awards” column in the Summary Compensation Table for the applicable year. |
| (b) | Represents the average of the total of the amounts reported in the “Option Awards” column in the Summary Compensation Table for the applicable year. |
| (c) | Represents the average of the year-end value of equity awards granted during the applicable year that are outstanding and unvested as of the end of such applicable year. |
| (d) | Represents the average of the amount of change as of the end of the applicable year (from the end of the prior fiscal year) in fair value of any equity awards granted in prior years that are outstanding and unvested as of the end of such applicable year. |
| (e) | Represents the average of the amount of change as of the vesting date (from the end of the prior fiscal year) in fair value of any equity awards granted in prior years that vested during the applicable year. |
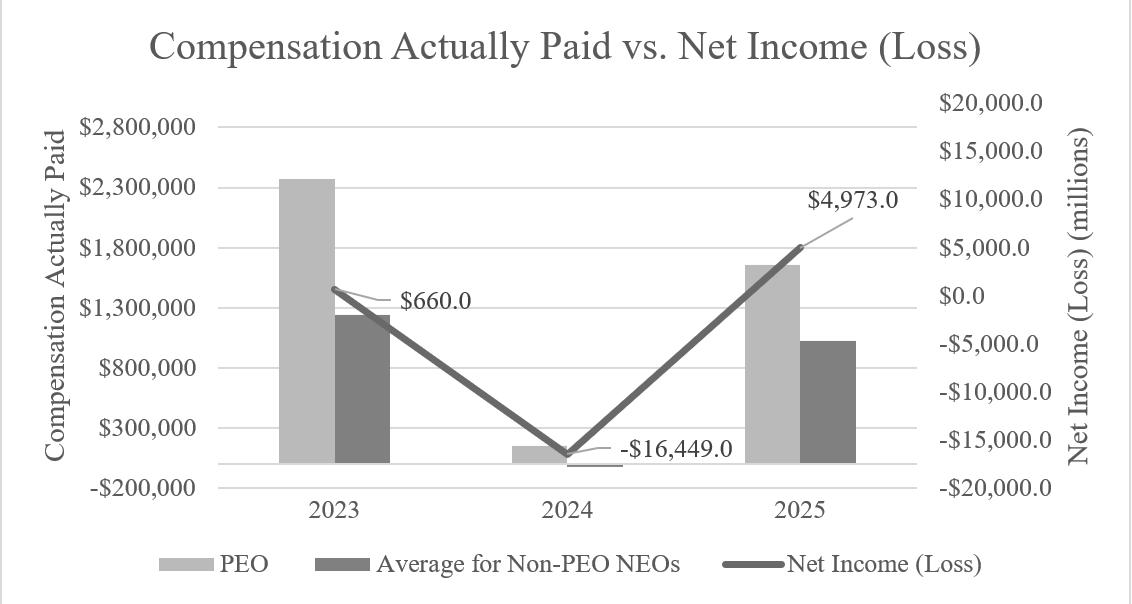
Compensation Actually Paid and Net Income (Loss). As demonstrated by the following graph, the amount of compensation actually paid to our NEOs is somewhat aligned with our net income (loss) for each of the three years presented in the Pay versus Performance table.
| [1] | Amounts reported represent the Summary Compensation Table total for our CEO for each of the years presented. See “Executive Compensation—Summary Compensation Table.” |
| [2] | Amounts reported represent compensation actually paid to our CEO for each of the years presented. The dollar amounts in this column do not reflect the actual amount of compensation earned by or paid to our CEO during the applicable year. |
| [3] | Compensation actually paid to our PEO consists of the following amounts deducted from or added to the Summary Compensation Table total for our CEO for each of the years presented: |
| [4] | Average Summary Compensation Table total for non-PEO named executive officers reflects the average Summary Compensation Table total for Scott C. Neils and Mark A. Schallenberger for 2025, for Scott C. Neils, Mark A. Schallenberger and Kevin D. Brandt (a former executive officer) for 2024, and Kevin D. Brandt and Mark A. Schallenberger for 2023. |
| [5] | Average compensation actually paid to non-PEO named executive officers reflects the average compensation actually paid to Scott C. Neils and Mark A. Schallenberger for 2025, Scott C. Neils, Mark A. Schallenberger and Kevin D. Brandt for 2024, and Kevin D. Brandt and Mark A. Schallenberger for 2023 and consists of the following average amounts deducted from and added to the average Summary Compensation Table total for the non-PEO named executive officers for each of the years presented: |
| [6] | The amounts in this column represent the average compensation actually paid to the non-PEOs for each of the years presented. The dollar amounts in this column do not reflect the actual average amount of compensation earned by or paid to the non-PEOs during the applicable year. |
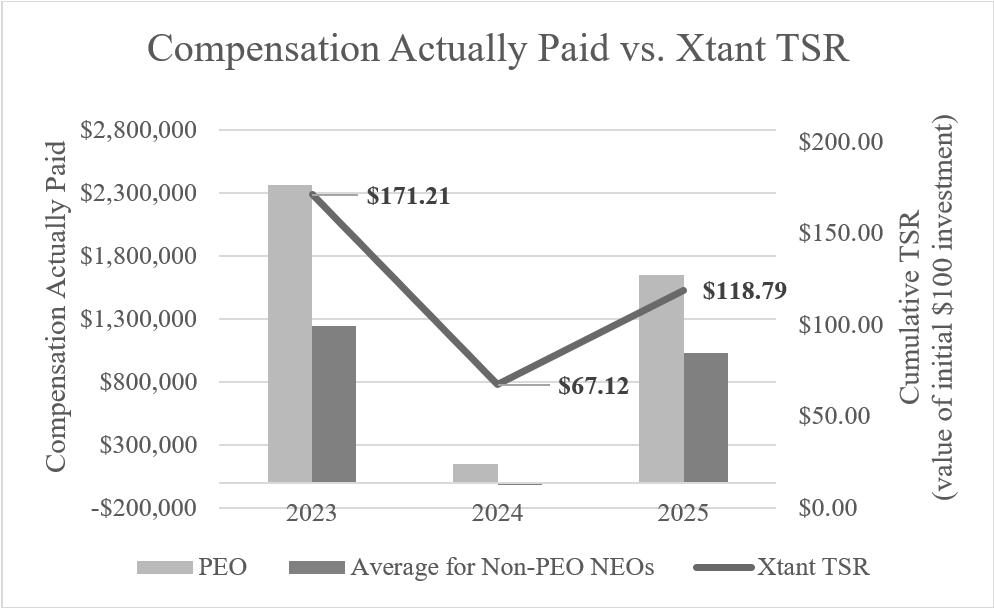
| [7] | The total shareholder return is calculated based on the difference between our common stock price at the end of the measurement period and our common stock price at the beginning of the measurement period and assuming the investment of $100 on December 31, 2022. Because we do not pay any dividends, our total stockholder return does not assume the reinvestment of dividends. |
| [8] | Amounts reported represent the amount of net income (loss) reflected in our audited consolidated financial statements for the applicable year and is presented in thousands. |
| [9] | Represents the total of the amounts reported in the “Stock Awards” column in the Summary Compensation Table for the applicable year. |
| [10] | Represents the total of the amounts reported in the “Option Awards” column in the Summary Compensation Table for the applicable year. |
| [11] | Represents the year-end value of equity awards granted during the applicable year that are outstanding and unvested as of the end of such applicable year. |
| [12] | Represents the amount of change as of the end of the applicable year (from the end of the prior fiscal year) in fair value of any equity awards granted in prior years that are outstanding and unvested as of the end of such applicable year. |
| [13] | Represents the amount of change as of the vesting date (from the end of the prior fiscal year) in fair value of any equity awards granted in prior years that vested during the applicable year. |
| [14] | Represents the average of the total of the amounts reported in the “Stock Awards” column in the Summary Compensation Table for the applicable year. |
| [15] | Represents the average of the total of the amounts reported in the “Option Awards” column in the Summary Compensation Table for the applicable year. |
| [16] | Represents the average of the year-end value of equity awards granted during the applicable year that are outstanding and unvested as of the end of such applicable year. |
| [17] | Represents the average of the amount of change as of the end of the applicable year (from the end of the prior fiscal year) in fair value of any equity awards granted in prior years that are outstanding and unvested as of the end of such applicable year. |
| [18] | Represents the average of the amount of change as of the vesting date (from the end of the prior fiscal year) in fair value of any equity awards granted in prior years that vested during the applicable year. |