Summary
|
| Average Summary Compensation Table | Average Compensation Actually | Value of Initial Fixed $100 Investment Based On(5): | ||||||||||||||||||||||||
| Year |
Compensation Table Total for PEO(1) |
Compensation Actually Paid toPEO(2) |
Total for Non-PEO NEOs(3) |
Paid to Non-PEO NEOs(4) | Total Shareholder Return(6) |
Net Income (millions)(7) |
Adjusted EBITDA (millions)(8) | |||||||||||||||||||||
| (a) | (b) | (c) | (d) | (e) | (f) | (g) | (h) | |||||||||||||||||||||
| 2025 | $ | 708,192 | $ | 708,192 | 468,265 | $ | 468,265 | $ | 118 | $ | 24.6 | $ | 5.4 | |||||||||||||||
| 2024 | $ | 703,792 | $ | 703,792 | 434,533 | $ | 473,283 | $ | 260 | $ | 6.7 | $ | 8.7 | |||||||||||||||
| 2023 | $ | 678,407 | $ | 608,074 | 332,038 | $ | 343,862 | $ | 104 | $ | 2.0 | $ | 5.6 | |||||||||||||||
| Year | Reported Summary Compensation Table Total for PEO | Equity Award Adjustments(b) | Compensation Actually Paid to PEO | |||||||||
| 2025 | $ | 708,192 | $ | $ | 708,192 | |||||||
| 2024 | $ | 703,792 | $ | $ | 703,792 | |||||||
| 2023 | $ | 678,407 | $ | (70,333 | ) | $ | 608,074 |
| (a) | The grant date fair value of equity awards represents the total of the amounts reported in the “Stock Awards” column in the Summary Compensation Table for the applicable year. | |
| (b) | The equity award adjustments for each applicable year include the addition (or subtraction, as applicable) of the following: (i) the year-end fair value of any equity awards granted in the applicable year that are outstanding and unvested as of the end of the year; (ii) the amount of change as of the end of the applicable year (from the end of the prior fiscal year) in fair value of any awards granted in prior years that are outstanding and unvested as of the end of the applicable year; (iii) for awards that are granted and vest in same applicable year, the fair value as of the vesting date; (iv) for awards granted in prior years that vest in the applicable year, the amount equal to the change as of the vesting date (from the end of the prior fiscal year) in fair value; (v) for awards granted in prior years that are determined to fail to meet the applicable vesting conditions during the applicable year, a deduction for the amount equal to the fair value at the end of the prior fiscal year; and (vi) the dollar value of any dividends or other earnings paid on stock or option awards in the applicable year prior to the vesting date that are not otherwise reflected in the fair value of such award or included in any other component of total compensation for the applicable year. The valuation assumptions used to calculate fair values did not materially differ from those disclosed at the time of grant. |
| Year | Average Reported Summary Compensation Table Total for Non-PEO NEOs | Average Reported Value of Equity Awards | Average Equity Award Adjustments(a) | Average Compensation Actually Paid to Non-PEO NEOs | ||||||||||||
| 2025 | $ | 468,265 | $ | $ | $ | 468,265 | ||||||||||
| 2024 | $ | 434,533 | $ | 38,750 | $ | $ | 473,283 | |||||||||
| 2023 | $ | 332,038 | $ | 25,000 | $ | (13,176 | ) | $ | 343,862 |
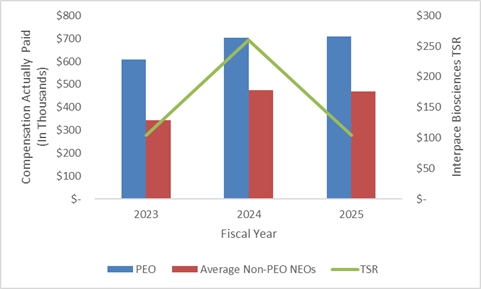
The following chart sets forth the relationship between compensation actually paid to our CEO, the average of compensation actually paid to our non-CEO NEOs, and the cumulative TSR of the Company over the three most recently completed fiscal years. The Company does not award compensation to executives based on TSR results, and most of the compensation reported below relates to salary and bonuses earned during the past three years.
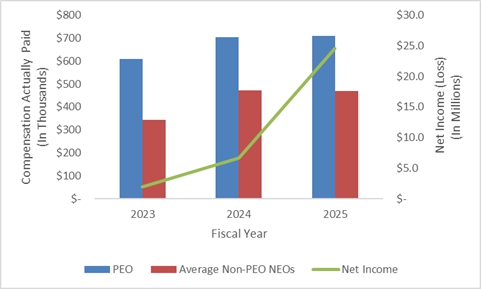
Compensation Actually Paid and Net Income
As demonstrated by the following table, the amount of compensation actually paid to Mr. Burnell and the average amount of compensation actually paid to the NEOs as a group (excluding Mr. Burnell) is aligned with the Company’s net income over the three-year period. The Company does not use net income/(loss) as a performance measure in the overall executive compensation program. In addition, our short-term cash incentives are tied to adjusted EBITDA among other metrics, and the value of total compensation awarded to the NEOs through short-term incentives will vary from year-to-year.
Relationship of Executive Compensation Actually Paid to Net Income
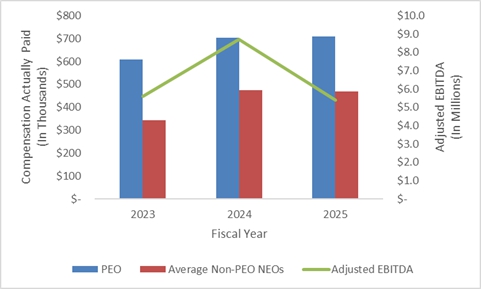
Compensation Actually Paid and Adjusted EBITDA
The following chart sets forth the relationship between compensation actually paid to our CEO, the average of compensation actually paid to our non-CEO NEOs, and Adjusted EBITDA during the three most recently completed fiscal years. See “Reconciliation of Adjusted EBITDA” above for details regarding the tax benefit received in 2025. Adjusted EBITDA is a metric used by management to measure cash flow of the ongoing business and will often vary significantly from the Company’s net income/loss as the impact of taxes, discontinued operations, and non-cash expenses are excluded from Adjusted EBITDA.
Relationship of Executive Compensation Actually Paid to Adjusted EBITDA
| [1] | The dollar amounts reported in column (b) are the amounts of total compensation reported for Mr. Burnell (our President, Chief Executive Officer and Chairman of the Board) for each corresponding year in the “Total” column of the Summary Compensation Table. Refer to “Information About Our Executive Compensation.” |
| [2] | The dollar amounts reported in column (c) represent the amount of “compensation actually paid” to Mr. Burnell, as computed in accordance with Item 402(v) of Regulation S-K. The dollar amounts do not reflect the actual amount of compensation earned by or paid to Mr. Burnell during the applicable year. In accordance with the requirements of Item 402(v) of Regulation S-K, the following adjustments were made to Mr. Burnell’s total compensation for each year to determine the compensation actually paid which is reported above: |
| [3] | The dollar amounts reported in column (d) represent the average of the amounts reported for the NEOs as a group (excluding Mr. Burnell, who has served as our President, Chief Executive Officer and Chairman of the Board) in the “Total” column of the Summary Compensation Table in each applicable year. Chris McCarthy, Chief Financial Officer, was the only non-PEO NEO included for purposes of calculating the average amounts in each applicable year. |
| [4] | The dollar amounts reported in column (e) represent the average amount of “compensation actually paid” to the NEOs as a group (excluding Mr. Burnell), as computed in accordance with Item 402(v) of Regulation S-K. The dollar amounts do not reflect the actual average amount of compensation earned by or paid to the NEOs as a group (excluding Mr. Burnell) during the applicable year. In accordance with the requirements of Item 402(v) of Regulation S-K, the following adjustments were made to average total compensation for the NEOs as a group (excluding Mr. Burnell) for each year to determine the compensation actually paid, using the same methodology described above in Note 3: |
| [5] | Cumulative TSR is calculated by taking the difference between the Company’s share price at the end and the beginning of the applicable measurement period by the Company’s share price at the beginning of the applicable measurement period. |
| [6] | The TSR figures, assuming a $100 investment on January 1, 2023, would be as follows: 2023 – $104; 2024 – $260; 2025 – $118. |
| [7] | The dollar amounts reported represent the amount of net income reflected in the Company’s audited financial statements for the applicable year. |
| [8] | Adjusted EBITDA is defined as income or loss from continuing operations, plus depreciation and amortization, non-cash stock-based compensation, interest and taxes, and other non-cash expenses including change in fair value of notes payable. While the Company uses numerous financial and non-financial performance measures for the purpose of evaluating performance for the Company’s compensation programs, the Company has determined that Adjusted EBITDA is the financial performance measure that, in the Company’s assessment, represents the most important performance measure (that is not otherwise required to be disclosed in the table) used by the company to link compensation actually paid to the NEOs, for the most recently completed fiscal year, to company performance. Adjusted EBITDA is a non-generally accepted accounting principles financial measure. The tables below show the Company’s Adjusted EBITDA reconciled to the comparable GAAP financial metric included in this Proxy Statement. |
| [9] | The equity award adjustments for each applicable year include the addition (or subtraction, as applicable) of the following: (i) the year-end fair value of any equity awards granted in the applicable year that are outstanding and unvested as of the end of the year; (ii) the amount of change as of the end of the applicable year (from the end of the prior fiscal year) in fair value of any awards granted in prior years that are outstanding and unvested as of the end of the applicable year; (iii) for awards that are granted and vest in same applicable year, the fair value as of the vesting date; (iv) for awards granted in prior years that vest in the applicable year, the amount equal to the change as of the vesting date (from the end of the prior fiscal year) in fair value; (v) for awards granted in prior years that are determined to fail to meet the applicable vesting conditions during the applicable year, a deduction for the amount equal to the fair value at the end of the prior fiscal year; and (vi) the dollar value of any dividends or other earnings paid on stock or option awards in the applicable year prior to the vesting date that are not otherwise reflected in the fair value of such award or included in any other component of total compensation for the applicable year. The valuation assumptions used to calculate fair values did not materially differ from those disclosed at the time of grant. |
| [10] | The grant date fair value of equity awards represents the total of the amounts reported in the “Stock Awards” column in the Summary Compensation Table for the applicable year. |