Pay vs Performance Disclosure - USD ($)
Mar. 31, 2026
Mar. 31, 2025
Mar. 31, 2024
Pay Versus Performance
In accordance with rules adopted by the SEC pursuant to the Dodd-Frank Wall Street Reform and Consumer Protection Act of 2010, we are providing the following disclosure regarding executive “compensation actually paid” (“CAP”), as calculated per SEC disclosure rules, in accordance with the rules applicable to smaller reporting companies. CAP represents a required calculation of compensation that differs significantly from the Summary Compensation Table calculation of compensation, the NEO realized or earned compensation, as well as from the way in which the compensation committee views annual compensation decisions. The amounts in the table below are calculated in accordance with SEC rules and do not represent amounts actually earned or realized by NEOs, including with respect to equity awards which remain subject to forfeiture if the vesting conditions are not satisfied.
Fiscal Year |
Summary Compensation Table Total for CEO Sally A. Washlow $ |
Summary Compensation Table Total for CEO Michael H. Jenkins $ |
Compensation Actually Paid to CEO Sally A. Washlow(1) $ |
Compensation Actually Paid to CEO Michael H. Jenkins(1) $ |
Average Summary Compensation Table Total for Non-CEO NEOs $ |
Average Compensation Actually Paid to Non-CEO NEOs(1) $ |
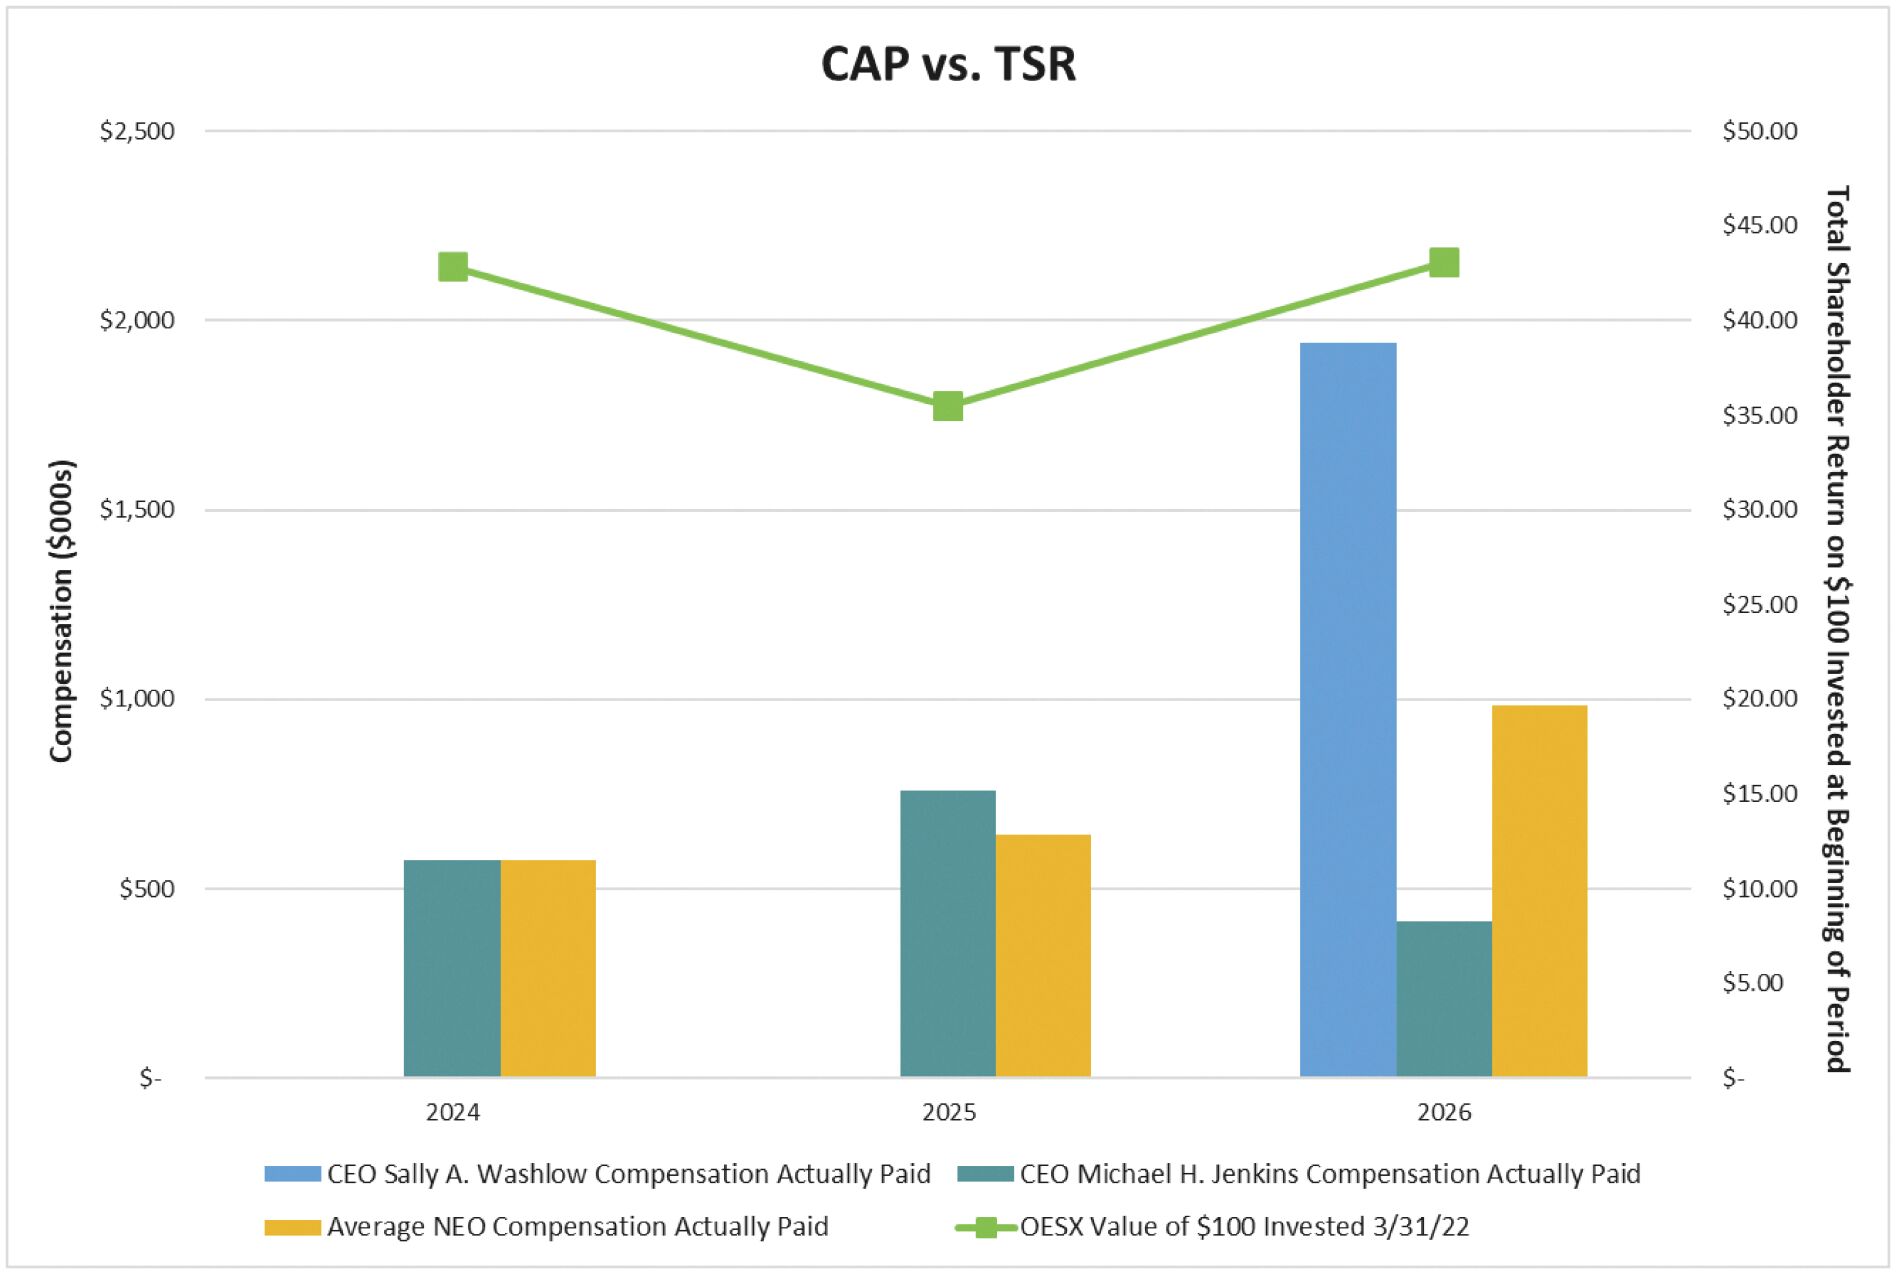
Value of Initial Fixed $100 Investment Based on the Total Shareholder Return |
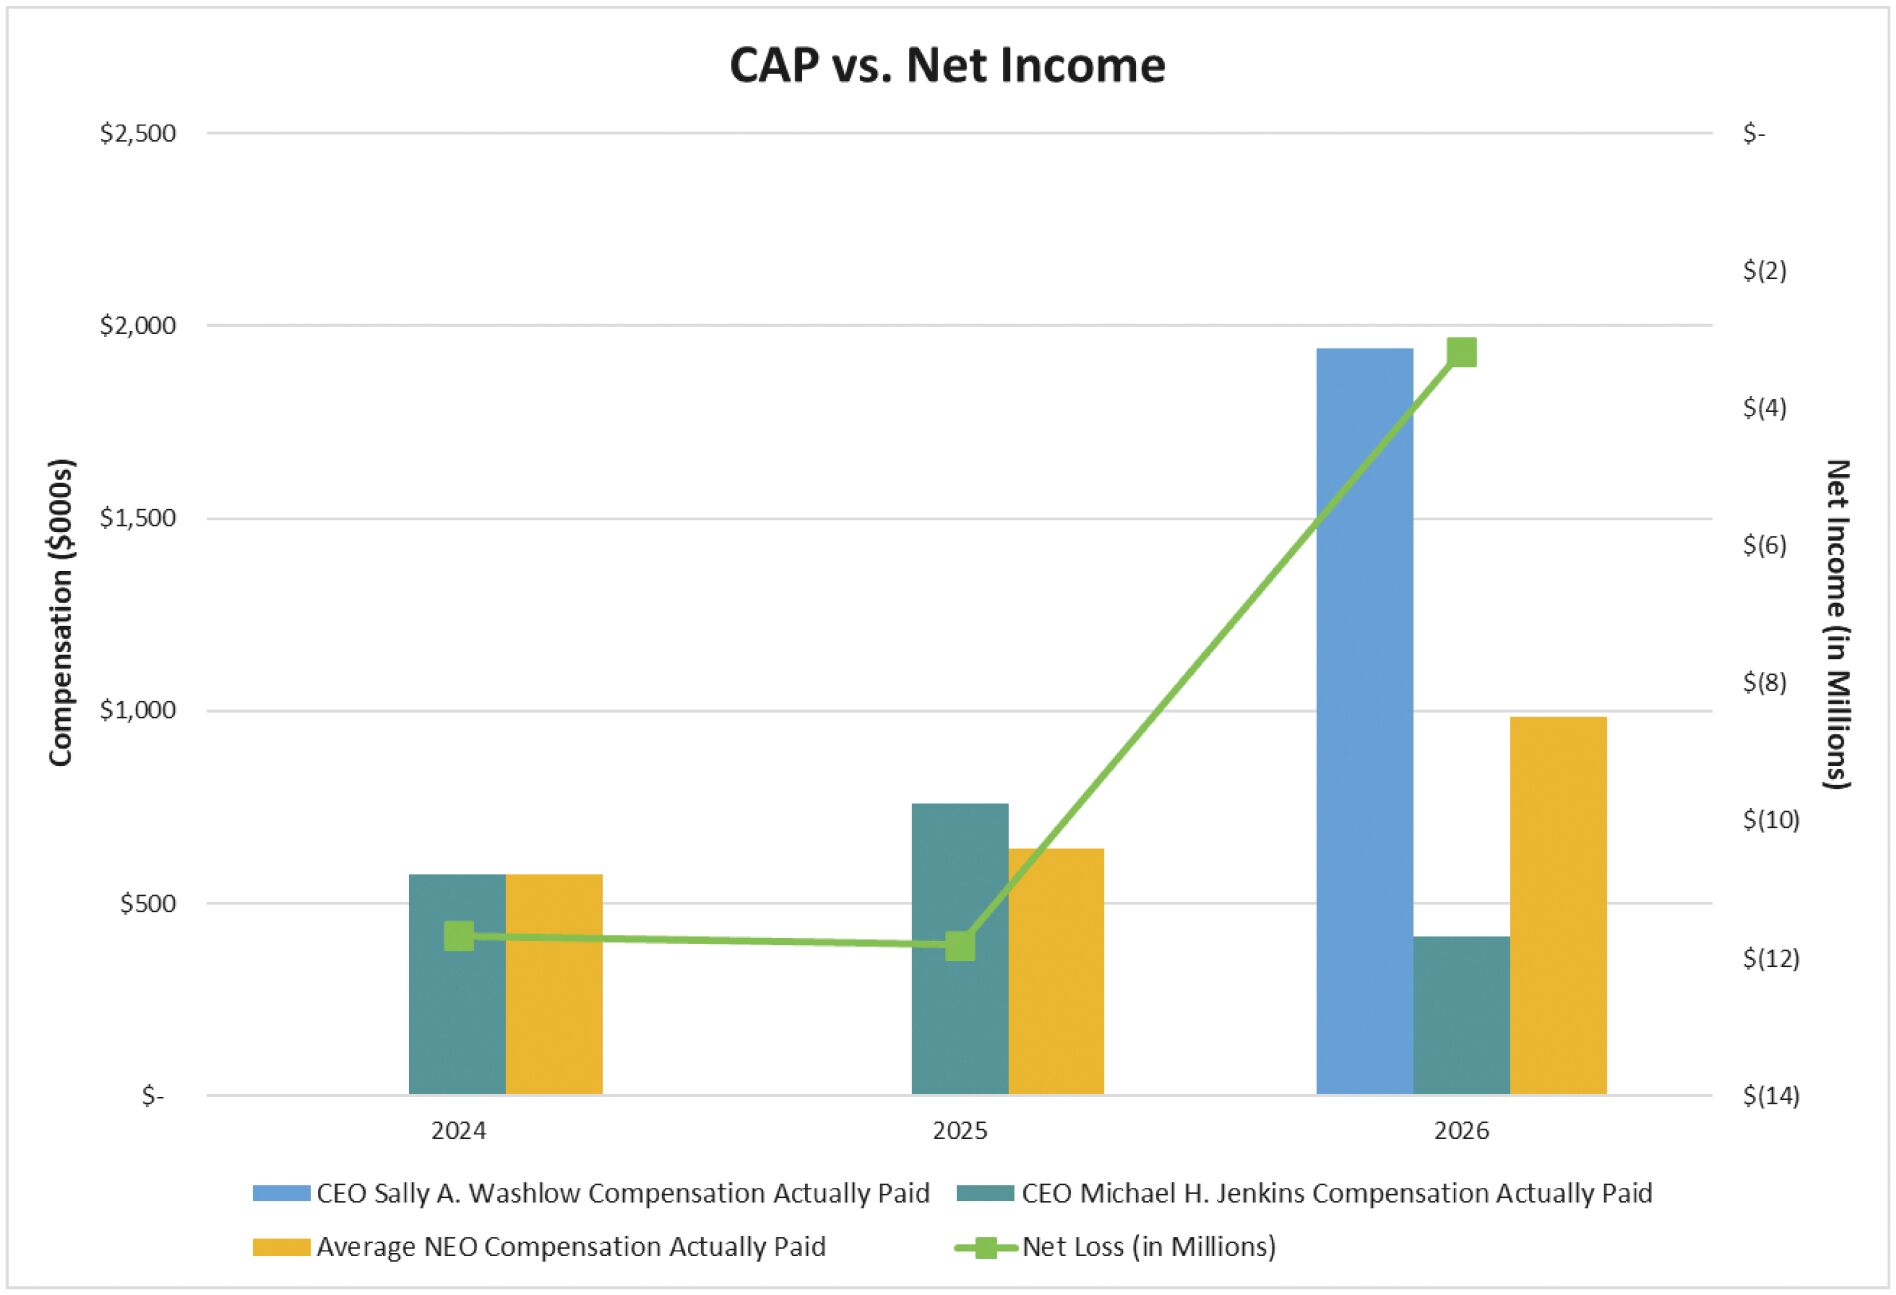
Net Income (in millions) $ |
||||||||||||||||||||||||
2026 |
$ | 1,783,732 | $ | 412,718 | $ | 1,977,499 | $ | 412,718 | $ | 742,398 | $ | 855,379 | $ | 43.05 | $ | (3.2 | ) | |||||||||||||||
2025 |
$ | — | $ | 1,004,244 | $ | — | $ | 759,815 | $ | 809,177 | $ | 641,933 | $ | 82.76 | $ | (13.6 | ) | |||||||||||||||
2024 |
$ | — | $ | 989,362 | $ | — | $ | 574,052 | $ | 836,452 | $ | 574,144 | $ | 42.86 | $ | (15.7 | ) | |||||||||||||||
| (1) | Deductions from, and additions to, total compensation in the Summary Compensation Table by year to calculate Compensation Actually Paid include: |
Fiscal 2026 |
Fiscal 2025 |
Fiscal 2024 |
||||||||||||||||||||||
CEO Sally A. Washlow |
Average Non-CEO NEOs |
CEO Michael H. Jenkins |
Average Non-CEO NEOs |
CEO Michael H. Jenkins |
Average Non-CEO NEOs |
|||||||||||||||||||
Total Compensation from Summary Compensation Table |
$ | 1,783,732 | $ | 742,398 | $ | 1,004,244 | $ | 809,177 | $ | 989,362 | $ | 836,452 | ||||||||||||
Adjustments for Equity Awards |
||||||||||||||||||||||||
Adjustment for grant date values in the Summary Compensation Table |
$ | (420,200 | ) | $ | (150,125 | ) | $ | (510,000 | ) | $ | (342,000 | ) | $ | (510,000 | ) | $ | (342,000 | ) | ||||||
Year-end fair value of unvested awards granted in the current year |
611,800 | 218,500 | $ | 336,881 | $ | 225,909 | $ | 286,258 | $ | 191,962 | ||||||||||||||
Year-over-year difference of year-end fair values for unvested awards granted in prior years |
$ | 3,821 | $ | 58,010 | (56,731 | ) | $ | (38,759 | ) | $ | (149,650 | ) | $ | (92,885 | ) | |||||||||
Fair values at vest date for awards granted and vested in current year |
— | — | — | — | — | — | ||||||||||||||||||
Difference in fair values between prior year-end fair values and vest date fair values for awards granted in prior years |
$ | (1,654 | ) | $ | (13,404 | ) | $ | (14,579 | ) | $ | (12,394 | ) | $ | (41,918 | ) | $ | (19,385 | ) | ||||||
Forfeitures during current year equal to prior year-end fair value |
$ | — | $ | — | $ | — | $ | — | $ | — | $ | — | ||||||||||||
Dividends or dividend equivalents not otherwise included in total compensation |
$ | — | $ | — | $ | — | $ | — | $ | — | $ | — | ||||||||||||
Total Adjustments for Equity Awards |
$ |
193,767 |
$ |
112,981 |
$ |
(244,429 |
) |
$ |
(167,244 |
) |
$ |
(415,310 |
) |
$ |
(262,308 |
) | ||||||||
Compensation Actually Paid (as calculated) |
$ |
1,977,499 |
$ |
855,379 |
$ |
759,815 |
$ |
641,933 |
$ |
574,052 |
$ |
574,144 |
||||||||||||
| 2) | Non-CEO NEOs reflect the average Summary Compensation Table total compensation and average Compensation Actually Paid for the following executives by fiscal year: |
2026: J. Per Brodin, Scott A. Green,
Michael
H. Jenkins 2025: J. Per Brodin, Scott A. Green
2024: J. Per Brodin, Scott A. Green
| 3) | Total Shareholder Return is determined based on the value of an initial fixed investment of $100 in OESX as of March 31, 2023. |
| 2) | Non-CEO NEOs reflect the average Summary Compensation Table total compensation and average Compensation Actually Paid for the following executives by fiscal year: |
2026: J. Per Brodin, Scott A. Green,
Michael
H. Jenkins 2025: J. Per Brodin, Scott A. Green
2024: J. Per Brodin, Scott A. Green
| (1) | Deductions from, and additions to, total compensation in the Summary Compensation Table by year to calculate Compensation Actually Paid include: |
Fiscal 2026 |
Fiscal 2025 |
Fiscal 2024 |
||||||||||||||||||||||
CEO Sally A. Washlow |
Average Non-CEO NEOs |
CEO Michael H. Jenkins |
Average Non-CEO NEOs |
CEO Michael H. Jenkins |
Average Non-CEO NEOs |
|||||||||||||||||||
Total Compensation from Summary Compensation Table |
$ | 1,783,732 | $ | 742,398 | $ | 1,004,244 | $ | 809,177 | $ | 989,362 | $ | 836,452 | ||||||||||||
Adjustments for Equity Awards |
||||||||||||||||||||||||
Adjustment for grant date values in the Summary Compensation Table |
$ | (420,200 | ) | $ | (150,125 | ) | $ | (510,000 | ) | $ | (342,000 | ) | $ | (510,000 | ) | $ | (342,000 | ) | ||||||
Year-end fair value of unvested awards granted in the current year |
611,800 | 218,500 | $ | 336,881 | $ | 225,909 | $ | 286,258 | $ | 191,962 | ||||||||||||||
Year-over-year difference of year-end fair values for unvested awards granted in prior years |
$ | 3,821 | $ | 58,010 | (56,731 | ) | $ | (38,759 | ) | $ | (149,650 | ) | $ | (92,885 | ) | |||||||||
Fair values at vest date for awards granted and vested in current year |
— | — | — | — | — | — | ||||||||||||||||||
Difference in fair values between prior year-end fair values and vest date fair values for awards granted in prior years |
$ | (1,654 | ) | $ | (13,404 | ) | $ | (14,579 | ) | $ | (12,394 | ) | $ | (41,918 | ) | $ | (19,385 | ) | ||||||
Forfeitures during current year equal to prior year-end fair value |
$ | — | $ | — | $ | — | $ | — | $ | — | $ | — | ||||||||||||
Dividends or dividend equivalents not otherwise included in total compensation |
$ | — | $ | — | $ | — | $ | — | $ | — | $ | — | ||||||||||||
Total Adjustments for Equity Awards |
$ |
193,767 |
$ |
112,981 |
$ |
(244,429 |
) |
$ |
(167,244 |
) |
$ |
(415,310 |
) |
$ |
(262,308 |
) | ||||||||
Compensation Actually Paid (as calculated) |
$ |
1,977,499 |
$ |
855,379 |
$ |
759,815 |
$ |
641,933 |
$ |
574,052 |
$ |
574,144 |
||||||||||||
CAP and Cumulative TSR
CAP and Company Net Income