Shareholder Report
Apr. 30, 2026
USD ($)
Holding
HardingLoevnerFunds.com
. You can also requestthis information by calling (877) 435-8105 or by sending an e-mail request to hardingloevnerfunds@ntrs.com.
What were
the
Fund costs for the period?(based on a hypothetical $10,000 investment)
| Fund (Class) | Costs of a $10,000 investment | Costs paid as a percentage of a $10,000 investment 1 |
| Global Equity (Advisor Class) | $ 58 | 1.15 % |
1 | Expense ratio is expressed on an annualized basis. |
Management’s Discussion of Fund Performance
The Global Equity Advisor Class (HLMGX) increased 2.87% (net of fees and expenses) in the six-month period ended April 30, 2026. The Fund's benchmark, the MSCI All Country World Index, rose 7.75% (net of source taxes).
Key Performance Factors
Energy and Materials soared following the US-Israeli attack on Iran and closing of the Strait of Hormuz. Consumer Discretionary lagged on concerns that increased spending on AI will pressure margins. The US market saw weak returns from large cloud-computing and data center companies, while enthusiasm for Asian technology companies boosted EMs. The Fund underperformed, with poor stocks in Communication Services, Consumer Discretionary, and Financials. The Fund’s high-quality growth style also faced a headwind, as shares of high-quality and fast-growing companies lagged the broad market.
Sector Analysis
In Communication Services, shares of Chinese internet company Tencent were pressured by concerns about its ability to profit from its aggressive AI investment. In Consumer Discretionary, shares of Japanese electronics conglomerate Sony Group declined due to rising memory costs and potential margin pressure.
Geographic Analysis
In the US, streaming company Netflix reported solid results that still fell short of market expectations. Alphabet was a bright spot as its dominant position in online search remained resilient. In EMs, Tencent and India’s HDFC Bank detracted. HDFC Bank was hurt by slower deposit growth and the resignation of its chairman; the
bank
appointed a well-regarded interim chair.Performance
| 🡱 Top Contributors | 🡳 Top Detractors | |
| ASML | Tencent | |
| SLB | Sony | |
| Fabrinet | Netflix | |
| Alphabet | Booking Holdings | |
| Apple | Adobe |
The securities shown do not
represent
all holdings, and it should not be assumed
that investment in these securities has been or will be profitable. The following is available upon request: (1) information describing the methodology of the contribution data and (2) a list showing the weight and relative contribution of all holdings during the period. Contribution is the contribution
to overall performance over
the period.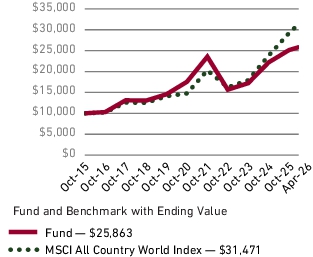
Average
Annual
Total Return (%) as of April 30, 20261 Year | 5 Year | 10 Year | |
| Fund | 15.50 | 3.53 | 10.07 |
| MSCI All Country World Index | 31.00 | 10.68 | 12.25 |
HardingLoevnerFunds.com
for the most recent performance information.
Key Fund Statistics
During Reporting Period
| Fund net assets | $ 537.2M | Total advisory fees paid (after waiver/reimbursement) | $ 1.8M |
| Total number of holdings | 61 | Period portfolio turnover rate | 21 % |
Graphical Representation of Holdings
The table and charts below show the investment makeup of
the
Fund; percentages
indicated
and graphical representations
are based on the Fund’s net asset value.Top Ten Holdings
%
Allocation
| Alphabet Inc., Class A | 5.1 |
| Amazon.com Inc. | 4.3 |
| NVIDIA Corp. | 3.6 |
| Taiwan Semiconductor Manufacturing Co., Ltd. - Sponsored ADR | 3.5 |
| Schneider Electric SE | 3.3 |
| Microsoft Corp. | 3.2 |
| Samsung Electronics Co., Ltd. - GDR, Reg S | 3.2 |
| Meta Platforms Inc., Class A | 2.7 |
| ASML Holding NV | 2.7 |
| Netflix Inc. | 2.6 |
by Sector

by Region

Top Ten Holdings
%
| Alphabet Inc., Class A | 5.1 |
| Amazon.com Inc. | 4.3 |
| NVIDIA Corp. | 3.6 |
| Taiwan Semiconductor Manufacturing Co., Ltd. - Sponsored ADR | 3.5 |
| Schneider Electric SE | 3.3 |
| Microsoft Corp. | 3.2 |
| Samsung Electronics Co., Ltd. - GDR, Reg S | 3.2 |
| Meta Platforms Inc., Class A | 2.7 |
| ASML Holding NV | 2.7 |
| Netflix Inc. | 2.6 |
HardingLoevnerFunds.com
. You can also request this information by calling (877) 435-8105 or by sending an e-mail request tohardingloevnerfunds@ntrs.com.
What were
the
Fund costs for the period?(based on a hypothetical $10,000 investment)
| Fund (Class) | Costs of a $10,000 investment | Costs paid as a percentage of a $10,000 investment 1 |
| Global Equity (Institutional Class) | $ 43 |
0.85 % |
|
1 |
Expense ratio is expressed on an annualized basis. |
Management’s Discussion of F
un
d PerformanceThe Global Equity Institutional Class (HLMVX) rose 3.00% (net of fees and expenses) in the six-month period ended April 30, 2026. The Fund's benchmark, the MSCI All Country World Index, rose 7.75% (net of source taxes).
Key Performance Factors
Energy and Materials soared following the US-Israeli attack on Iran and closing of the Strait of Hormuz. Consumer Discretionary lagged on concerns that increased spending on AI will pressure margins. The US market saw weak returns from large cloud-computing and data center companies, while enthusiasm for Asian technology companies boosted EMs. The Fund underperformed, with poor stocks in Communication Services, Consumer Discretionary, and Financials. The Fund’s high-quality growth style also faced a headwind, as shares of high-quality and fast-growing companies lagged the broad market.
Sector Analysis
In Communication Services, shares of Chinese internet company Tencent were pressured by concerns about its ability to profit from its aggressive AI investment. In Consumer Discretionary, shares of Japanese electronics conglomerate Sony Group declined due to rising memory costs and potential margin pressure.
Geographic Analysis
In the US, streaming company Netflix reported solid results that still fell short of market expectations. Alphabet was a bright spot as its dominant position in online search remained resilient. In EMs, Tencent and India’s HDFC Bank detracted. HDFC Bank was hurt by slower deposit growth and the resignation of its chairman; the
bank
appointed a well-regarded interim chair.Performance
| 🡱 Top Contributors | 🡳 Top Detractors | |
| ASML | Tencent | |
| SLB | Sony | |
| Fabrinet | Netflix | |
| Alphabet | Booking Holdings | |
| Apple | Adobe |
The securities shown do not
represent
all holdings, and it should not be assumed that investment in these securities has been or will be profitable. The following is available
upon request: (1) information
describing the methodology of the contribution data and (2) a list showing
the weight and relative contribution of all holdings during the period. Contribution is the contribution to overall performance over
the period.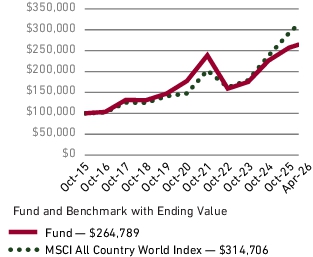
Average Annual
Total
Return (%) as of April 30, 20261 Year |
5 Year |
10 Year |
|
| Fund | 15.77 | 3.77 | 10.31 |
| MSCI All Country World Index | 31.00 | 10.68 | 12.25 |
HardingLoevnerFunds.com
for the most recent performance information.
Key Fund Statistics
During Reporting Period
Fund net assets |
$ 537.2M |
Total advisory fees paid (after waiver/reimbursement) |
$ 1.8M |
Total number of holdings |
61 |
Period portfolio turnover rate |
21 % |
Graphical
Representation
of
Holding
sThe table and charts below show the investment makeup of the
Fund
; percentages indicated and graphical
representations are based on the Fund’s net asset value.Top Ten Holdings
%
Allocation
| Alphabet Inc., Class A | 5.1 |
| Amazon.com Inc. | 4.3 |
| NVIDIA Corp. | 3.6 |
| Taiwan Semiconductor Manufacturing Co., Ltd. - Sponsored ADR | 3.5 |
| Schneider Electric SE | 3.3 |
| Microsoft Corp. | 3.2 |
| Samsung Electronics Co., Ltd. - GDR, Reg S | 3.2 |
| Meta Platforms Inc., Class A | 2.7 |
| ASML Holding NV | 2.7 |
| Netflix Inc. | 2.6 |
by Sector
by Region

Top Ten Holdings
%
| Alphabet Inc., Class A | 5.1 |
| Amazon.com Inc. | 4.3 |
| NVIDIA Corp. | 3.6 |
| Taiwan Semiconductor Manufacturing Co., Ltd. - Sponsored ADR | 3.5 |
| Schneider Electric SE | 3.3 |
| Microsoft Corp. | 3.2 |
| Samsung Electronics Co., Ltd. - GDR, Reg S | 3.2 |
| Meta Platforms Inc., Class A | 2.7 |
| ASML Holding NV | 2.7 |
| Netflix Inc. | 2.6 |
HardingLoevnerFunds.com
. You can also requestthis information by calling(877) 435-8105or by sending an e-mail request to hardingloevnerfunds@ntrs.com.
What were the
Fund
costs for the period?(based on a hypothetical $10,000 investment)
| Fund (Class) | Costs of a $10,000 investment | Costs paid as a percentage of a $10,000 investment 1 |
| Global Equity (Institutional Class Z) | $ 38 |
0.75 % |
|
1 |
Expense ratio is expressed on an annualized basis. |
Management’s Discussion of Fund Performance
The Global Equity Institutional Class Z (HLGZX) increased 3.06% (net of fees and expenses) in the six-month period ended April 30, 2026. The Fund's benchmark, the MSCI All Country World Index, rose 7.75% (net of source taxes).
Key Performance Factors
Energy and Materials soared following the US-Israeli attack on Iran and closing of the Strait of Hormuz. Consumer Discretionary lagged on concerns that increased spending on AI will pressure margins. The US market saw weak returns from large cloud-computing and data center companies, while enthusiasm for Asian technology companies boosted EMs. The Fund underperformed, with poor stocks in Communication Services, Consumer Discretionary, and Financials. The Fund’s high-quality growth style also faced a headwind, as shares of high-quality and fast-growing companies lagged the broad market.
Sector Analysis
In Communication Services, shares of Chinese internet company Tencent were pressured by concerns about its ability to profit from its aggressive AI investment. In Consumer Discretionary, shares of Japanese electronics conglomerate Sony Group declined due to rising memory costs and potential margin pressure.
Geographic
Analysis
In the US, streaming company Netflix reported solid results that still fell short of market expectations. Alphabet was a bright spot as its dominant position in online search remained resilient. In EMs, Tencent and India’s HDFC Bank detracted. HDFC Bank was hurt by slower deposit growth and the resignation of its chairman; the bank appointed a well-regarded interim chair.
Performance
| 🡱 Top Contributors | 🡳 Top Detractors | |
| ASML | Tencent | |
| SLB | Sony | |
| Fabrinet | Netflix | |
| Alphabet | Booking Holdings | |
| Apple | Adobe |
The securities
shown
do not represent all holdings
, and it should not be assumed that investment in these
securities has been or will be profitable. The following is available upon request: (1) information describing the methodology of the contribution data and (2) a list showing the weight and relative contribution
of all holdings during the period. Contribution is the contribution
to overall performance over the period.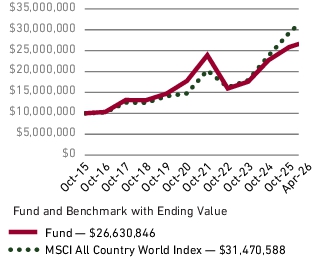
Average Annual
Total
Return (%) as of April 30, 20261 Year |
5 Year |
10 Year |
|
| Fund | 15.92 | 3.86 | 10.38 |
| MSCI All Country World Index | 31.00 | 10.68 | 12.25 |
HardingLoevnerFunds.com
for the most recent performance information.
Key Fund Statistics
During Reporting Period
| Fund net assets | $ 537.2M |
Total advisory fees paid (after waiver/reimbursement) |
$ 1.8M |
| Total number of holdings | 61 | Period portfolio turnover rate | 21 % |
Graphical Representation of Holdings
The table and charts
below
show the investment makeup of the Fund; percentages
indicated and graphical representations are based on the Fund’s net asset value.Top Ten Holdings
%
Allocation
| Alphabet Inc., Class A | 5.1 |
| Amazon.com Inc. | 4.3 |
| NVIDIA Corp. | 3.6 |
| Taiwan Semiconductor Manufacturing Co., Ltd. - Sponsored ADR | 3.5 |
| Schneider Electric SE | 3.3 |
| Microsoft Corp. | 3.2 |
| Samsung Electronics Co., Ltd. - GDR, Reg S | 3.2 |
| Meta Platforms Inc., Class A | 2.7 |
| ASML Holding NV | 2.7 |
| Netflix Inc. | 2.6 |
by Sector

by Region
Top Ten Holdings
%
| Alphabet Inc., Class A | 5.1 |
| Amazon.com Inc. | 4.3 |
| NVIDIA Corp. | 3.6 |
| Taiwan Semiconductor Manufacturing Co., Ltd. - Sponsored ADR | 3.5 |
| Schneider Electric SE | 3.3 |
| Microsoft Corp. | 3.2 |
| Samsung Electronics Co., Ltd. - GDR, Reg S | 3.2 |
| Meta Platforms Inc., Class A | 2.7 |
| ASML Holding NV | 2.7 |
| Netflix Inc. | 2.6 |
HardingLoevnerFunds.com
. You can also requestthis information by calling(877) 435-8105or by sending an e-mail request to hardingloevnerfunds@ntrs.com.
What were
the
Fund costs for the period?(based on a hypothetical $10,000 investment)
| Fund (Class) | Costs of a $10,000 investment | Costs paid as a percentage of a $10,000 investment 1 |
| International Equity (Institutional Class) | $ 44 |
0.84 % |
|
1 |
Expense ratio is expressed on an annualized basis. |
Management’s Discussion of Fund Performance
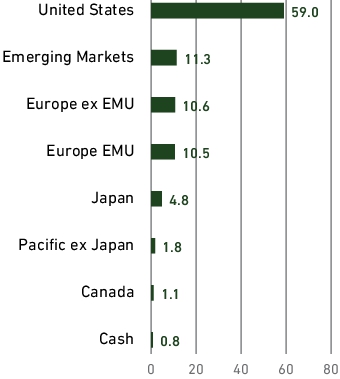
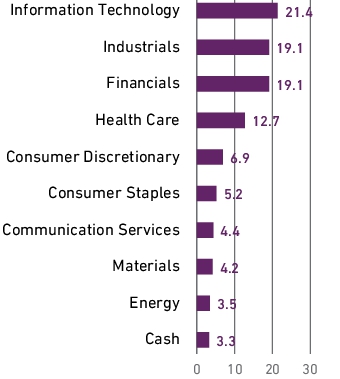
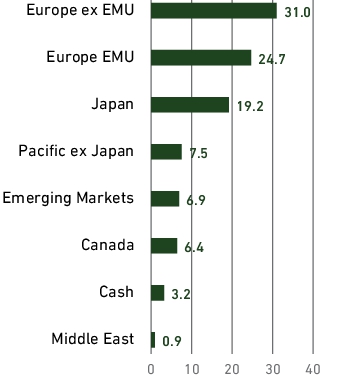
The International Equity Institutional Class (HLMIX) returned 12.83% (net of fees and expenses) in the six-month period ended April 30, 2026. The Fund's benchmark, the MSCI All Country World ex US Index, increased 12.11% (net of source taxes).
Key Performance Factors
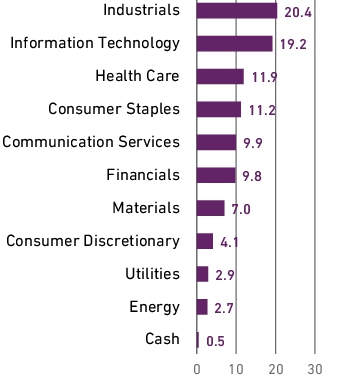
Energy and Information Technology (IT) were the best performing sectors during the period, spurred by the rising price of oil due to the US-Iran conflict and the continued strength of AI-related companies. Communication Services declined, dragged down by the poor performance of media & entertainment companies. Shares of the fastest-growing companies significantly outperformed, while the highest-quality and most-expensive companies underperformed. The Fund’s emphasis on fast-growing companies boosted its relative performance. The Fund also outpaced the index in IT, Consumer Staples, Emerging Markets, and Europe ex EMU, but lagged in Financials, Consumer Discretionary, and Japan.
Sector Analysis
In IT, the share prices of South Korea’s Samsung Electronics and Taiwan’s Delta Electronics surged due to strong memory chip and power management demand stemming from soaring AI investment. In Financials, India's HDFC Bank detracted as it reported slower deposit growth and the resignation of its Chairman.
Geographic Analysis
UK-based mining
company
Rio Tinto gained after reporting copper-equivalent volume growth and strong cash flows. Shares of Israeli customer-service software provider NICE fell as it raised revenue guidance but forecasted lower full-year profitability due to the costs of its acquisition of Germany’s Cognigy.Performance
| 🡱 Top Contributors | 🡳 Top Detractors | |
| Delta Electronics | HDFC Bank | |
| Samsung Electronics | Sony | |
| Rio Tinto | Naver | |
| Lasertec | MercadoLibre | |
| ASML | M3 |
The securities
shown
do not represent all holdings, and it should not be assumed
that investment in these securities has been or will be profitable. The following is available upon request
: (1) information describing the methodology of the contribution data and (2) a list showing the weight and relative contribution of all holdings during the period. Contribution is the contribution to overall
performance over the period.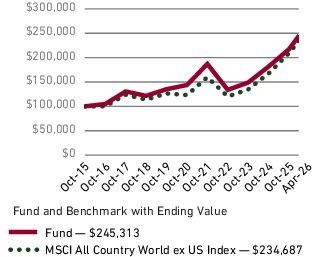
Average Annual
Total
Return (%) as of April 30, 20261 Year |
5 Year |
10 Year |
|
| Fund | 28.88 | 6.56 | 9.42 |
| MSCI All Country World ex US Index | 32.20 | 8.38 | 9.10 |
HardingLoevnerFunds.com
for the most recent performance information
Key Fund Statistics
During Reporting Period
| Fund net assets | $ 12,320.7M |
Total advisory fees paid (after waiver/reimbursement) |
$ 40.9M |
| Total number of holdings | 68 | Period portfolio turnover rate | 11 % |
Graphical Representation of
Holdings
The table and charts below show
the
investment makeup of the Fund; percentages indicated and graphical
representations are based on the Fund’s net asset value.Top Ten Holdings
%
Allocation
| Taiwan Semiconductor Manufacturing Co., Ltd. - Sponsored ADR | 4.5 |
| Samsung Electronics Co., Ltd. - GDR, Reg S | 4.0 |
| Delta Electronics Inc. | 3.5 |
| Shell plc | 3.4 |
| Northern Institutional Funds - Treasury Portfolio (Premier Shares) | 3.3 |
| Manulife Financial Corp. | 2.8 |
| Contemporary Amperex Technology Co., Ltd., Class A | 2.8 |
| AIA Group Ltd. | 2.6 |
| Rio Tinto plc | 2.4 |
| Banco Bilbao Vizcaya Argentaria SA | 2.4 |
by Sector

by Region
Top Ten Holdings
%
| Taiwan Semiconductor Manufacturing Co., Ltd. - Sponsored ADR | 4.5 |
| Samsung Electronics Co., Ltd. - GDR, Reg S | 4.0 |
| Delta Electronics Inc. | 3.5 |
| Shell plc | 3.4 |
| Northern Institutional Funds - Treasury Portfolio (Premier Shares) | 3.3 |
| Manulife Financial Corp. | 2.8 |
| Contemporary Amperex Technology Co., Ltd., Class A | 2.8 |
| AIA Group Ltd. | 2.6 |
| Rio Tinto plc | 2.4 |
| Banco Bilbao Vizcaya Argentaria SA | 2.4 |
HardingLoevnerFunds.com
. You can also request this information by calling (877) 435-8105 or by sending an e-mail request to hardingloevnerfunds@ntrs.com.
What were
the
Fund costs for the period?(based on a hypothetical $10,000 investment)
| Fund (Class) | Costs of a $10,000 investment | Costs paid as a percentage of a $10,000 investment 1 |
| International Equity (Institutional Class Z) | $ 39 |
0.73 % |
|
1 |
Expense ratio is expressed on an annualized basis. |
Management’s Discussion of Fund Performance
The International Equity Institutional Class Z (HLIZX) returned 12.92% (net of fees and expenses) in the six-month period ended April 30, 2026. The Fund's benchmark, the MSCI All Country World ex US Index, increased 12.11% (net of source taxes).
Key Performance Factors
Energy and Information Technology (IT) were the best performing sectors during the period, spurred by the rising price of oil due to the US-Iran conflict and the continued strength of AI-related companies. Communication Services declined, dragged down by the poor performance of media & entertainment companies. Shares of the fastest-growing companies significantly outperformed, while the highest-quality and most-expensive companies underperformed. The Fund’s emphasis on fast-growing companies boosted its relative performance. The Fund also outpaced the index in IT, Consumer Staples, Emerging Markets, and Europe ex EMU, but lagged in Financials, Consumer Discretionary, and Japan.
Sector Analysis
In IT, the share prices of South Korea’s Samsung Electronics and Taiwan’s Delta Electronics surged due to strong memory chip and power management demand stemming from soaring AI investment. In Financials, India's HDFC Bank detracted as it reported slower deposit growth and the resignation of its Chairman.
Geographic Analysis
UK-based mining company Rio
Tinto
gained after reporting copper-equivalent volume growth and strong cash flows. Shares of Israeli customer-service software provider NICE fell as it raised revenue guidance but forecasted lower full-year profitability due to the costs of its acquisition of Germany’s Cognigy.Performance
| 🡱 Top Contributors | 🡳 Top Detractors | |
| Delta Electronics | HDFC Bank | |
| Samsung Electronics | Sony | |
| Rio Tinto | Naver | |
| Lasertec | MercadoLibre | |
| ASML | M3 |
The securities shown do
not
represent all holdings, and it should not be assumed that investment in
these securities has been or will be profitable. The following is available upon request: (1) information
describing the methodology of the contribution data and (2) a list showing the weight and relative contribution of all holdings during the period. Contribution is the contribution to overall performance
over the period.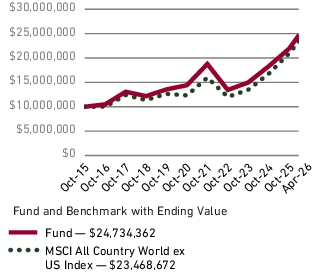
Average
Annual
Total Return (%) as of April 30, 20261 Year |
5 Year |
10 Year |
|
| Fund | 28.99 | 6.66 | 9.51 |
| MSCI All Country World ex US Index | 32.20 | 8.38 | 9.10 |
HardingLoevnerFunds.com
for the most recent performance information.
Key Fund Statistics
During Reporting Period
| Fund net assets | $ 12,320.7M |
Total advisory fees paid (after waiver/reimbursement) |
$ 40.9M |
| Total number of holdings | 68 | Period portfolio turnover rate | 11 % |
Graphical Representation of Holdings
The table and charts below show the investment makeup of
the
Fund; percentages indicated and graphical representations are
based on the Fund’s net asset value.Top Ten Holdings
%
Allocation
| Taiwan Semiconductor Manufacturing Co., Ltd. - Sponsored ADR | 4.5 |
| Samsung Electronics Co., Ltd. - GDR, Reg S | 4.0 |
| Delta Electronics Inc. | 3.5 |
| Shell plc | 3.4 |
| Northern Institutional Funds - Treasury Portfolio (Premier Shares) | 3.3 |
| Manulife Financial Corp. | 2.8 |
| Contemporary Amperex Technology Co., Ltd., Class A | 2.8 |
| AIA Group Ltd. | 2.6 |
| Rio Tinto plc | 2.4 |
| Banco Bilbao Vizcaya Argentaria SA | 2.4 |
by Sector
by Region

Top Ten Holdings
%
| Taiwan Semiconductor Manufacturing Co., Ltd. - Sponsored ADR | 4.5 |
| Samsung Electronics Co., Ltd. - GDR, Reg S | 4.0 |
| Delta Electronics Inc. | 3.5 |
| Shell plc | 3.4 |
| Northern Institutional Funds - Treasury Portfolio (Premier Shares) | 3.3 |
| Manulife Financial Corp. | 2.8 |
| Contemporary Amperex Technology Co., Ltd., Class A | 2.8 |
| AIA Group Ltd. | 2.6 |
| Rio Tinto plc | 2.4 |
| Banco Bilbao Vizcaya Argentaria SA | 2.4 |
HardingLoevnerFunds.com
. You can also requestthis information by calling (877) 435-8105 or by sending an e-mail request to hardingloevnerfunds@ntrs.com
.
What were the Fund costs for the period?
(based on a hypothetical $10,000 investment)
| Fund (Class) | Costs of a $10,000 investment | Costs paid as a percentage of a $10,000 investment 1 |
| International Equity (Investor Class) | $ 61 |
1.15 % |
|
1 |
Expense ratio is expressed on an annualized basis. |
Management’s Discussion of Fund Performance
The International Equity Investor Class (HLMNX) returned 12.66% (net of fees and expenses) in the six-month period ended April 30, 2026. The Fund's benchmark, the MSCI All Country World ex US Index, increased 12.11% (net of source taxes).
Key Performance Factors
Energy and Information Technology (IT) were the best performing sectors during the period, spurred by the rising price of oil due to the US-Iran conflict and the continued strength of AI-related companies. Communication Services declined, dragged down by the poor performance of media & entertainment companies. Shares of the fastest-growing companies significantly outperformed, while the highest-quality and most-expensive companies underperformed. The Fund’s emphasis on fast-growing companies boosted its relative performance. The Fund also outpaced the index in IT, Consumer Staples, Emerging Markets, and Europe ex EMU, but lagged in Financials, Consumer Discretionary, and Japan.
Sector Analysis
In IT, the share prices of South Korea’s Samsung Electronics and Taiwan’s Delta Electronics surged due to strong memory chip and power management demand stemming from soaring AI investment. In Financials, India's HDFC Bank detracted as it reported slower deposit growth and the resignation of its Chairman.
Geographic Analysis
UK-based mining company Rio Tinto gained after reporting copper-equivalent volume growth and strong cash flows. Shares of Israeli customer-service software provider NICE fell as it raised revenue guidance but forecasted lower full-year profitability due to the costs of its acquisition of Germany’s Cognigy.
Performance
| 🡱 Top Contributors | 🡳 Top Detractors | |
| Delta Electronics | HDFC Bank | |
| Samsung Electronics | Sony | |
| Rio Tinto | Naver | |
| Lasertec | MercadoLibre | |
| ASML | M3 |
The securities shown do not represent all holdings, and it should not be assumed that investment in these s
ecu
rities has been or will be profitable. The following is available upon request: (1) information describing the methodology of the contribution data and (2) a list showing the weight and relative contribution of all holdings during the
period. Contribution is the contribution to overall performan
ce over the period.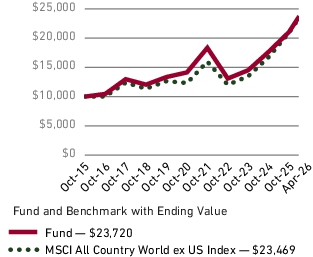
Average Annual Total Return (%) as of April 30, 2026
1 Year |
5 Year |
10 Year |
|
| Fund | 28.42 | 6.21 | 9.07 |
| MSCI All Country World ex US Index | 32.20 | 8.38 | 9.10 |
HardingLoevnerFunds.com
for the most recent performance information.
Key Fund Statistics
During Reporting Period
| Fund net assets | $ 12,320.7M |
Total advisory fees paid (after waiver/reimbursement) |
$ 40.9M |
| Total number of holdings | 68 | Period portfolio turnover rate | 11 % |
Graphical Representation of Holdings
The table and charts below show the investment makeup of the Fund; per
cent
ages indicated and graphical representations are based on the Fund’s net asset value.Top Ten Holdings
%
Allocation
| Taiwan Semiconductor Manufacturing Co., Ltd. - Sponsored ADR | 4.5 |
| Samsung Electronics Co., Ltd. - GDR, Reg S | 4.0 |
| Delta Electronics Inc. | 3.5 |
| Shell plc | 3.4 |
| Northern Institutional Funds - Treasury Portfolio (Premier Shares) | 3.3 |
| Manulife Financial Corp. | 2.8 |
| Contemporary Amperex Technology Co., Ltd., Class A | 2.8 |
| AIA Group Ltd. | 2.6 |
| Rio Tinto plc | 2.4 |
| Banco Bilbao Vizcaya Argentaria SA | 2.4 |
by Sector

by Region

Top Ten Holdings
%
Allocation
| Taiwan Semiconductor Manufacturing Co., Ltd. - Sponsored ADR | 4.5 |
| Samsung Electronics Co., Ltd. - GDR, Reg S | 4.0 |
| Delta Electronics Inc. | 3.5 |
| Shell plc | 3.4 |
| Northern Institutional Funds - Treasury Portfolio (Premier Shares) | 3.3 |
| Manulife Financial Corp. | 2.8 |
| Contemporary Amperex Technology Co., Ltd., Class A | 2.8 |
| AIA Group Ltd. | 2.6 |
| Rio Tinto plc | 2.4 |
| Banco Bilbao Vizcaya Argentaria SA | 2.4 |
HardingLoevnerFunds.com
. You can also requestthis information by calling (877) 435-8105 or by sending an e-mail request to hardingloevnerfunds@ntrs.com.
What were the Fund costs for the period?
(based on a hypothetical $10,000 investment)
| Fund (Class) | Costs of a $10,000 investment | Costs paid as a percentage of a $10,000 investment 1 |
| International Developed Markets Equity (Institutional Class) | $ 42 | 0.80 % |
1 | Expense ratio is expressed on an annualized basis. |
Management’s Discussion of Fund Performance
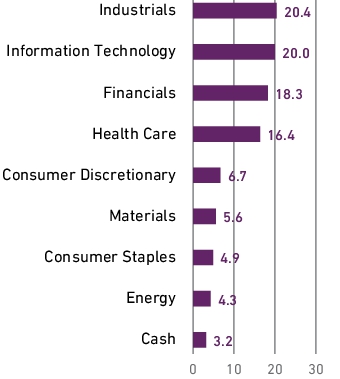
The International Developed Markets Equity Institutional Class (HLIDX) returned 12.96% (net of fees and expenses) in the six-month period ended April 30, 2026. The Fund's benchmark, the MSCI World ex US Index, increased 10.72% (net of source taxes).
Key Performance Factors
Energy was the best performing sector during the period, spurred by the rising price of oil due to the US-Iran conflict. Materials also rose, with mining companies benefiting from higher gold and silver prices. Consumer Discretionary and Communication Services declined, due to the poor performance of consumer durables & apparel and media & entertainment companies, respectively. The Fund’s emphasis on fast-growing companies boosted its relative performance, while the highest-quality and most-expensive companies underperformed. The Fund also outpaced the index in Information Technology (IT), Industrials, and Europe ex EMU, but lagged in Financials, Consumer Discretionary, and Japan.
Sector Analysis
In IT, Samsung Electronics, ASML, and Disco Corp all gained strongly, reflecting broad-based strength of shares across the semiconductor supply chain. In Financials, Dutch payments processor Adyen fell sharply due to disappointing full-year guidance and concerns that AI-driven commerce could erode its competitive edge.
Geographic Analysis
UK-based mining company Rio Tinto gained after reporting copper-equivalent volume growth and strong cash flows. Shares of Israeli customer-service software provider NICE fell as it raised revenue guidance but forecasted lower full-year profitability due to the costs of its acquisition of Germany’s Cognigy.
Performance
| 🡱 Top Contributors | 🡳 Top Detractors | |
| Samsung Electronics | Sony | |
| Lasertec | Adyen | |
| TSMC | M3 | |
| Rio Tinto | Sea Limited | |
| ASML | NICE |
The securities shown do not represent all holdings, and it should not be assumed that investment in these securities has been or will be profitable. The following is available upon request: (1) information describing the methodology of the contribution data and (2) a list showing the weight and relative contribution of all holdings during the period. Contribution is the contribution to overall performance over the p
eri
od.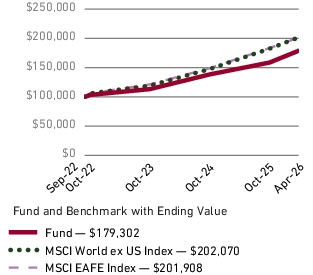
Average Annual Total Return (%) as of April 30, 2026
1 Year | Since Inception | |
| Fund | 21.54 | 17.68 |
| MSCI World ex US Index | 26.33 | 21.67 |
| MSCI EAFE Index | 24.60 | 21.64 |
HardingLoevnerFunds.com
for the most recent performance information.
Key Fund Stat
ist
icsDuring Reporting Period
| Fund net assets | $ 93.5M | Total advisory fees paid (after waiver/reimbursement) | $ 0.3M |
| Total number of holdings | 51 | Period portfolio turnover rate | 14 % |
Graphical Representation of Holdings
The table and charts below show the investment makeup of the Fund; percentages indicated and graphical representations are based on the Fund’s net asset value.
Top Ten Holdings
%
Allocation
| Shell plc | 4.3 |
| Taiwan Semiconductor Manufacturing Co., Ltd. - Sponsored ADR | 3.8 |
| AIA Group Ltd. | 3.6 |
| Northern Institutional Funds - Treasury Portfolio (Premier Shares) | 3.2 |
| Allianz SE, Reg S | 3.1 |
| Samsung Electronics Co., Ltd. - GDR, Reg S | 3.1 |
| Rio Tinto plc | 3.1 |
| ASML Holding NV | 3.0 |
| Banco Bilbao Vizcaya Argentaria SA | 3.0 |
| BAE Systems plc | 3.0 |
by Sector
by Region
Top Ten Holdings
%
Allocation
| Shell plc | 4.3 |
| Taiwan Semiconductor Manufacturing Co., Ltd. - Sponsored ADR | 3.8 |
| AIA Group Ltd. | 3.6 |
| Northern Institutional Funds - Treasury Portfolio (Premier Shares) | 3.2 |
| Allianz SE, Reg S | 3.1 |
| Samsung Electronics Co., Ltd. - GDR, Reg S | 3.1 |
| Rio Tinto plc | 3.1 |
| ASML Holding NV | 3.0 |
| Banco Bilbao Vizcaya Argentaria SA | 3.0 |
| BAE Systems plc | 3.0 |
Material Fund Changes
Pursuant to an Agreement and Plan of Reorganization approved by the Board of Directors, the Fund is entering into a transaction with a newly-created shell series, the Harding Loevner International Developed Markets Select Equity ETF, in order to convert the Fund into an exchange-traded fund (the "Transaction"). The Transaction is expected to be completed after the close of business on July 17, 2026 (or at such other date as agreed to by the parties of the Transaction).
This is a summary of certain changes to the Fund since November 1, 2025. For more comprehensive information, you may review the Fund’s next prospectus, which we expect to be available by February 28, 2027 at
HardingLoevnerFunds.com
or upon special request at (877) 435-8105
.HardingLoevnerFunds.com
or upon special request at (877) 435-8105
.
HardingLoevnerFunds.com
. You can also requestthis information by calling (877) 435-8105 or by sending an e-mail request to hardingloevnerfunds@ntrs.com.
What were the Fund costs for the period?
(based on a hypothetical $10,000 investment)
| Fund (Class) | Costs of a $10,000 investment | Costs paid as a percentage of a $10,000 investment 1 |
| International Small Companies (Institutional Class) | $ 56 |
1.11 % |
|
1 |
Expense ratio is expressed on an annualized basis. |
Management’s Discussion of Fund Performance
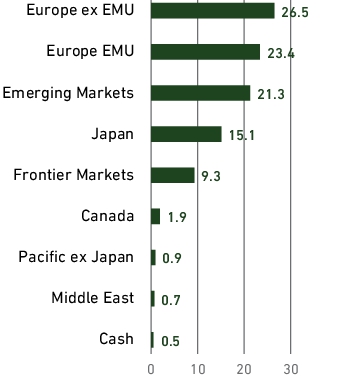
The International Small Companies Institutional Class (HLMRX) returned 5.18% (net of fees and expenses) in the six-month period ended April 30, 2026. The Fund's benchmark, the MSCI ACWI ex US Small Cap Index, increased 12.34% (net of source taxes).
1
Key Performance Factors
Energy and Information Technology (IT) were the best-performing sectors due to the rising price of oil following the US-Iran conflict and the continued strength of AI-related companies. Consumer Discretionary and Health Care were dragged down by the poor performance of consumer services and health care equipment & services stocks, respectively. Shares of the fastest-growing companies outperformed, while shares of the highest-quality and most-expensive companies underperformed, which weighed on the Fund’s relative performance. The Fund also lagged the index in IT, Materials, the European Monetary Union, and Japan while outperforming in Industrials and Pacific ex Japan.
Sector Analysis
Japanese software-testing business Shift detracted after the company’s management said lower utilization of its software testers was hurting operating margins. Shares of Senior, a UK-based supplier of thermal-management and fluid-conveyance systems, rose after receiving takeover offers.
Geographic Analysis
Shares of German real estate listings platform Scout24 declined as investors worried about the potential for AI to disrupt its business. Hong Kong-based semiconductor manufacturer ASM Pacific Technology reported strong quarterly results, boosted by AI-related infrastructure demand.
Performance
| 🡱 Top Contributors | 🡳 Top Detractors | |
| Aspeed | Shift | |
| Senior | Baltic Classifieds | |
| Clarkson | Scout24 | |
| Silergy | Evotec | |
| Airtel Africa | Yantai China Pet Foods |
The securities shown do not represent all holdings, and it should not be assumed that investment in these securities has been or will be profitable. The following is available upon request: (1) information describing the methodology of the contribution data and (2) a list showing the weight and relative contribution of all holdings during the period. Contribution is the contribution to overall performance over the period.
1
The Fund considers the non-broa
d-bas
ed index most relevant when analy
zing the Fund’s perfor
mance.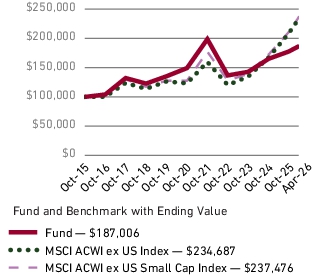
Average Annual Total Return (%) as of April 30, 2026
1 Year |
5 Year |
10 Year |
|
| Fund | 10.32 | 0.49 | 6.25 |
| MSCI ACWI ex US Index | 32.20 | 8.38 | 9.10 |
| MSCI ACWI ex US Small Cap Index | 34.14 | 6.70 | 8.73 |
HardingLoevnerFunds.com
for the most recent performance information.
Key Fund
Sta
tisticsDuring Reporting Period
| Fund net assets | $ 187.7M |
Total advisory fees paid (after waiver/reimbursement) |
$ 0.9M |
| Total number of holdings | 85 | Period portfolio turnover rate | 19 % |
Graphical Representation of Holdings
The table and charts below show the investment makeup of the Fund; percentages indicated and graphical representations are based on the Fund’s net asset value.
Top Ten Holdings
%
Allocation
| Clarkson plc | 3.1 |
| Rubis SCA | 2.9 |
| Hoa Phat Group JSC | 2.3 |
| Cranswick plc | 2.3 |
| ASPEED Technology Inc. | 2.3 |
| KWS Saat SE & Co. KGaA | 2.2 |
| Silergy Corp. | 2.1 |
| Diploma plc | 2.1 |
| Kinaxis Inc. | 1.9 |
| Artea Bankas AB | 1.9 |
by Sector

by Region
Top Ten Holdings
%
Allocation
| Clarkson plc | 3.1 |
| Rubis SCA | 2.9 |
| Hoa Phat Group JSC | 2.3 |
| Cranswick plc | 2.3 |
| ASPEED Technology Inc. | 2.3 |
| KWS Saat SE & Co. KGaA | 2.2 |
| Silergy Corp. | 2.1 |
| Diploma plc | 2.1 |
| Kinaxis Inc. | 1.9 |
| Artea Bankas AB | 1.9 |
HardingLoevnerFunds.com
. You can also requestthis information by calling (877) 435-8105 or by sending an e-mail request to hardingloevnerfunds@ntrs.com.
What were the Fund costs for the period?
(based on a hypothetical $10,000 investment)
| Fund (Class) | Costs of a $10,000 investment | Costs paid as a percentage of a $10,000 investment 1 |
| International Small Companies (Institutional Class Z) | $ 51 |
1.00 % |
|
1 |
Expense ratio is expressed on an annualized basis. |
Management’s Discussion of Fund Performance
The International Small Companies Institutional Class Z (HLRZX) returned 5.19% (net of fees and expenses) in the six-month period ended April 30, 2026. The Fund's benchmark, the MSCI ACWI ex US Small Cap Index, increased 12.34% (net of source taxes).
1
Key Performance Factors
Energy and Information Technology (IT) were the best-performing sectors due to the rising price of oil following the US-Iran conflict and the continued strength of AI-related companies. Consumer Discretionary and Health Care were dragged down by the poor performance of consumer services and health care equipment & services stocks, respectively. Shares of the fastest-growing companies outperformed, while shares of the highest-quality and most-expensive companies underperformed, which weighed on the Fund’s relative performance. The Fund also lagged the index in IT, Materials, the European Monetary Union, and Japan while outperforming in Industrials and Pacific ex Japan.
Sector Analysis
Japanese software-testing business Shift detracted after the company’s management said lower utilization of its software testers was hurting operating margins. Shares of Senior, a UK-based supplier of thermal-management and fluid-conveyance systems, rose after receiving takeover offers.
Geographic Analysis
Shares of German real estate listings platform Scout24 declined as investors worried about the potential for AI to disrupt its business. Hong Kong-based semiconductor manufacturer ASM Pacific Technology reported strong quarterly results, boosted by AI-related infrastructure demand.
Performance
| 🡱 Top Contributors | 🡳 Top Detractors | |
| Aspeed | Shift | |
| Senior | Baltic Classifieds | |
| Clarkson | Scout24 | |
| Silergy | Evotec | |
| Airtel Africa | Yantai China Pet Foods |
The securities shown do not represent all holdings, and it should not be assumed that investment in these securities has been or will be profitable. The following is available upon request: (1) information describing the methodology of the contribution data and (2) a list showing the weight and relative contribution of all holdings during the period. Contribution is the contribution to overall performance over the period.
1
The Fund considers the non-broad-based index most relevant when analyzing the Fund’s p
erform
ance.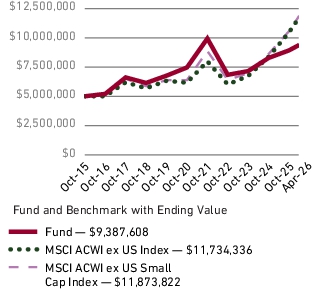
Average Annual Total Return (%) as of April 30, 2026
1 Year |
5 Year |
10 Year |
|
| Fund | 10.39 | 0.57 | 6.30 |
| MSCI ACWI ex US Index | 32.20 | 8.38 | 9.10 |
| MSCI ACWI ex US Small Cap Index | 34.14 | 6.70 | 8.73 |
HardingLoevnerFunds.com
for the most recent performance information.
Key Fund S
tat
isticsDuring Reporting Period
| Fund net assets | $ 187.7M |
Total advisory fees paid (after waiver/reimbursement) |
$ 0.9M |
| Total number of holdings | 85 | Period portfolio turnover rate | 19 % |
Graphical Representation of Holdings
The table and charts below show the investment makeup of the Fund; percentages indicated and graphical representations are based on the Fund’s net asset value.
Top Ten Holdings
%
Allocation
| Clarkson plc | 3.1 |
| Rubis SCA | 2.9 |
| Hoa Phat Group JSC | 2.3 |
| Cranswick plc | 2.3 |
| ASPEED Technology Inc. | 2.3 |
| KWS Saat SE & Co. KGaA | 2.2 |
| Silergy Corp. | 2.1 |
| Diploma plc | 2.1 |
| Kinaxis Inc. | 1.9 |
| Artea Bankas AB | 1.9 |
by Sector

by Region

Top Ten Holdings
%
Allocation
| Clarkson plc | 3.1 |
| Rubis SCA | 2.9 |
| Hoa Phat Group JSC | 2.3 |
| Cranswick plc | 2.3 |
| ASPEED Technology Inc. | 2.3 |
| KWS Saat SE & Co. KGaA | 2.2 |
| Silergy Corp. | 2.1 |
| Diploma plc | 2.1 |
| Kinaxis Inc. | 1.9 |
| Artea Bankas AB | 1.9 |
HardingLoevnerFunds.com
. You can also requestthis information by calling (877) 435-8105 or by sending an e-mail request to hardingloevnerfunds@ntrs.com.
What were the Fund costs for the period?
(based on a hypothetical $10,000 investment)
| Fund (Class) | Costs of a $10,000 investment | Costs paid as a percentage of a $10,000 investment 1 |
| International Small Companies (Investor Class) | $ 67 |
1.31 % |
|
1 |
Expense ratio is expressed on an annualized basis. |
Management’s Discussion of Fund Performance
The International Small Companies Investor Class (HLMSX) returned 5.09% (net of fees and expenses) in the six-month period ended April 30, 2026. The Fund's benchmark, the MSCI ACWI ex US Small Cap Index, increased 12.34% (net of source taxes).
1
Key Performance Factors
Energy and Information Technology (IT) were the best-performing sectors due to the rising price of oil following the US-Iran conflict and the continued strength of AI-related companies. Consumer Discretionary and Health Care were dragged down by the poor performance of consumer services and health care equipment & services stocks, respectively. Shares of the fastest-growing companies outperformed, while shares of the highest-quality and most-expensive companies underperformed, which weighed on the Fund’s relative performance. The Fund also lagged the index in IT, Materials, the European Monetary Union, and Japan while outperforming in Industrials and Pacific ex Japan.
Sector Analysis
Japanese software-testing business Shift detracted after the company’s management said lower utilization of its software testers was hurting operating margins. Shares of Senior, a UK-based supplier of thermal-management and fluid-conveyance systems, rose after receiving takeover offers.
Geographic Analysis
Shares of German real estate listings platform Scout24 declined as investors worried about the potential for AI to disrupt its business. Hong Kong-based semiconductor manufacturer ASM Pacific Technology reported strong quarterly results, boosted by AI-related infrastructure demand.
Performance
| 🡱 Top Contributors | 🡳 Top Detractors | |
| Aspeed | Shift | |
| Senior | Baltic Classifieds | |
| Clarkson | Scout24 | |
| Silergy | Evotec | |
| Airtel Africa | Yantai China Pet Foods |
The securities shown do not represent all holdings, and it should not be assumed that investment in these securities has been or will be profitable. The following is available upon request: (1) information describing the methodology of the contribution data and (2) a list showing the weight and relative contribution of all holdings during the period. Contribution is the contribution to overall performance over the period.
1
The Fund considers the non-broad-based index most relevant when analyzing the Fund’s pe
rfor
mance.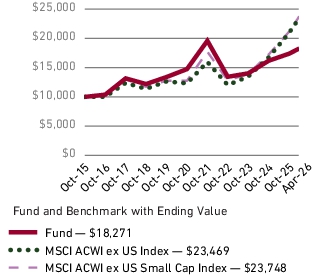
Average Annual Total Return (%) as of April 30, 2026
1 Year |
5 Year |
10 Year |
|
| Fund | 10.05 | 0.28 | 6.01 |
| MSCI ACWI ex US Index | 32.20 | 8.38 | 9.10 |
| MSCI ACWI ex US Small Cap Index | 34.14 | 6.70 | 8.73 |
HardingLoevnerFunds.com
for the most recent performance information.
Key Fund
Sta
tisticsDuring Reporting Period
| Fund net assets | $ 187.7M |
Total advisory fees paid (after waiver/reimbursement) |
$ 0.9M |
| Total number of holdings | 85 | Period portfolio turnover rate | 19 % |
Graphical Representation of Holdings
The table and charts below show the investment makeup of the Fund; percentages indicated and graphical representations are based on the Fund’s net asset value.
Top Ten Holdings
%
Allocation
| Clarkson plc | 3.1 |
| Rubis SCA | 2.9 |
| Hoa Phat Group JSC | 2.3 |
| Cranswick plc | 2.3 |
| ASPEED Technology Inc. | 2.3 |
| KWS Saat SE & Co. KGaA | 2.2 |
| Silergy Corp. | 2.1 |
| Diploma plc | 2.1 |
| Kinaxis Inc. | 1.9 |
| Artea Bankas AB | 1.9 |
by Sector
by Region

Top Ten Holdings
%
Allocation
| Clarkson plc | 3.1 |
| Rubis SCA | 2.9 |
| Hoa Phat Group JSC | 2.3 |
| Cranswick plc | 2.3 |
| ASPEED Technology Inc. | 2.3 |
| KWS Saat SE & Co. KGaA | 2.2 |
| Silergy Corp. | 2.1 |
| Diploma plc | 2.1 |
| Kinaxis Inc. | 1.9 |
| Artea Bankas AB | 1.9 |
HardingLoevnerFunds.com
. You can also requestthis information by calling (877) 435-8105 or by sending an e-mail request to hardingloevnerfunds@ntrs.com.
What were the Fund costs for the period?
(based on a hypothetical $10,000 investment)
| Fund (Class) | Costs of a $10,000 investment | Costs paid as a percentage of a $10,000 investment 1 |
| Institutional Emerging Markets (Institutional Class) | $ 56 |
1.05 % |
|
1 |
Expense ratio is expressed on an annualized basis. |
Management’s Discussion of Fund Performance
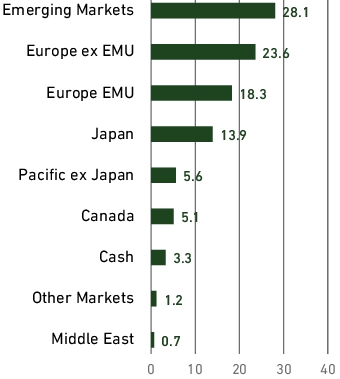
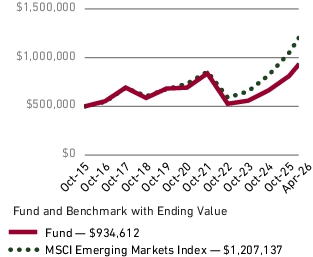
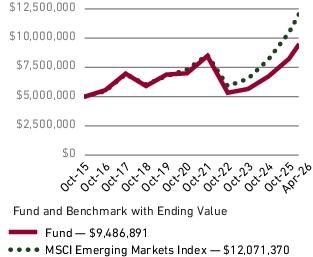
The Institutional Emerging Markets Institutional Class (HLMEX) rose 15.23% (net of fees and expenses) in the six-month period ended April 30, 2026. The Fund's benchmark, the MSCI Emerging Markets Index, rose 15.13% in the same period (net of source taxes).
Key Performance Factors
Emerging markets rose despite dipping sharply in March in reaction to the US-Israel attack on Iran. Information Technology (IT) surged thanks to the enthusiasm for AI-related semiconductor and hardware stocks in Asia. Energy benefited from the oil price spike caused by the Middle East conflict. Communication Services and Consumer Discretionary stocks lagged. The Fund outperformed in IT and Energy, mitigating underperformance in Consumer Discretionary. The Fund’s overweight in high-quality companies was also helpful.
Sector Analysis
In IT, shares of Taiwan’s Aspeed surged on booming demand for its baseboard management chips used in AI servers. In Consumer Discretionary, Indian auto manufacturer Maruti Suzuki reported operating margins that fell short of expectations due to rising commodity prices and the temporary cost of ramping up new manufacturing facilities that should bolster the company’s growth.
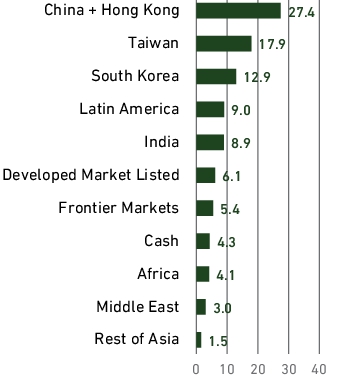
Geographical Analysis
Aspeed and Delta Electronics in Taiwan both benefited from the buildout of AI infrastructure. Delta saw strong shipments for its liquid-to-air cooling systems and server power supplies. Shares of India’s HDFC Bank were pressured by slower deposit growth and the resignation of its Chairman; the bank quickly appointed a well-regarded interim chair.
Performance
| 🡱 Top Contributors | 🡳 Top Detractors | |
| Aspeed | TSMC | |
| Delta Electronics | HDFC Bank | |
| Tenaris | Maruti Suzuki | |
| AirTAC | Sea Limited | |
| Samsung Electronics | Hon Hai Precision |
The securities shown do not represent all holdings, and it should not be assumed that investment in these securities has been or will be profitable. The following is available upon request: (1) information describing the methodology of the contribution data and (2) a list showing the weight and relative contribution of all holdings during the period. Contribution is the contribution to overall performance over the period.
Fund
Performance
The following graph and chart compare the beginning and ending account values for the most recently completed 10 fiscal years of the Fund and for the semi-annual period ended April 30, 2026. It compares a $500,000 initial investment in the Fund with an investment in an appropriate, broad-based securities market index.
Growth of $500,000 (USD)
Average
Annual Total Return (%) as of April 30, 20261 Year |
5 Year |
10 Year |
|
| Fund | 42.83 | 1.55 | 6.33 |
| MSCI Emerging Markets Index | 46.68 | 6.05 | 9.23 |
HardingLoevnerFunds.com
for the most recent performance information.
Key Fund S
tati
sticsDuring Reporting Period
| Fund net assets |
$ 532.7M |
Total advisory fees paid (after waiver/reimbursement) |
$ 1.8M |
| Total number of holdings | 70 | Period portfolio turnover rate | 95 % |
Graphic
al Representatio
n of Holdings
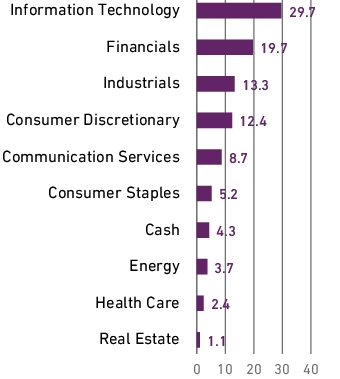
The table and charts below show the investment makeup of the Fund; percentages indicated and graphical representations are based on the Fund’s net asset value.
Top Ten Holdings
%
Allocation
| Taiwan Semiconductor Manufacturing Co., Ltd. | 5.4 |
| Samsung Electronics Co., Ltd. - GDR, Reg S | 5.3 |
| SK hynix Inc. | 5.0 |
| Tencent Holdings Ltd. | 4.3 |
| Northern Institutional Funds - Treasury Portfolio (Premier Shares) | 4.3 |
| ASPEED Technology Inc. | 4.0 |
| Delta Electronics Inc. | 3.6 |
| Contemporary Amperex Technology Co., Ltd., Class A | 3.1 |
| HDFC Bank Ltd. | 2.8 |
| Alibaba Group Holding Ltd. | 2.6 |
by Sector

by Region
Top Ten Holdings
%
| Taiwan Semiconductor Manufacturing Co., Ltd. | 5.4 |
| Samsung Electronics Co., Ltd. - GDR, Reg S | 5.3 |
| SK hynix Inc. | 5.0 |
| Tencent Holdings Ltd. | 4.3 |
| Northern Institutional Funds - Treasury Portfolio (Premier Shares) | 4.3 |
| ASPEED Technology Inc. | 4.0 |
| Delta Electronics Inc. | 3.6 |
| Contemporary Amperex Technology Co., Ltd., Class A | 3.1 |
| HDFC Bank Ltd. | 2.8 |
| Alibaba Group Holding Ltd. | 2.6 |
HardingLoevnerFunds.com
. You can also requestthis information by calling (877) 435-8105 or by sending an e-mail request to hardingloevnerfunds@ntrs.com.
What were the Fund costs for the period?
(based on a hypothetical $10,000 investment)
| Fund (Class) | Costs of a $10,000 investment | Costs paid as a percentage of a $10,000 investment 1 |
| Institutional Emerging Markets (Institutional Class Z) | $ 51 |
0.95 % |
|
1 |
Expense ratio is expressed on an annualized basis. |
Management’s Discussion of Fund Performance
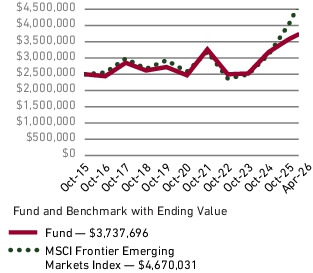
The Institutional Emerging Markets Institutional Class Z (HLEZX) rose 15.17% (net of fees and expenses) in the six-month period ended April 30, 2026. The Fund's benchmark, the MSCI Emerging Markets Index, rose 15.13% in the same period (net of source taxes).
Key Performance Factors
Emerging markets rose despite dipping sharply in March in reaction to the US-Israel attack on Iran. Information Technology (IT) surged thanks to the enthusiasm for AI-related semiconductor and hardware stocks in Asia. Energy benefited from the oil price spike caused by the Middle East conflict. Communication Services and Consumer Discretionary stocks lagged. The Fund outperformed in IT and Energy, mitigating underperformance in Consumer Discretionary. The Fund’s overweight in high-quality companies was also helpful.
Sector Analysis
In IT, shares of Taiwan’s Aspeed surged on booming demand for its baseboard management chips used in AI servers. In Consumer Discretionary, Indian auto manufacturer Maruti Suzuki reported operating margins that fell short of expectations due to rising commodity prices and the temporary cost of ramping up new manufacturing facilities that should bolster the company’s growth.
Geographical Analysis
Aspeed and Delta Electronics in Taiwan both benefited from the buildout of AI infrastructure. Delta saw strong shipments for its liquid-to-air cooling systems and server power supplies. Shares of India’s HDFC Bank were pressured by slower deposit growth and the resignation of its Chairman; the bank quickly appointed a well-regarded interim chair.
Performance
| 🡱 Top Contributors | 🡳 Top Detractors | |
| Aspeed | TSMC | |
| Delta Electronics | HDFC Bank | |
| Tenaris | Maruti Suzuki | |
| AirTAC | Sea Limited | |
| Samsung Electronics | Hon Hai Precision |
The securities shown do not represent all holdings, and it should not be assumed that investment in these securities has been or will be profitable. The following is available upon request: (1) information describing the methodology of the contribution data and (2) a list showing the weight and relative contribution of all holdings during the period. Contribution is the contribution to overall performance over the period.
Fund
Performance
The following graph and chart compare the beginning and ending account values for the most recently completed 10 fiscal years of the Fund and for the semi-annual period ended April 30, 2026. It compares a $5,000,000 initial investment in the Fund with an investment in an appropriate, broad-based securities market index.
Growth of $5,000,000 (USD)
Average Annual Total Return (%) as of April 30, 2026
1 Year |
5 Year |
10 Year |
|
| Fund | 42.86 | 1.63 | 6.48 |
| MSCI Emerging Markets Index | 46.68 | 6.05 | 9.23 |
HardingLoevnerFunds.com
for the most recent performance information.
Key Fund
Sta
tisticsDuring Reporting Period
| Fund net assets | $ 532.7M |
Total advisory fees paid (after waiver/reimbursement) |
$ 1.8M |
| Total number of holdings | 70 | Period portfolio turnover rate | 95 % |
Graphical Representation of Holdings
The table and charts below show the investment makeup of the Fund; percentages indicated and graphical representations are based on the Fund’s net asset value.
Top Ten Holdings
%
Allocation
| Taiwan Semiconductor Manufacturing Co., Ltd. | 5.4 |
| Samsung Electronics Co., Ltd. - GDR, Reg S | 5.3 |
| SK hynix Inc. | 5.0 |
| Tencent Holdings Ltd. | 4.3 |
| Northern Institutional Funds - Treasury Portfolio (Premier Shares) | 4.3 |
| ASPEED Technology Inc. | 4.0 |
| Delta Electronics Inc. | 3.6 |
| Contemporary Amperex Technology Co., Ltd., Class A | 3.1 |
| HDFC Bank Ltd. | 2.8 |
| Alibaba Group Holding Ltd. | 2.6 |
by Sector
by Region

Top Ten Holdings
%
| Taiwan Semiconductor Manufacturing Co., Ltd. | 5.4 |
| Samsung Electronics Co., Ltd. - GDR, Reg S | 5.3 |
| SK hynix Inc. | 5.0 |
| Tencent Holdings Ltd. | 4.3 |
| Northern Institutional Funds - Treasury Portfolio (Premier Shares) | 4.3 |
| ASPEED Technology Inc. | 4.0 |
| Delta Electronics Inc. | 3.6 |
| Contemporary Amperex Technology Co., Ltd., Class A | 3.1 |
| HDFC Bank Ltd. | 2.8 |
| Alibaba Group Holding Ltd. | 2.6 |
HardingLoevnerFunds.com
. You can also requestthis information by calling (877) 435-8105 or by sending an e-mail request to hardingloevnerfunds@ntrs.com.
What were the Fund costs for the period?
(based on a hypothetical $10,000 investment)
| Fund (Class) | Costs of a $10,000 investment | Costs paid as a percentage of a $10,000 investment 1 |
| Frontier Emerging Markets (Institutional Class) | $ 73 |
1.45 % |
|
1 |
Expense ratio is expressed on an annualized basis. |
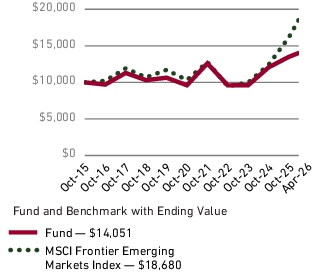
Management’s Discussion of Fund Performance
The Frontier Emerging Markets Institutional Class (HLFMX) rose 4.28% (net of fees and expenses) in the six-month period ended April 30, 2026. The Fund's benchmark, the MSCI Frontier Emerging Markets Index, rose 15.38% in the same period (net of source taxes).
Key Performance Factors
Frontier Emerging Markets rose despite dipping sharply in March in reaction to the US-Israel attack on Iran. Energy and Real Estate were the top-performing sectors. Europe and Latin America outperformed while Asian markets were hurt by the closing of the Strait of Hormuz. The Fund lagged the index, with weak holdings in Real Estate and Consumer Discretionary. Vietnam and Indonesia also detracted. European holdings helped relative returns.
Sector Analysis
Extreme weather and inflation hurt two Philippine holdings. Real Estate company SM Prime Holdings reported weak attendance at its malls and a decline in residential construction revenue. Jollibee Foods in Consumer Discretionary experienced weak revenue growth and rising input costs. In IT, shares of Thailand-based optical communications equipment manufacturer Fabrinet rose, supported by demand for components used in cloud computing, AI, and video streaming.
Geographic Analysis
Jollibee was the main detractor in the Philippines. In Vietnam, IT services business FPT declined due to concerns over the competitive threat from AI. Shares of Kazak uranium producer Kazatomprom were buoyed by strong prices and the prospect for increased nuclear power demand for AI data centers.
Performance
| 🡱 Top Contributors | 🡳 Top Detractors | |
| Fabrinet | Baltic Classifieds | |
| Kazatomprom | Jollibee Foods | |
| Airtel Africa | Marsa Maroc | |
| Banca Transilvania | Bank Central Asia | |
| Helios Towers | EPAM |
The securities shown do not represent all holdings, and it should not be assumed that investment in these securities has been or will be profitable. The following is available upon request: (1) information describing the methodology of the contribution data and (2) a list showing the weight and relative contribution of all holdings during the period. Contribution is the contribution to overall performance over the period.
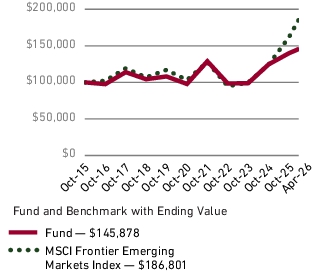
Average Annual Total Return (%) as of April 30, 2026
1 Year |
5 Year |
10 Year |
|
| Fund | 18.01 | 5.02 | 3.98 |
| MSCI Frontier Emerging Markets Index | 44.28 | 10.43 | 6.31 |
HardingLoevnerFunds.com
for the most recent performance information.
Key Fund Statistics
During Reporting Period
| Fund net asse ts |
$ 117.2M |
Total advisory fees paid (after waiver/reimbursement) |
$ 0.6M |
| Total number of holdings | 55 | Period portfolio turnover rate | 13 % |
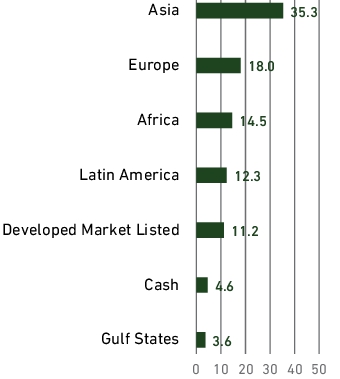
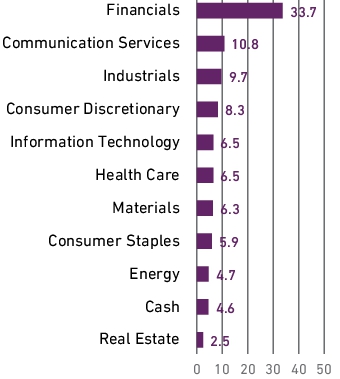
Graphical Representation of Holdings
The table and charts below show the investment makeup of the Fund; percentages indicated and graphical representations are based on the Fund’s net asset value.
Top Ten Holdings
%
Allocation
| Northern Institutional Funds - Treasury Portfolio (Premier Shares) | 4.6 |
| Credicorp Ltd. | 4.4 |
| International Container Terminal Services Inc. | 4.4 |
| Mobile World Investment Corp. | 4.3 |
| Banca Transilvania SA | 4.3 |
| Societe d'Exploitation des Ports | 3.9 |
| NAC Kazatomprom JSC - GDR, Reg S | 3.8 |
| Grupo Cibest SA - ADR | 3.6 |
| Hoa Phat Group JSC | 3.6 |
| Kaspi.KZ JSC - ADR | 3.5 |
by Sector

by Region

Top Ten Holdings
%
| Northern Institutional Funds - Treasury Portfolio (Premier Shares) | 4.6 |
| Credicorp Ltd. | 4.4 |
| International Container Terminal Services Inc. | 4.4 |
| Mobile World Investment Corp. | 4.3 |
| Banca Transilvania SA | 4.3 |
| Societe d'Exploitation des Ports | 3.9 |
| NAC Kazatomprom JSC - GDR, Reg S | 3.8 |
| Grupo Cibest SA - ADR | 3.6 |
| Hoa Phat Group JSC | 3.6 |
| Kaspi.KZ JSC - ADR | 3.5 |
HardingLoevnerFunds.com
. You can also requestthis information by calling (877) 435-8105 or by sending an e-mail request to hardingloevnerfunds@ntrs.com.
What were the Fund costs for the period?
(based on a hypothetical $10,000 investment)
| Fund (Class) | Costs of a $10,000 investment | Costs paid as a percentage of a $10,000 investment 1 |
| Frontier Emerging Markets (Institutional Class Z) | $ 63 |
1.25 % |
|
1 |
Expense ratio is expressed on an annualized basis. |
Management’s Discussion of Fund Performance
The Frontier Emerging Markets Institutional Class Z (HLFZX) rose 4.34% (net of fees and expenses) in the six-month period ended April 30, 2026. The Fund's benchmark, the MSCI Frontier Emerging Markets Index, rose 15.38% in the same period (net of source taxes).
Key Performance Factors
Frontier Emerging Markets rose despite dipping sharply in March in reaction to the US-Israel attack on Iran. Energy and Real Estate were the top-performing sectors. Europe and Latin America outperformed while Asian markets were hurt by the closing of the Strait of Hormuz. The Fund lagged the index, with weak holdings in Real Estate and Consumer Discretionary. Vietnam and Indonesia also detracted. European holdings helped relative returns.
Sector Analysis
Extreme weather and inflation hurt two Philippine holdings. Real Estate company SM Prime Holdings reported weak attendance at its malls and a decline in residential construction revenue. Jollibee Foods in Consumer Discretionary experienced weak revenue growth and rising input costs. In IT, shares of Thailand-based optical communications equipment manufacturer Fabrinet rose, supported by demand for components used in cloud computing, AI, and video streaming.
Geographic Analysis
Jollibee was the main detractor in the Philippines. In Vietnam, IT services business FPT declined due to concerns over the competitive threat from AI. Shares of Kazak uranium producer Kazatomprom were buoyed by strong prices and the prospect for increased nuclear power demand for AI data centers.
Performance
| 🡱 Top Contributors | 🡳 Top Detractors | |
| Fabrinet | Baltic Classifieds | |
| Kazatomprom | Jollibee Foods | |
| Airtel Africa | Marsa Maroc | |
| Banca Transilvania | Bank Central Asia | |
| Helios Towers | EPAM |
The securities shown do not represent all holdings, and it should not be assumed that investment in these securities has been or will be profitable. The following is available upon request: (1) information describing the methodology of the contribution data and (2) a list showing the weight and relative contribution of all holdings during the period. Contribution is the contribution to overall performance over the period.
Average Annual Total Return (%) as of April 30, 2026
1 Year |
5 Year |
10 Year |
|
| Fund | 18.15 | 5.29 | 4.23 |
| MSCI Frontier Emerging Markets Index | 44.28 | 10.43 | 6.31 |
HardingLoevnerFunds.com
for the most recent performance information.
Key Fund
Stat
isticsDuring Reporting Period
| Fund net assets | $ 117.2M |
Total advisory fees paid (after waiver/reimbursement) |
$ 0.6M |
| Total number of holdings | 55 | Period portfolio turnover rate | 13 % |
Graphical Representation of Holdings
The table and charts below show the investment makeup of the Fund; percentages indicated and graphical representations are based on the Fund’s net asset value.
Top Ten Holdings
%
Allocation
| Northern Institutional Funds - Treasury Portfolio (Premier Shares) | 4.6 |
| Credicorp Ltd. | 4.4 |
| International Container Terminal Services Inc. | 4.4 |
| Mobile World Investment Corp. | 4.3 |
| Banca Transilvania SA | 4.3 |
| Societe d'Exploitation des Ports | 3.9 |
| NAC Kazatomprom JSC - GDR, Reg S | 3.8 |
| Grupo Cibest SA - ADR | 3.6 |
| Hoa Phat Group JSC | 3.6 |
| Kaspi.KZ JSC - ADR | 3.5 |
by Sector

by Region
Top Ten Holdings
%
| Northern Institutional Funds - Treasury Portfolio (Premier Shares) | 4.6 |
| Credicorp Ltd. | 4.4 |
| International Container Terminal Services Inc. | 4.4 |
| Mobile World Investment Corp. | 4.3 |
| Banca Transilvania SA | 4.3 |
| Societe d'Exploitation des Ports | 3.9 |
| NAC Kazatomprom JSC - GDR, Reg S | 3.8 |
| Grupo Cibest SA - ADR | 3.6 |
| Hoa Phat Group JSC | 3.6 |
| Kaspi.KZ JSC - ADR | 3.5 |
HardingLoevnerFunds.com
. You can also requestthis information by calling (877) 435-8105 or by sending an e-mail request to hardingloevnerfunds@ntrs.com.
What were the Fund costs for the period?
(based on a hypothetical $10,000 investment)
| Fund (Class) | Costs of a $10,000 investment | Costs paid as a percentage of a $10,000 investment 1 |
| Frontier Emerging Markets (Investor Class) | $ 89 |
1.75 % |
|
1 |
Expense ratio is expressed on an annualized basis. |
Management’s Discussion of Fund Performance
The Frontier Emerging Markets Investor Class (HLMOX) rose 4.09% (net of fees and expenses) in the six-month period ended April 30, 2026. The Fund's benchmark, the MSCI Frontier Emerging Markets Index, rose 15.38% in the same period (net of source taxes).
Key Performance Factors
Frontier Emerging Markets rose despite dipping sharply in March in reaction to the US-Israel attack on Iran. Energy and Real Estate were the top-performing sectors. Europe and Latin America outperformed while Asian markets were hurt by the closing of the Strait of Hormuz. The Fund lagged the index, with weak holdings in Real Estate and Consumer Discretionary. Vietnam and Indonesia also detracted. European holdings helped relative returns.
Sector Analysis
Extreme weather and inflation hurt two Philippine holdings. Real Estate company SM Prime Holdings reported weak attendance at its malls and a decline in residential construction revenue. Jollibee Foods in Consumer Discretionary experienced weak revenue growth and rising input costs. In IT, shares of Thailand-based optical communications equipment manufacturer Fabrinet rose, supported by demand for components used in cloud computing, AI, and video streaming.
Geographic Analysis
Jollibee was the main detractor in the Philippines. In Vietnam, IT services business FPT declined due to concerns over the competitive threat from AI. Shares of Kazak uranium producer Kazatomprom were buoyed by strong prices and the prospect for increased nuclear power demand for AI data centers.
Performance
| 🡱 Top Contributors | 🡳 Top Detractors | |
| Fabrinet | Baltic Classifieds | |
| Kazatomprom | Jollibee Foods | |
| Airtel Africa | Marsa Maroc | |
| Banca Transilvania | Bank Central Asia | |
| Helios Towers | EPAM |
The securities shown do not represent all holdings, and it should not be assumed that investment in these securities has been or will be profitable. The following is available upon request: (1) information describing the methodology of the contribution data and (2) a list showing the weight and relative contribution of all holdings during the period. Contribution is the contribution to overall performance over the period.
Average Annual Total Return (%) as of April 30, 2026
1 Year |
5 Year |
10 Year |
|
| Fund | 17.70 | 4.67 | 3.62 |
| MSCI Frontier Emerging Markets Index | 44.28 | 10.43 | 6.31 |
HardingLoevnerFunds.com
for the most recent performance information.
Key Fun
d Statis
ticsDuring Reporting Period
| Fund net assets | $ 117.2M |
Total advisory fees paid (after waiver/reimbursement) |
$ 0.6M |
| Total number of holdings | 55 | Period portfolio turnover rate | 13 % |
Graphical Representation of Holdings
The table and charts below show the investment makeup of the Fund; percentages indicated and graphical representations are based on the Fund’s net asset value.
Top Ten Holdings
%
Allocation
| Northern Institutional Funds - Treasury Portfolio (Premier Shares) | 4.6 |
| Credicorp Ltd. | 4.4 |
| International Container Terminal Services Inc. | 4.4 |
| Mobile World Investment Corp. | 4.3 |
| Banca Transilvania SA | 4.3 |
| Societe d'Exploitation des Ports | 3.9 |
| NAC Kazatomprom JSC - GDR, Reg S | 3.8 |
| Grupo Cibest SA - ADR | 3.6 |
| Hoa Phat Group JSC | 3.6 |
| Kaspi.KZ JSC - ADR | 3.5 |
by Sector
by Region

Top Ten Holdings
%
| Northern Institutional Funds - Treasury Portfolio (Premier Shares) | 4.6 |
| Credicorp Ltd. | 4.4 |
| International Container Terminal Services Inc. | 4.4 |
| Mobile World Investment Corp. | 4.3 |
| Banca Transilvania SA | 4.3 |
| Societe d'Exploitation des Ports | 3.9 |
| NAC Kazatomprom JSC - GDR, Reg S | 3.8 |
| Grupo Cibest SA - ADR | 3.6 |
| Hoa Phat Group JSC | 3.6 |
| Kaspi.KZ JSC - ADR | 3.5 |
| [1] | Expense ratio is expressed on an annualized basis. |