Exhibit 99.1
Annual Meeting of Stockholders June 17, 2026
Forward-looking statements in this presentation speak only as of the date of
this presentation, and we undertake no obligation, and do not intend, to update these forward-looking statements to reflect events or circumstances occurring after the date of this presentation, except to the extent required by law. You are
cautioned not to place undue reliance on these forward-looking statements. 2 Cautionary Forward-Looking Statements This presentation is for informational purposes only and does not purport to include a complete discussion of the topics
mentioned and should not be relied upon as a basis for making an investment decision in the Company’s securities. This presentation also includes “forward-looking statements” within the meaning of the safe harbor provisions of the United
States Private Securities Litigation Reform Act of 1995. Forward-looking statements often include words such as “expect,” “estimate,” “project,” “budget,” “forecast,” “anticipate,” “intend,” “plan,” “may,” “will,” “could,” “should,”
“believes,” “predicts,” “potential,” “continue,” and similar expressions, but the absence of such words or expressions does not mean a statement is not forward-looking. These forward-looking statements are subject to risks and uncertainties,
including those identified below, which could cause actual future results to differ materially from historical results or from those anticipated or implied by such statements. The following factors, among others, could cause future results to
differ materially from historical results or from those indicated by forward-looking statements included in this press release: (1) the level of demand for mortgage and commercial loans, which is affected by such external factors as general
economic conditions, market interest rate levels, tax laws, and the demographics of our lending markets; (2) the direction and magnitude of changes in interest rates and the relationship between market interest rates and the yield on our
interest-earning assets and the cost of our interest-bearing liabilities; (3) the rate and amount of loan losses incurred and projected to be incurred by us, increases in the amounts of our nonperforming assets, the level of our loss
reserves and management’s judgments regarding the collectability of loans; (4) changes in the regulation of lending and deposit operations or other regulatory actions, whether industry-wide or focused on our operations, including increases in
capital requirements or directives to increase allowances for loan losses or make other changes in our business operations; (5) legislative or regulatory changes, including those that may be implemented by the current administration in
Washington, D.C. and the Federal Reserve Board; (6) possible adverse rulings, judgments, settlements and other outcomes of litigation; (7) actions undertaken by both current and potential new competitors; (8) the possibility of adverse trends
in property values or economic trends in the residential and commercial real estate markets in which we compete; (9) the effect of changes in general economic conditions; (10) the effect of geopolitical uncertainties; (11) the impact of
health crises on our future financial condition and operations; (12) the impact of any volatility in the banking sector due to the failure of certain banks due to high levels of exposure to liquidity risk, interest rate risk, uninsured
deposits and cryptocurrency risk; (13) the loss of our CDFI certification could potentially limit our grant income awards; and (14) other risks and uncertainties. All such factors are difficult to predict and are beyond our control.
Additional factors that could cause results to differ materially from those described above can be found in our annual reports on Form 10-K, quarterly reports on Form 10-Q, current reports on Form 8-K or other filings made with the SEC and
are available on our website at http://www.cityfirstbank.com and on the SEC’s website at http://www.sec.gov.
3 Agenda About Broadway Financial Corporation Corporate Overview &
Geographic Footprint Executive Management Team Value Proposition Banking on Impact 2021-2025 2025 Financial Performance Strategic Repositioning 2025 Key Financial Highlights Key Balance Sheet & Margin Metrics (GAAP) Loan &
Deposit Composition Capital and Liquidity Key Profitability & Capital Metrics 2026 Strategic & Financial Update Our Customer Promise & Strategic Intent Appendix: Non-GAAP Financial Measures
About Broadway Financial Corporation
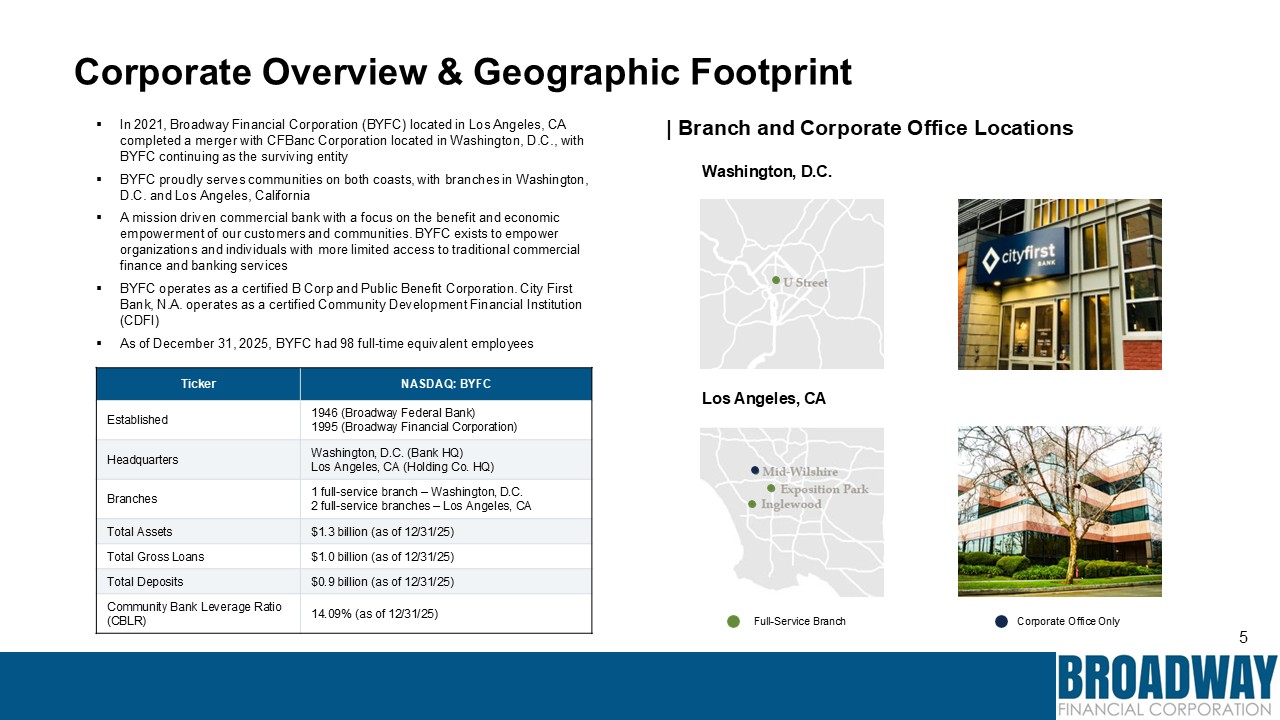
5 Corporate Overview & Geographic Footprint In 2021, Broadway Financial
Corporation (BYFC) located in Los Angeles, CA completed a merger with CFBanc Corporation located in Washington, D.C., with BYFC continuing as the surviving entity BYFC proudly serves communities on both coasts, with branches in
Washington, D.C. and Los Angeles, California A mission driven commercial bank with a focus on the benefit and economic empowerment of our customers and communities. BYFC exists to empower organizations and individuals with more limited
access to traditional commercial finance and banking services BYFC operates as a certified B Corp and Public Benefit Corporation. City First Bank, N.A. operates as a certified Community Development Financial Institution (CDFI) As of
December 31, 2025, BYFC had 98 full-time equivalent employees Ticker NASDAQ: BYFC Established 1946 (Broadway Federal Bank) 1995 (Broadway Financial Corporation) Headquarters Washington, D.C. (Bank HQ) Los Angeles, CA (Holding Co.
HQ) Branches full-service branch – Washington, D.C. full-service branches – Los Angeles, CA Total Assets $1.3 billion (as of 12/31/25) Total Gross Loans $1.0 billion (as of 12/31/25) Total Deposits $0.9 billion (as of
12/31/25) Community Bank Leverage Ratio (CBLR) 14.09% (as of 12/31/25) Los Angeles, CA Washington, D.C. | Branch and Corporate Office Locations Full-Service Branch Corporate Office Only
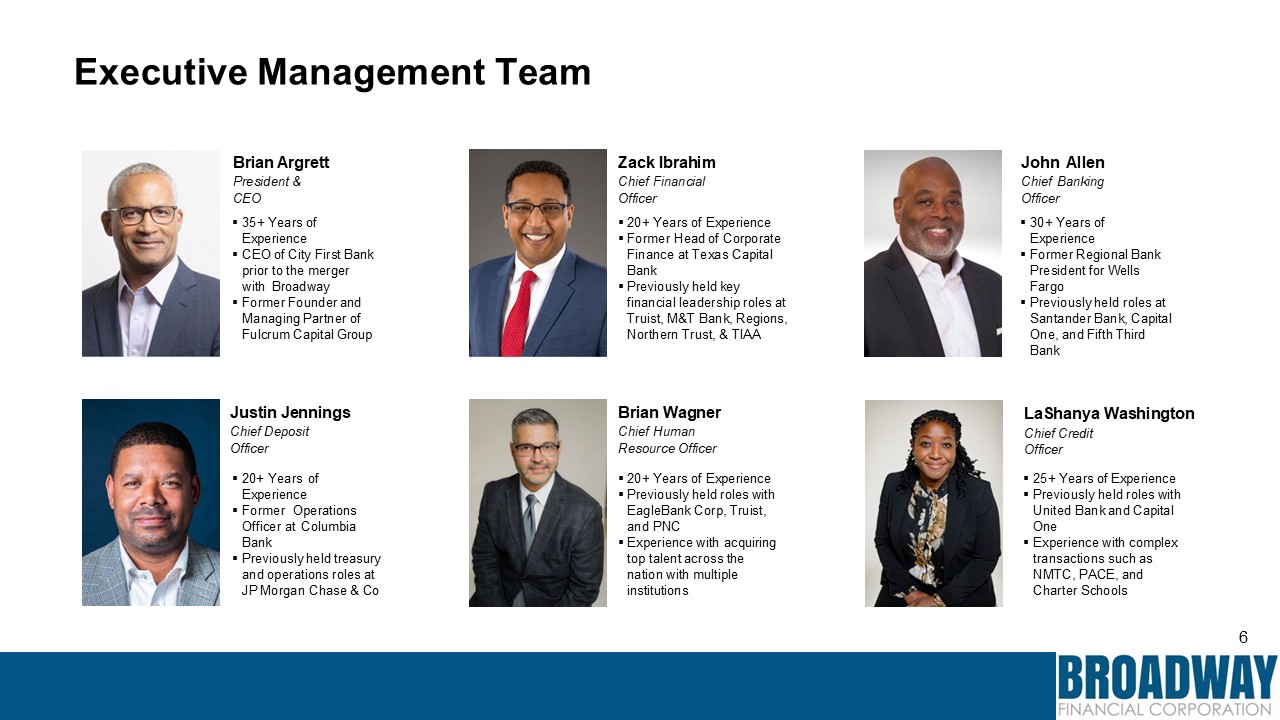
6 Executive Management Team Zack Ibrahim Chief Financial Officer 20+ Years of
Experience Former Head of Corporate Finance at Texas Capital Bank Previously held key financial leadership roles at Truist, M&T Bank, Regions, Northern Trust, & TIAA Brian Wagner Chief Human Resource Officer 20+ Years of
Experience Previously held roles with EagleBank Corp, Truist, and PNC Experience with acquiring top talent across the nation with multiple institutions John Allen Chief Banking Officer 30+ Years of Experience Former Regional Bank
President for Wells Fargo Previously held roles at Santander Bank, Capital One, and Fifth Third Bank LaShanya Washington Chief Credit Officer 25+ Years of Experience Previously held roles with United Bank and Capital One Experience with
complex transactions such as NMTC, PACE, and Charter Schools Brian Argrett President & CEO 35+ Years of Experience CEO of City First Bank prior to the merger with Broadway Former Founder and Managing Partner of Fulcrum Capital
Group Justin Jennings Chief Deposit Officer 20+ Years of Experience Former Operations Officer at Columbia Bank Previously held treasury and operations roles at JP Morgan Chase & Co
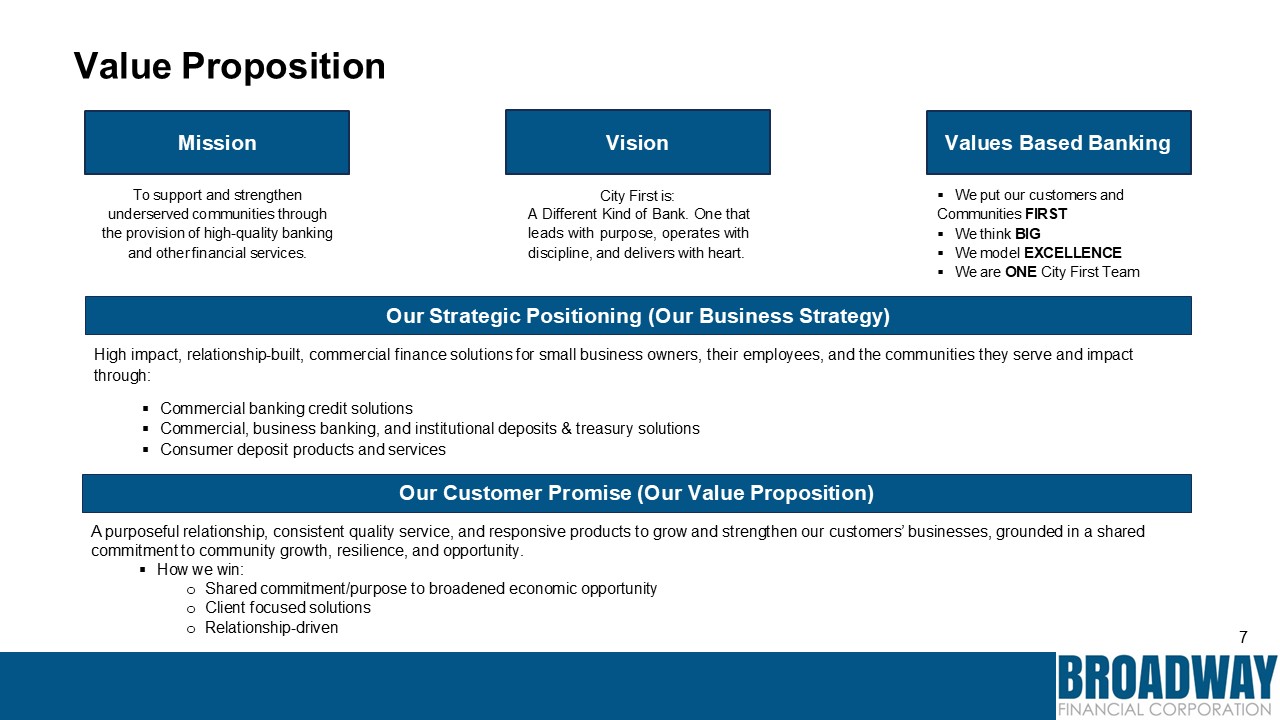
7 Our Customer Promise (Our Value Proposition) A purposeful relationship,
consistent quality service, and responsive products to grow and strengthen our customers’ businesses, grounded in a shared commitment to community growth, resilience, and opportunity. How we win: Shared commitment/purpose to broadened
economic opportunity Client focused solutions Relationship-driven Our Strategic Positioning (Our Business Strategy) High impact, relationship-built, commercial finance solutions for small business owners, their employees, and the
communities they serve and impact through: Commercial banking credit solutions Commercial, business banking, and institutional deposits & treasury solutions Consumer deposit products and services City First is: A Different Kind of
Bank. One that leads with purpose, operates with discipline, and delivers with heart. Vision To support and strengthen underserved communities through the provision of high-quality banking and other financial services. Mission We put our
customers and Communities FIRST We think BIG We model EXCELLENCE We are ONE City First Team Values Based Banking Value Proposition
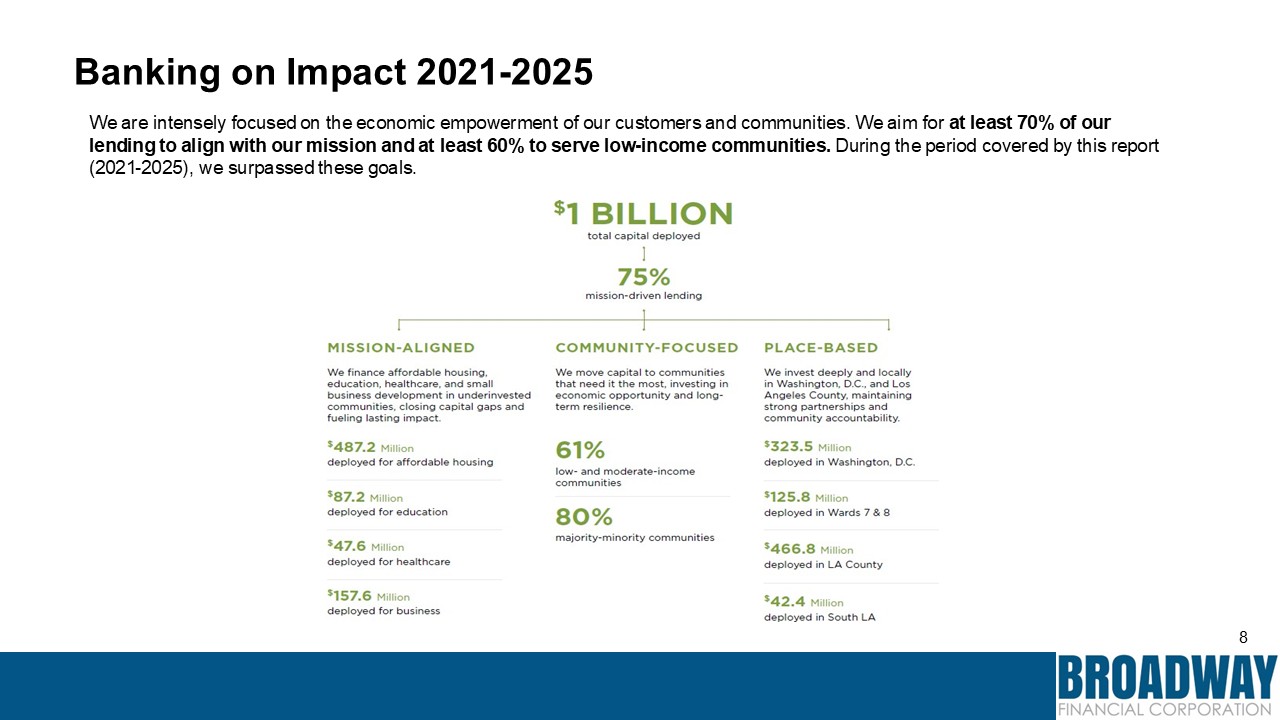
8 Banking on Impact 2021-2025 We are intensely focused on the economic
empowerment of our customers and communities. We aim for at least 70% of our lending to align with our mission and at least 60% to serve low-income communities. During the period covered by this report (2021-2025), we surpassed these goals.
2025 Financial Performance
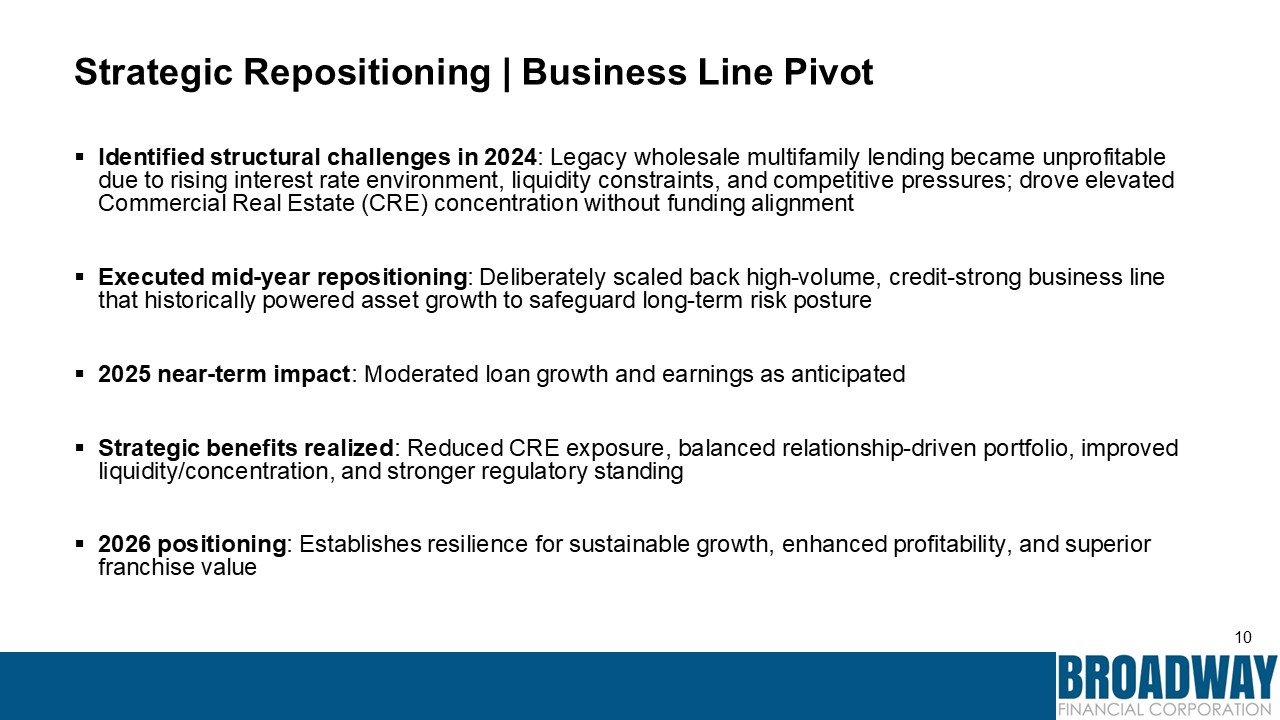
10 Strategic Repositioning | Business Line Pivot Identified structural
challenges in 2024: Legacy wholesale multifamily lending became unprofitable due to rising interest rate environment, liquidity constraints, and competitive pressures; drove elevated Commercial Real Estate (CRE) concentration without funding
alignment Executed mid-year repositioning: Deliberately scaled back high-volume, credit-strong business line that historically powered asset growth to safeguard long-term risk posture 2025 near-term impact: Moderated loan growth and
earnings as anticipated Strategic benefits realized: Reduced CRE exposure, balanced relationship-driven portfolio, improved liquidity/concentration, and stronger regulatory standing 2026 positioning: Establishes resilience for sustainable
growth, enhanced profitability, and superior franchise value
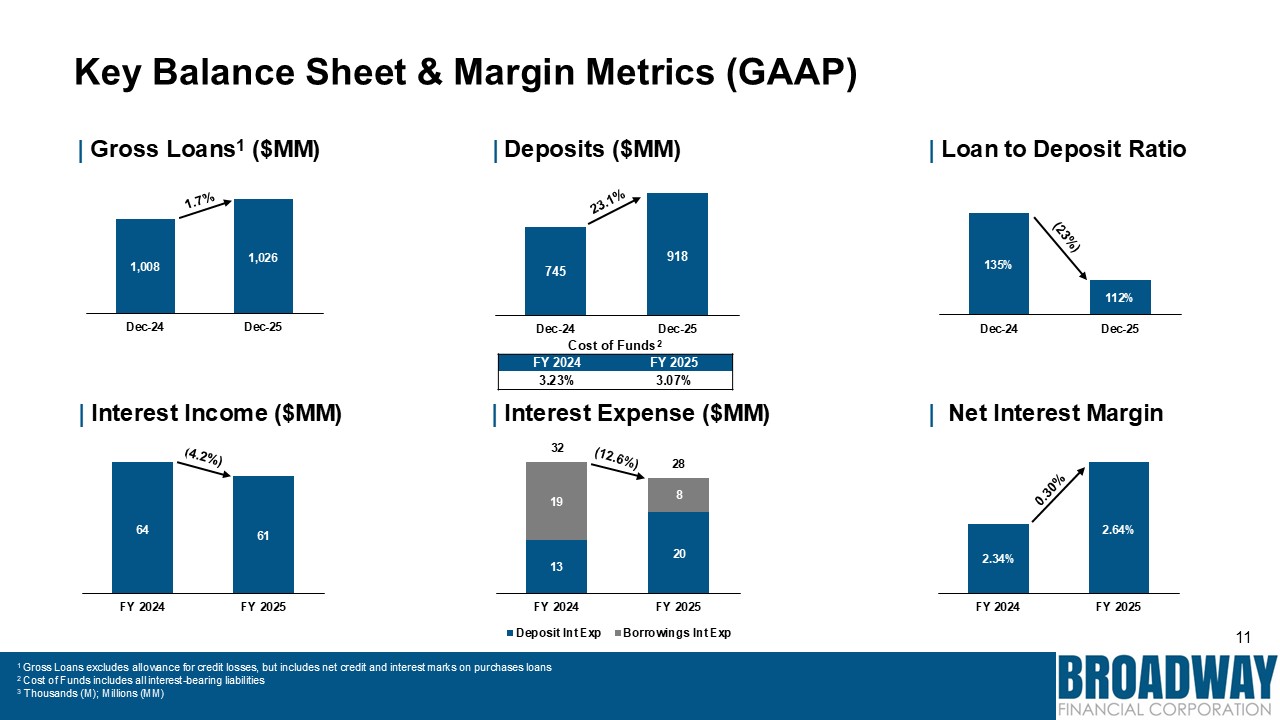
11 Key Balance Sheet & Margin Metrics (GAAP) 1 Gross Loans excludes
allowance for credit losses, but includes net credit and interest marks on purchases loans 2 Cost of Funds includes all interest-bearing liabilities 3 Thousands (M); Millions (MM) 64 61 FY 2024 FY 2025 | Interest Income
($MM) 1,008 1,026 Dec-24 Dec-25 | Gross Loans1 ($MM) | Deposits ($MM) 745 918 Dec-24 Dec-25 135% 112% Dec-24 Dec-25 | Loan to Deposit Ratio 13 20 19 8 28 FY 2024 FY 2025 Deposit Int Exp Borrowings Int Exp | Interest
Expense ($MM) 32 2.34% 2.64% FY 2024 FY 2025 | Net Interest Margin Cost of Funds2 FY 2024 FY 2025 3.23% 3.07%
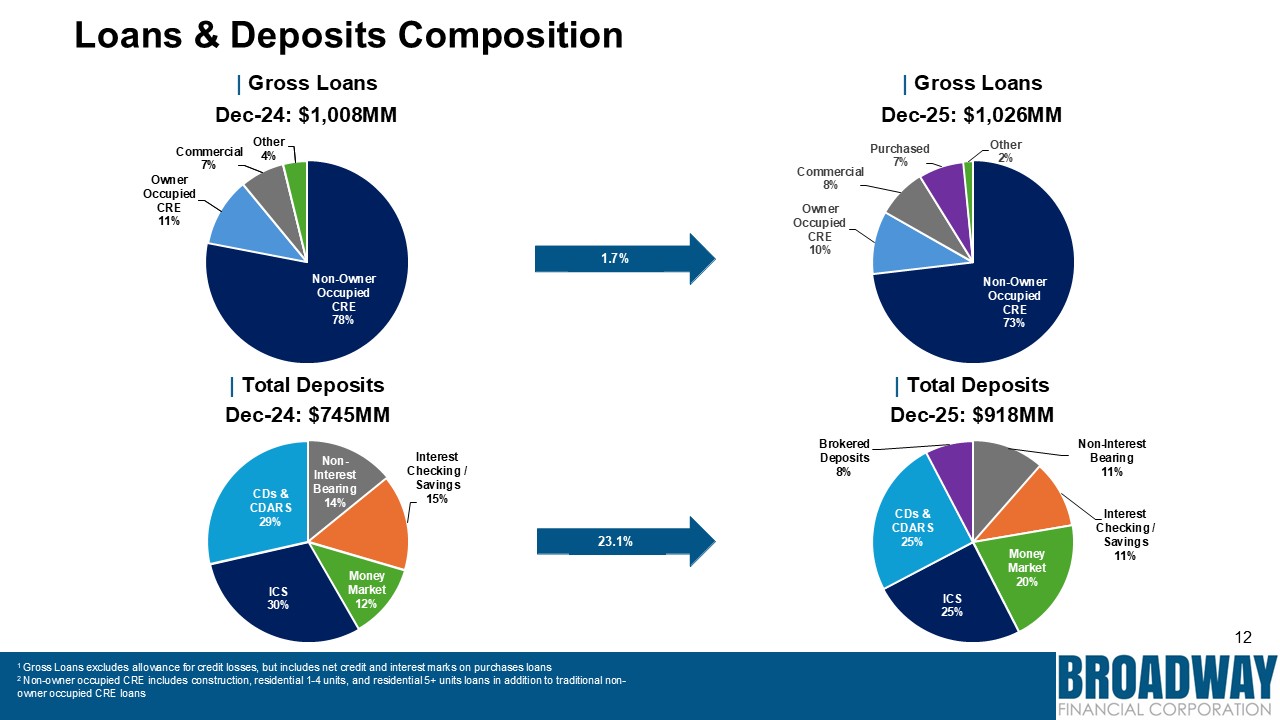
12 Non-Interest Bearing 14% Interest Checking / Savings 15% Money Market
12% ICS 30% CDs & CDARS 29% | Gross Loans Dec-25: $1,026MM Non-Owner Occupied CRE 73% Commercial 8% Owner Occupied CRE 10% Purchased 7% Other 2% Non-Owner Occupied CRE 78% Commercial 7% Owner Occupied CRE 11% | Gross Loans
Dec-24: $1,008MM Other 4% | Total Deposits Dec-24: $745MM | Total Deposits Dec-25: $918MM 1.7% 23.1% Non-Interest Bearing 11% Interest Checking / Savings 11% Money Market 20% ICS 25% CDs & CDARS 25% Brokered Deposits 8% 1
Gross Loans excludes allowance for credit losses, but includes net credit and interest marks on purchases loans 2 Non-owner occupied CRE includes construction, residential 1-4 units, and residential 5+ units loans in addition to traditional
non-owner occupied CRE loans Loans & Deposits Composition
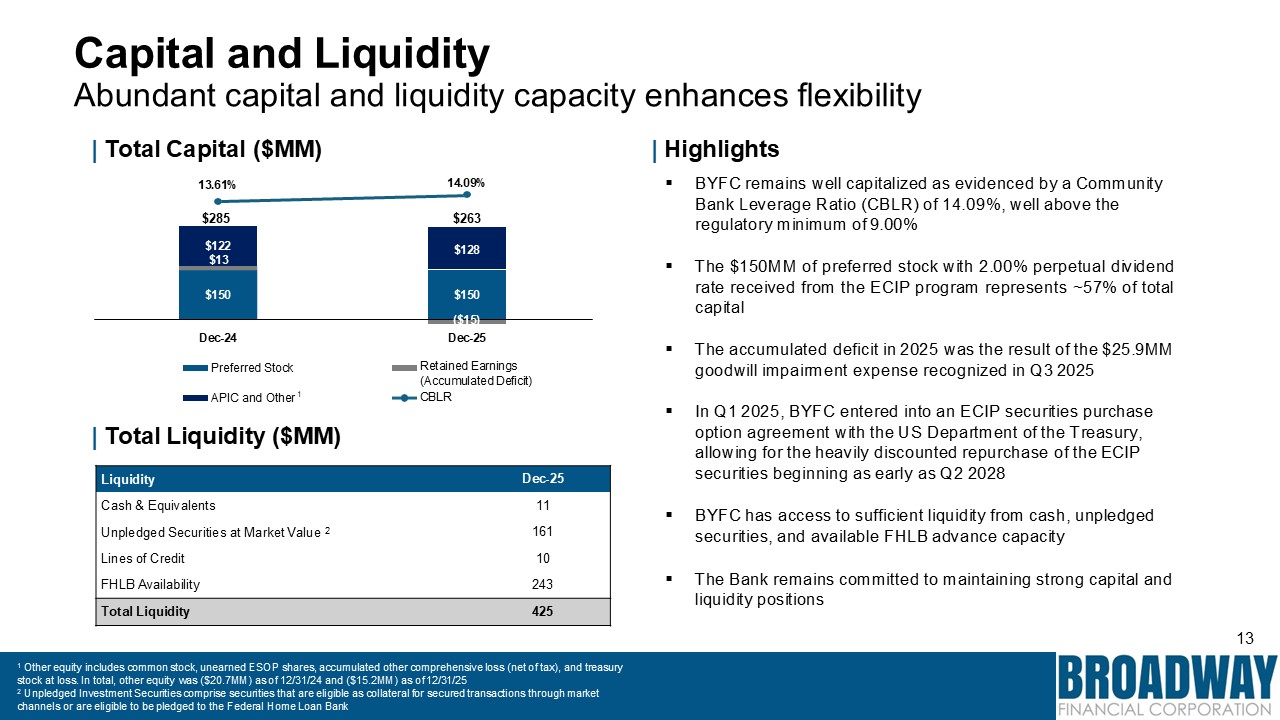
BYFC has access to sufficient liquidity from cash, unpledged securities, and
available FHLB advance capacity The Bank remains committed to maintaining strong capital and liquidity positions 13 $150 $150 ($15) $122 $13 $128 14.09% | Total Capital ($MM) | Highlights 13.61% Dec-24 Dec-25 Preferred
Stock Retained Earnings (Accumulated Deficit) CBLR APIC and Other 1 $285 $263 | Total Liquidity ($MM) BYFC remains well capitalized as evidenced by a Community Bank Leverage Ratio (CBLR) of 14.09%, well above the regulatory minimum of
9.00% The $150MM of preferred stock with 2.00% perpetual dividend rate received from the ECIP program represents ~57% of total capital The accumulated deficit in 2025 was the result of the $25.9MM goodwill impairment expense recognized in
Q3 2025 In Q1 2025, BYFC entered into an ECIP securities purchase option agreement with the US Department of the Treasury, allowing for the heavily discounted repurchase of the ECIP securities beginning as early as Q2
2028 Liquidity Dec-25 Cash & Equivalents 11 Unpledged Securities at Market Value 2 161 Lines of Credit 10 FHLB Availability 243 Total Liquidity 425 Capital and Liquidity Abundant capital and liquidity capacity enhances
flexibility 1 Other equity includes common stock, unearned ESOP shares, accumulated other comprehensive loss (net of tax), and treasury stock at loss. In total, other equity was ($20.7MM) as of 12/31/24 and ($15.2MM) as of 12/31/25 2
Unpledged Investment Securities comprise securities that are eligible as collateral for secured transactions through market channels or are eligible to be pledged to the Federal Home Loan Bank
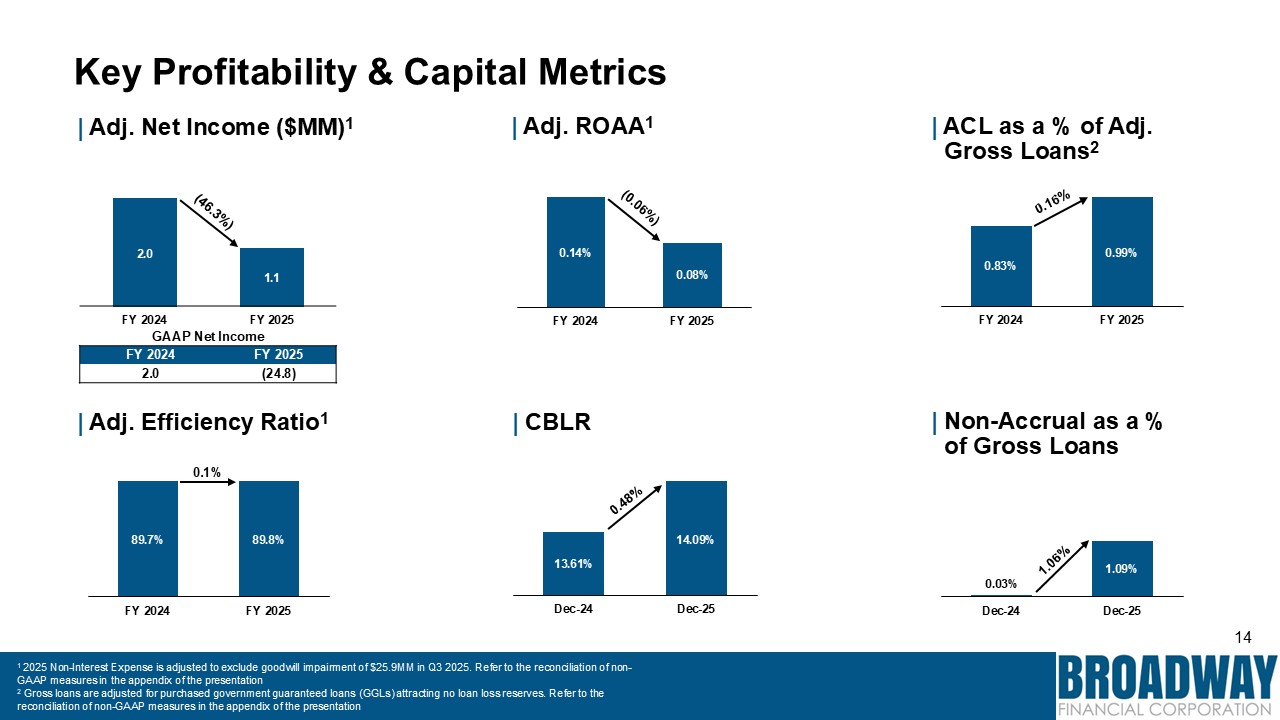
14 Key Profitability & Capital Metrics 0.14% 0.08% FY 2024 FY 2025 |
Adj. Net Income ($MM)1 | Adj. ROAA1 0.83% 0.99% FY 2024 FY 2025 | ACL as a % of Adj. Gross Loans2 2.0 1.1 FY 2024 FY 2025 GAAP Net Income FY 2024 FY 2025 2.0 (24.8) 89.7% 89.8% FY 2024 FY
2025 0.1% 13.61% 14.09% Dec-24 Dec-25 0.03% 1.09% Dec-24 Dec-25 1 2025 Non-Interest Expense is adjusted to exclude goodwill impairment of $25.9MM in Q3 2025. Refer to the reconciliation of non-GAAP measures in the appendix of the
presentation 2 Gross loans are adjusted for purchased government guaranteed loans (GGLs) attracting no loan loss reserves. Refer to the reconciliation of non-GAAP measures in the appendix of the presentation | Adj. Efficiency Ratio1 |
CBLR | Non-Accrual as a % of Gross Loans
2026 Strategic & Financial Update
16 Our strategic intent is to be recognized as a national market leader in
high-impact, mission-driven business banking solutions with focus on C&I, CRE, and Small Business Lending. We leverage our relationship managers, partners & digital solutions to expand access to credit & build community economic
vitality. Our vision of serving the best interests of our people, communities, clients, and owners is the driving force to our sustainability. We have 4 strategic areas of focus: Attract, develop, and retain high performing, in-market,
mission aligned relationship managers Build out differentiated deposit and treasury management solutions and channels Streamline and digitize business processes to support scale, efficiencies, and customer experience Have shared values and
principles at the root of every aspect of our growth and expansion Long-term Strategic Intent (2026-2030 Plan Excerpt)
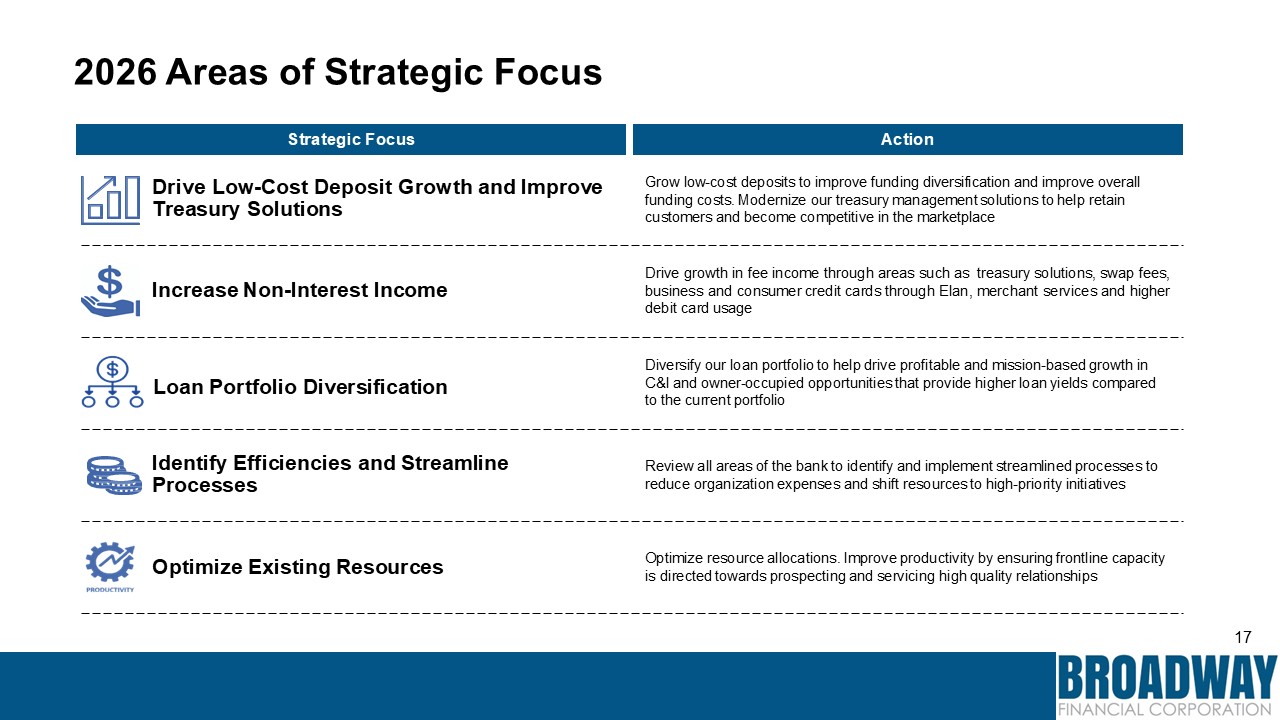
17 2026 Areas of Strategic Focus Strategic Focus Action Grow low-cost
deposits to improve funding diversification and improve overall funding costs. Modernize our treasury management solutions to help retain customers and become competitive in the marketplace Drive growth in fee income through areas such as
treasury solutions, swap fees, business and consumer credit cards through Elan, merchant services and higher debit card usage Diversify our loan portfolio to help drive profitable and mission-based growth in C&I and owner-occupied
opportunities that provide higher loan yields compared to the current portfolio Review all areas of the bank to identify and implement streamlined processes to reduce organization expenses and shift resources to high-priority
initiatives Optimize resource allocations. Improve productivity by ensuring frontline capacity is directed towards prospecting and servicing high quality relationships Drive Low-Cost Deposit Growth and Improve Treasury Solutions Increase
Non-Interest Income Loan Portfolio Diversification Identify Efficiencies and Streamline Processes Optimize Existing Resources
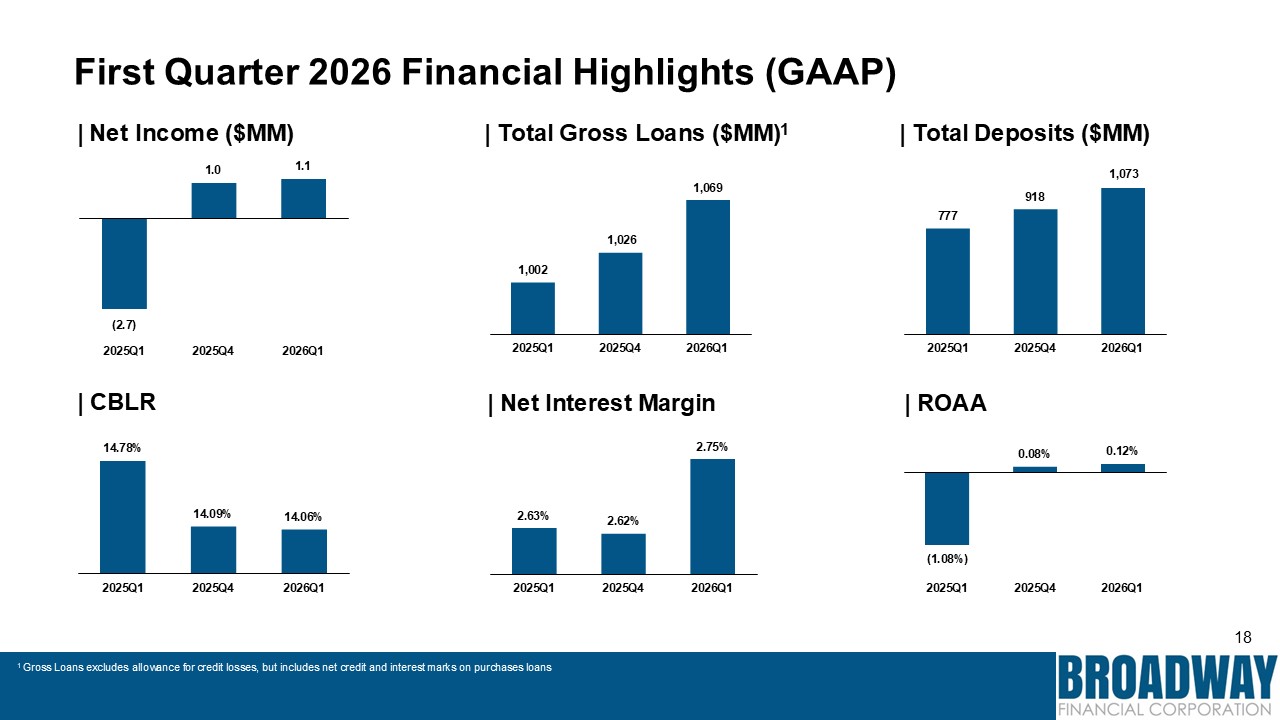
18 First Quarter 2026 Financial Highlights
(GAAP) (2.7) 1.0 1.1 2025Q1 2025Q4 2026Q1 | Net Income ($MM) | Total Gross Loans ($MM)1 | Total Deposits ($MM) 1,073 777 918 2025Q1 2025Q4 2026Q1 1,026 1,002 1,069 2025Q1 2025Q4 2026Q1 | Net Interest
Margin 2.63% 2.62% 2.75% 2025Q1 2025Q4 2026Q1 | ROAA (1.08%) 0.08% 0.12% 2025Q1 2025Q4 2026Q1 | CBLR 14.78% 14.09% 14.06% 2025Q1 2025Q4 2026Q1 1 Gross Loans excludes allowance for credit losses, but includes net credit
and interest marks on purchases loans
19 Our Customer Promise & Strategic Intent To continue this story and see
how we proudly fulfill our promise with Impact on behalf of all of our stakeholders, please take a look at our: 2021-2025 Impact Book (click here) Our strategic intent is to be recognized as a national market leader in high-impact,
mission-driven business banking solutions with focus on C&I, CRE, and Small Business Lending. Our customer promise is a purposeful relationship, consistent quality service, and responsive products to grow and strengthen our customers’
businesses -- all grounded in a shared commitment to community growth, resilience, and opportunity. Thank You
Appendix: Non-GAAP Financial Measures
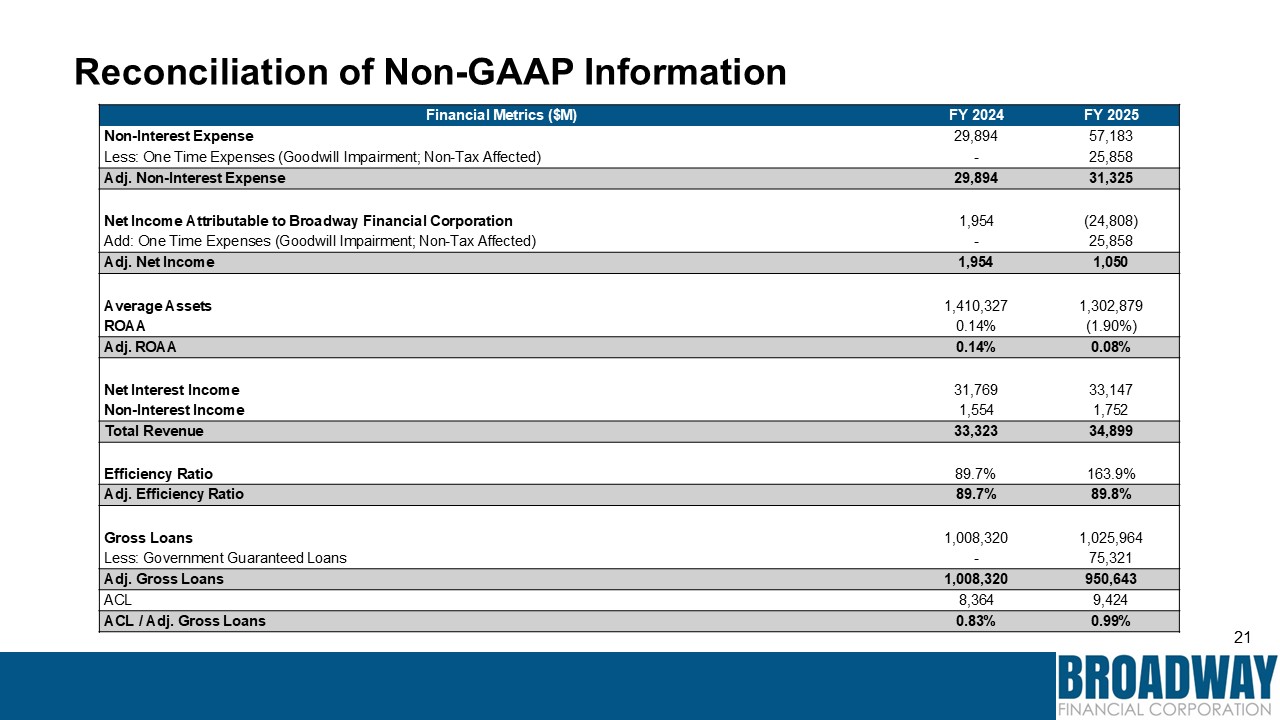
21 Reconciliation of Non-GAAP Information Financial Metrics ($M) FY 2024 FY
2025 Non-Interest Expense 29,894 57,183 Less: One Time Expenses (Goodwill Impairment; Non-Tax Affected) - 25,858 Adj. Non-Interest Expense 29,894 31,325 Net Income Attributable to Broadway Financial
Corporation 1,954 (24,808) Add: One Time Expenses (Goodwill Impairment; Non-Tax Affected) - 25,858 Adj. Net Income 1,954 1,050 Average Assets 1,410,327 1,302,879 ROAA 0.14% (1.90%) Adj. ROAA 0.14% 0.08% Net Interest
Income 31,769 33,147 Non-Interest Income 1,554 1,752 Total Revenue 33,323 34,899 Efficiency Ratio 89.7% 163.9% Adj. Efficiency Ratio 89.7% 89.8% Gross Loans 1,008,320 1,025,964 Less: Government Guaranteed
Loans - 75,321 Adj. Gross Loans 1,008,320 950,643 ACL 8,364 9,424 ACL / Adj. Gross Loans 0.83% 0.99%