Pay Versus Performance
The following table sets forth information concerning the compensation of our named executive officers for each of the fiscal years ended December 31, 2025 and 2024, as applicable, and our financial performance for each such fiscal year:
|
|
|
|
|
|
|
|
|
|
|
|
|
|
Value of Initial Fixed $100 Investment Based on: |
|
|
|
|
||||||
Year |
|
Summary Compensation Table Total for PEO |
|
|
Compensation Actually Paid to PEO |
|
|
Average Summary Compensation Table Total for Non-PEO NEOs |
|
|
Average Compensation Actually Paid to Non-PEO NEOs |
|
|
Total Stockholder Return ("TSR") |
|
|
Net Loss (in thousands) |
|
||||||
2025 |
|
|
2,344,966 |
|
|
|
3,194,176 |
|
|
|
928,737 |
|
|
|
1,277,410 |
|
|
|
331.34 |
|
|
|
(34,280 |
) |
2024 |
|
|
1,576,634 |
|
|
|
3,004,914 |
|
|
|
916,438 |
|
|
|
1,588,179 |
|
|
|
254.70 |
|
|
|
(31,404 |
) |
Compensation actually paid to our named executive officers represents the “Total” compensation reported in the Summary Compensation Table for the applicable fiscal year, as adjusted as follows:
|
|
2025 |
|
|
2024 |
|
||||||||||
Adjustments |
|
PEO |
|
|
Average Non-PEO NEOs |
|
|
PEO |
|
|
Average Non-PEO NEOs |
|
||||
Total Compensation for Covered Fiscal Year from Summary Compensation Table |
|
|
2,344,966 |
|
|
|
928,737 |
|
|
|
1,576,634 |
|
|
|
916,438 |
|
Deduct Grant Date Fair Value of Option Awards and Stock Awards Granted in Fiscal Year |
|
|
(1,307,238 |
) |
|
|
(256,000 |
) |
|
|
(458,388 |
) |
|
|
(205,440 |
) |
Add Fair Value at Fiscal Year-End of Outstanding and Unvested Option Awards and Stock Awards in Fiscal Year |
|
|
1,484,686 |
|
|
|
290,750 |
|
|
|
1,276,632 |
|
|
|
572,160 |
|
Add Change in Fair Value of Outstanding and Unvested Option Awards and Stock Awards in Prior Fiscal Years |
|
|
442,653 |
|
|
|
203,909 |
|
|
|
516,159 |
|
|
|
258,080 |
|
Add Fair Value at Vesting of Option Awards and Stock Awards Granted in Fiscal Year That Vested During Fiscal Year |
|
|
— |
|
|
|
— |
|
|
|
— |
|
|
|
— |
|
Add Change in Fair Value as of Vesting Date of Option Awards and Stock Awards Granted in Prior Fiscal Years for Which Applicable Vesting Conditions Were Satisfied During Fiscal Year |
|
|
229,109 |
|
|
|
110,014 |
|
|
|
93,877 |
|
|
|
46,941 |
|
Deduct Fair Value as of Prior Fiscal Year-End of Option Awards and Stock Awards Granted in Prior Fiscal Years That Failed to Meet Applicable Vesting Conditions During Fiscal Year |
|
|
— |
|
|
|
— |
|
|
|
— |
|
|
|
— |
|
Total Compensation Actually Paid |
|
|
3,194,176 |
|
|
|
1,277,410 |
|
|
|
3,004,914 |
|
|
|
1,588,179 |
|
The fair value of equity awards was determined using methodologies and assumptions developed in a manner substantively consistent with those used to determine the grant date fair value of such awards.
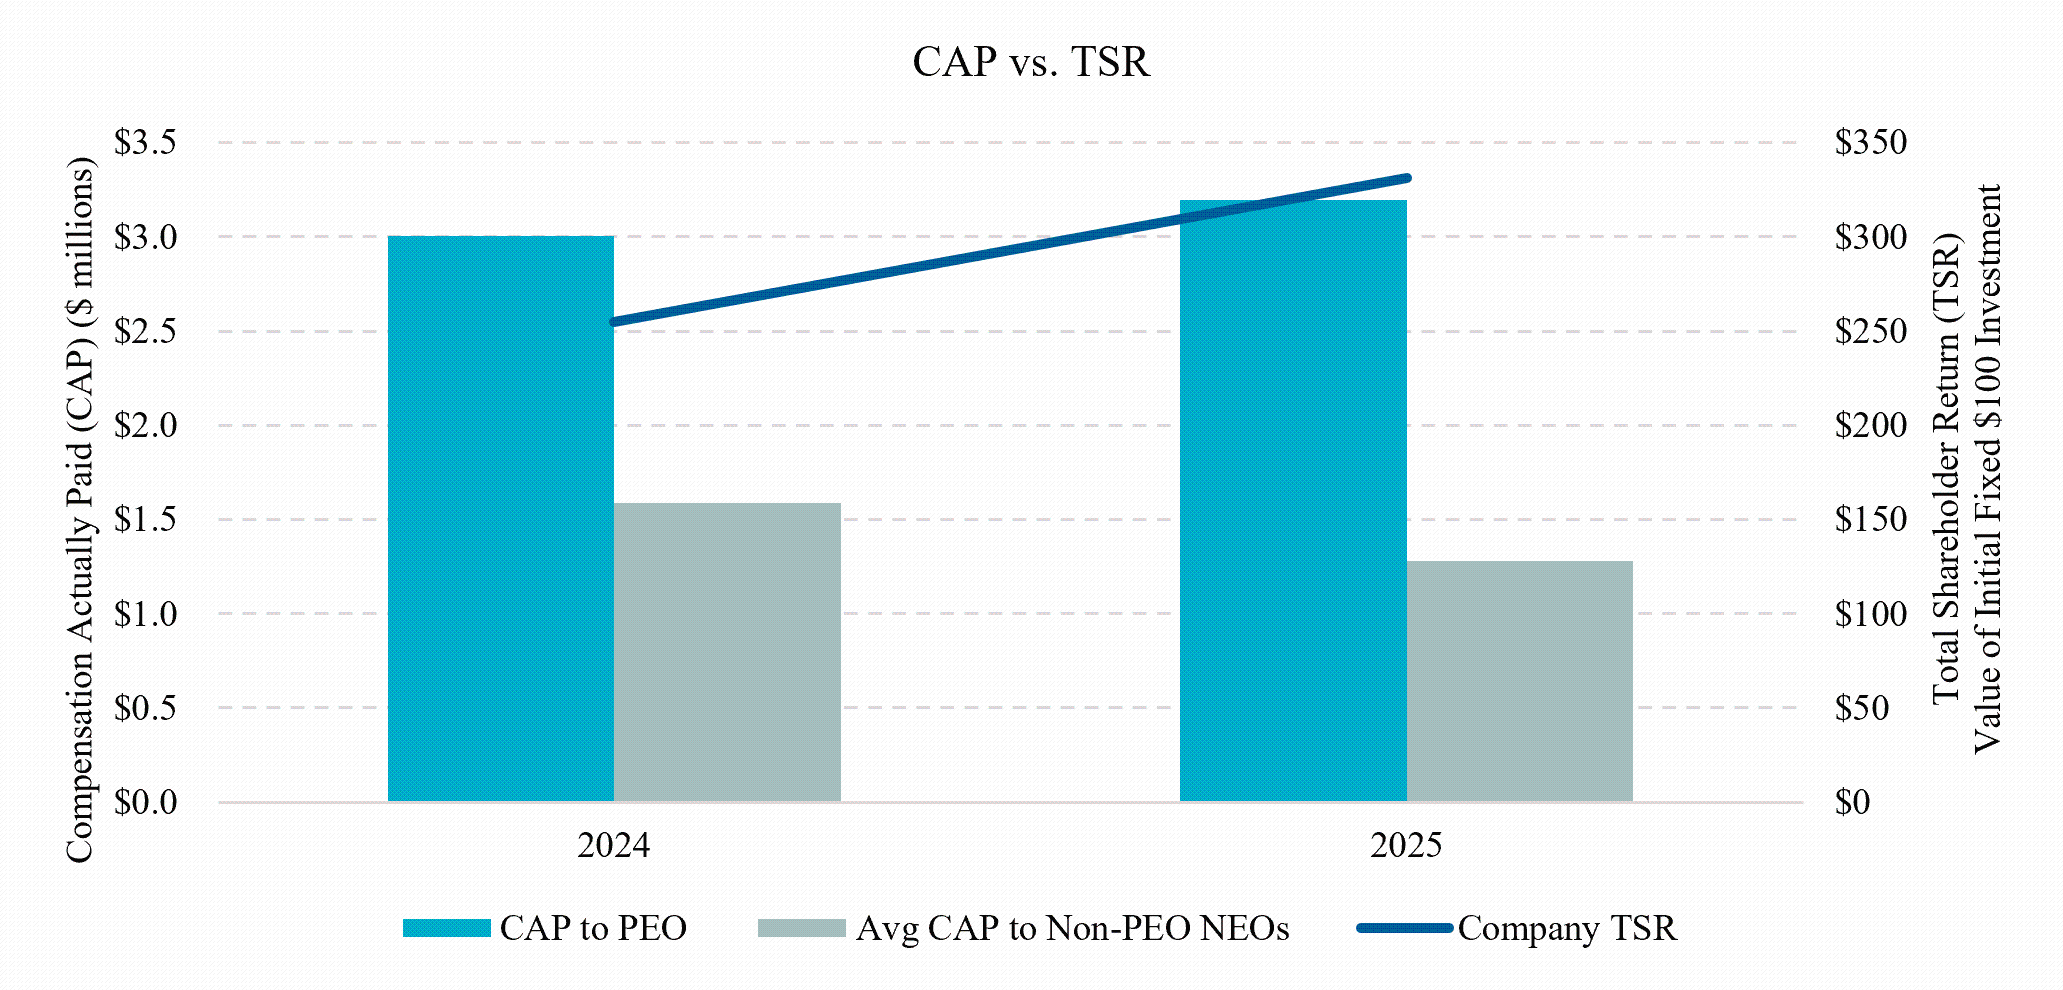
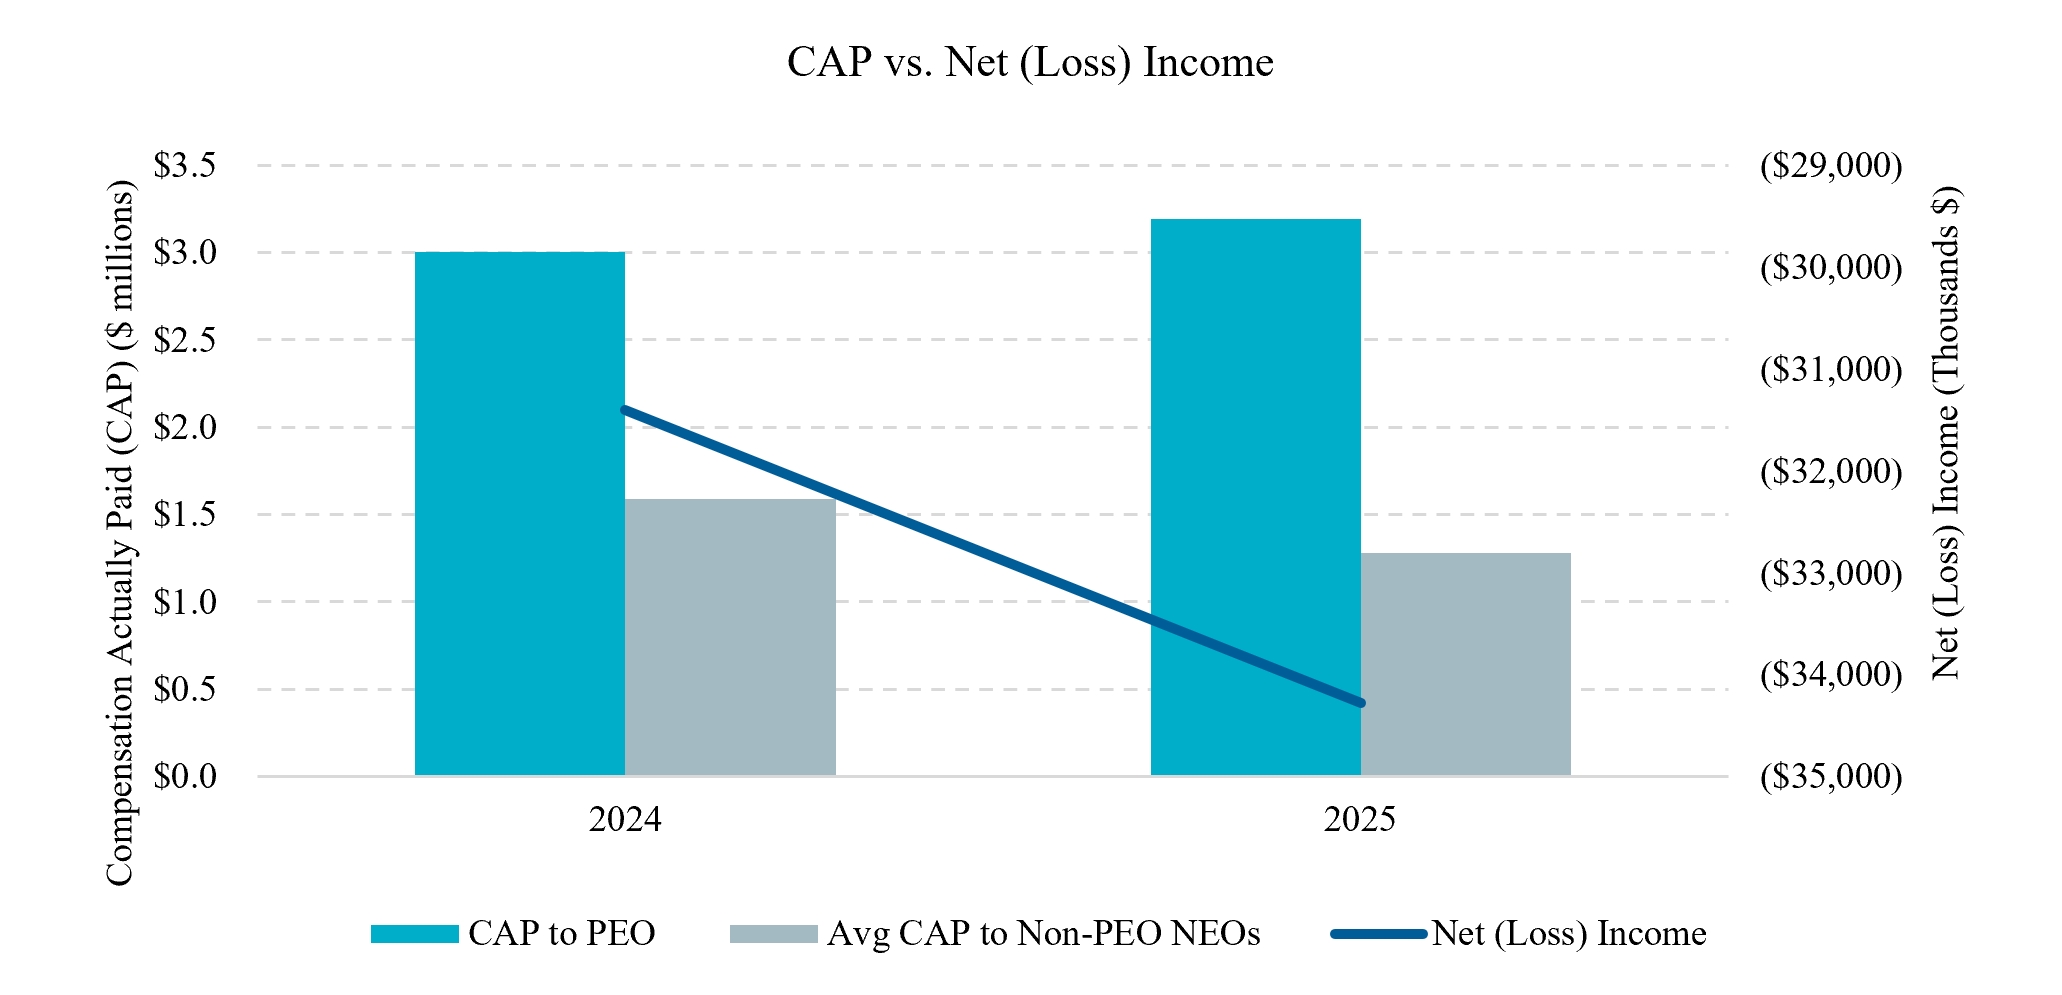
Relationship Between Financial Performance Measures
The graphs below compare the compensation actually paid to our principal executive officer and the average of the compensation actually paid to our remaining named executive officers, with (i) our cumulative TSR and (ii) our Net
Loss, in each case, for the fiscal years ended December 31, 2025 and 2024. TSR amounts reported in the graph assume an initial fixed investment of $100, and that all dividends, if any, were reinvested.
Compensation actually paid to our named executive officers represents the “Total” compensation reported in the Summary Compensation Table for the applicable fiscal year, as adjusted as follows:
|
|
2025 |
|
|
2024 |
|
||||||||||
Adjustments |
|
PEO |
|
|
Average Non-PEO NEOs |
|
|
PEO |
|
|
Average Non-PEO NEOs |
|
||||
Total Compensation for Covered Fiscal Year from Summary Compensation Table |
|
|
2,344,966 |
|
|
|
928,737 |
|
|
|
1,576,634 |
|
|
|
916,438 |
|
Deduct Grant Date Fair Value of Option Awards and Stock Awards Granted in Fiscal Year |
|
|
(1,307,238 |
) |
|
|
(256,000 |
) |
|
|
(458,388 |
) |
|
|
(205,440 |
) |
Add Fair Value at Fiscal Year-End of Outstanding and Unvested Option Awards and Stock Awards in Fiscal Year |
|
|
1,484,686 |
|
|
|
290,750 |
|
|
|
1,276,632 |
|
|
|
572,160 |
|
Add Change in Fair Value of Outstanding and Unvested Option Awards and Stock Awards in Prior Fiscal Years |
|
|
442,653 |
|
|
|
203,909 |
|
|
|
516,159 |
|
|
|
258,080 |
|
Add Fair Value at Vesting of Option Awards and Stock Awards Granted in Fiscal Year That Vested During Fiscal Year |
|
|
— |
|
|
|
— |
|
|
|
— |
|
|
|
— |
|
Add Change in Fair Value as of Vesting Date of Option Awards and Stock Awards Granted in Prior Fiscal Years for Which Applicable Vesting Conditions Were Satisfied During Fiscal Year |
|
|
229,109 |
|
|
|
110,014 |
|
|
|
93,877 |
|
|
|
46,941 |
|
Deduct Fair Value as of Prior Fiscal Year-End of Option Awards and Stock Awards Granted in Prior Fiscal Years That Failed to Meet Applicable Vesting Conditions During Fiscal Year |
|
|
— |
|
|
|
— |
|
|
|
— |
|
|
|
— |
|
Total Compensation Actually Paid |
|
|
3,194,176 |
|
|
|
1,277,410 |
|
|
|
3,004,914 |
|
|
|
1,588,179 |
|
The fair value of equity awards was determined using methodologies and assumptions developed in a manner substantively consistent with those used to determine the grant date fair value of such awards.