Shareholder Report
Apr. 30, 2026
USD ($)
$ / shares
WHAT WERE THE FUND COSTS FOR THE LAST SIX MONTHS? (based on a hypothetical $10,000 investment)
|
Class Name
|
Costs of a $10,000 investment
|
Costs paid as a percentage of a $10,000 investment*
|
|
Investor Class
|
$91
|
1.65%**
|
KEY FUND STATISTICS (as of April 30, 2026)
|
Net Assets
|
$92,789,720
|
|
Number of Holdings
|
78
|
|
Portfolio Turnover
|
15%
|
WHAT DID THE FUND INVEST IN? (as of April 30, 2026)*
|
Top Holdings
|
(%)
|
|
First American Treasury Obligations Fund - Class Z
|
14.7%
|
|
Enterprise Products Partners, LP
|
7.8%
|
|
Energy Transfer, LP
|
6.5%
|
|
MPLX, LP
|
3.9%
|
|
National Fuel Gas Co.
|
3.0%
|
|
Plains GP Holdings LP
|
2.9%
|
|
ONEOK, Inc.
|
2.3%
|
|
Clearway Energy, Inc. - Class A
|
2.2%
|
|
Kinder Morgan, Inc.
|
2.1%
|
|
Sunoco LP
|
1.8%
|
|
Security Type
|
(%)
|
|
Common Stocks
|
59.8%
|
|
Master Limited Partnerships
|
26.0%
|
|
Money Market Funds
|
14.7%
|
|
Cash & Other
|
-0.5%
|
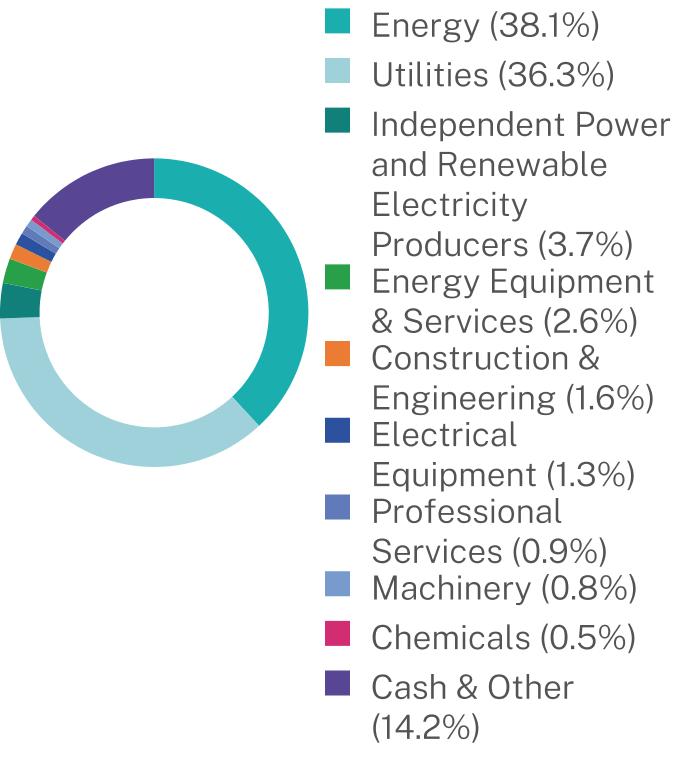
Industry Breakdown (%)
WHAT WERE THE FUND COSTS FOR THE LAST SIX MONTHS? (based on a hypothetical $10,000 investment)
|
Class Name
|
Costs of a $10,000 investment
|
Costs paid as a percentage of a $10,000 investment*
|
|
Class I
|
$69
|
1.25%**
|
KEY FUND STATISTICS (as of April 30, 2026)
|
Net Assets
|
$92,789,720
|
|
Number of Holdings
|
78
|
|
Portfolio Turnover
|
15%
|
WHAT DID THE FUND INVEST IN? (as of April 30, 2026)*
|
Top Holdings
|
(%)
|
|
First American Treasury Obligations Fund - Class Z
|
14.7%
|
|
Enterprise Products Partners, LP
|
7.8%
|
|
Energy Transfer, LP
|
6.5%
|
|
MPLX, LP
|
3.9%
|
|
National Fuel Gas Co.
|
3.0%
|
|
Plains GP Holdings LP
|
2.9%
|
|
ONEOK, Inc.
|
2.3%
|
|
Clearway Energy, Inc. - Class A
|
2.2%
|
|
Kinder Morgan, Inc.
|
2.1%
|
|
Sunoco LP
|
1.8%
|
|
Security Type
|
(%)
|
|
Common Stocks
|
59.8%
|
|
Master Limited Partnerships
|
26.0%
|
|
Money Market Funds
|
14.7%
|
|
Cash & Other
|
-0.5%
|
Industry Breakdown (%)

| [1] |
|
||
| [2] |
|
||
| [3] |
|
||
| [4] |
|
||
| [5] |
|
||
| [6] |
|