Pay vs Performance Disclosure
Mar. 31, 2026
USD ($)
Mar. 31, 2025
USD ($)
Mar. 31, 2024
USD ($)
Value of Initial Fixed $100 Investment Based On: | |||||||||||||||
Year | Summary Compensation Table Total for PEO ($)1 | Compensation Actually Paid to PEO ($)2 | Average Summary Compensation Table Total for Other NEOs ($)3 | Average Compensation Actually Paid to Other NEOs ($)2 | Total Shareholder Return ($)4 | Peer Group Total Shareholder Return ($)5 | Net Income (in millions) ($) | ROCE | |||||||
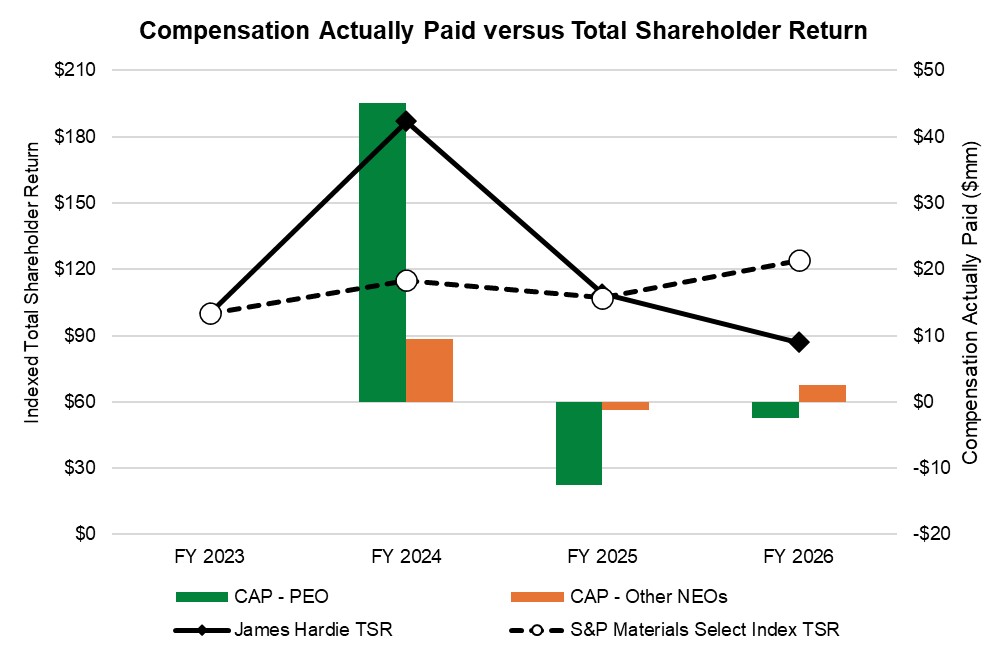
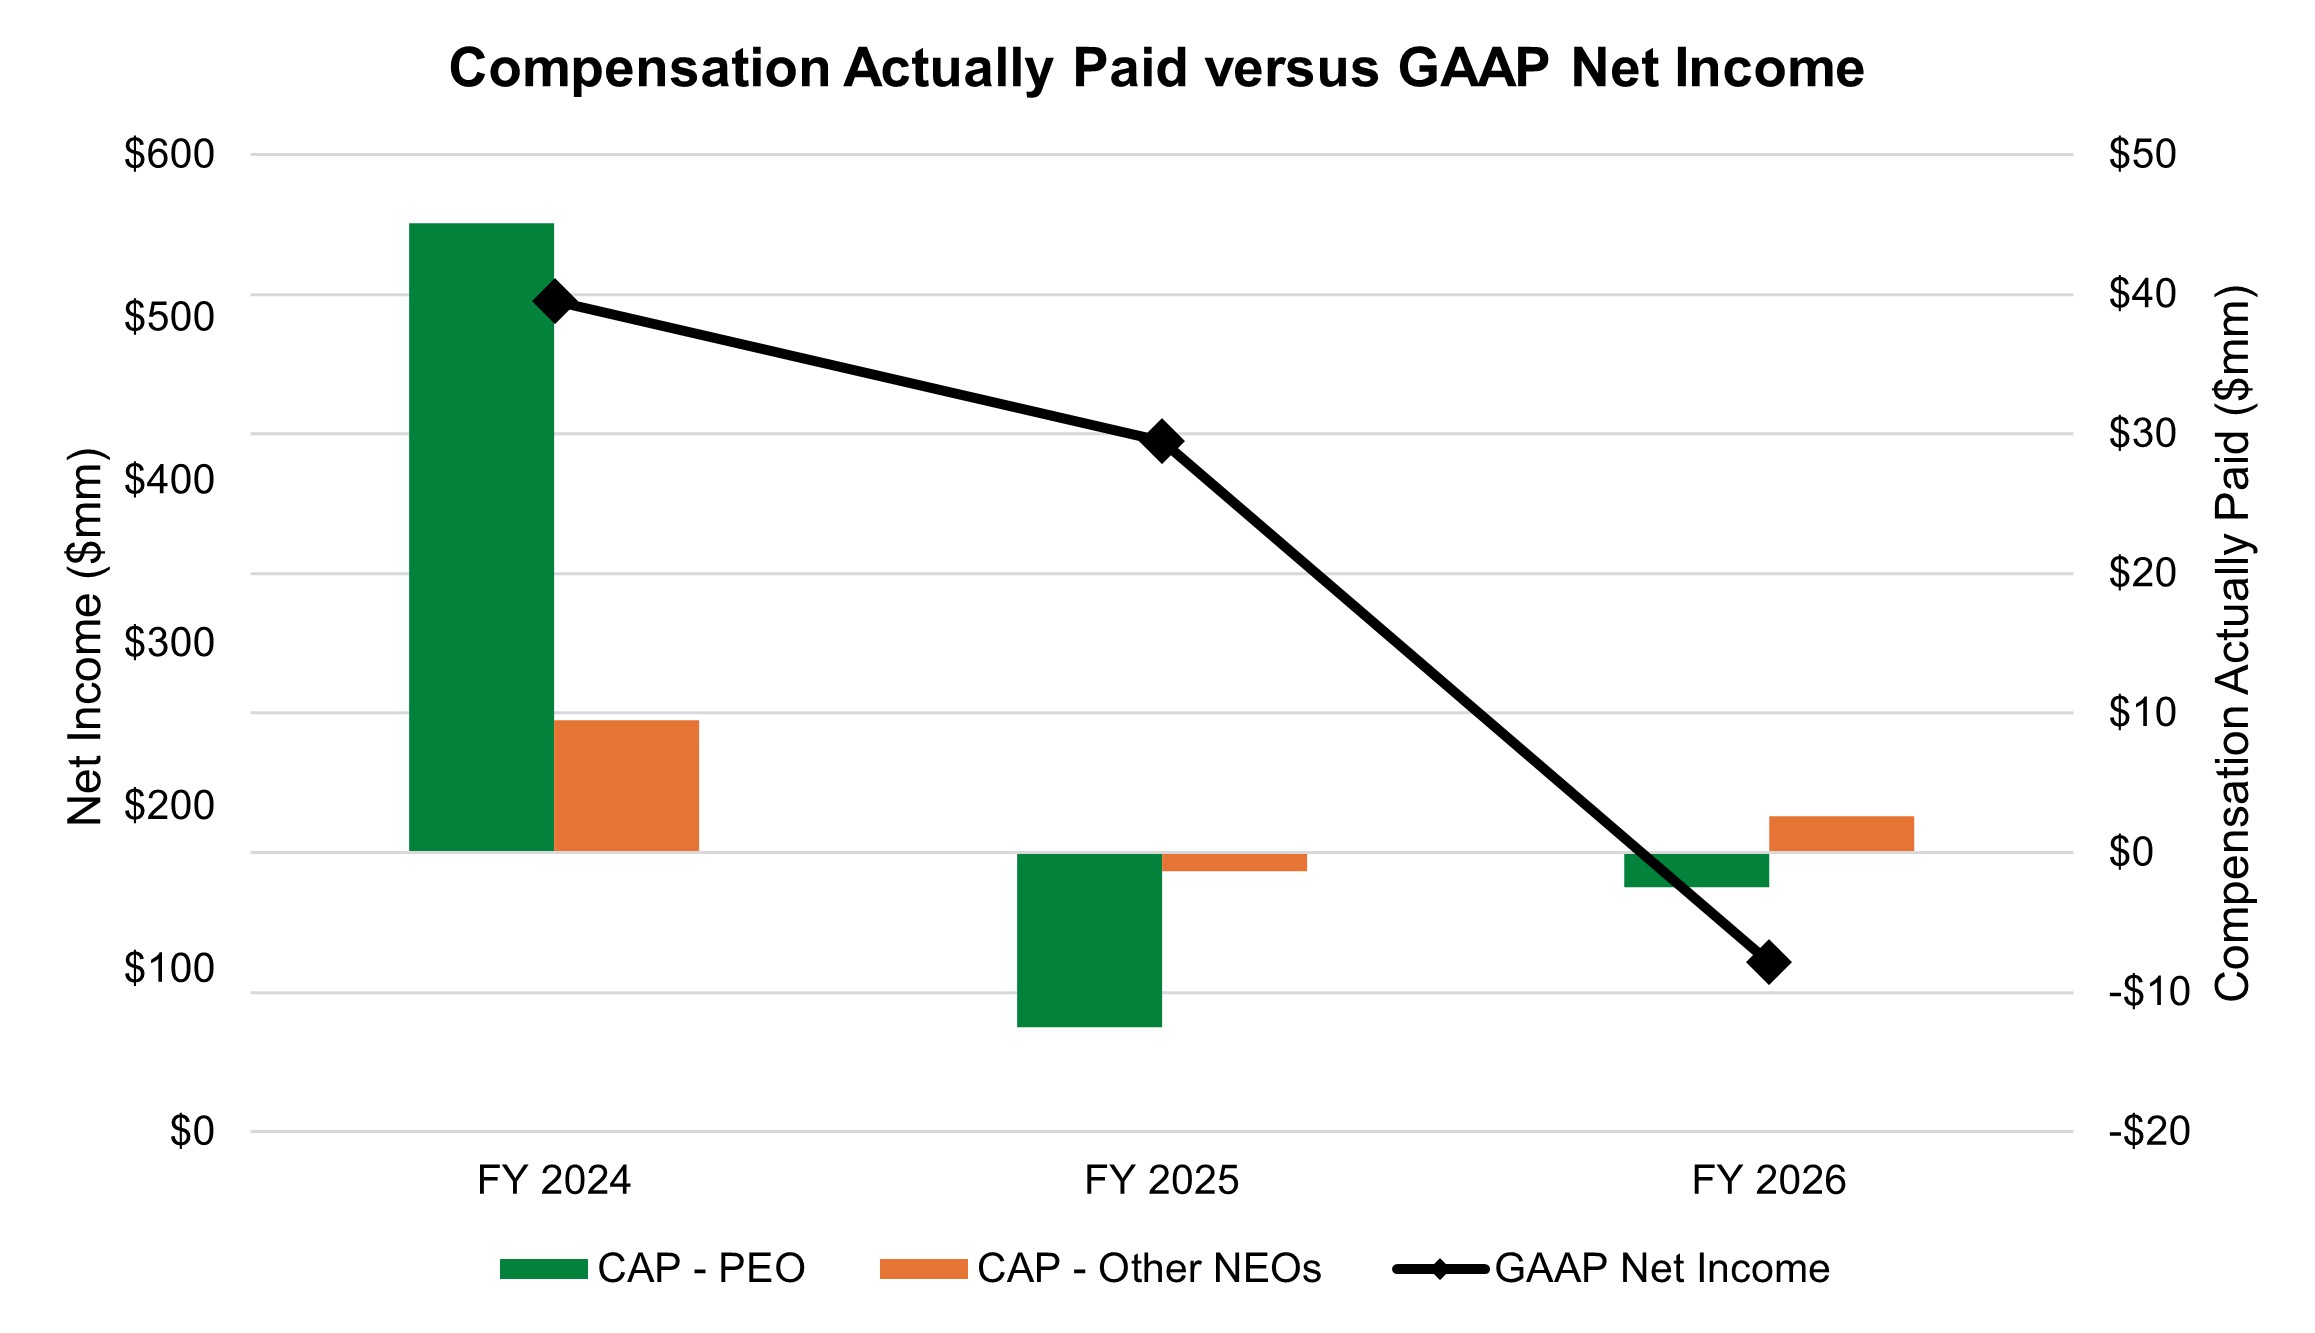
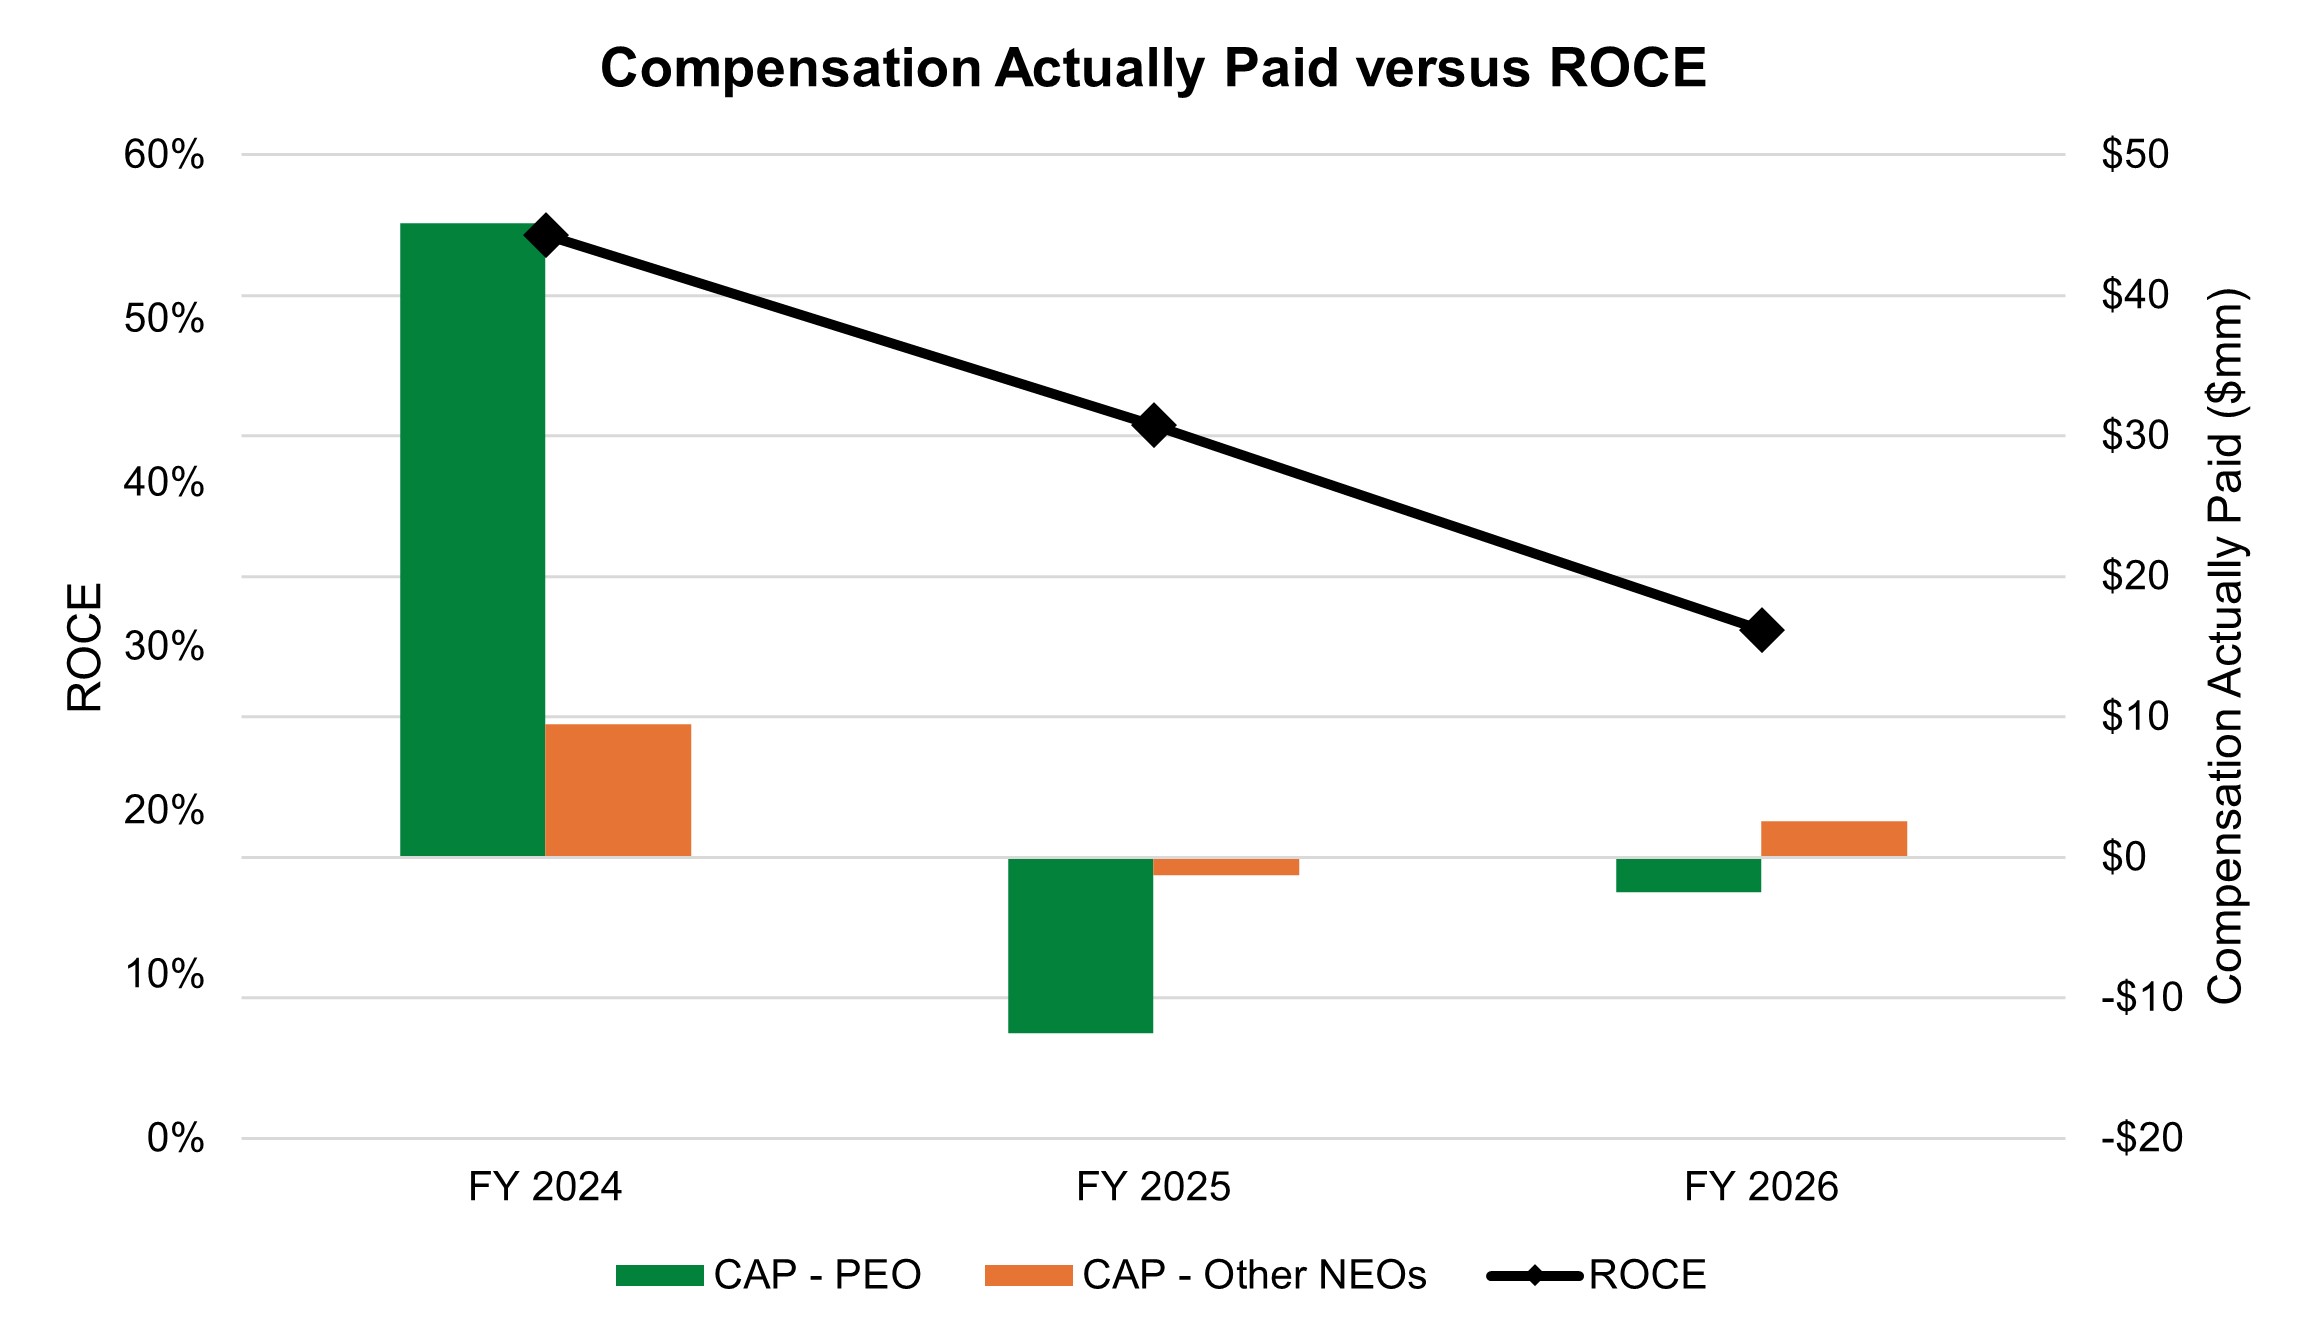
2026 | 6,545,953 | (2,456,162) | 5,123,855 | 2,610,153 | 87 | 124 | 104.0 | 31.0% | |||||||
2025 | 10,932,453 | (12,500,212) | 2,353,371 | (1,290,534) | 109 | 107 | 424.0 | 43.5% | |||||||
2024 | 11,084,916 | 45,118,300 | 3,133,087 | 9,483,007 | 187 | 115 | 510.2 | 55.1% | |||||||
and 2024 - R. Wilson, S. Gadd, and R. Kilcullen.
our NEOs:
Adjustments | 2024 | 2025 | 2026 | |||
PEO ($) | Non-PEO NEO Average ($) | PEO ($) | Non-PEO NEO Average ($) | PEO ($) | Non-PEO NEO Average ($) | |
Summary Compensation Table Total | $11,084,916 | $3,133,087 | $10,932,453 | $2,353,371 | $6,545,953 | $5,123,855 |
Deduction for amount reported in “Share Awards” column of the Summary Compensation Table | $6,687,785 | $1,604,191 | $7,707,671 | $1,200,359 | $4,658,716 | $3,193,707 |
$29,116,270 | $5,520,401 | $7,237,182 | $1,127,076 | $3,861,315 | $1,809,442 | |
Addition of fair value of awards granted during the FY that vested during the FY, determined as of vesting date (a) | $0 | $0 | $0 | $0 | $0 | $449,270 |
$10,708,940 | $1,984,896 | $(22,796,168) | $(3,471,464) | $(8,027,048) | $(726,293) | |
$895,960 | $448,813 | $(166,009) | $(99,158) | $(177,666) | $40,423 | |
$0 | $0 | $0 | $0 | $0 | $892,837 | |
Compensation Actually Paid (b) | $45,118,300 | $9,483,007 | $(12,500,212) | $(1,290,534) | $(2,456,162) | $2,610,153 |
(a)The equity awards included above comprise performance-vested RSUs inclusive of ROCE PRSUs, TSR PRSUs, Scorecard LTI
awards which we collectively refer to as “PSUs” in this footnote; service-vested RSUs which we refer to as “RSUs” in this footnote, and
stock options, granted from 2020 through 2026. The fair values of the awards were calculated as follows: (1) the fair value of PSUs
was estimated using the closing price of our common shares traded on the ASX as of the last day of the relevant measurement date,
adjusted for management’s estimate of performance as of that date, with TSR PRSUs valued using a Monte Carlo model; (2) the fair
value of RSU awards was calculated using the closing price of our common shares traded on the NYSE or ASX, as applicable, as of
the relevant measurement dates; (3) the fair value of stock option awards was calculated using a Black-Scholes model as of the
relevant measurement dates. Where amounts are converted from Australian Dollars to US Dollars, this is performed using the US
Federal Rates on the relevant measurement date.
(b)Amounts may not sum due to rounding
Most Important Financial Performance Measures |
•Net Sales |
•Adjusted EBITDA |
•Return on Capital Employed |
•Adjusted Return on Invested Capital |
•Relative TSR |
Regulation S-K, or Item 402(v), we are providing the following information regarding the relationship between the executive
“Compensation Actually Paid” as defined in Item 402(v) and our financial performance over the applicable time period of the
disclosure, calculated in a manner consistent with Item 402(v).
Although we are required to disclose “Compensation Actually Paid”, these amounts do not necessarily reflect compensation that
our NEOs actually earned in the fiscal years shown. Instead, “Compensation Actually Paid” reflects a calculation computed in
accordance with the pay-versus-performance rules, including adjustments of the values of unvested and vested equity awards
based on changes in our stock price and various accounting valuation assumptions. “Compensation Actually Paid” generally
fluctuates due to stock price performance.
For a more accurate description of our executive compensation program and the factors used by the People & Compensation
Committee to determine pay for our NEOs, see the “Compensation Discussion and Analysis” section of this Proxy Statement.
Accordingly, the following table sets forth the “Compensation Actually Paid” for the Company’s Principal Executive Officer
(“PEO”) and the average “Compensation Actually Paid” for non-PEO NEOs and the Company’s financial performance metrics for
fiscal years 2024, 2025 and 2026.
“Compensation actually paid” has been calculated in accordance with the rules outlined under Item 402(v)(2) of Regulation S-K. Details of the adjustments made to reported Summary Compensation Table totals to determine “compensation actually paid” are summarized below in
footnote Reflects James Hardie’s consolidated reported net income in millions, calculated on a GAAP basis, as reported in our Annual Report on Form 10-K filed for the fiscal year ended March 31, 2026
Table of Financial Performance MeasuresSet forth below are the most important financial performance measures that the People & Compensation Committee considers
when making executive compensation decisions, including in order to link compensation actually paid to performance and to
align executive performance with shareholder interest. The measures in this table are not listed in order of importance. Return on
Capital Employed and Relative TSR were used by the People & Compensation Committee with respect to PRSUs prior to fiscal
year 2027 and therefore continue to impact executive compensation. Adjusted EBITDA, Relative TSR and Adjusted ROIC will be
used in connection with PRSUs for fiscal year 2027. For a discussion of how the People & Compensation Committee applies the
below measures, see the Compensation Discussion and Analysis beginning on page 52.
that it is the most important financial performance measure (not otherwise required to be disclosed in the table) linking “compensation
actually paid” to company performance, given its role in our long-term incentive program.