Calamos Timpani Active SMID Growth ETF (the “Fund”) seeks capital appreciation.
The following table describes the fees and expenses that you may pay if you buy, hold and sell shares of the Fund (“Fund Shares”). Investors may pay other fees, such as brokerage commissions and other fees to financial intermediaries, which are not reflected in the tables and examples below.
Annual Fund Operating Expenses (expenses that you pay each year as a percentage of the value of your investment): | |||
Management Fees | 0.79 | % | |
Distribution and/or Service Fees (12b-1) | 0.00 | % | |
Other Expenses1 | 0.00 | % | |
Total Annual Operating Expenses | 0.79 | % | |
1 | “Other Expenses” are based on estimated amounts for the current fiscal year. |
This example is intended to help you compare the cost of investing in the Fund with the cost of investing in other funds. The example assumes that you invest $10,000 in the Fund for the time periods indicated, and then sell all of your Fund Shares at the end of those periods. The example also assumes that your investment has a 5% return each year and that the Fund’s operating expenses remain the same. Although your actual costs may be higher or lower, based on these assumptions your costs, whether you sell or hold your Fund Shares, would be:
| One Year |
|
|
| Three Years |
|
| $81 |
|
|
| $252 |
|
|
|
|
|
|
|
|
| One Year |
|
|
| Three Years |
|
| $81 |
|
|
| $252 |
|
|
|
|
|
|
|
|
The Fund pays transaction costs, such as commissions, when it buys and sells securities (or “turns over” its portfolio). A higher portfolio turnover rate may indicate higher transaction costs and may result in higher taxes when Fund Shares are held in a taxable account. These costs, which are not reflected in Annual Fund Operating Expenses or in the example, affect the Fund’s performance.
The Fund’s portfolio turnover rate is not available as the Fund had not commenced investment operations as of the date of this prospectus. The portfolio turnover rate of the Calamos Timpani SMID Growth Fund (the “Predecessor Fund”) was 192% for the fiscal year ended October 31, 2025.
Under normal circumstances, the Fund invests at least 80% of its net assets (plus any borrowings for investment purposes) in growth equity securities of small and mid-capitalization companies of issuers primarily located in the United States. The Fund defines a small and mid-capitalization company as any company with a market capitalization less than or equal to that of the company with the largest market capitalization of either the Russell 2500® Index or the MSCI USA SMID Cap Index as measured on a rolling 24-month basis over the most recent period. The market capitalization of a security is measured at the time of purchase. Calamos Advisors LLC (“Calamos Advisors”) defines “growth” to include any company, security or instrument if any of the following characteristics rank better than average when compared to the Fund’s broad-based equity index (long-term projected earnings growth, book value growth, sales growth, cash flow growth and historical earnings
growth) or if the company is included as a constituent in any of the growth indices published by third-party index providers or if the security or instrument tracks the performance of a growth index. Calamos Advisors uses fundamental research to evaluate investment opportunities, focusing on companies that it believes have superior management and whose business models have a high potential for earnings upside. Equity securities in which the Fund invests as a part of its principal investment strategy consist of common stocks and American Depositary Receipts (“ADRs”). The Fund may invest up to 25% of its net assets in foreign securities. Foreign securities are securities issued by issuers that are organized under the laws of a foreign country, that have a substantial portion of their operations or assets in a foreign country or countries, or that derive a substantial portion of their revenue or profits from businesses, investments or sales outside of the United States. The Fund may also invest in foreign securities that are represented in the United States securities markets by ADRs or similar depositary arrangements. The Fund’s foreign investments can be denominated in U.S. dollars or in foreign currencies. Calamos Advisors may actively trade portfolio securities. From time to time, the Fund may have significant investments in certain sectors due to Calamos Advisors’ investment process yielding opportunities for sound growth potential within those sectors. The Fund’s sector exposure may vary.
The Fund has not commenced operations as of the date of this prospectus. Simultaneous with the Fund’s commencement of operations, which is anticipated to occur on or about September 18, 2026, the Fund will acquire the assets and assume the liabilities of the Calamos Timpani SMID Growth Fund (the “Predecessor Fund”) in a reorganization (the “Reorganization”). As a result of the Reorganization, the Fund will adopt the performance and financial history of the Predecessor Fund’s Class I shares.
The accompanying bar chart and table provide some indication of the risks of investing in the Predecessor Fund. The bar chart shows changes in the Predecessor Fund’s performance from year to year (represented by the performance of the Predecessor Fund’s Class I). The table shows the average annual total returns of the Predecessor Fund and also compares the Predecessor Fund’s performance with the average annual total returns of a broad measure of market performance. The Fund has the same investment goal and substantially similar strategies as the Predecessor Fund. However, the Fund has a lower net expense ratio than each share class of the Predecessor Fund. As a result, the performance returns of the Fund for the periods shown would have been different than those of the Predecessor Fund. Had the Predecessor Fund been structured as an ETF, its performance may have differed.
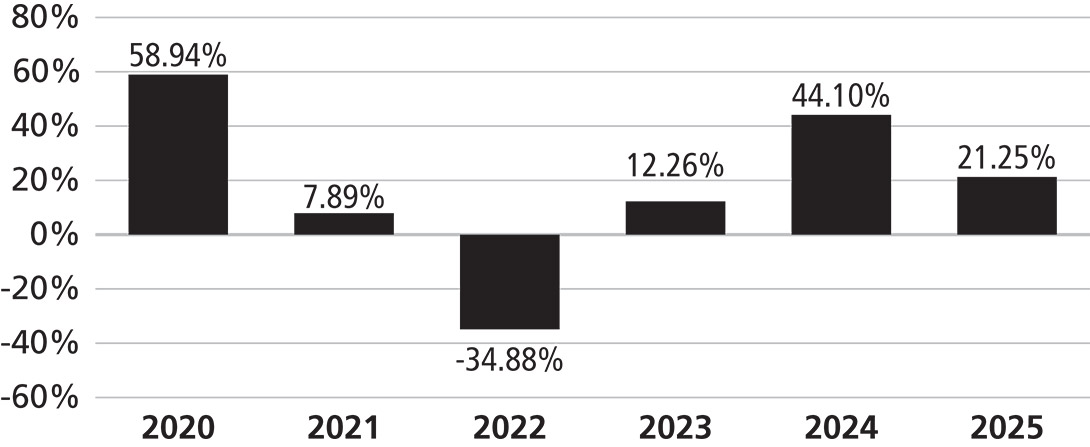
Highest Quarterly Return: | 37.58% (6.30.20) | Lowest Quarterly Return: | -22.94% (6.30.22) |
The Fund makes updated performance information, including its current net asset value per share, available at www.Calamos.com.
The Fund’s (and Predecessor Fund’s) past performance (before and after taxes) is not necessarily an indication of how the Fund will perform in the future.
AVERAGE ANNUAL TOTAL RETURNS — FOR THE PERIODS ENDED 12.31.25 | |||||||||||||||||
|
| INCEPTION |
| ONE YEAR |
| FIVE YEAR |
| SINCE |
| ||||||||
Class A |
|
| 7.31.19 |
|
|
|
|
|
|
|
|
|
|
|
|
|
|
Load Adjusted Return before taxes |
|
|
|
|
|
| 15.25 | % |
|
| 5.33 | % |
|
| 11.18 | % |
|
Class I |
|
| 7.31.19 |
|
|
|
|
|
|
|
|
|
|
|
|
|
|
Load Adjusted Return before taxes |
|
|
|
|
|
| 21.25 | % |
|
| 6.63 | % |
|
| 12.31 | % |
|
Load Adjusted Return after taxes on distributions* |
|
|
|
|
|
| 20.00 | % |
|
| 5.55 | % |
|
| 11.43 | % |
|
Load Adjusted Return after taxes on distributions and sale of Fund shares* |
|
|
|
|
|
| 13.49 | % |
|
| 4.92 | % |
|
| 9.76 | % |
|
Class R6 |
|
| 7.31.19 |
|
|
|
|
|
|
|
|
|
|
|
|
|
|
Load Adjusted Return before taxes |
|
|
|
|
|
| 21.38 | % |
|
| 6.65 | % |
|
| 12.34 | % |
|
Russell 3000 Total Return Index1 |
|
|
|
|
|
| 17.15 | % |
|
| 13.15 | % |
|
| 14.70 | % |
|
Russell 2500 Growth Index |
|
|
|
|
|
| 10.31 | % |
|
| 2.98 | % |
|
| 8.61 | % |
|
1 | The Fund’s investment adviser added the broad-based securities market index in accordance with regulatory disclosure requirements. The Fund continues to use the Russell 2500 Growth Index as an additional benchmark because the investment adviser believes it is more representative of the Fund’s investment universe than the broad-based securities market index. All index returns include the reinvestment of dividends and distributions net of withholding taxes, but do not reflect fees, brokerage commissions, or other expenses. |
* | Returns after taxes for Class I are provided because Class I shares represent the largest percentage of assets in the Calamos Family of Funds. |