The following performance information provides some indication of the risks of investing in the Fund by showing changes in the Fund’s performance over time. The following bar chart shows the Fund’s annual returns. The table illustrates how the Fund’s average annual returns for the 1-year and since inception periods compare with those of a broad measure of market performance. Although past performance of the Fund is no guarantee of how it will perform in the future, historical performance may give you some indication of the risks of investing in the Fund. Updated performance information is available on the Fund’s website at www.yieldmaxetfs.com.
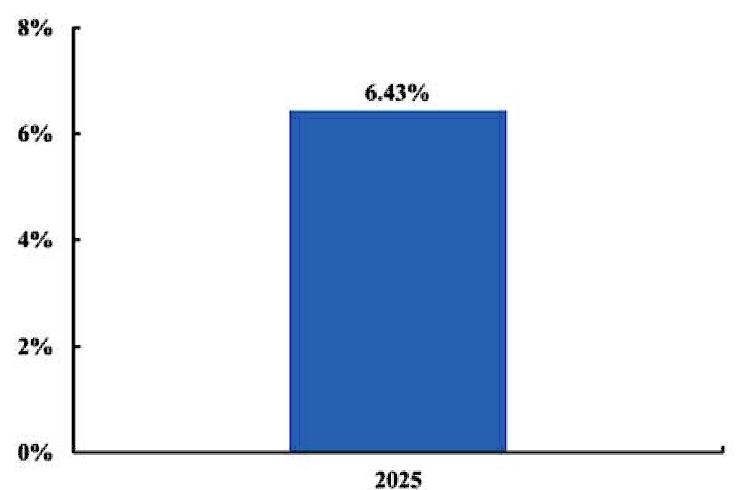
During the period of time shown in the bar chart, the Fund’s highest quarterly return was 21.10% for the quarter ended June 30, 2025 and the lowest quarterly return was -10.10% for the quarter ended March 31, 2025.
| 1 Year | Since Inception January 16, 2024 | |
| Return Before Taxes | 6.43% | 15.96% |
| Return After Taxes on Distributions | -5.95% | 4.00% |
| Return After Taxes on Distributions and Sale of Fund Shares | 3.80% | 7.72% |
| S&P 500® Total Return Index (reflects no deduction for fees, expenses, or taxes)(1) | 17.88% | 21.91% |
| (1) | The S&P 500® Total Return Index is a free-float market capitalization-weighted index of 500 of the largest U.S. companies. The index is calculated on a total return basis with dividends reinvested. |
The following performance information provides some indication of the risks of investing in the Fund by showing changes in the Fund’s performance over time. The following bar chart shows the Fund’s annual returns. The table illustrates how the Fund’s average annual returns for the 1-year and since inception periods compare with those of a broad measure of market performance. Although past performance of the Fund is no guarantee of how it will perform in the future, historical performance may give you some indication of the risks of investing in the Fund. Updated performance information is available on the Fund’s website at www.yieldmaxetfs.com.
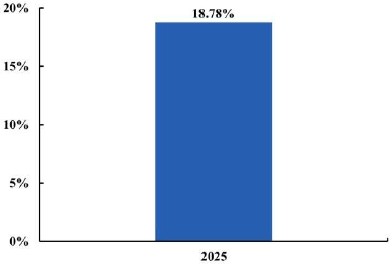
During the period of time shown in the bar chart, the Fund’s highest quarterly return was 17.08% for the quarter ended June 30, 2025 and the lowest quarterly return was -13.79% for the quarter ended March 31, 2025.
| 1 Year | Since Inception January 29, 2024 | |
| Return Before Taxes | 18.78% | 27.96% |
| Return After Taxes on Distributions | 6.86% | 16.22% |
| Return After Taxes on Distributions and Sale of Fund Shares | 10.32% | 16.09% |
| S&P 500® Total Return Index (reflects no deduction for fees, expenses, or taxes)(1) | 17.88% | 20.23% |
| (1) | The S&P 500® Total Return Index is a free-float market capitalization-weighted index of 500 of the largest U.S. companies. The index is calculated on a total return basis with dividends reinvested. |