Exhibit 99.1
 I N V E ST OR P R E S EN TATI ON J un e 2 02 6 |
| Forward Looking Statements This presentation contains “forward-looking statements” for purposes of the safe harbor provisions under the U.S. Private securities litigation reform act of 1995, as amended. These forward-looking statements are generally identified by words such as “anticipate,” “believe,” continue,” “could,” “estimate,” “expect,” “intend,” “may,” “might,” “seem,” “seek,” “future,” “outlook,” “model,” “target,” “goal,” “plan,” “possible,” “potential,” “predict,” “project,” “should,” “strive,” “would,” “will” or words of similar meaning that predict or indicate future events or trends or that are not statements of historical facts. These forward-looking statements may include, among other things, statements about future financial condition and results of operations, plans, objectives, strategies, beliefs, expectations and intentions with respect to, among other things, future opportunities for Reservoir’s business, growth initiatives and market opportunities, competitive landscape, prospective performance, revenues, products, pricing, operating expenses, market trends, liquidity, cash flows and uses of cash and capital expenditures. Such forward-looking statements are based upon the current beliefs and expectations of Reservoir’s management and are inherently subject to significant business, economic and competitive risks, uncertainties and contingencies. Actual results, performance or achievements may differ materially, and potentially adversely, from any forward-looking statements and the assumptions on which these forward-looking statements are based. There can be no assurance that the information contained in this presentation is reflective of future results, performance and/or achievements to any degree. These forward-looking statements are provided for illustrative purposes only, and you are cautioned not to place undue reliance on these forward-looking statements as a guarantee, assurance or prediction of future results, performance and/or achievements as these forward-looking statements are based on estimates and assumptions, whether or not identified in this presentation, that are inherently subject to various significant risks, uncertainties, contingencies and other factors, many of which are difficult to predict and generally beyond the control of Reservoir. There may be additional risks and other factors that Reservoir does not currently know or that Reservoir currently believes are immaterial that could also cause actual results, performance or achievements of Reservoir to differ from those contained in these forward-looking statements. Consequently, there can be no assurance that the actual results, performance and achievements anticipated in this presentation will be realized or, even if substantially realized, that they will have the expected consequences to, or effects on, Reservoir. Additional information concerning these and other factors that may impact the business, prospects, financial condition and/or results of operations discussed in this presentation can be found in Reservoir’s periodic reports or other filings with the SEC, which are available publicly on the sec’s website at www.sec.gov. All information set forth in this presentation speaks only as of the date hereof or the date of such information, as applicable, and Reservoir expressly disclaims any intention or obligation to update any forward -looking statements as a result of developments occurring after the date of this presentation. These forward-looking statements should not be relied upon as representing Reservoir’s assessments as of any date subsequent to the date of this presentation and, accordingly, undue reliance should not be placed upon these forward-looking statements. Financial Information; Non-GAAP Financial Measures This presentation contains unaudited financial information of Reservoir. The unaudited financial information has been prepared on the same basis as Reservoir’s audited financial statements and, in the opinion of Reservoir’s management, reflects all adjustments necessary for the fair presentation of the unaudited financial information. However, the unaudited financial information contained in this presentation is preliminary and may be subject to change. Accordingly, such financial information may be adjusted or may be presented differently in periodic reports or other filings filed by Reservoir with the SEC, and such differences may be material. In addition, past performance is not a guarantee or indication of future financial condition and/or results of operations and should not be relied upon for such reason. This presentation also includes certain financial information, such as EBITDA or Adjusted EBITDA, that has not been prepared in accordance with united states generally accepted accounting principles (“GAAP”). Reservoir’s management uses these non-GAAP financial measures to evaluate Reservoir’s operations, measure its performance and make strategic decisions. Reservoir believes that the use of these non-GAAP financial measures provides useful information to investors and others in understanding Reservoir’s results of operations and trends in the same manner as Reservoir’s management and in evaluating Reservoir’s financial measures as compared to the financial measures of other similar companies, many of which present similar non-GAAP financial measures. However, these non-GAAP financial measures are subject to inherent limitations as they reflect the exercise of judgments by Reservoir’s management about which items are excluded or included in determining these non-GAAP financial measures and, therefore, should not be considered as a substitute for net income, operating income or any other operating performance measures calculated in accordance with GAAP. Using such non-GAAP financial measures in isolation to analyze Reservoir’s business would have material limitations because the calculations are based on the subjective determination of Reservoir’s management regarding the nature and classification of events and circumstances that you may find significant. In addition, although other companies in Reservoir’s industry may report measures titled EBITDA or Adjusted EBITDA or similar measures, such non-GAAP financial measures may be calculated differently from how Reservoir calculates such non-GAAP financial measures, which reduces their overall usefulness as comparative measures. Because of these limitations, you should consider such non-GAAP financial measures alongside other financial performance measures and other financial results presented in accordance with GAAP. You should review Reservoir’s audited and unaudited consolidated financial statements contained in its periodic reports or other filings with the SEC. Disclaimer 2 |
| Disclaimer 3 Industry and Market Data The information in this presentation also includes information provided by third parties. None of Reservoir, its affiliates or any third parties that provide information to Reservoir or its affiliates, such as market research firms, guarantee the accuracy, completeness, timeliness or availability of any information or are responsible for any errors or omissions (negligent or otherwise), regardless of the cause, or the results obtained from the use of such information. While such information is believed to be reliable for the purposes of this Presentation, neither Reservoir nor any of its subsidiaries, stockholders, partners, members, affiliates, directors, officers, employees, advisers, representatives or agents makes any representation or warranty with respect to the accuracy of such information. No Offer or Solicitation This presentation is for informational purposes only and is neither an offer to sell or purchase, nor a solicitation of an offer to sell, purchase or subscribe for, nor a recommendation or advice regarding, any securities in any jurisdiction. This Presentation has not been approved or recommended by the U.S. Securities and Exchange Commission (the “SEC”) or any other federal or state securities commission or securities regulatory authority or other regulatory body or authority, nor has any of these bodies or authorities passed upon the merits of, or the accuracy and adequacy of, any of the information contained in this presentation. Any representation to the contrary is a criminal offense. Trademarks, Service Marks and Trade Names Reservoir and its affiliates own or have rights to various trademarks, service marks and trade names that they use in connection with the operation of its business. This presentation also contains trademarks, service marks and trade names of third parties, which are the property of their respective owners. The use or display of third parties’ trademarks, service marks, trade names or products in this Presentation is not intended to imply a relationship with Reservoir or any of its affiliates, or an endorsement or sponsorship by or of Reservoir or any of its affiliates. Solely for convenience, the trademarks, service marks and trade names referred to in this presentation may appear without the ®, TM or SM symbols, but such references are not intended to indicate, in any way, that Reservoir, its affiliates or any third parties whose trademarks, service marks or trade names, as the case may be, are referenced herein will not assert, to the fullest extent under applicable law, their rights or the right of the applicable licensor in these trademarks, service marks and trade names. Additional information with respect to Reservoir may be found in its filings with the SEC available at the SEC’s website at www.sec.gov and on Reservoir’s website at www.reservoir-media.com. |
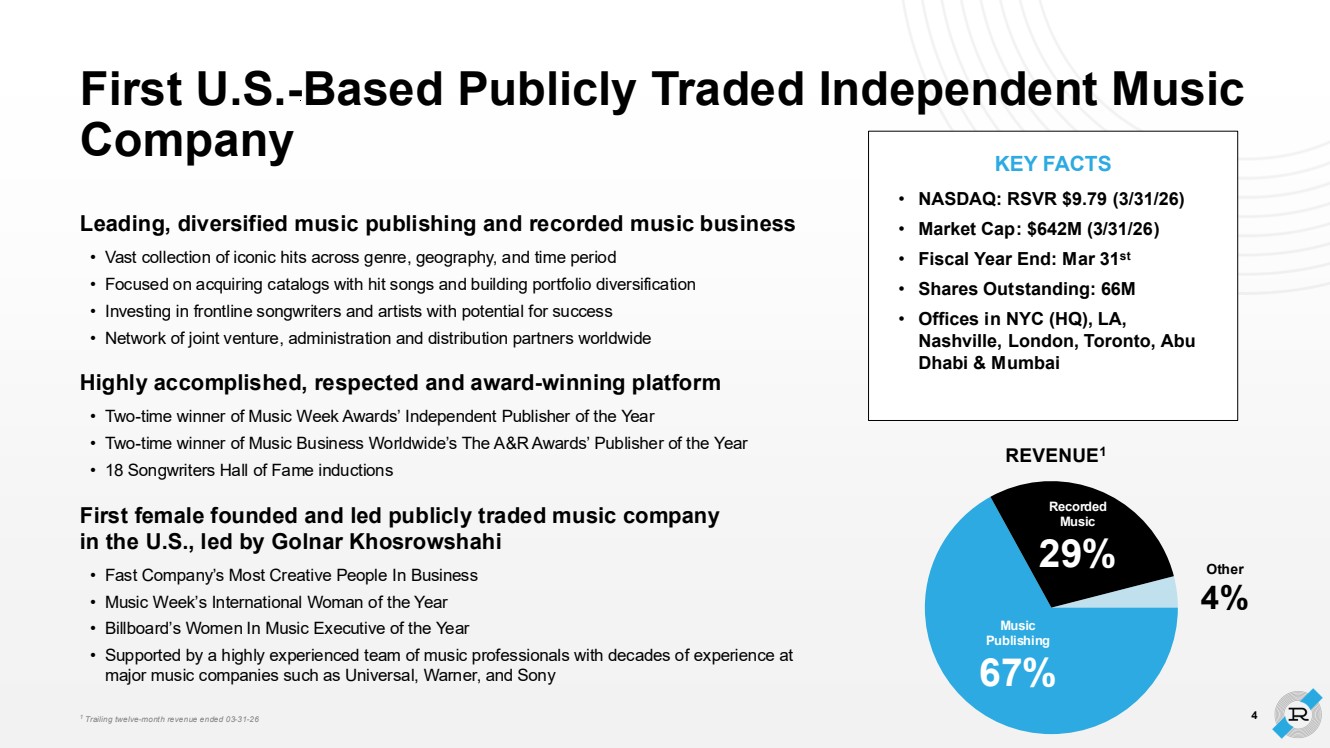
| First U.S.-Based Publicly Traded Independent Music Company • NASDAQ: RSVR $9.79 (3/31/26) • Market Cap: $642M (3/31/26) • Fiscal Year End: Mar 31st • Shares Outstanding: 66M • Offices in NYC (HQ), LA, Nashville, London, Toronto, Abu Dhabi & Mumbai KEY FACTS 4 Leading, diversified music publishing and recorded music business • Vast collection of iconic hits across genre, geography, and time period • Focused on acquiring catalogs with hit songs and building portfolio diversification • Investing in frontline songwriters and artists with potential for success • Network of joint venture, administration and distribution partners worldwide Highly accomplished, respected and award-winning platform • Two-time winner of Music Week Awards’ Independent Publisher of the Year • Two-time winner of Music Business Worldwide’s The A&R Awards’ Publisher of the Year • 18 Songwriters Hall of Fame inductions First female founded and led publicly traded music company in the U.S., led by Golnar Khosrowshahi • Fast Company’s Most Creative People In Business • Music Week’s International Woman of the Year • Billboard’s Women In Music Executive of the Year • Supported by a highly experienced team of music professionals with decades of experience at major music companies such as Universal, Warner, and Sony 1 Trailing twelve-month revenue ended 03-31-26 REVENUE1 Music Publishing 67% Recorded Music 29% Other 4% |
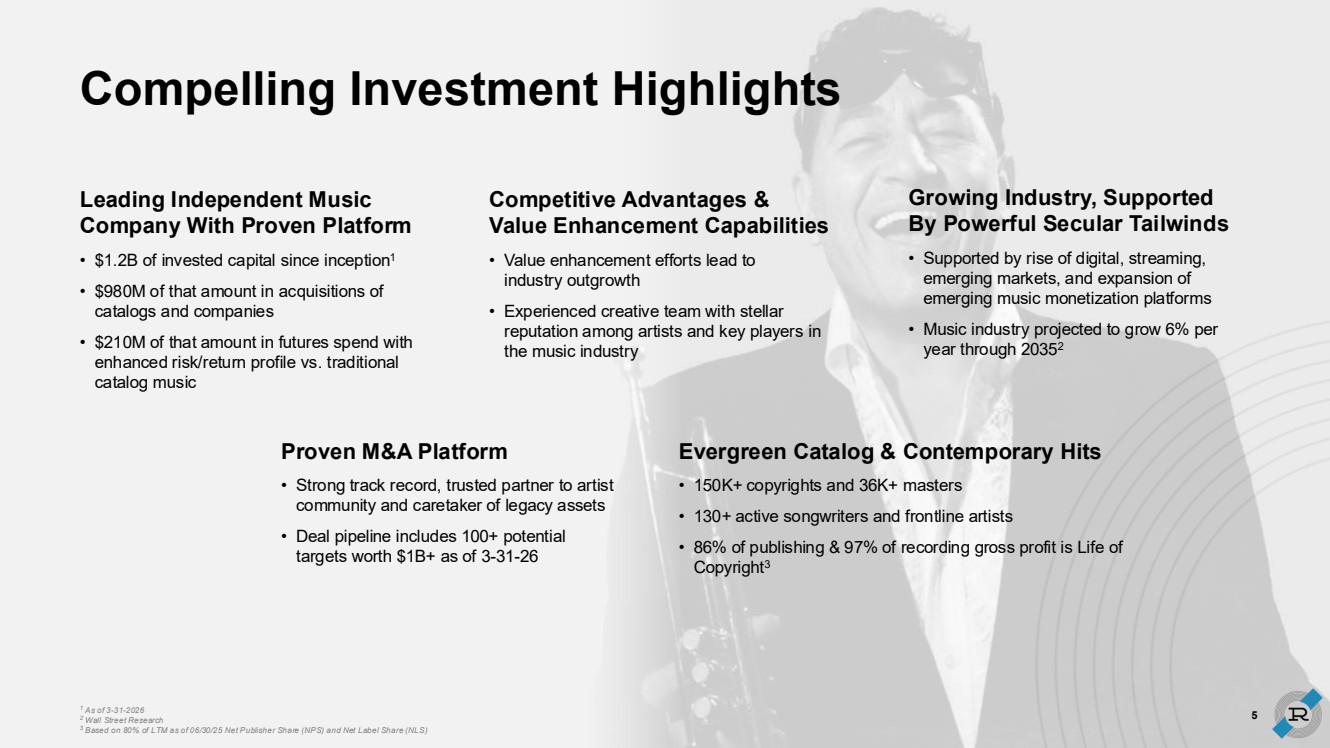
| Compelling Investment Highlights Evergreen Catalog & Contemporary Hits • 150K+ copyrights and 36K+ masters • 130+ active songwriters and frontline artists • 86% of publishing & 97% of recording gross profit is Life of Copyright3 Growing Industry, Supported By Powerful Secular Tailwinds • Supported by rise of digital, streaming, emerging markets, and expansion of emerging music monetization platforms • Music industry projected to grow 6% per year through 20352 Competitive Advantages & Value Enhancement Capabilities • Value enhancement efforts lead to industry outgrowth • Experienced creative team with stellar reputation among artists and key players in the music industry 5 Leading Independent Music Company With Proven Platform • $1.2B of invested capital since inception1 • $980M of that amount in acquisitions of catalogs and companies • $210M of that amount in futures spend with enhanced risk/return profile vs. traditional catalog music Proven M&A Platform • Strong track record, trusted partner to artist community and caretaker of legacy assets • Deal pipeline includes 100+ potential targets worth $1B+ as of 3-31-26 1 As of 3-31-2026 2 Wall Street Research 3 Based on 80% of LTM as of 06/30/25 Net Publisher Share (NPS) and Net Label Share (NLS) |
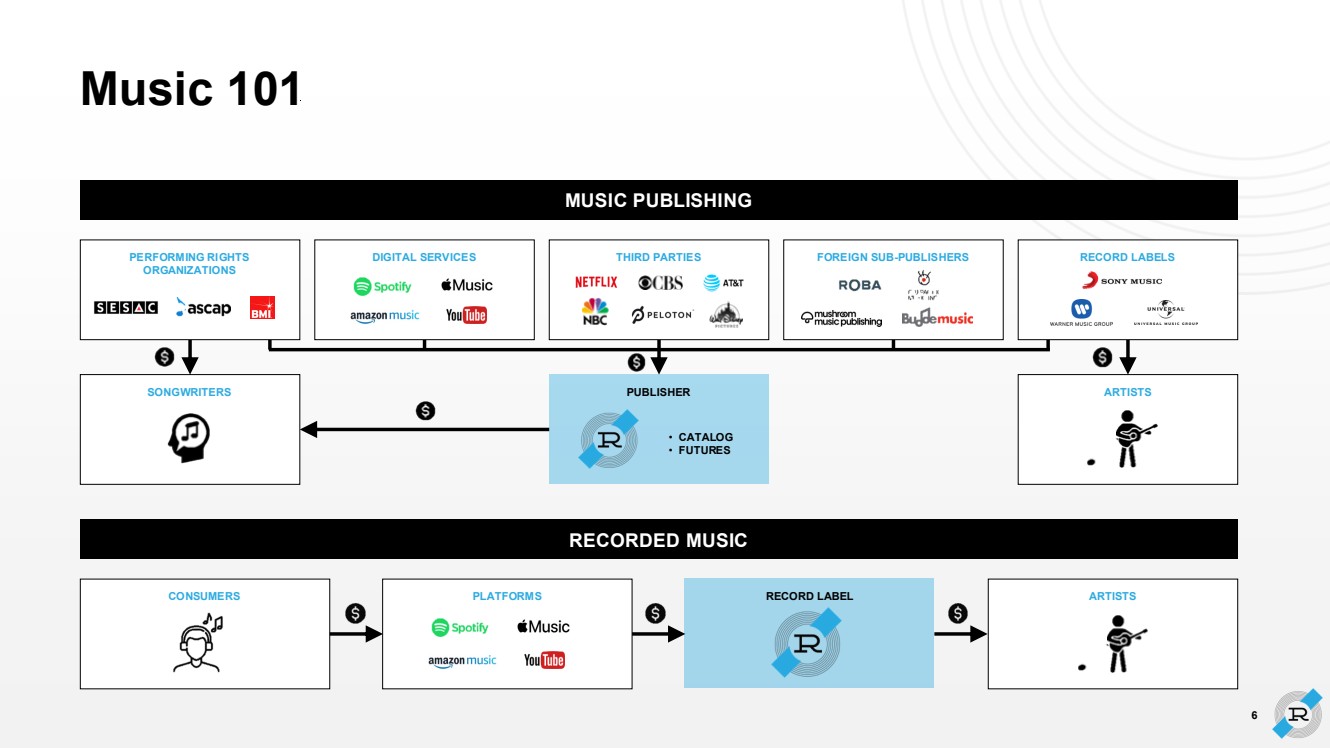
| Music 101 MUSIC PUBLISHING SONGWRITERS PUBLISHER ARTISTS PERFORMING RIGHTS FOREIGN SUB-PUBLISHERS RECORD LABELS ORGANIZATIONS DIGITAL SERVICES THIRD PARTIES The YouTube • CATALOG • FUTURES RECORDED MUSIC CONSUMERS PLATFORMS RECORD LABEL ARTISTS The YouTube 6 |
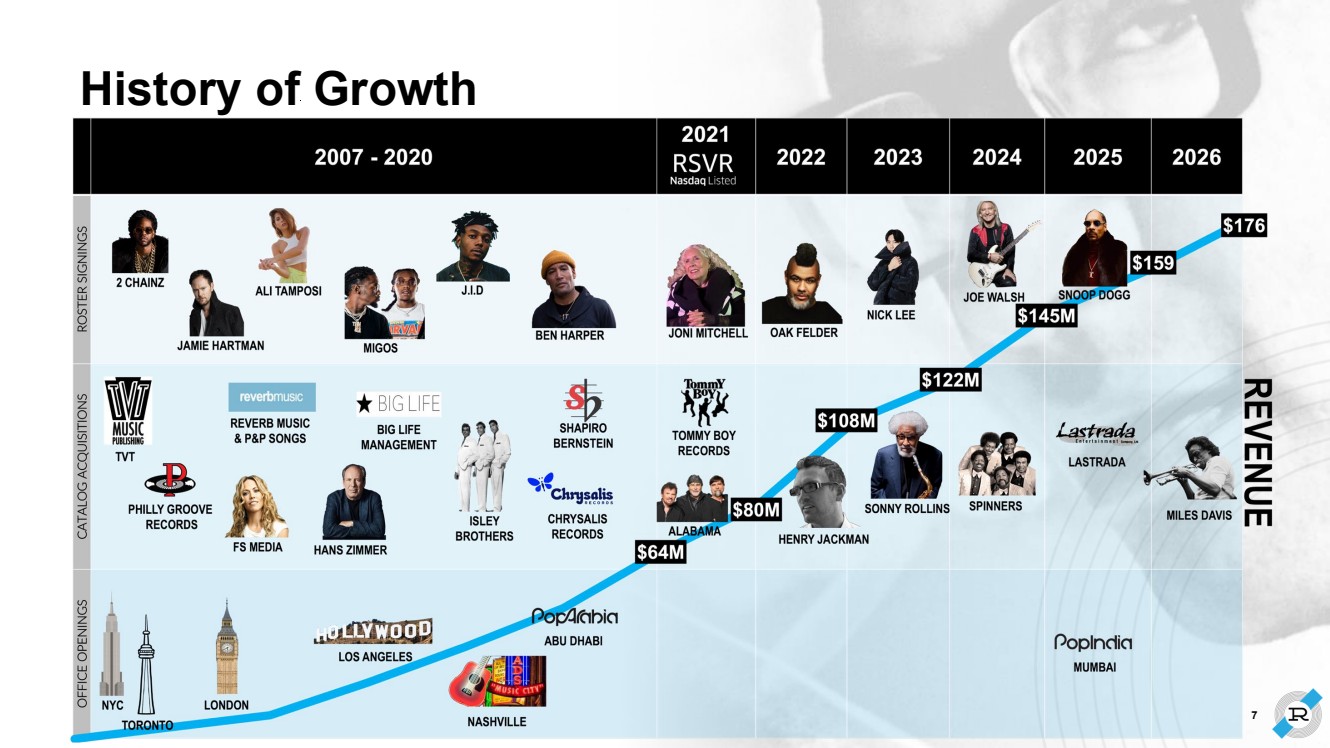
| 7 History of Growth |
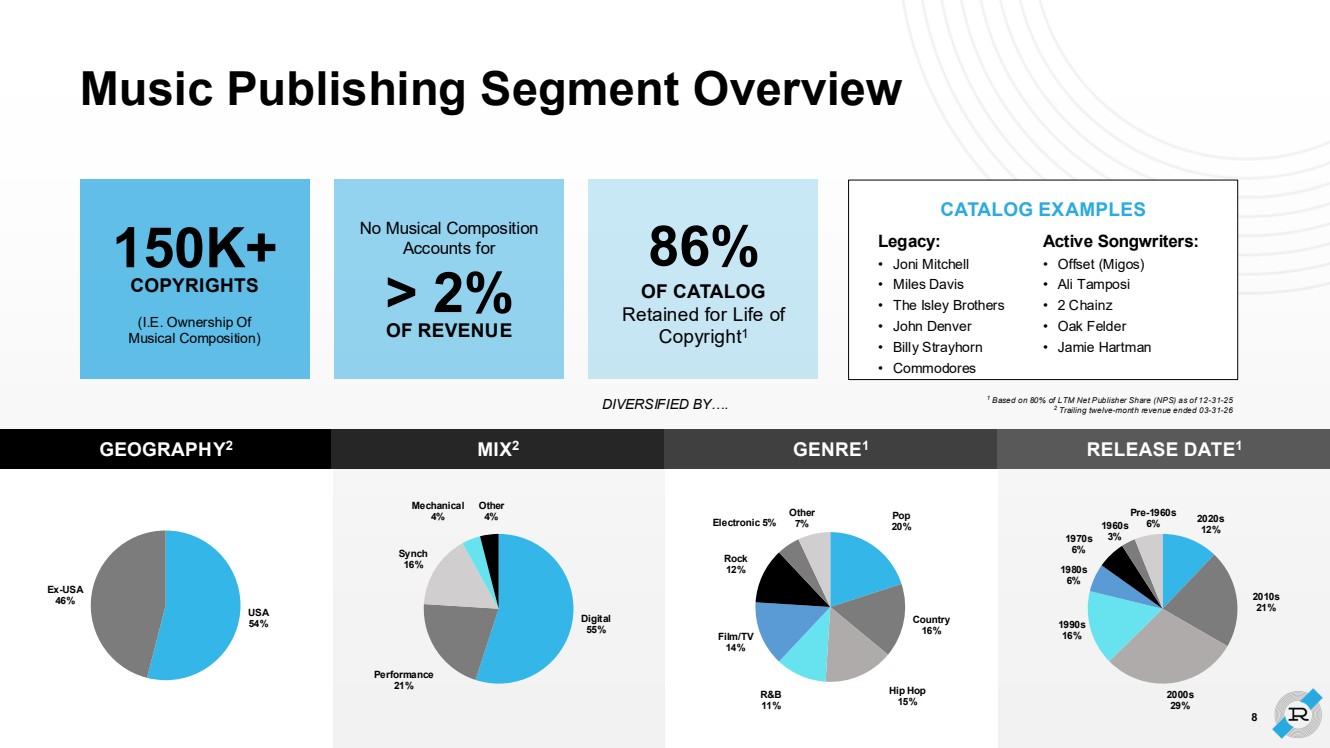
| Digital 55% Performance 21% Synch 16% Mechanical 4% Other 4% Legacy: • Joni Mitchell • Miles Davis • The Isley Brothers • John Denver • Billy Strayhorn • Commodores Active Songwriters: • Offset (Migos) • Ali Tamposi • 2 Chainz • Oak Felder • Jamie Hartman CATALOG EXAMPLES No Musical Composition Accounts for > 2% OF REVENUE 86% OF CATALOG Retained for Life of Copyright1 USA 54% Ex-USA 46% DIVERSIFIED BY…. 2020s 12% 2010s 21% 2000s 29% 1990s 16% 1980s 6% 1970s 6% 1960s 3% Pre-1960s 6% Pop 20% Country 16% Hip Hop 15% R&B 11% Film/TV 14% Rock 12% Electronic 5% Other 7% 1 Based on 80% of LTM Net Publisher Share (NPS) as of 12-31-25 2 Trailing twelve-month revenue ended 03-31-26 GEOGRAPHY2 MIX2 GENRE1 RELEASE DATE1 150K+ COPYRIGHTS (I.E. Ownership Of Musical Composition) Music Publishing Segment Overview 8 |
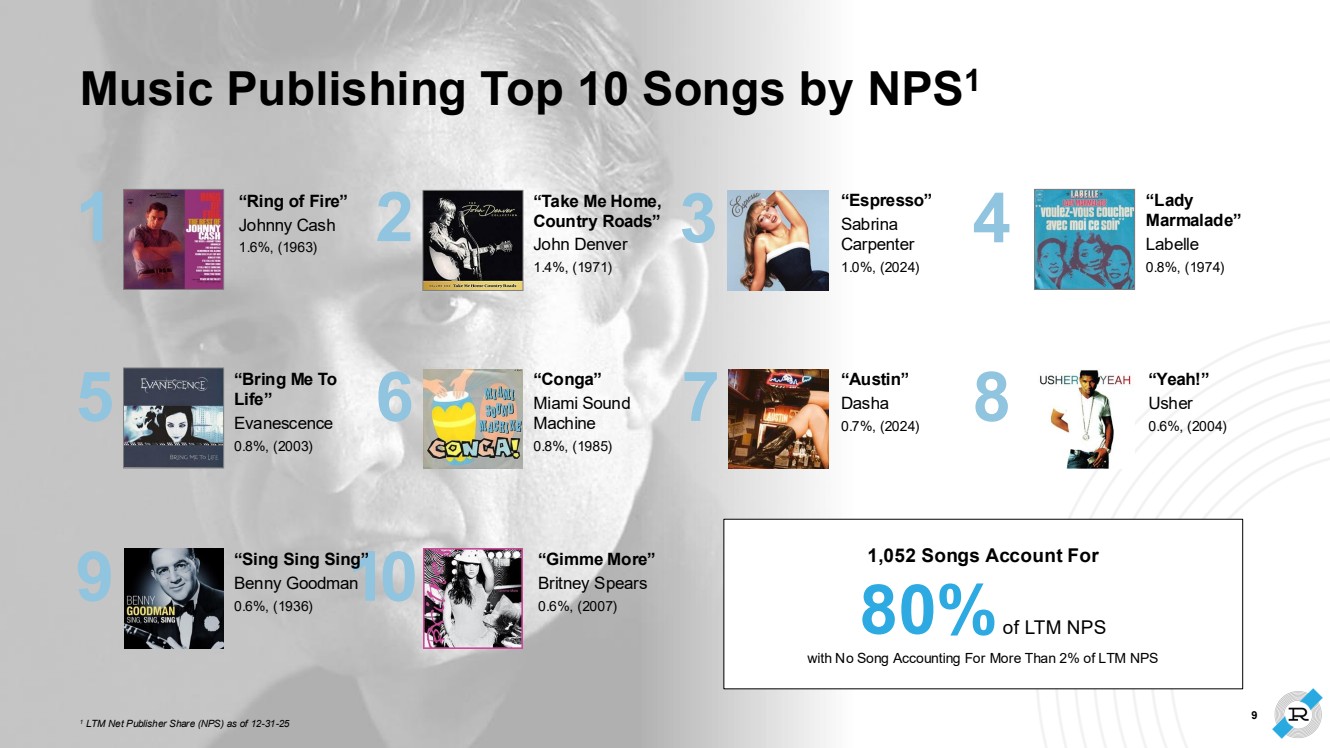
| “Yeah!” Usher 0.6%, (2004) “Take Me Home, Country Roads” John Denver 1.4%, (1971) “Ring of Fire” Johnny Cash 1 1.6%, (1963) 5 9 2 6 10 3 7 4 8 “Sing Sing Sing” Benny Goodman 0.6%, (1936) “Lady Marmalade” Labelle 0.8%, (1974) “Bring Me To Life” Evanescence 0.8%, (2003) “Gimme More” Britney Spears 0.6%, (2007) 1 LTM Net Publisher Share (NPS) as of 12-31-25 1,052 Songs Account For 80%of LTM NPS with No Song Accounting For More Than 2% of LTM NPS Music Publishing Top 10 Songs by NPS1 9 “Espresso” Sabrina Carpenter 1.0%, (2024) “Conga” Miami Sound Machine 0.8%, (1985) “Austin” Dasha 0.7%, (2024) |
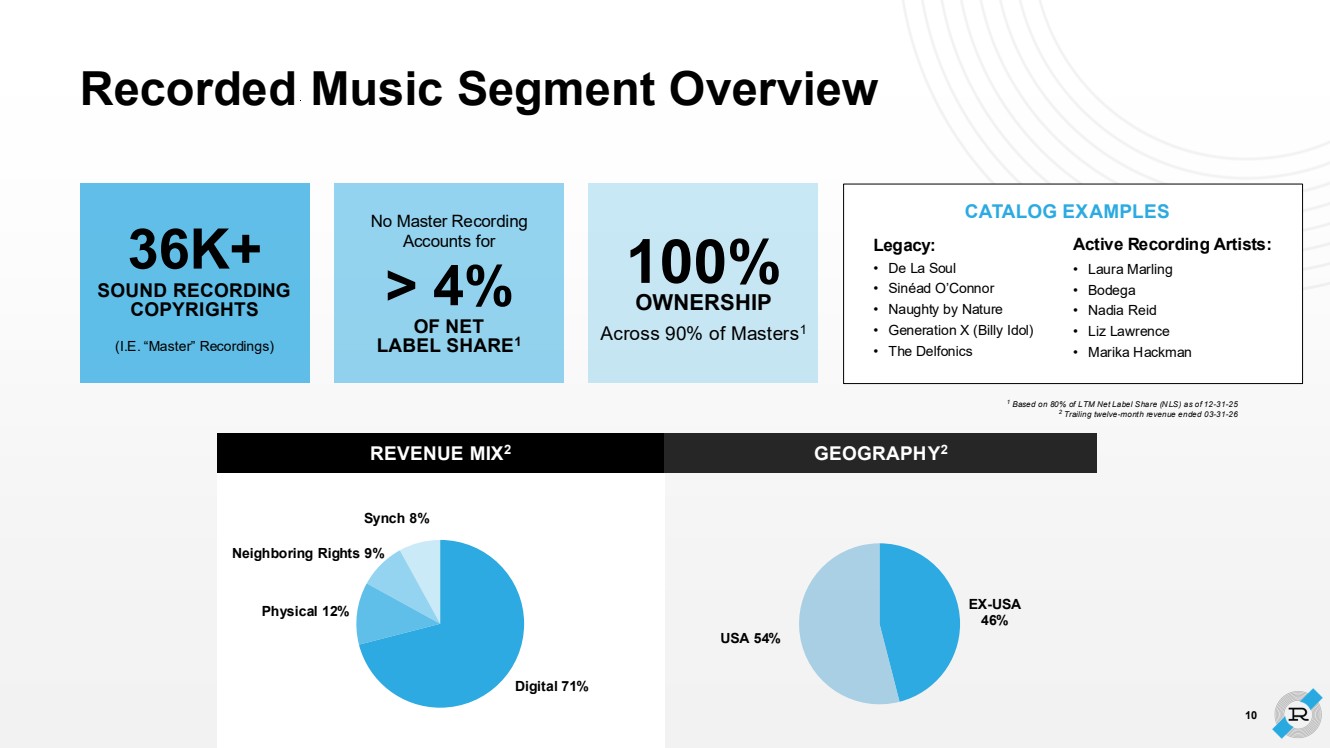
| REVENUE MIX2 Digital 71% Physical 12% Neighboring Rights 9% Synch 8% 1 Based on 80% of LTM Net Label Share (N LS) as of 12-31-25 2 Trailing twelve-month revenue ended 03-31-26 No Master Recording Accounts for > 4% OF NET LABEL SHARE1 100% OWNERSHIP Across 90% of Masters1 36K+ SOUND RECORDING COPYRIGHTS (I.E. “Master” Recordings) Recorded Music Segment Overview Legacy: • De La Soul • Sinéad O’Connor • Naughty by Nature • Generation X (Billy Idol) • The Delfonics Active Recording Artists: • Laura Marling • Bodega • Nadia Reid • Liz Lawrence • Marika Hackman EX-USA 46% USA 54% 10 GEOGRAPHY2 CATALOG EXAMPLES |
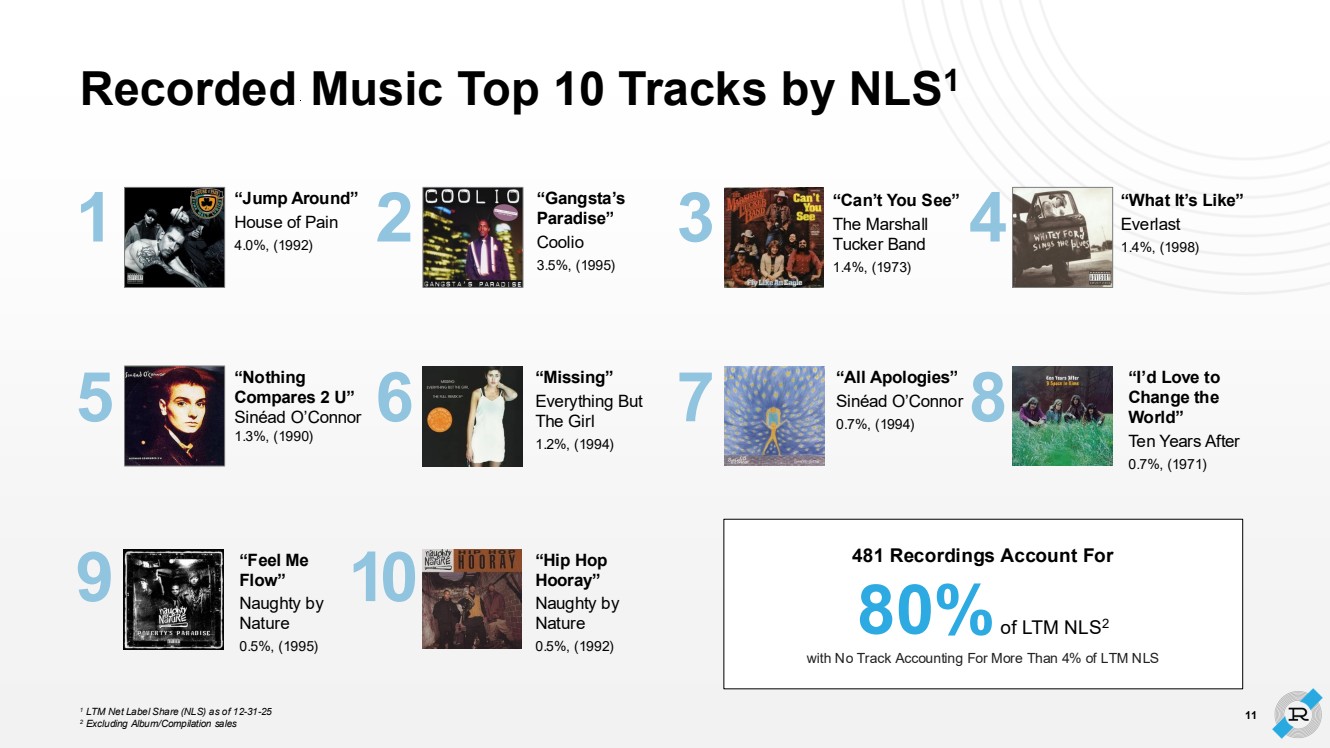
| 481 Recordings Account For 80%of LTM NLS2 with No Track Accounting For More Than 4% of LTM NLS Recorded Music Top 10 Tracks by NLS1 1 LTM Net Label Share (NLS) as of 12-31-25 2 Excluding Album/Compilation sales 11 “Gangsta’s Paradise” Coolio 3.5%, (1995) 1 5 9 2 6 10 3 7 4 8 “All Apologies” Sinéad O’Connor 0.7%, (1994) “Feel Me Flow” Naughty by Nature 0.5%, (1995) “Jump Around” House of Pain 4.0%, (1992) “Missing” Everything But The Girl 1.2%, (1994) “What It’s Like” Everlast 1.4%, (1998) “Nothing Compares 2 U” Sinéad O’Connor 1.3%, (1990) “I’d Love to Change the World” Ten Years After 0.7%, (1971) “Hip Hop Hooray” Naughty by Nature 0.5%, (1992) “Can’t You See” The Marshall Tucker Band 1.4%, (1973) |
| Growth Drivers 12 STRONG SECULAR TAILWINDS VALUE ENHANCEMENT INITIATIVES PROVEN M&A PLATFORM & NEW SIGNINGS |
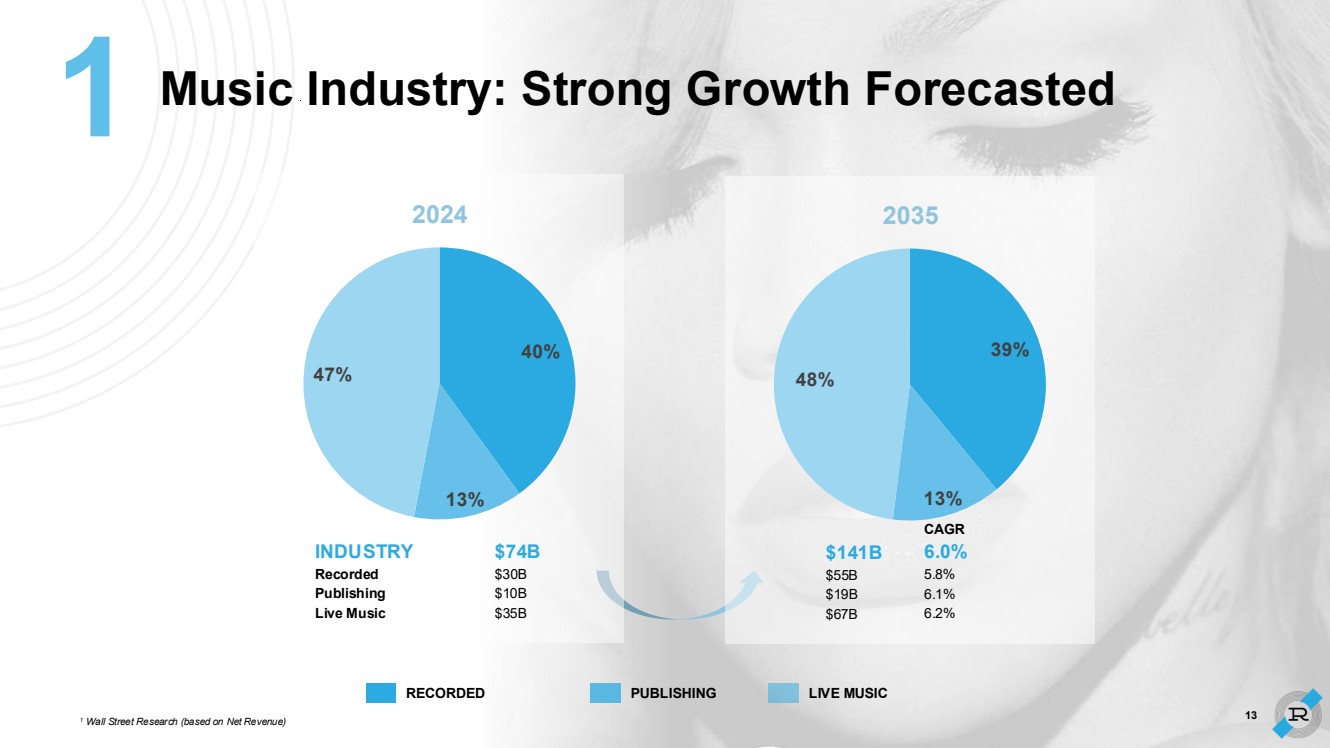
| 1 Wall Street Research (based on Net Revenue) Music Industry: Strong Growth Forecasted RECORDED PUBLISHING LIVE MUSIC 13 INDUSTRY Recorded Publishing Live Music $74B $30B $10B $35B 2024 40% 13% 47% $141B $55B $19B $67B CAGR 6.0% 5.8% 6.1% 6.2% 2035 39% 13% 48% |
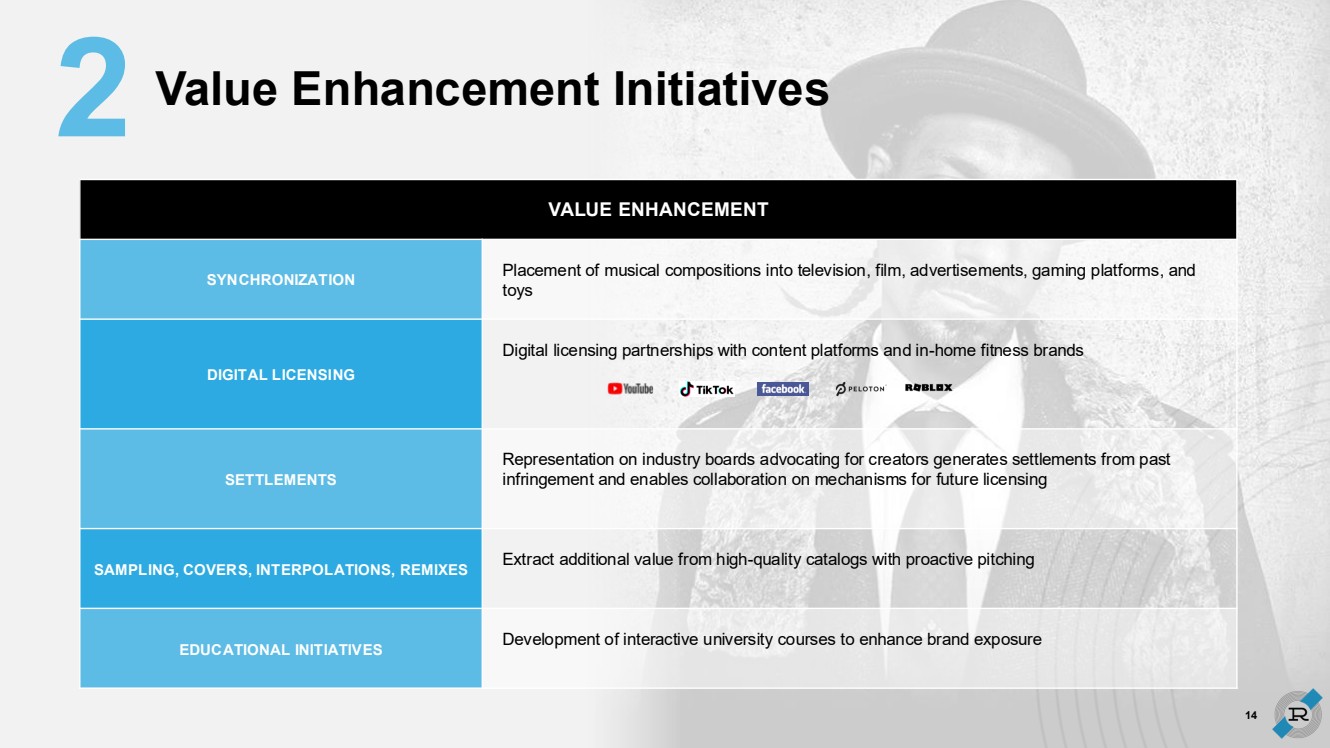
| VALUE ENHANCEMENT SYNCHRONIZATION Placement of musical compositions into television, film, advertisements, gaming platforms, and toys DIGITAL LICENSING Digital licensing partnerships with content platforms and in-home fitness brands SETTLEMENTS Representation on industry boards advocating for creators generates settlements from past infringement and enables collaboration on mechanisms for future licensing SAMPLING, COVERS, INTERPOLATIONS, REMIXES Extract additional value from high-quality catalogs with proactive pitching EDUCATIONAL INITIATIVES Development of interactive university courses to enhance brand exposure Value Enhancement Initiatives 14 |
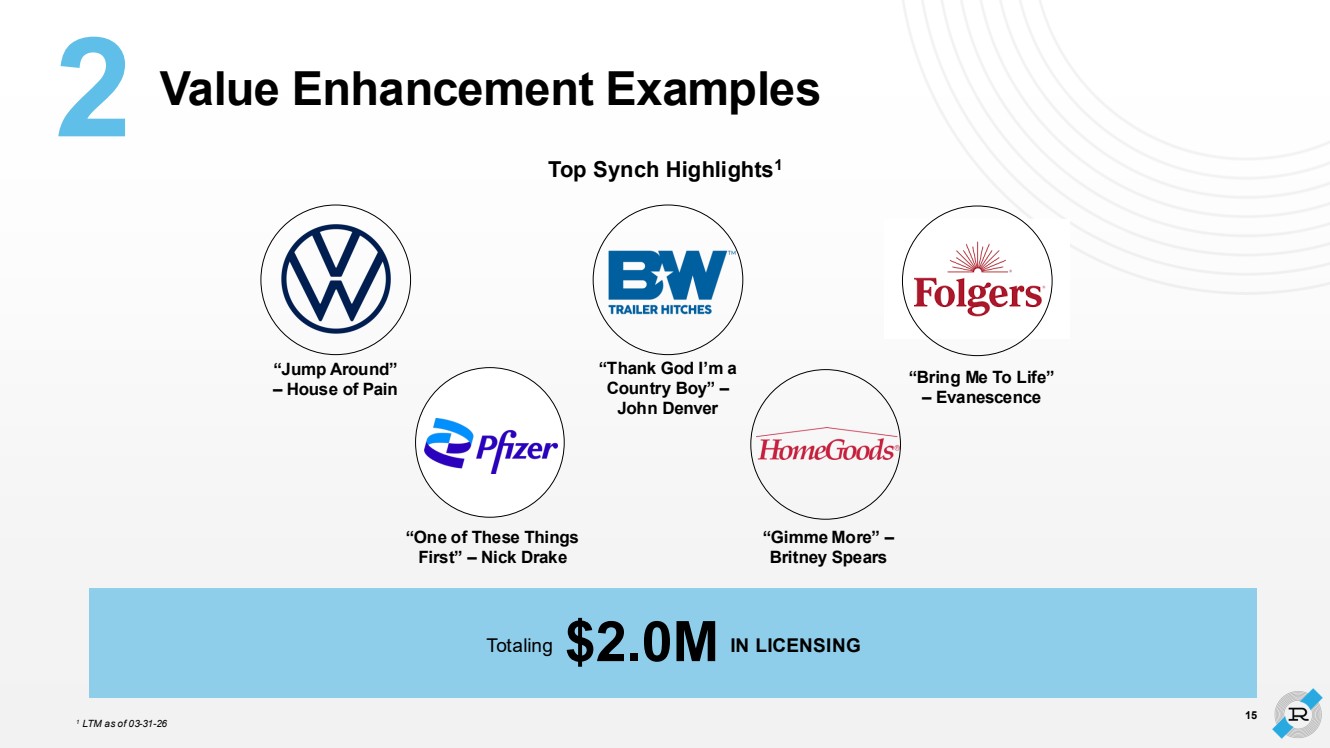
| Top Synch Highlights1 Value Enhancement Examples Totaling $2.0M IN LICENSING 15 1 LTM as of 03-31-26 “Bring Me To Life” – Evanescence “One of These Things First” – Nick Drake “Gimme More” – Britney Spears “Thank God I’m a Country Boy” – John Denver “Jump Around” – House of Pain |
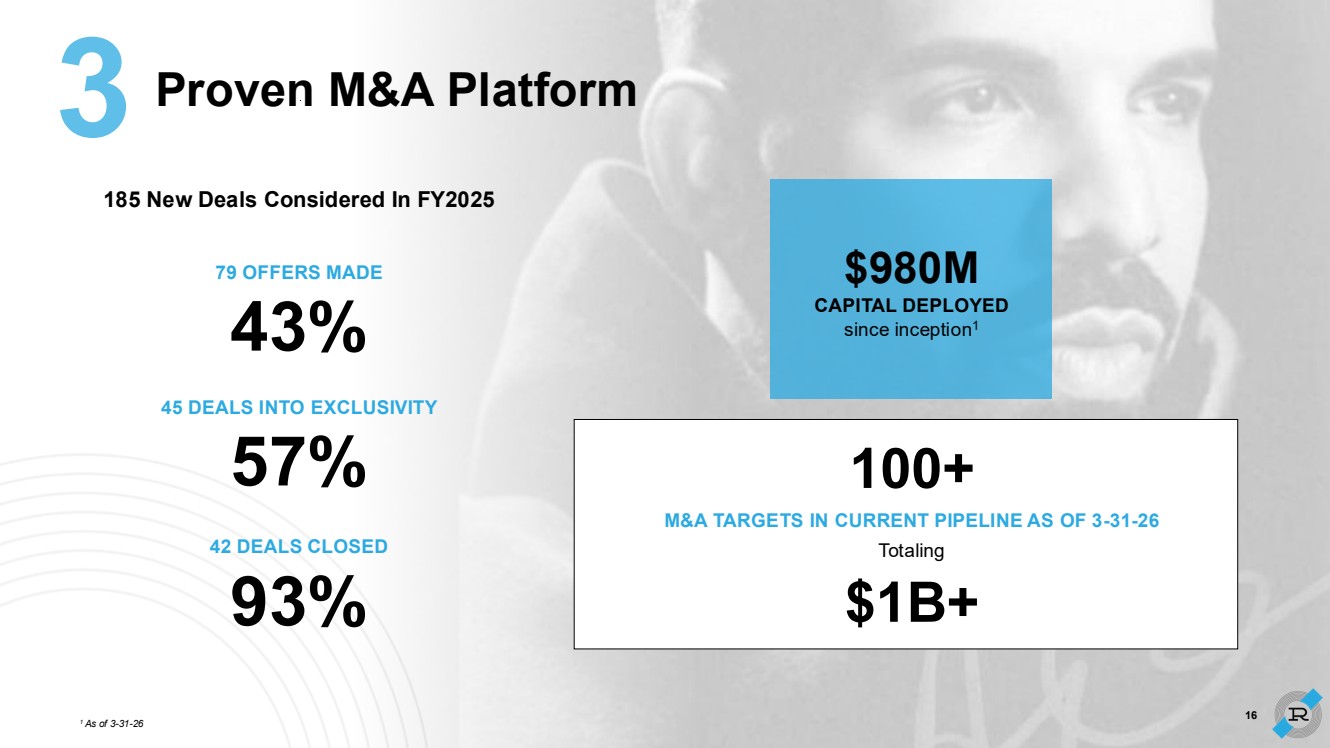
| $980M CAPITAL DEPLOYED since inception1 1 As of 3-31-26 100+ M&A TARGETS IN CURRENT PIPELINE AS OF 3-31-26 Totaling $1B+ Proven M&A Platform 79 OFFERS MADE 43% 45 DEALS INTO EXCLUSIVITY 57% 42 DEALS CLOSED 93% 185 New Deals Considered In FY2025 16 |
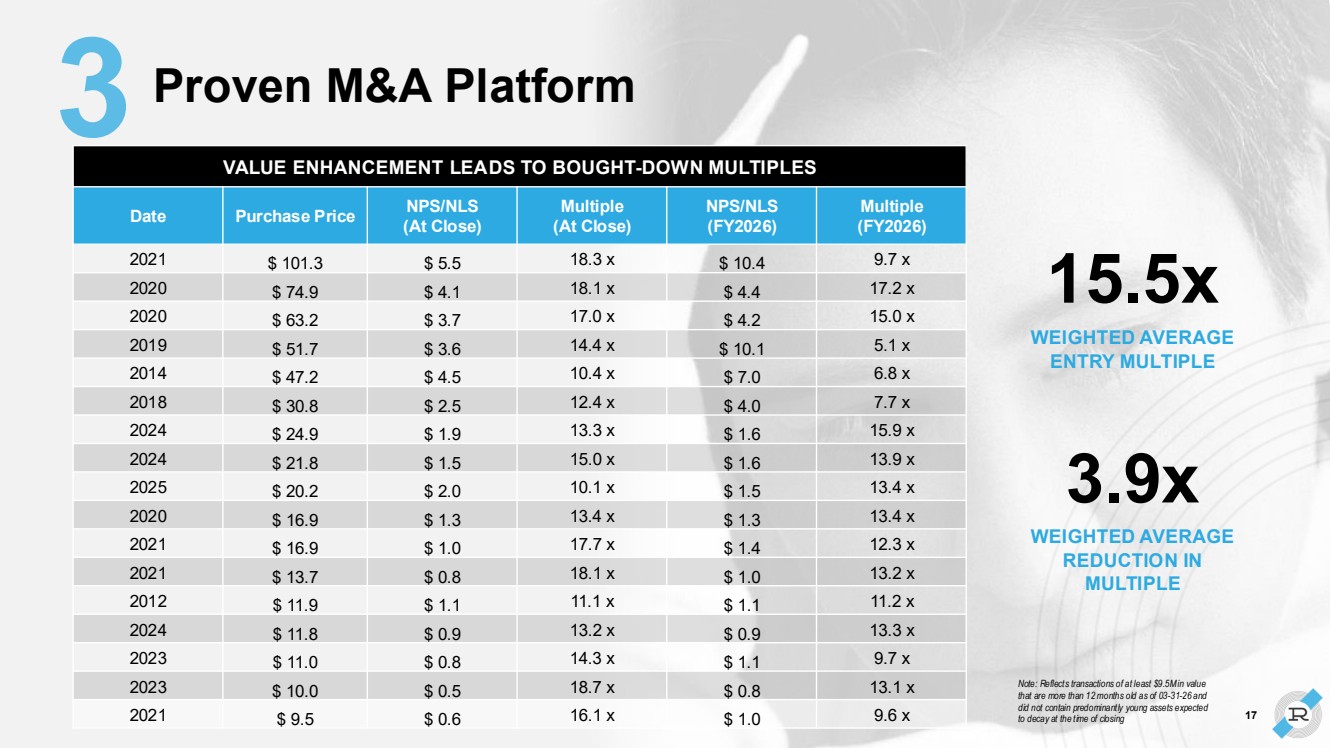
| Note: Reflects transactions of at least $9.5M in value that are more than 12 months old as of 03-31-26 and did not contain predominantly young assets expected to decay at the time of closing Proven M&A Platform 15.5x WEIGHTED AVERAGE ENTRY MULTIPLE 3.9x WEIGHTED AVERAGE REDUCTION IN MULTIPLE VALUE ENHANCEMENT LEADS TO BOUGHT-DOWN MULTIPLES Date Purchase Price NPS/NLS (At Close) Multiple (At Close) NPS/NLS (FY2026) Multiple (FY2026) 2021 $ 101.3 $ 5.5 18.3 x $ 10.4 9.7 x 2020 $ 74.9 $ 4.1 18.1 x $ 4.4 17.2 x 2020 $ 63.2 $ 3.7 17.0 x $ 4.2 15.0 x 2019 $ 51.7 $ 3.6 14.4 x $ 10.1 5.1 x 2014 $ 47.2 $ 4.5 10.4 x $ 7.0 6.8 x 2018 $ 30.8 $ 2.5 12.4 x $ 4.0 7.7 x 2024 $ 24.9 $ 1.9 13.3 x $ 1.6 15.9 x 2024 $ 21.8 $ 1.5 15.0 x $ 1.6 13.9 x 2025 $ 20.2 $ 2.0 10.1 x $ 1.5 13.4 x 2020 $ 16.9 $ 1.3 13.4 x $ 1.3 13.4 x 2021 $ 16.9 $ 1.0 17.7 x $ 1.4 12.3 x 2021 $ 13.7 $ 0.8 18.1 x $ 1.0 13.2 x 2012 $ 11.9 $ 1.1 11.1 x $ 1.1 11.2 x 2024 $ 11.8 $ 0.9 13.2 x $ 0.9 13.3 x 2023 $ 11.0 $ 0.8 14.3 x $ 1.1 9.7 x 2023 $ 10.0 $ 0.5 18.7 x $ 0.8 13.1 x 2021 $ 9.5 $ 0.6 16.1 x $ 1.0 9.6 x 17 |
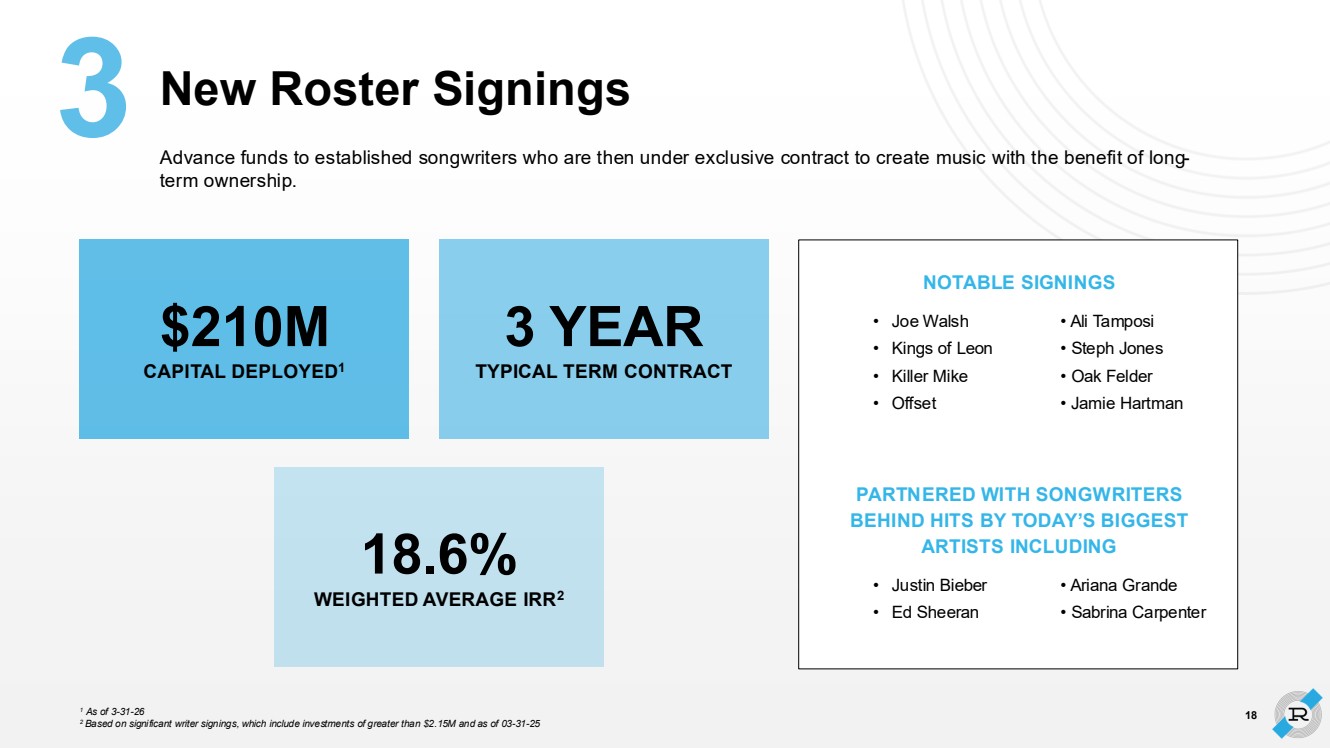
| Advance funds to established songwriters who are then under exclusive contract to create music with the benefit of long-term ownership. NOTABLE SIGNINGS $210M CAPITAL DEPLOYED1 3 YEAR TYPICAL TERM CONTRACT • Joe Walsh • Ali Tamposi • Kings of Leon • Steph Jones • Killer Mike • Oak Felder • Offset • Jamie Hartman 18.6% WEIGHTED AVERAGE IRR2 1 As of 3-31-26 2 Based on significant writer signings, which include investments of greater than $2.15M and as of 03-31-25 New Roster Signings 18 PARTNERED WITH SONGWRITERS BEHIND HITS BY TODAY’S BIGGEST ARTISTS INCLUDING • Justin Bieber • Ariana Grande • Ed Sheeran • Sabrina Carpenter |
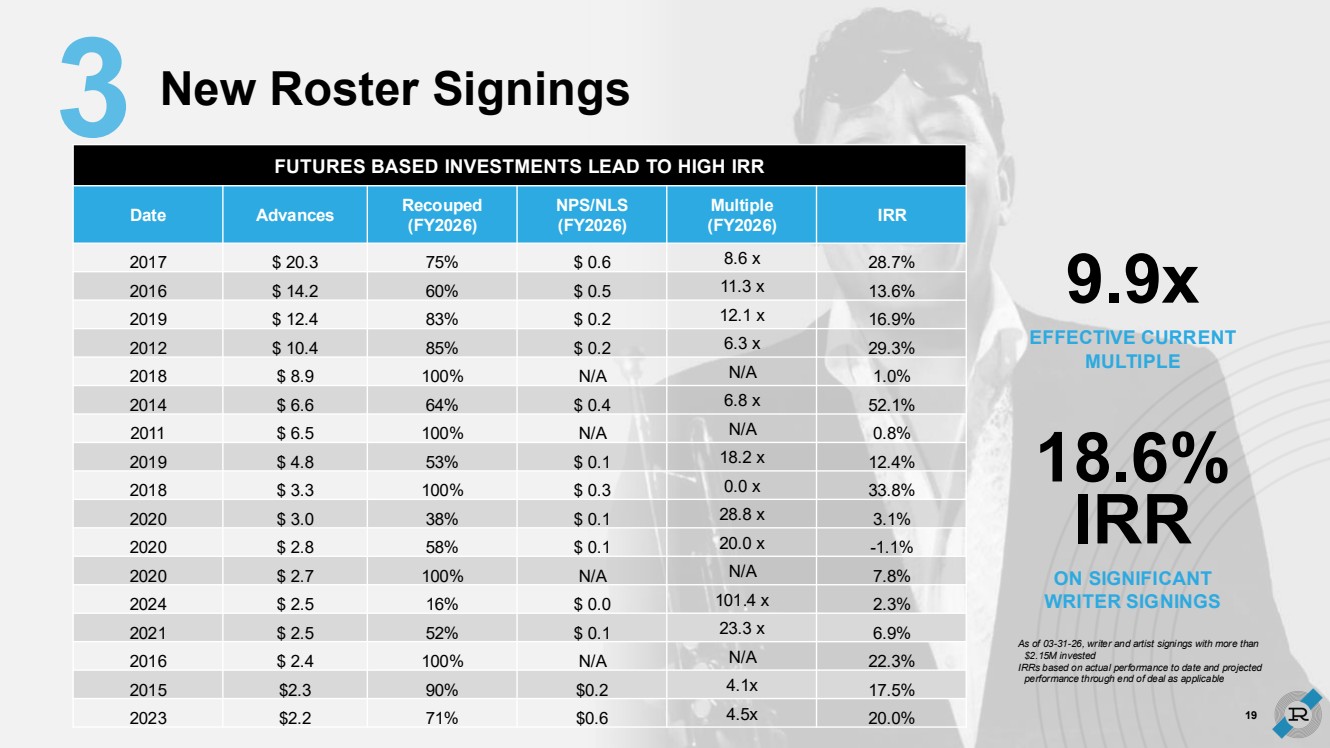
| FUTURES BASED INVESTMENTS LEAD TO HIGH IRR Date Advances Recouped (FY2026) NPS/NLS (FY2026) Multiple (FY2026) IRR 2017 $ 20.3 75% $ 0.6 8.6 x 28.7% 2016 $ 14.2 60% $ 0.5 11.3 x 13.6% 2019 $ 12.4 83% $ 0.2 12.1 x 16.9% 2012 $ 10.4 85% $ 0.2 6.3 x 29.3% 2018 $ 8.9 100% N/A N/A 1.0% 2014 $ 6.6 64% $ 0.4 6.8 x 52.1% 2011 $ 6.5 100% N/A N/A 0.8% 2019 $ 4.8 53% $ 0.1 18.2 x 12.4% 2018 $ 3.3 100% $ 0.3 0.0 x 33.8% 2020 $ 3.0 38% $ 0.1 28.8 x 3.1% 2020 $ 2.8 58% $ 0.1 20.0 x -1.1% 2020 $ 2.7 100% N/A N/A 7.8% 2024 $ 2.5 16% $ 0.0 101.4 x 2.3% 2021 $ 2.5 52% $ 0.1 23.3 x 6.9% 2016 $ 2.4 100% N/A N/A 22.3% 2015 $2.3 90% $0.2 4.1x 17.5% 2023 $2.2 71% $0.6 4.5x 20.0% As of 03-31-26, writer and artist signings with more than $2.15M invested IRRs based on actual performance to date and projected performance through end of deal as applicable 9.9x EFFECTIVE CURRENT MULTIPLE 18.6% IRR ON SIGNIFICANT WRITER SIGNINGS 19 New Roster Signings |
| Financials 20 |

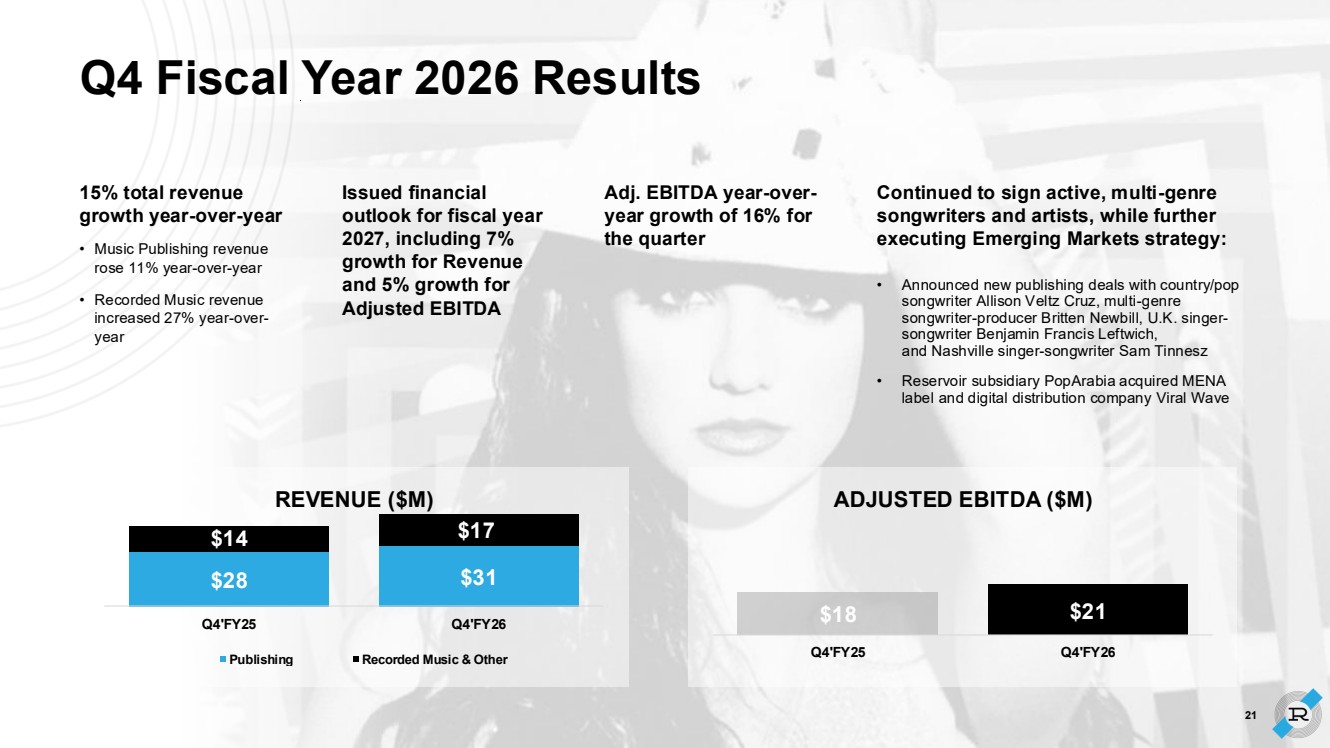
| $28 $31 $14 $17 Q4'FY25 Q4'FY26 Publishing Recorded Music & Other REVENUE ($M) $18 $21 Q4'FY25 Q4'FY26 ADJUSTED EBITDA ($M) Q4 Fiscal Year 2026 Results 15% total revenue growth year-over-year • Music Publishing revenue rose 11% year-over-year • Recorded Music revenue increased 27% year-over-year Issued financial outlook for fiscal year 2027, including 7% growth for Revenue and 5% growth for Adjusted EBITDA Continued to sign active, multi-genre songwriters and artists, while further executing Emerging Markets strategy: • Announced new publishing deals with country/pop songwriter Allison Veltz Cruz, multi-genre songwriter-producer Britten Newbill, U.K. singer-songwriter Benjamin Francis Leftwich, and Nashville singer-songwriter Sam Tinnesz • Reservoir subsidiary PopArabia acquired MENA label and digital distribution company Viral Wave Adj. EBITDA year-over-year growth of 16% for the quarter 21 |
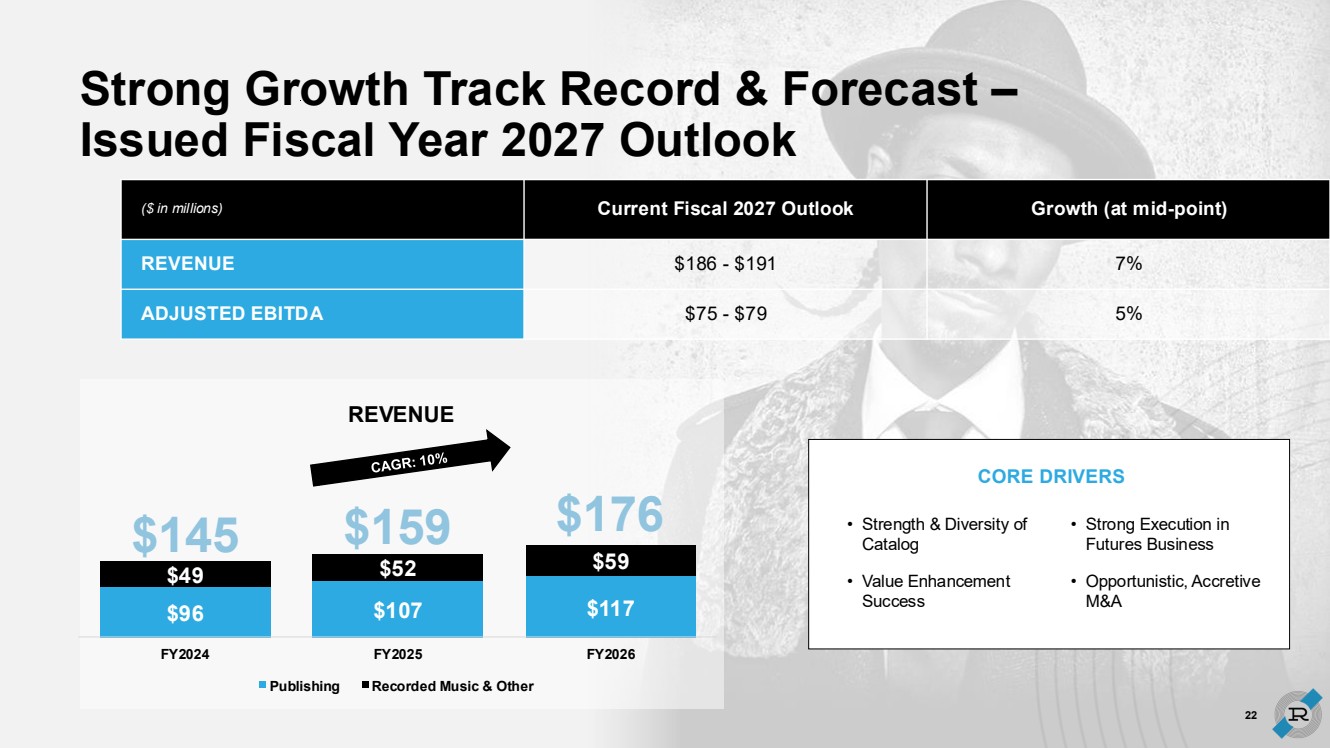
| Strong Growth Track Record & Forecast – Issued Fiscal Year 2027 Outlook ($ in millions) Current Fiscal 2027 Outlook Growth (at mid-point) REVENUE $186 - $191 7% ADJUSTED EBITDA $75 - $79 5% $96 $107 $117 $49 $52 $59 FY2024 FY2025 FY2026 Publishing Recorded Music & Other $145 $159 $176 REVENUE • Strength & Diversity of Catalog • Value Enhancement Success CORE DRIVERS • Strong Execution in Futures Business • Opportunistic, Accretive M&A 22 |
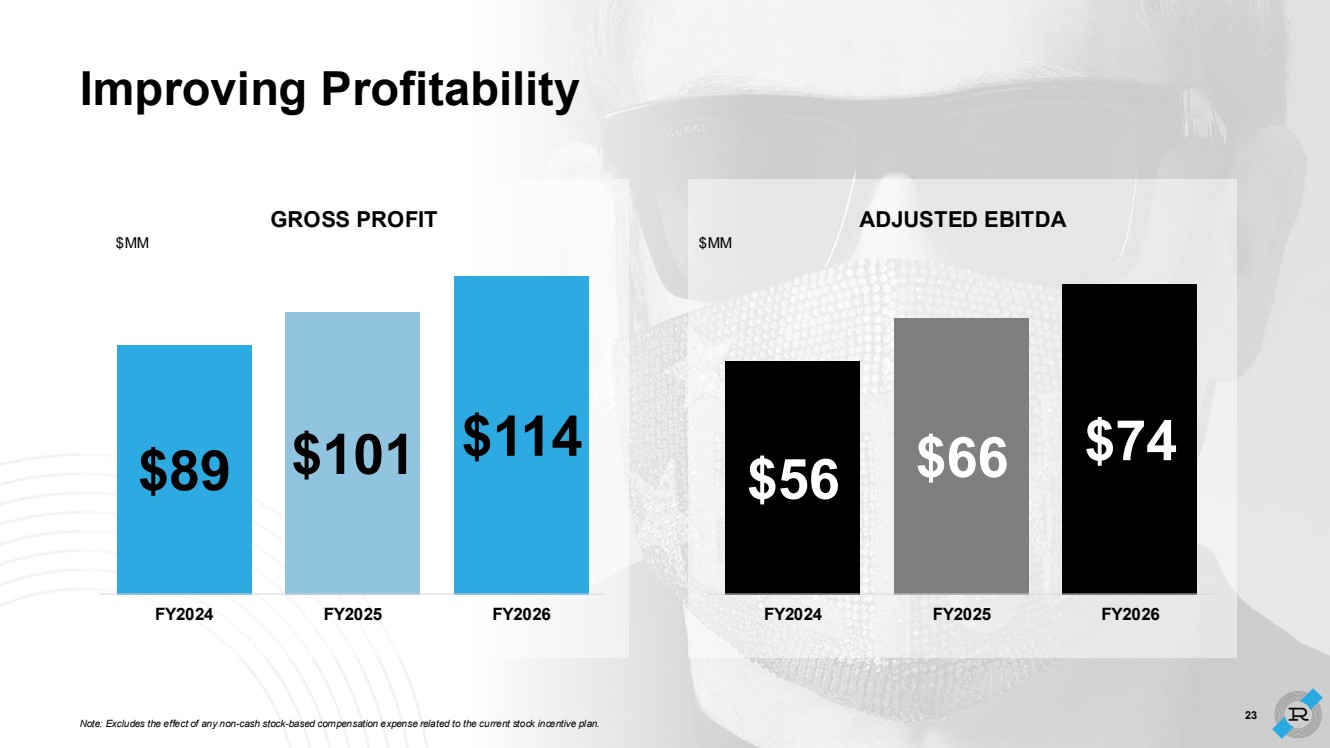
| 23 Note: Excludes the effect of any non-cash stock-based compensation expense related to the current stock incentive plan. $89 $101 $114 FY2024 FY2025 FY2026 GROSS PROFIT $56 $66 $74 FY2024 FY2025 FY2026 ADJUSTED EBITDA Improving Profitability $MM $MM |
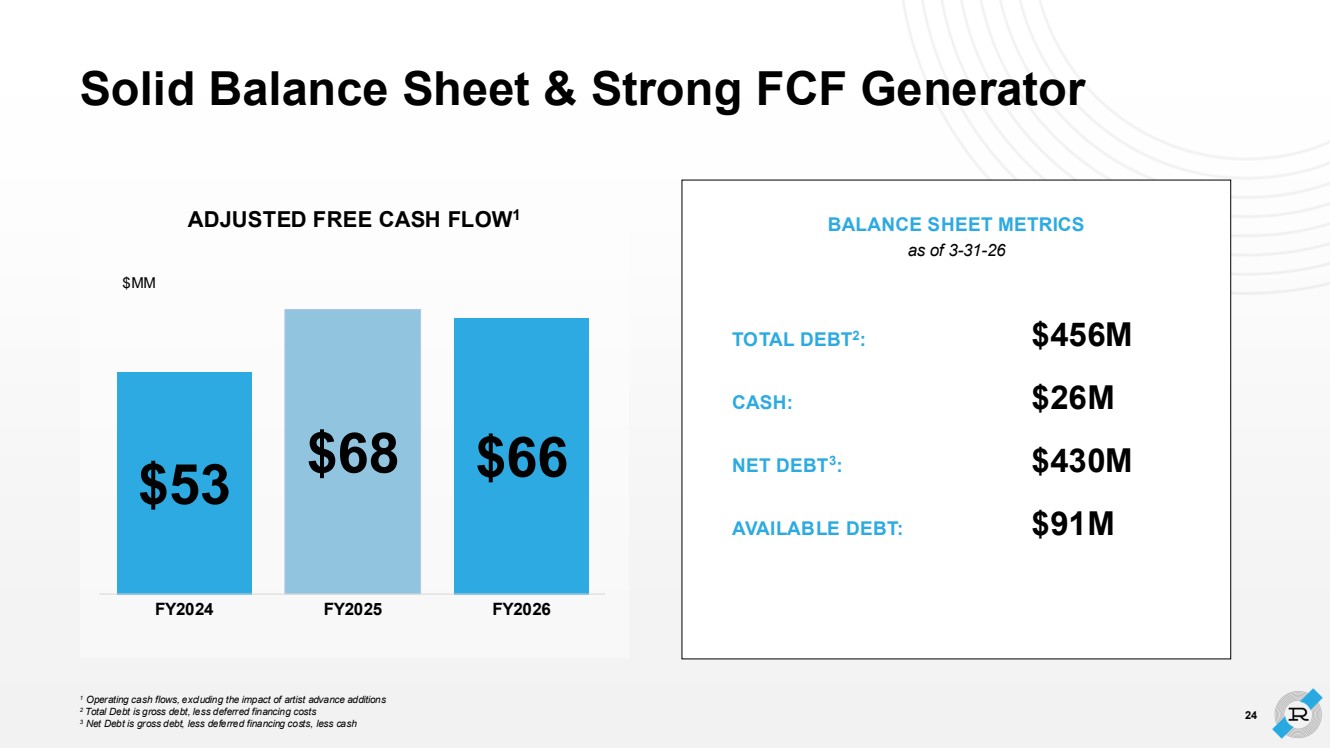
| $53 $68 $66 FY2024 FY2025 FY2026 $MM ADJUSTED FREE CASH FLOW1 1 Operating cash flows, excluding the impact of artist advance additions 2 Total Debt is gross debt, less deferred financing costs 3 Net Debt is gross debt, less deferred financing costs, less cash (after de-SPAC) BALANCE SHEET METRICS as of 3-31-26 TOTAL DEBT2 : $456M CASH: $26M NET DEBT3 : $430M AVAILABLE DEBT: $91M Solid Balance Sheet & Strong FCF Generator 24 |
| Appendix 25 |

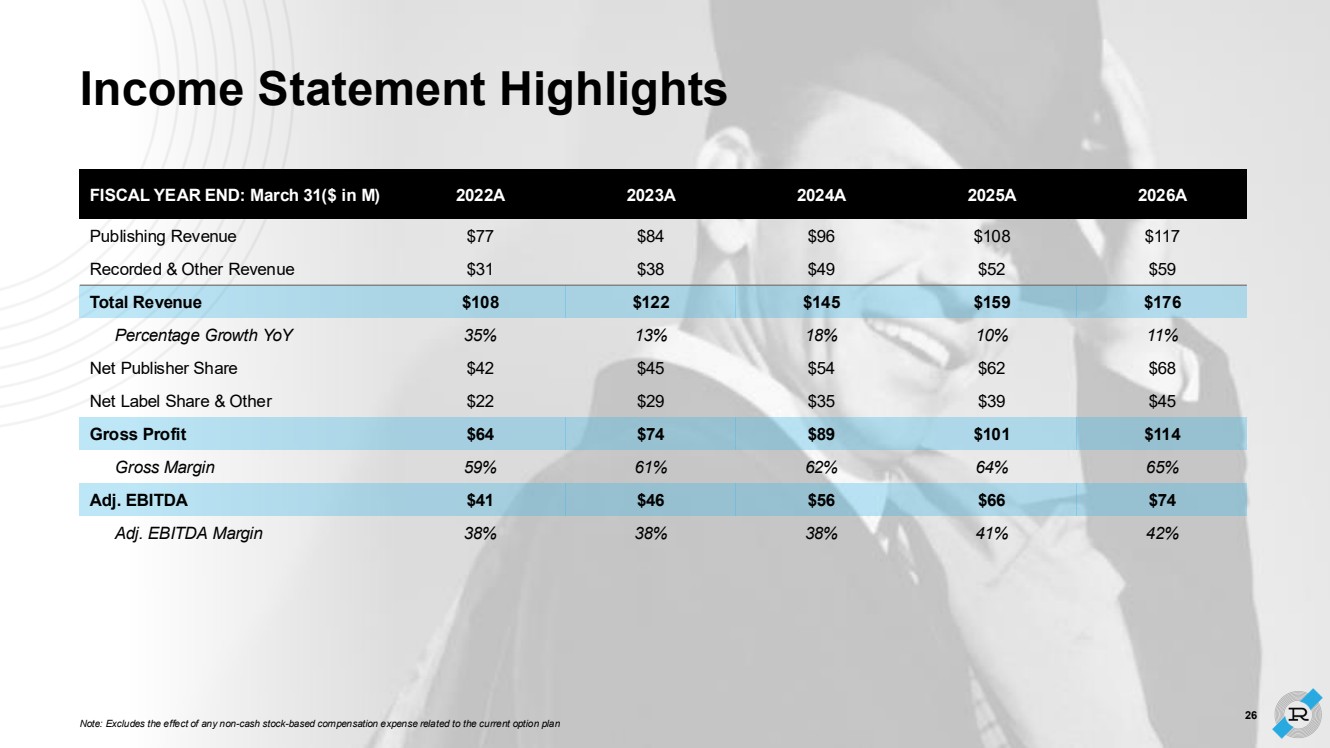
| FISCAL YEAR END: March 31($ in M) 2022A 2023A 2024A 2025A 2026A Publishing Revenue $77 $84 $96 $108 $117 Recorded & Other Revenue $31 $38 $49 $52 $59 Total Revenue $108 $122 $145 $159 $176 Percentage Growth YoY 35% 13% 18% 10% 11% Net Publisher Share $42 $45 $54 $62 $68 Net Label Share & Other $22 $29 $35 $39 $45 Gross Profit $64 $74 $89 $101 $114 Gross Margin 59% 61% 62% 64% 65% Adj. EBITDA $41 $46 $56 $66 $74 Adj. EBITDA Margin 38% 38% 38% 41% 42% Note: Excludes the effect of any non-cash stock-based compensation expense related to the current option plan Income Statement Highlights 26 |
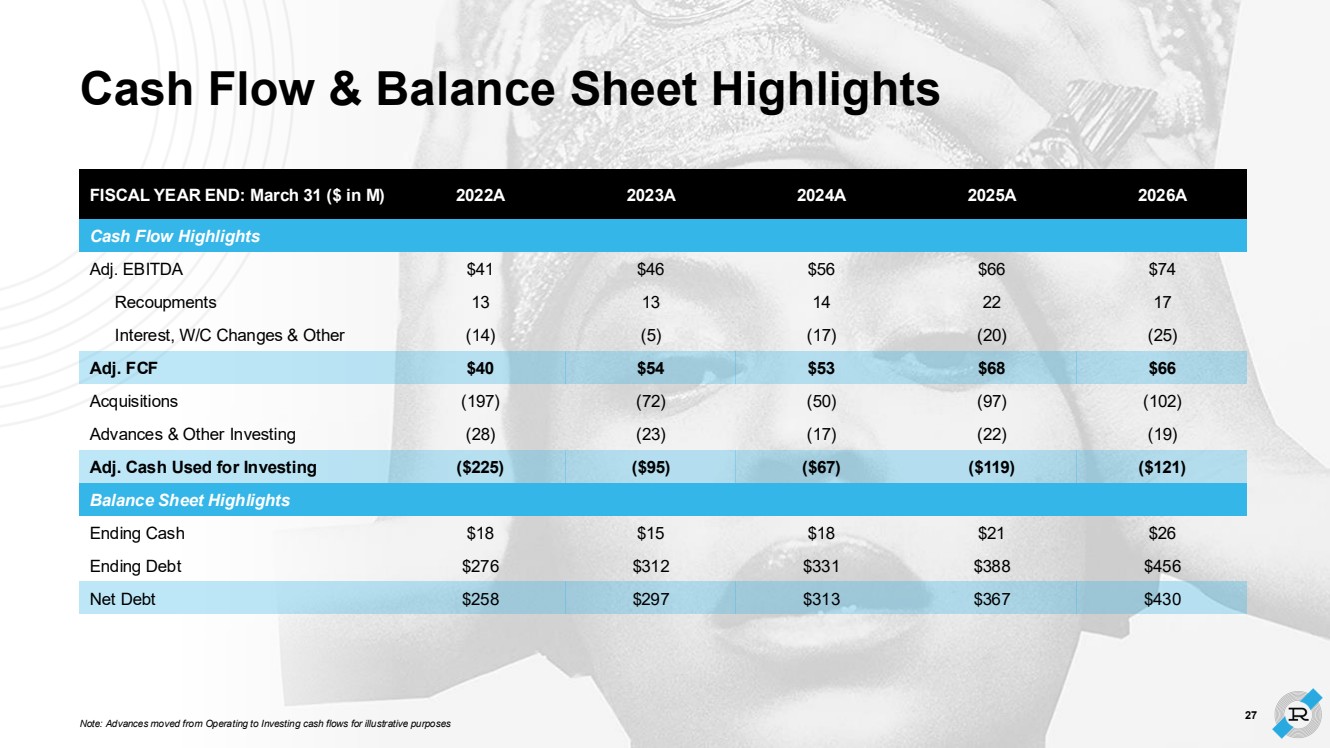
| FISCAL YEAR END: March 31 ($ in M) 2022A 2023A 2024A 2025A 2026A Cash Flow Highlights Adj. EBITDA $41 $46 $56 $66 $74 Recoupments 13 13 14 22 17 Interest, W/C Changes & Other (14) (5) (17) (20) (25) Adj. FCF $40 $54 $53 $68 $66 Acquisitions (197) (72) (50) (97) (102) Advances & Other Investing (28) (23) (17) (22) (19) Adj. Cash Used for Investing ($225) ($95) ($67) ($119) ($121) Balance Sheet Highlights Ending Cash $18 $15 $18 $21 $26 Ending Debt $276 $312 $331 $388 $456 Net Debt $258 $297 $313 $367 $430 Note: Advances moved from Operating to Investing cash flows for illustrative purposes 27 Cash Flow & Balance Sheet Highlights |
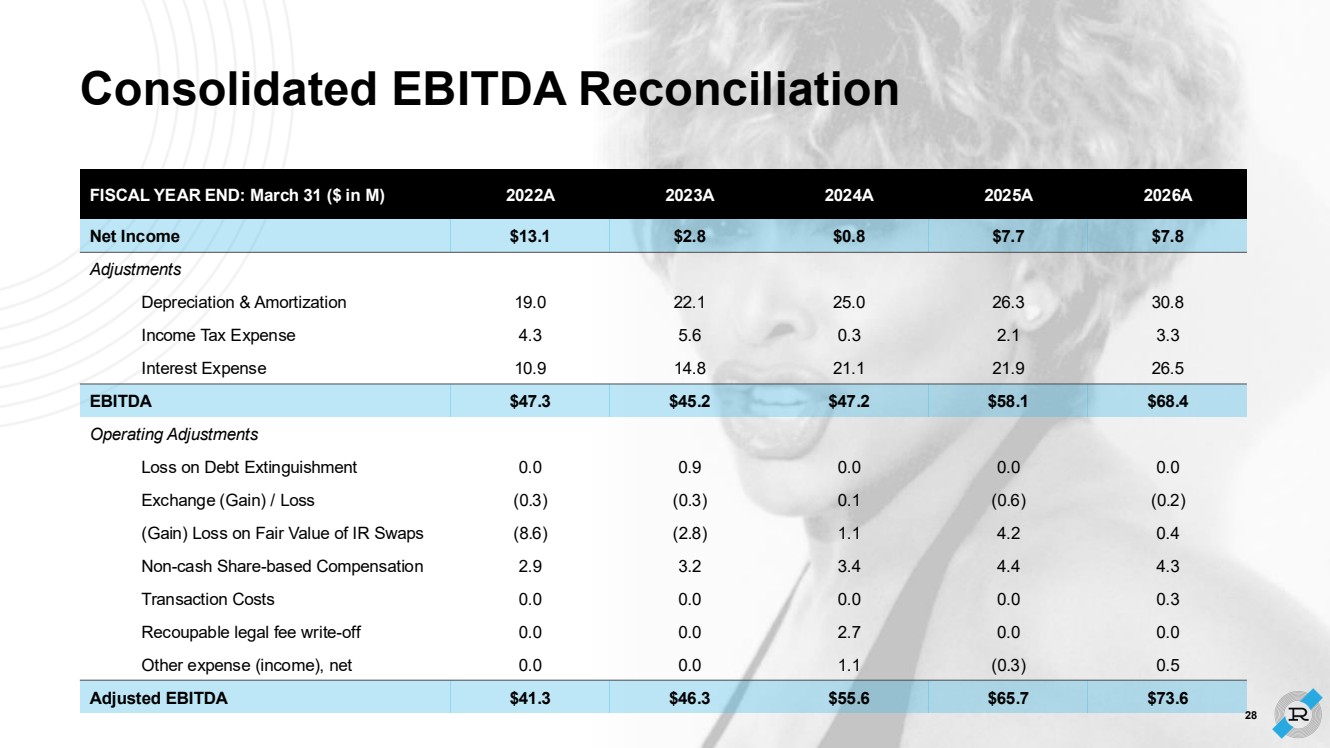
| FISCAL YEAR END: March 31 ($ in M) 2022A 2023A 2024A 2025A 2026A Net Income $13.1 $2.8 $0.8 $7.7 $7.8 Adjustments Depreciation & Amortization 19.0 22.1 25.0 26.3 30.8 Income Tax Expense 4.3 5.6 0.3 2.1 3.3 Interest Expense 10.9 14.8 21.1 21.9 26.5 EBITDA $47.3 $45.2 $47.2 $58.1 $68.4 Operating Adjustments Loss on Debt Extinguishment 0.0 0.9 0.0 0.0 0.0 Exchange (Gain) / Loss (0.3) (0.3) 0.1 (0.6) (0.2) (Gain) Loss on Fair Value of IR Swaps (8.6) (2.8) 1.1 4.2 0.4 Non-cash Share-based Compensation 2.9 3.2 3.4 4.4 4.3 Transaction Costs 0.0 0.0 0.0 0.0 0.3 Recoupable legal fee write-off 0.0 0.0 2.7 0.0 0.0 Other expense (income), net 0.0 0.0 1.1 (0.3) 0.5 Adjusted EBITDA $41.3 $46.3 $55.6 $65.7 $73.6 28 Consolidated EBITDA Reconciliation |
| PR Contact Suzanne Arrabito Reservoir sa@reservoir-media.com | 212-675-0541 29 IR Contact Jackie Marcus Alpha IR Group RSVR@alpha-ir.com | 312-445-2870 |