Exhibit 99.2
| Investor Update Q1 2026 |

| Forward-looking Statements 1/ Disclaimer This presentation may contain “forward-looking statements” which include, but are not limited to, statements regarding future events and other statements that are not historical facts. Forward-looking statements are generally accompanied by words such as “believe,” “may,” “will,” “estimate,” “continue,” “anticipate,” “intend,” “expect,” “should,” “would,” “plan,” “predict,” “potential,” “seem,” “seek,” “future,” “outlook” and similar expressions that predict or indicate future events or trends or that are not statements of historical matters. For example, Swvl Holdings Corp (“Swvl”) is using forward-looking statements when it discusses its technology, solutions and product suite capabilities; the belief that its solutions will enable the operation of a fully optimized transportation network, empowering accessible, efficient and reliable transportation; the expansion of its business in the United States (“US”) and the United Kingdom (“UK”); its long-term sustainability and dollar-pegged growth; the expansion of dollar-pegged revenue to reduce exposure to changes in foreign currencies; the expansion of engineering operations and support teams in some of the cost-effective markets it operates in; the expectation that its new cohort of contracts will continue to grow year-over-year (YoY) while its commercial engine will consistently bring in new cohorts of contracts at an accelerating pace; the expectation that its strong gross profit growth positions Swvl for continued success in the years ahead and the expected revenue and gross margin in the upcoming fiscal year; that it is approaching break even; its expected profit margin expansion; and that by prioritizing recurring revenue over transactional revenue, Swvl aims to set a foundation for predictable and profitable growth while reducing the impact of market seasonality These statements are based on the current expectations of Swvl’s management and are not predictions of actual performance. These forward-looking statements must not be relied on by any investor as a guarantee, assurance, prediction, or definitive statement of fact or probability. Actual results and outcomes could differ materially for a variety of reasons, including, among others, general economic, political and business conditions; the ability of Swvl to execute its growth strategy, manage growth profitably and retain its key employees; competition with other companies in the mobility industry; Swvl’s limited operating history and lack of experience as a public company; recent implementation of certain policies and procedures to ensure compliance with applicable laws and regulations, including with respect to anti-bribery, anti-corruption, and cyber protection; the risk that Swvl is not able to execute its portfolio optimization plan; the risk that Swvl is unable to attract and retain consumers and qualified drivers and other high-quality personnel; the risk that Swvl is unable to protect and enforce its intellectual property rights; the risk that Swvl is unable to determine rider demand to develop new offerings on its platform; the difficulty of obtaining required registrations, licenses, permits or approvals in jurisdictions in which Swvl currently operates or may in the future operate; the fact that Swvl currently operates in and intends to expand into jurisdictions that are, or have been, characterized by political instability, may have inadequate or limited regulatory and legal frameworks and may have limited, if any, treaties or other arrangements in place to protect foreign investment or involvement; the risk that Swvl’s drivers could be classified as employees, workers or quasi-employees in the jurisdictions they operate; the fact that Swvl has operations in countries known to experience high levels of corruption and is subject to territorial anti-corruption laws in these jurisdictions; the ability of Swvl to maintain the listing of its securities on Nasdaq; Swvl’s acquisitions may not be beneficial to Swvl as a result of the cost of integrating geographically disparate operations and the diversion of management’s attention from its existing business, among other things; and other risks that will be detailed from time to time in filings with the U.S. Securities and Exchange Commission. The foregoing list of risk factors is not exhaustive. There may be additional risks that Swvl presently does not know or that Swvl currently believes are immaterial that could also cause actual results to differ from those contained in forward-looking statements. In addition, forward-looking statements provide Swvl’s expectations, plans or forecasts of future events and views as of the date of this communication. Swvl anticipates that subsequent events and developments will cause Swvl’s assessments and projections to change. However, while Swvl may elect to update these forward-looking statements in the future, Swvl specifically disclaims any obligation to do so. These forward-looking statements should not be relied upon as representing Swvl’s assessments as of any date subsequent to the date of this presentation. Accordingly, undue reliance should not be placed upon the forward-looking statements. SWVL Holdings Corp | NASDAQ: SWVL | Q1 2026 Update |
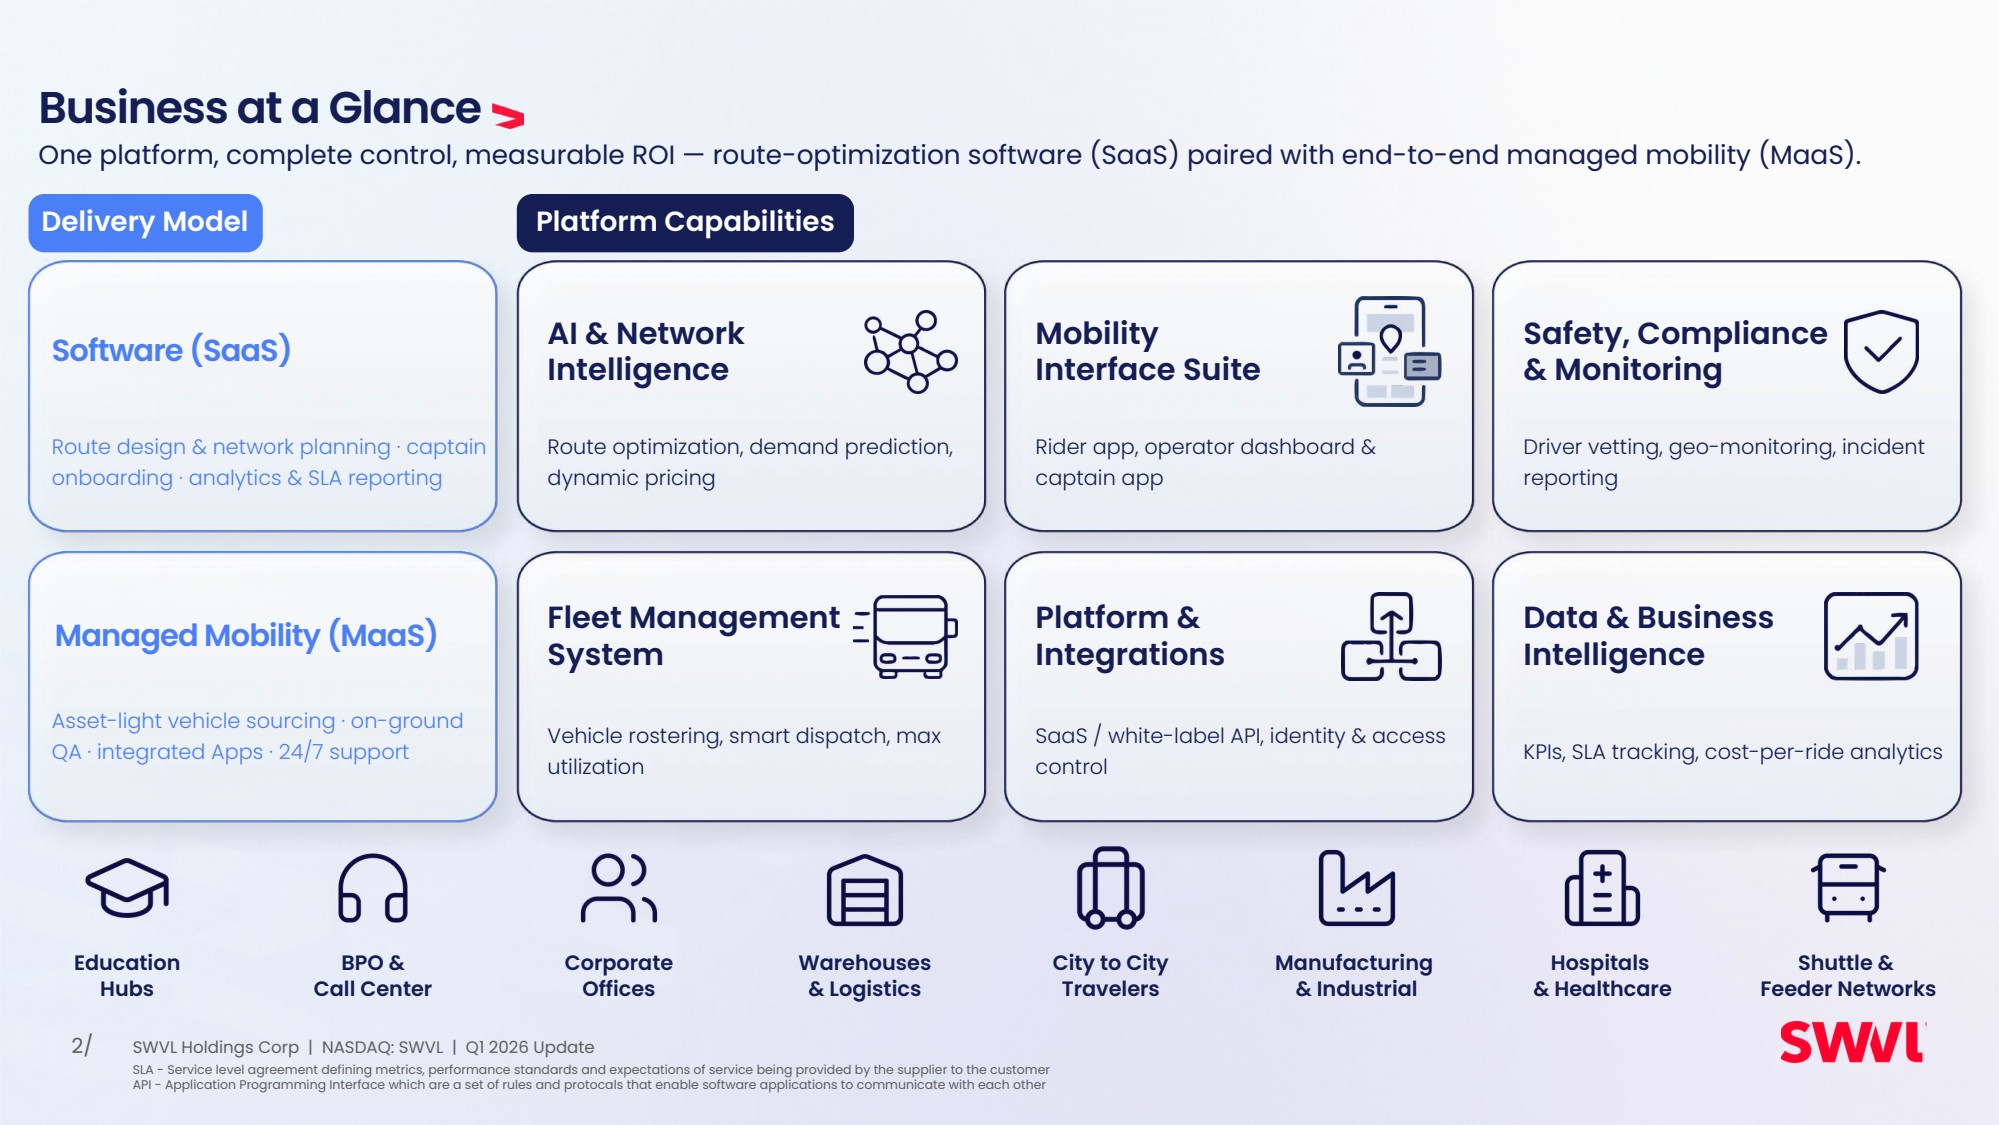
| Business at a Glance One platform, complete control, measurable ROI — route-optimization software (SaaS) paired with end-to-end managed mobility (MaaS). Rider app, operator dashboard & captain app Mobility Interface Suite Driver vetting, geo-monitoring, incident reporting Safety, Compliance & Monitoring Vehicle rostering, smart dispatch, max utilization Fleet Management System SaaS / white-label API, identity & access control Platform & Integrations KPIs, SLA tracking, cost-per-ride analytics Data & Business Intelligence 2/ Education Hubs BPO & Call Center Corporate Offices Warehouses & Logistics City to City Travelers Manufacturing & Industrial Hospitals & Healthcare Shuttle & Feeder Networks Route design & network planning · captain onboarding · analytics & SLA reporting Asset-light vehicle sourcing · on-ground QA · integrated Apps · 24/7 support Route optimization, demand prediction, dynamic pricing AI & Network Intelligence Platform Capabilities Software (SaaS) Managed Mobility (MaaS) Delivery Model SLA - Service level agreement defining metrics, performance standards and expectations of service being provided by the supplier to the customer API - Application Programming Interface which are a set of rules and protocals that enable software applications to communicate with each other SWVL Holdings Corp | NASDAQ: SWVL | Q1 2026 Update |
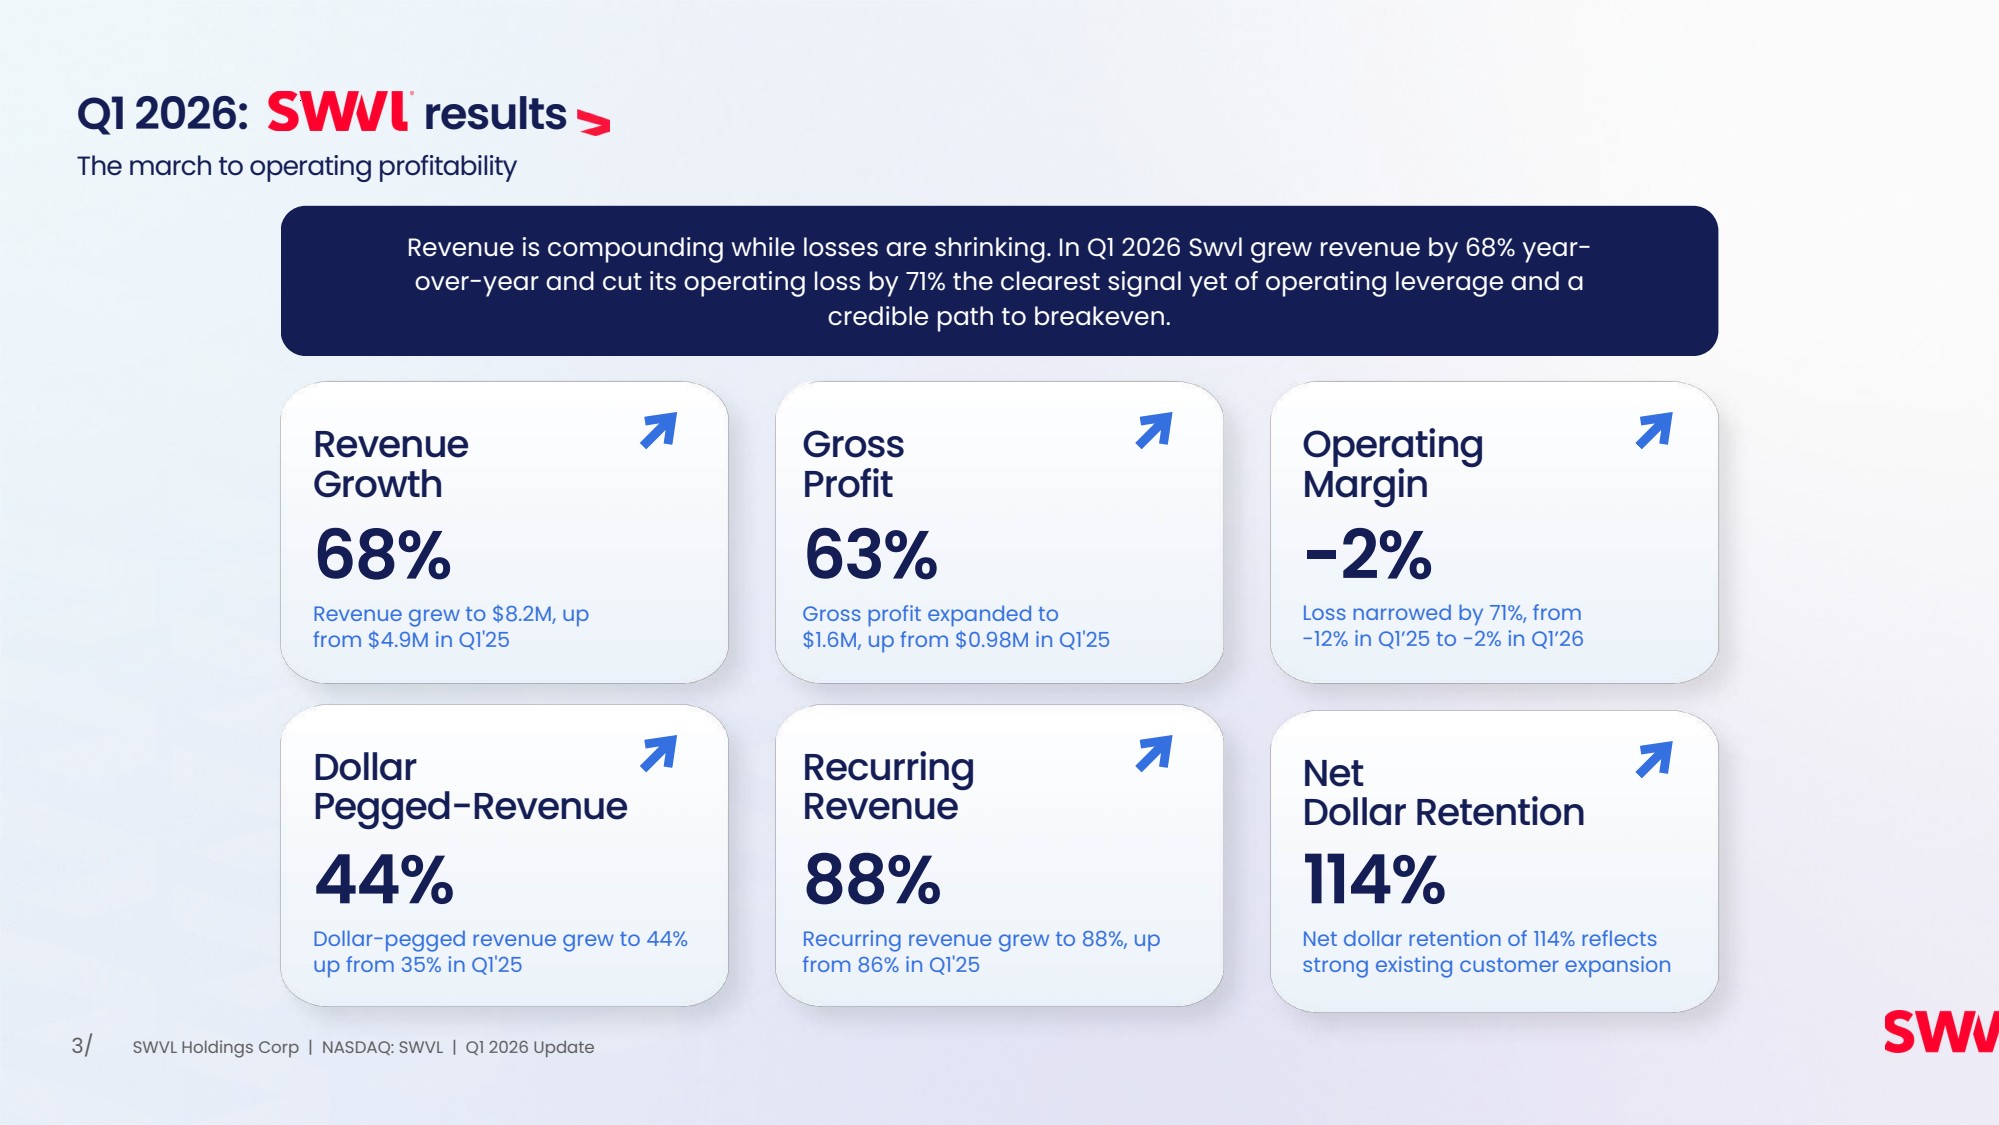
| Q1 2026: results Dollar Pegged-Revenue 44% Dollar-pegged revenue grew to 44% up from 35% in Q1'25 Revenue Growth 68% Revenue grew to $8.2M, up from $4.9M in Q1'25 Recurring Revenue 88% Recurring revenue grew to 88%, up from 86% in Q1'25 Gross Profit 63% Gross profit expanded to $1.6M, up from $0.98M in Q1'25 Net Dollar Retention 114% Net dollar retention of 114% reflects strong existing customer expansion Operating Margin -2% Loss narrowed by 71%, from -12% in Q1’25 to -2% in Q1’26 3/ The march to operating profitability Revenue is compounding while losses are shrinking. In Q1 2026 Swvl grew revenue by 68% year-over-year and cut its operating loss by 71% the clearest signal yet of operating leverage and a credible path to breakeven. SWVL Holdings Corp | NASDAQ: SWVL | Q1 2026 Update |
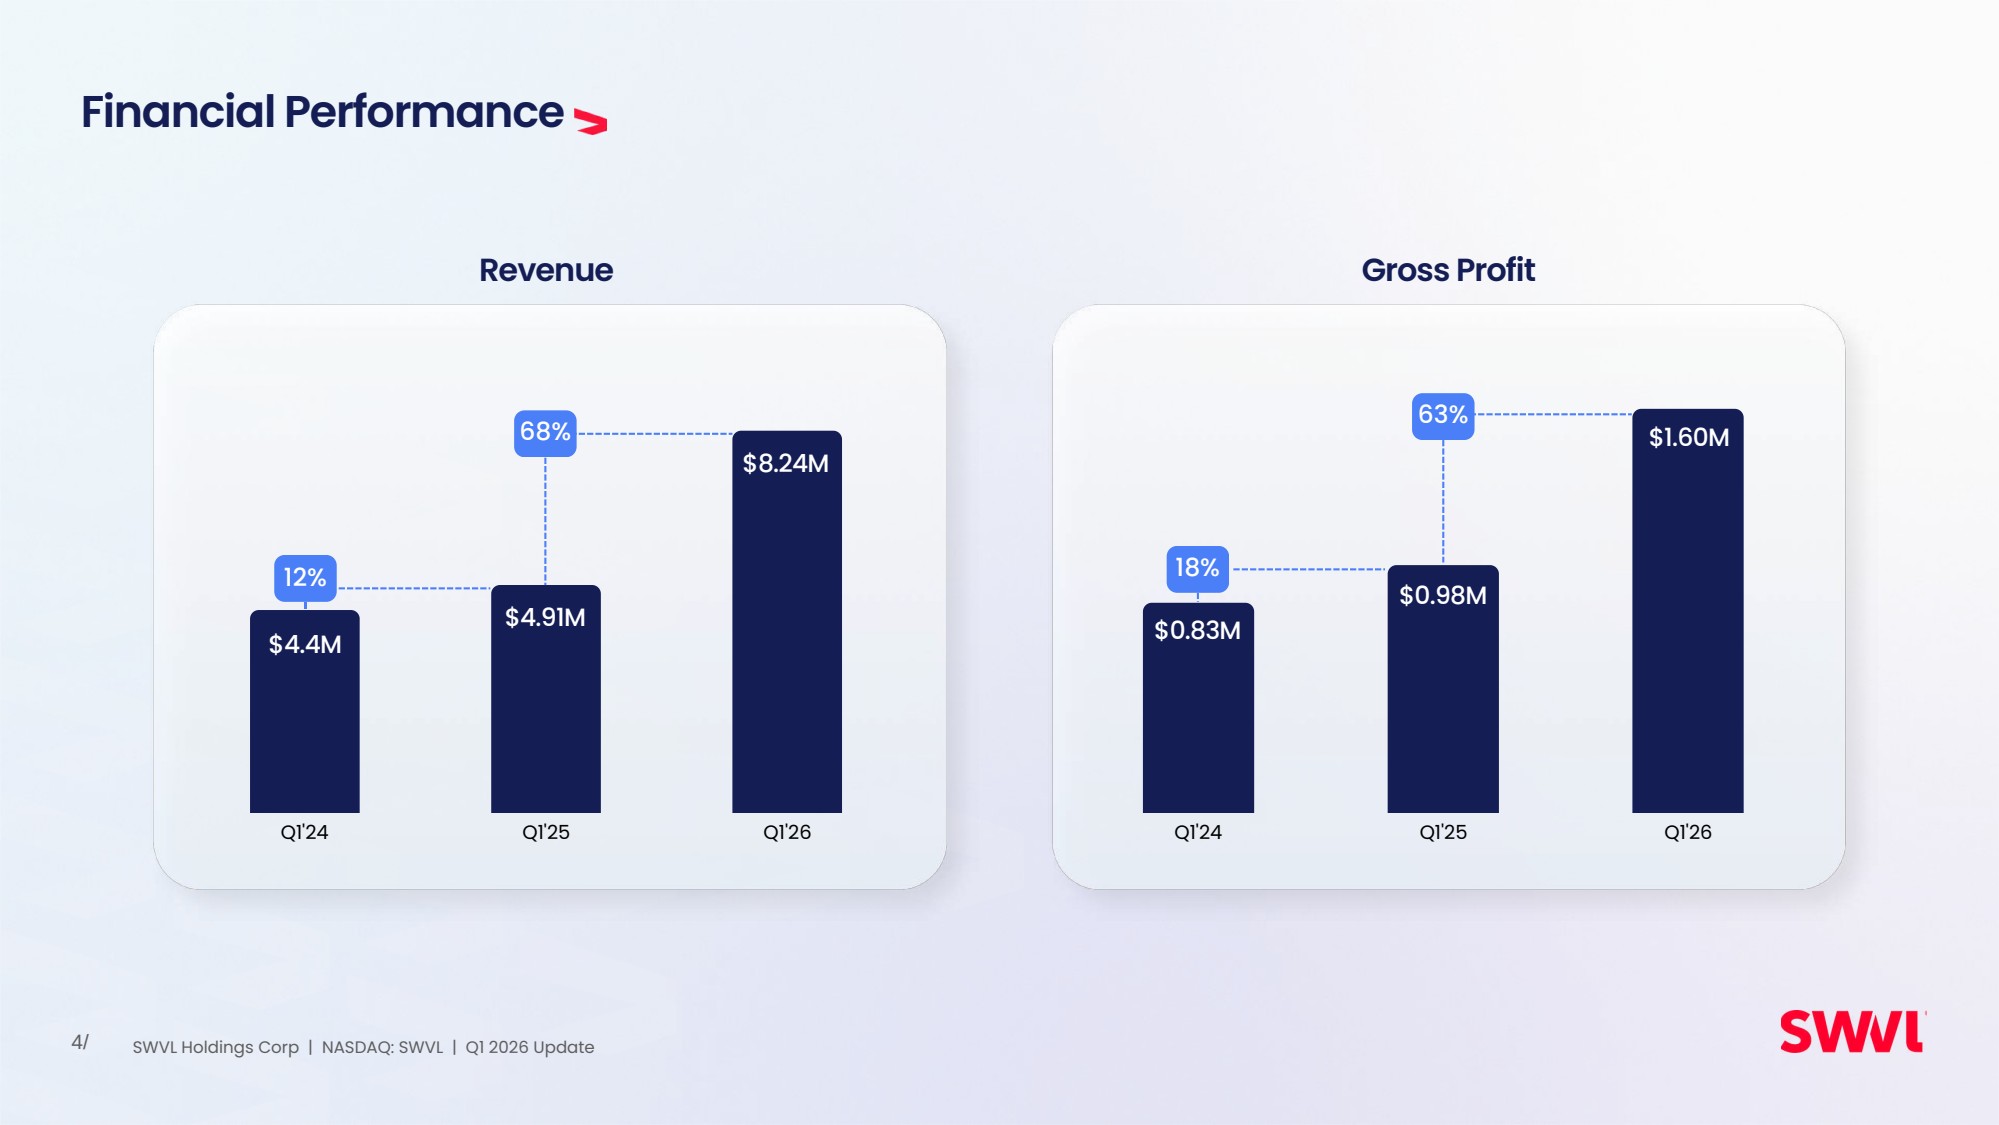
| Financial Performance Q1'24 Q1'25 Q1'26 Revenue Gross Profit 4/ Q1'24 Q1'25 Q1'26 $8.24M $0.83M $1.60M $4.91M $0.98M $4.4M 18% 68% 12% 63% SWVL Holdings Corp | NASDAQ: SWVL | Q1 2026 Update |
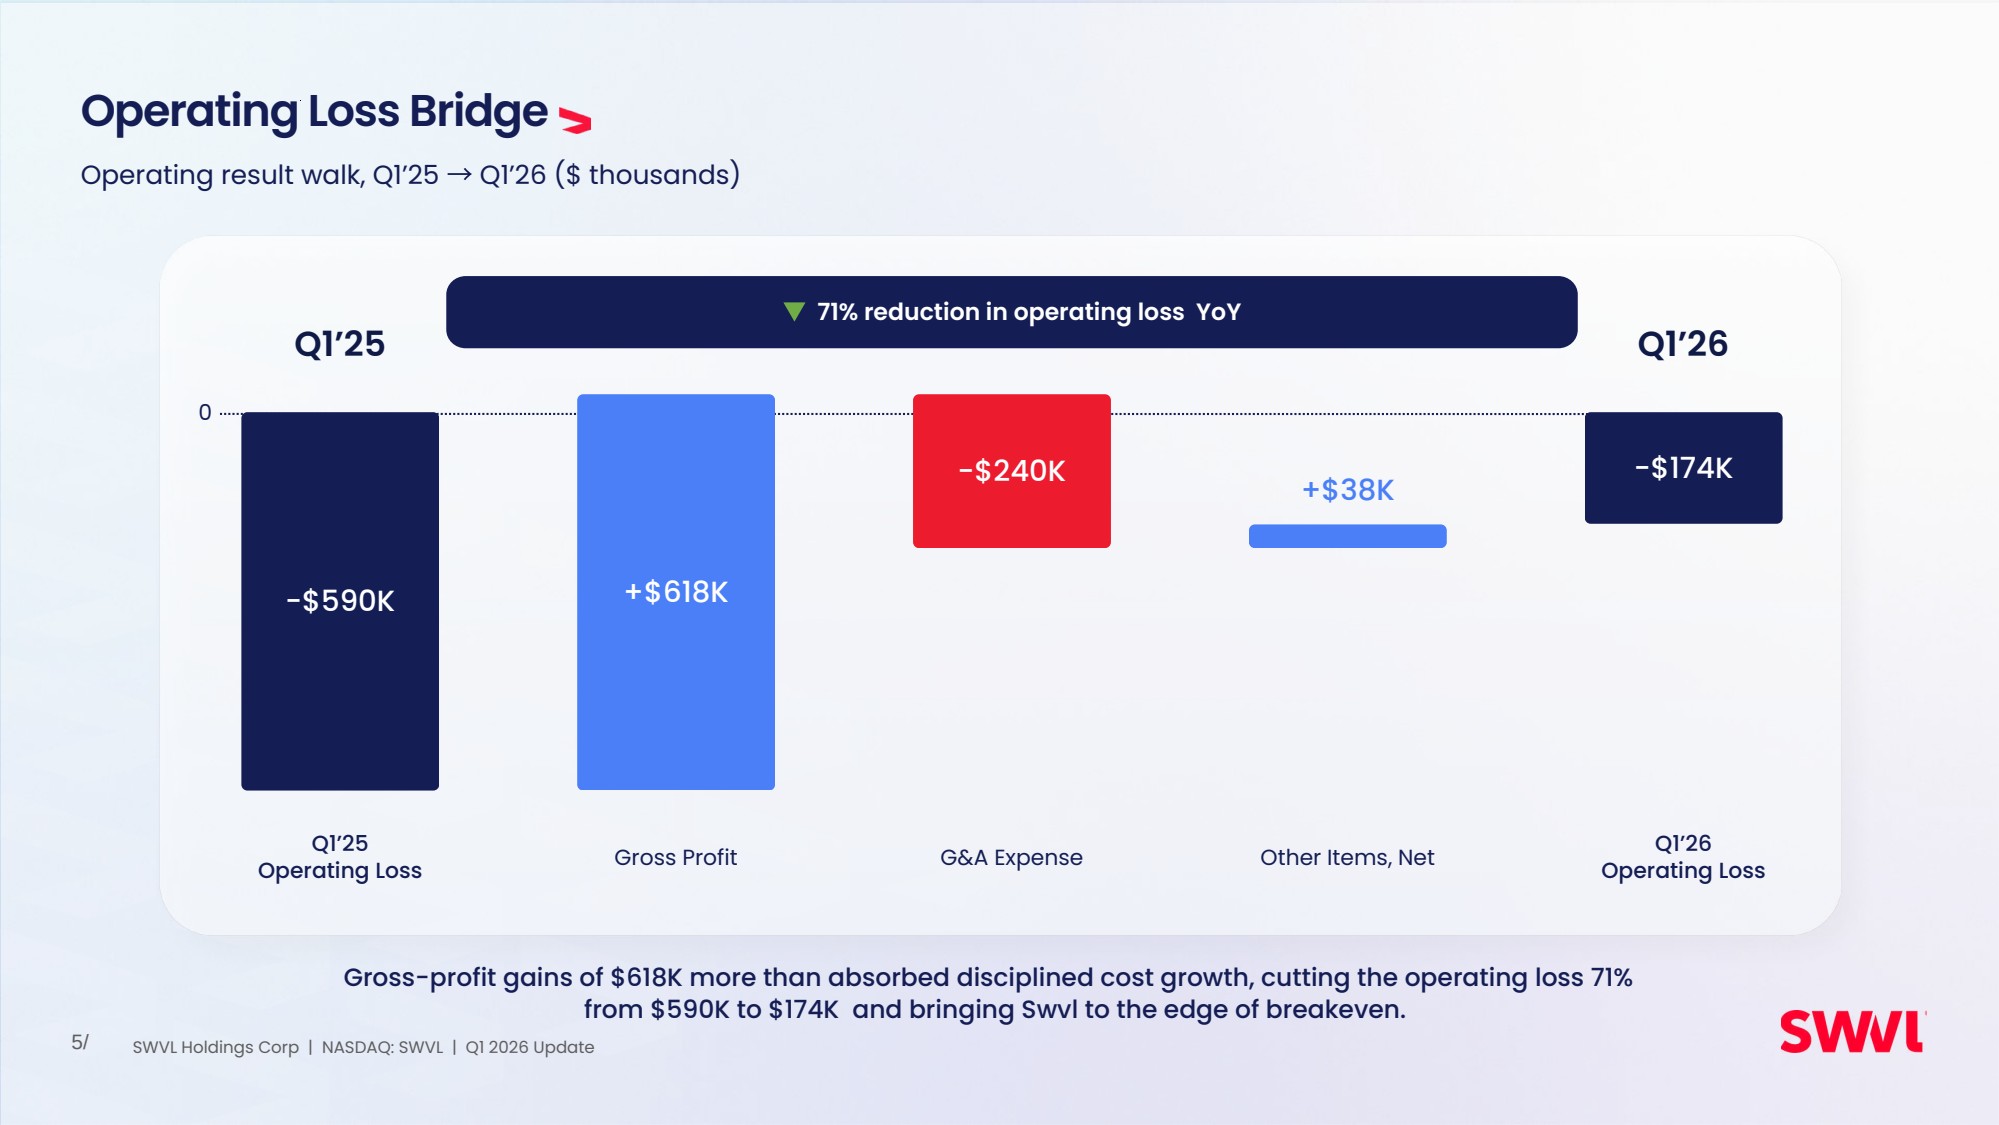
| 5/ Q1’25 Operating Loss Gross Profit G&A Expense +$38K Other Items, Net Q1’26 Operating Loss Gross-profit gains of $618K more than absorbed disciplined cost growth, cutting the operating loss 71% from $590K to $174K and bringing Swvl to the edge of breakeven. Operating result walk, Q1’25 → Q1’26 ($ thousands) Operating Loss Bridge Q1’25 Q1’26 ▼ 71% reduction in operating loss YoY −$590K +$618K −$240K −$174K 0 SWVL Holdings Corp | NASDAQ: SWVL | Q1 2026 Update |
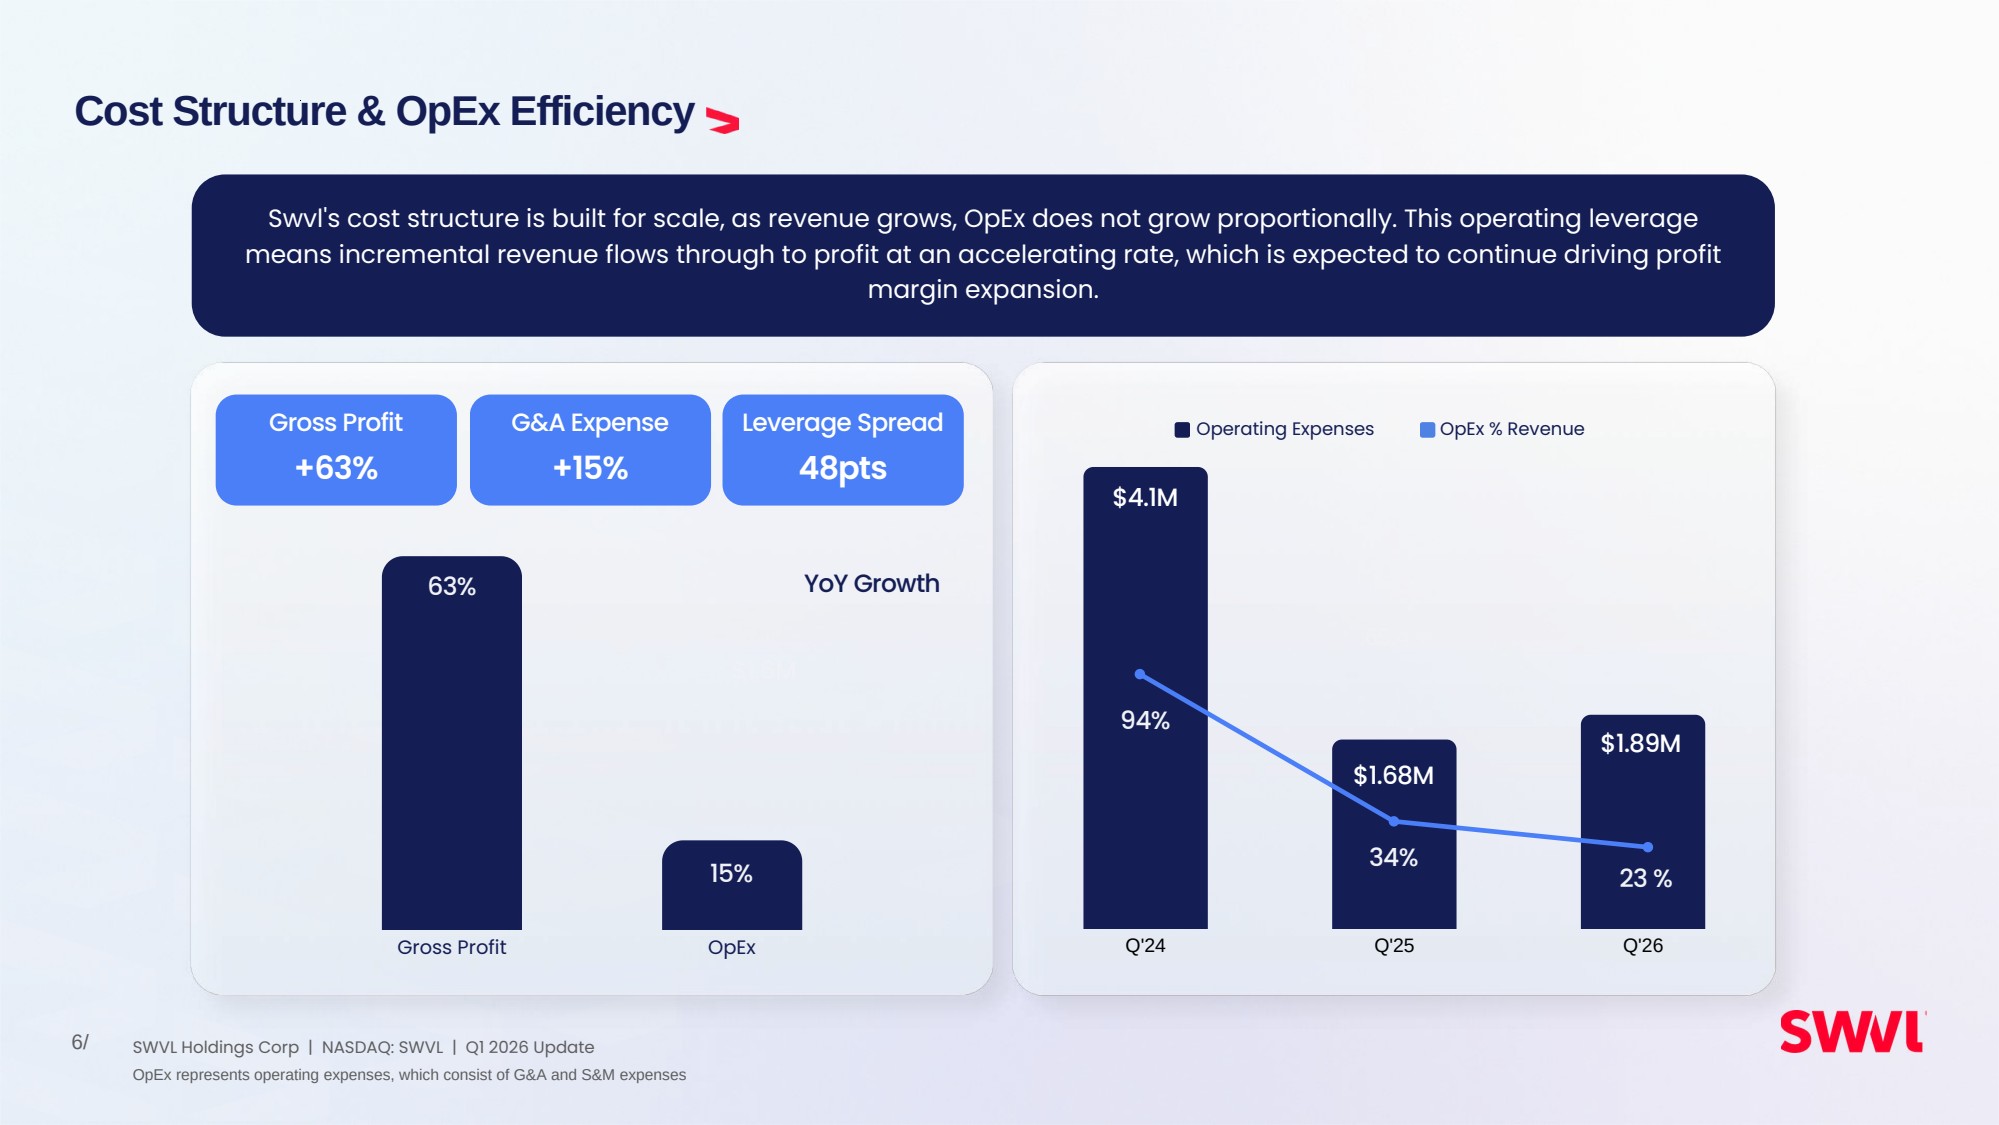
| Cost Structure & OpEx Efficiency 6/ Q'24 Q'25 Q'26 $1.68M $1.89M 34% 65.4 % 23 % Operating Expenses OpEx % Revenue Swvl's cost structure is built for scale, as revenue grows, OpEx does not grow proportionally. This operating leverage means incremental revenue flows through to profit at an accelerating rate, which is expected to continue driving profit margin expansion. OpEx represents operating expenses, which consist of G&A and S&M expenses $4.1M 94% Gross Profit OpEx $1.6M 63% 15% Gross Profit G&A Expense Leverage Spread +63% +15% 48pts YoY Growth SWVL Holdings Corp | NASDAQ: SWVL | Q1 2026 Update |
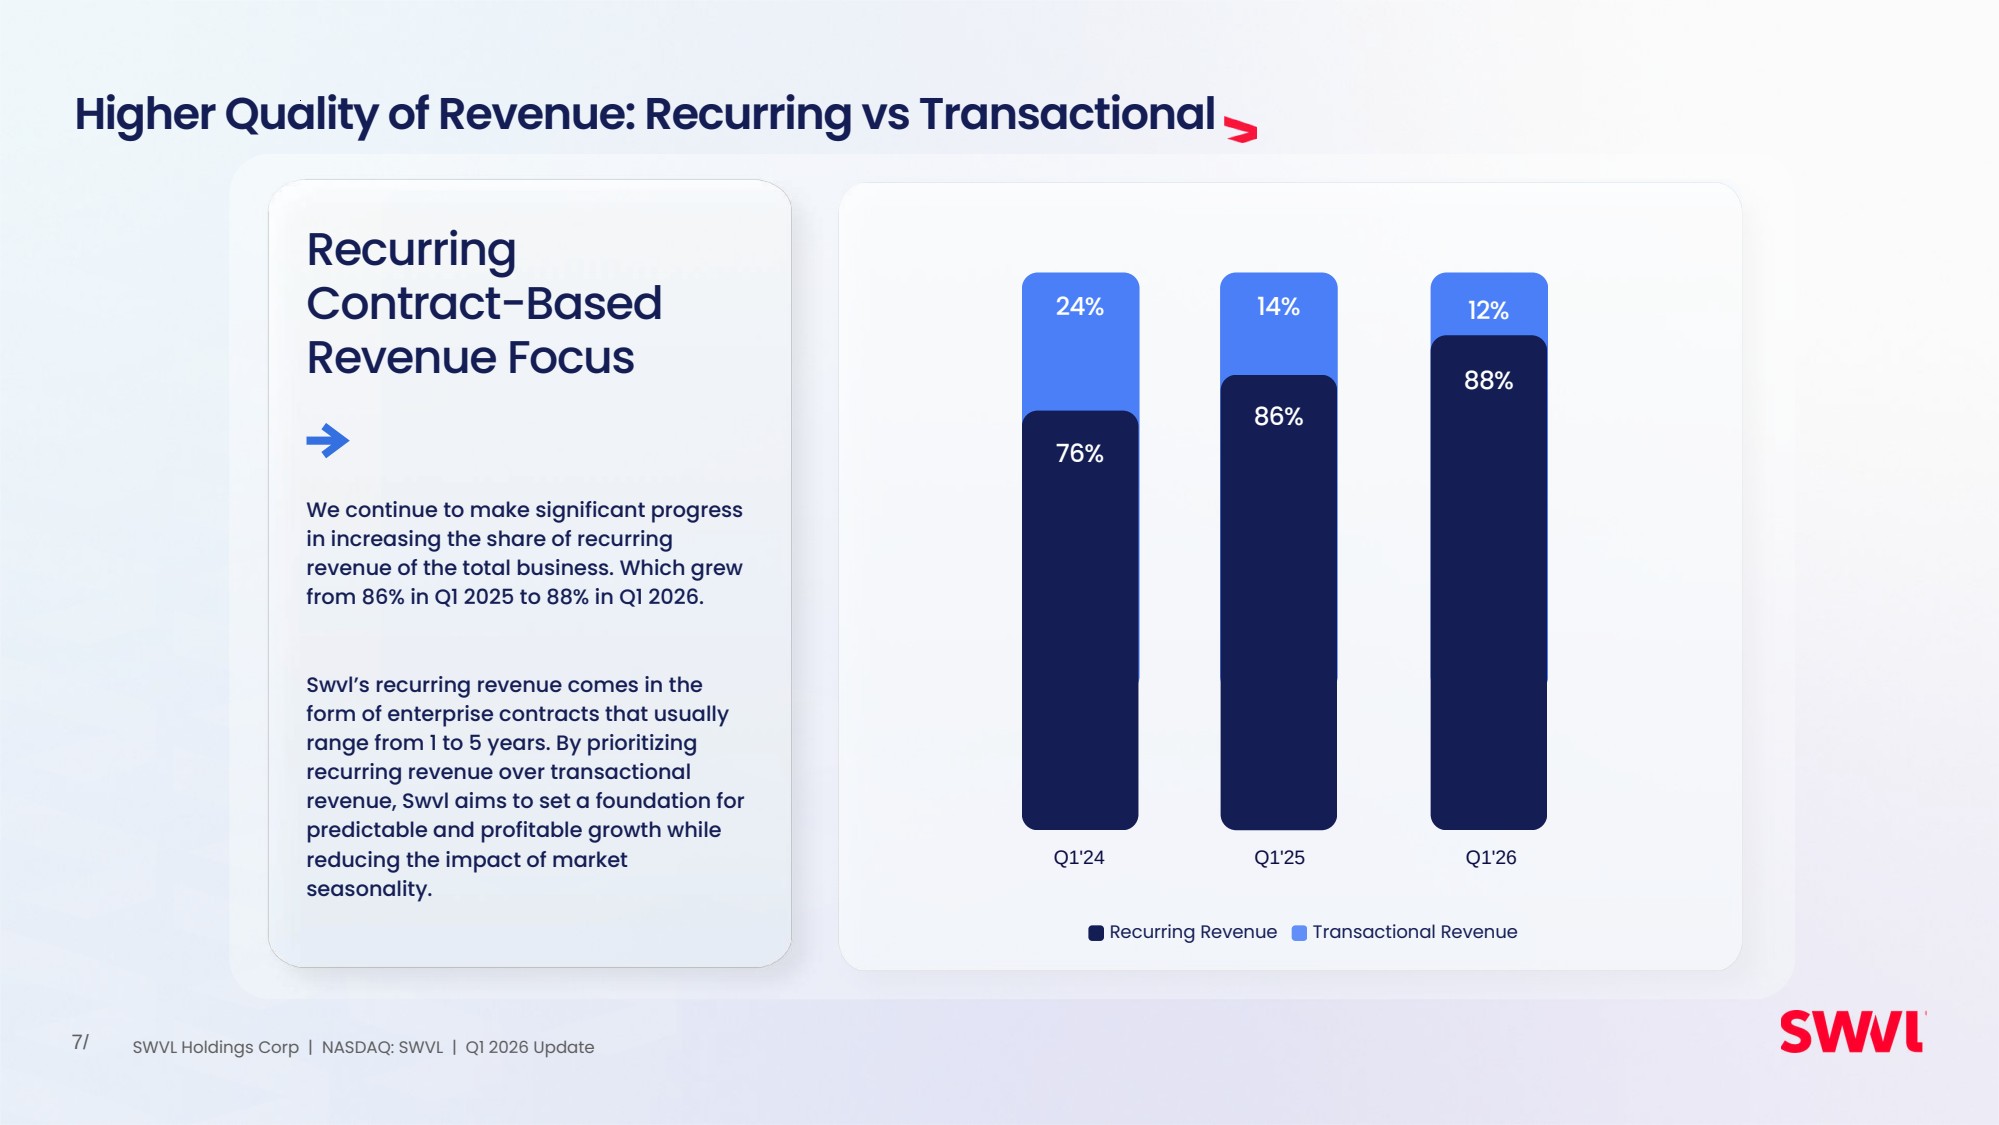
| Higher Quality of Revenue: Recurring vs Transactional 7/ Recurring Contract-Based Revenue Focus We continue to make significant progress in increasing the share of recurring revenue of the total business. Which grew from 86% in Q1 2025 to 88% in Q1 2026. Swvl’s recurring revenue comes in the form of enterprise contracts that usually range from 1 to 5 years. By prioritizing recurring revenue over transactional revenue, Swvl aims to set a foundation for predictable and profitable growth while reducing the impact of market seasonality. Recurring Revenue Transactional Revenue Q1'24 Q1'25 Q1'26 88% 86% 76% 88% 86% 76% 24% 14% 12% SWVL Holdings Corp | NASDAQ: SWVL | Q1 2026 Update |
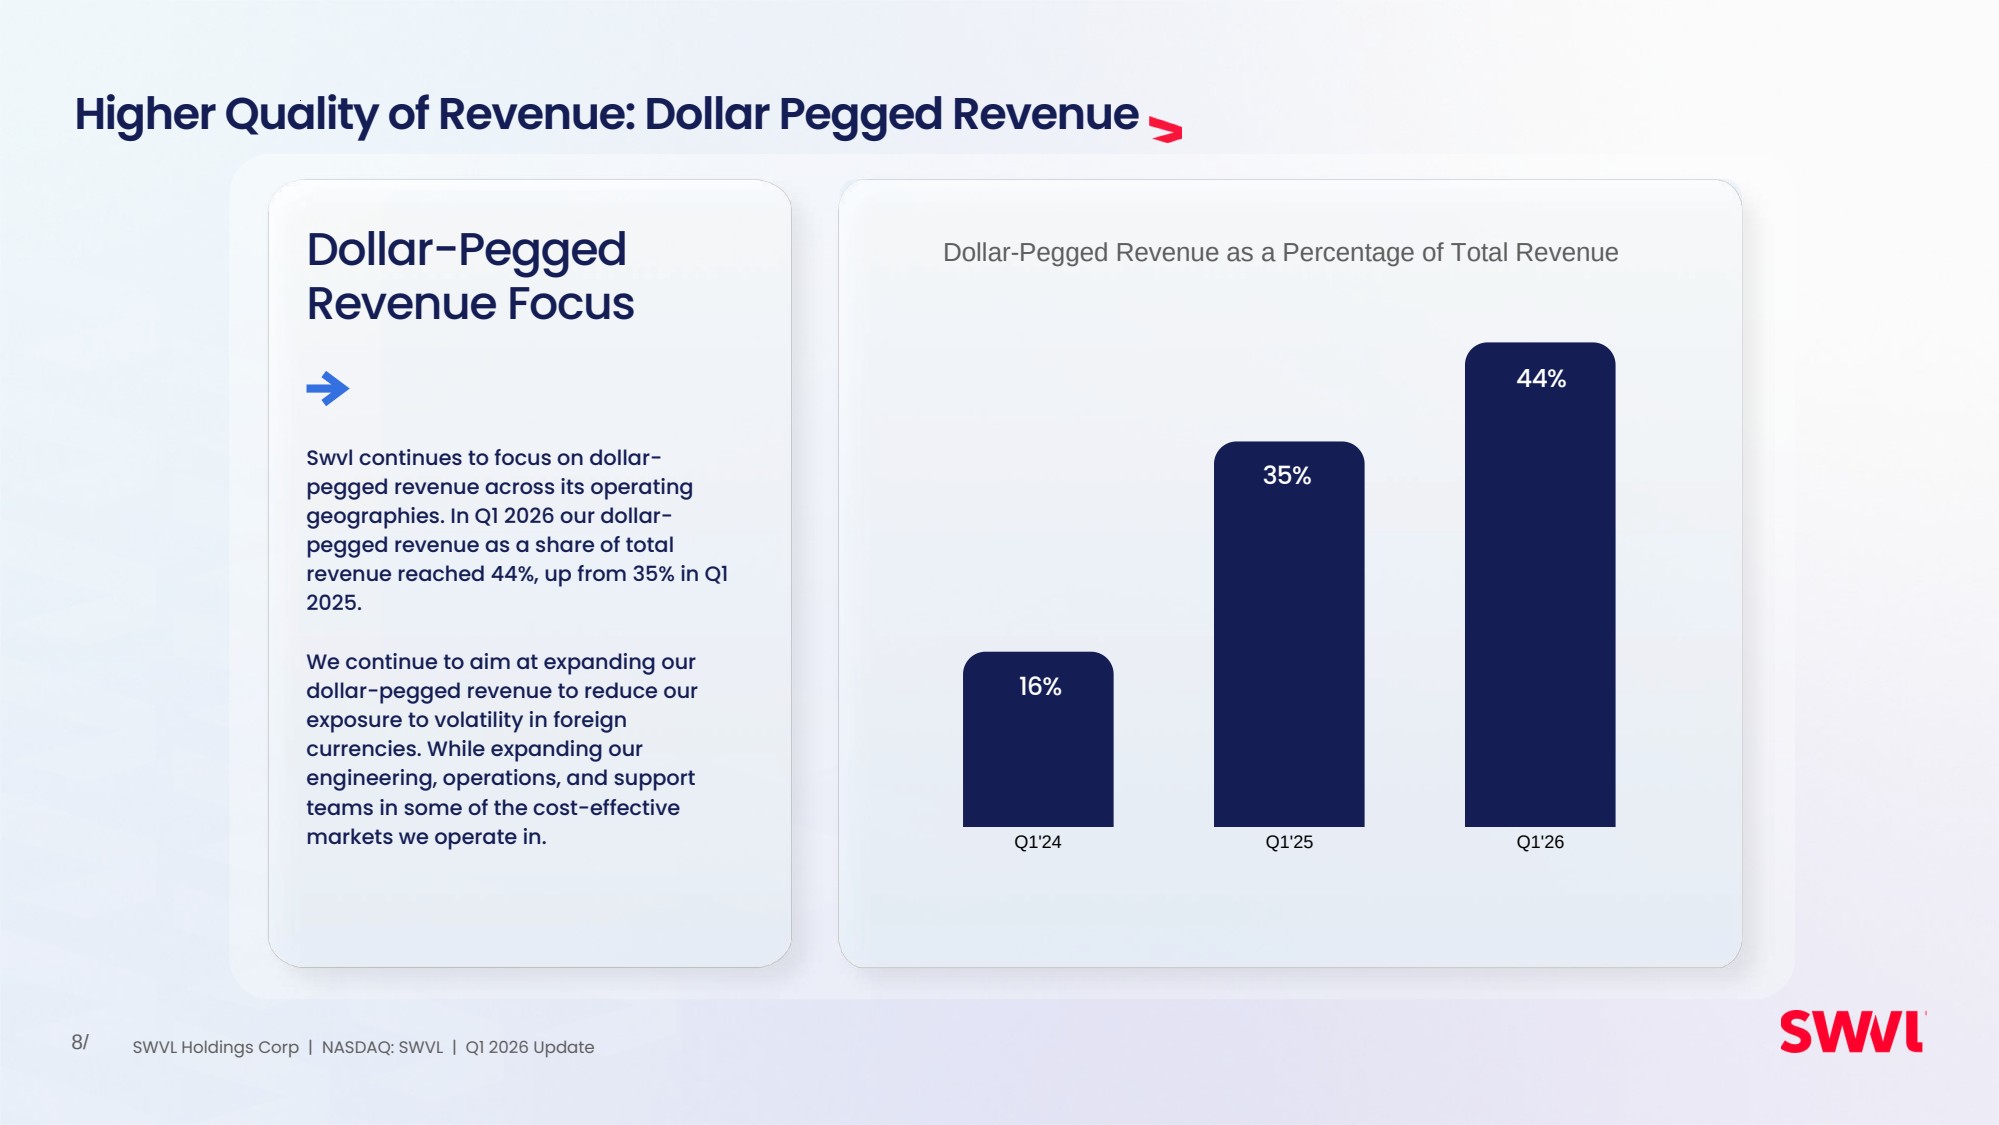
| Higher Quality of Revenue: Dollar Pegged Revenue 8/ Dollar-Pegged Revenue Focus Swvl continues to focus on dollar-pegged revenue across its operating geographies. In Q1 2026 our dollar-pegged revenue as a share of total revenue reached 44%, up from 35% in Q1 2025. We continue to aim at expanding our dollar-pegged revenue to reduce our exposure to volatility in foreign currencies. While expanding our engineering, operations, and support teams in some of the cost-effective markets we operate in. Dollar-Pegged Revenue as a Percentage of Total Revenue Q1'24 Q1'25 Q1'26 16% 35% 44% SWVL Holdings Corp | NASDAQ: SWVL | Q1 2026 Update |
| Geography deep dive 9/ SWVL Holdings Corp | NASDAQ: SWVL | Q1 2026 Update |

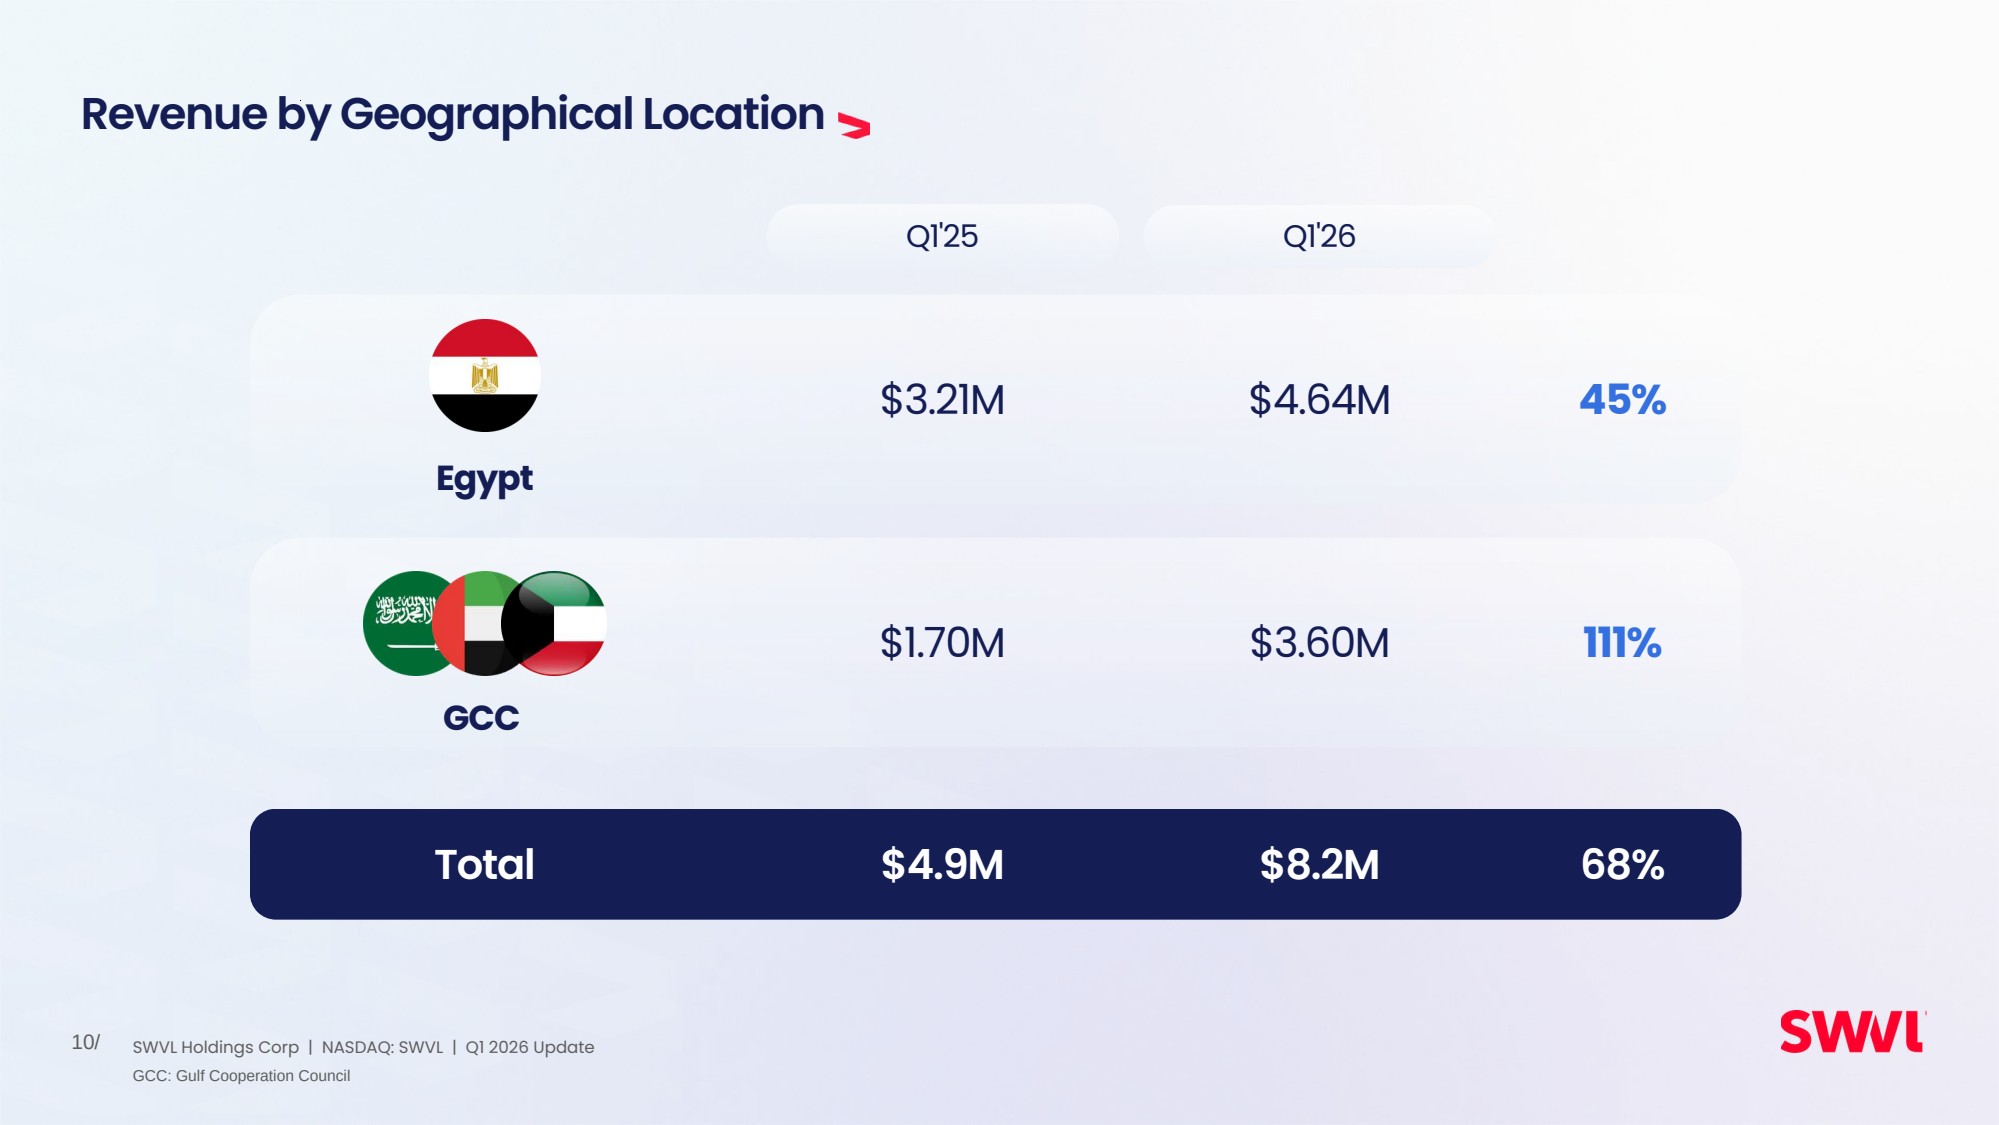
| Revenue by Geographical Location 10/ Egypt Q1'25 Q1'26 $3.21M $4.64M $1.70M $3.60M $4.9M $8.2M GCC Total 45% 111% 68% GCC: Gulf Cooperation Council SWVL Holdings Corp | NASDAQ: SWVL | Q1 2026 Update |
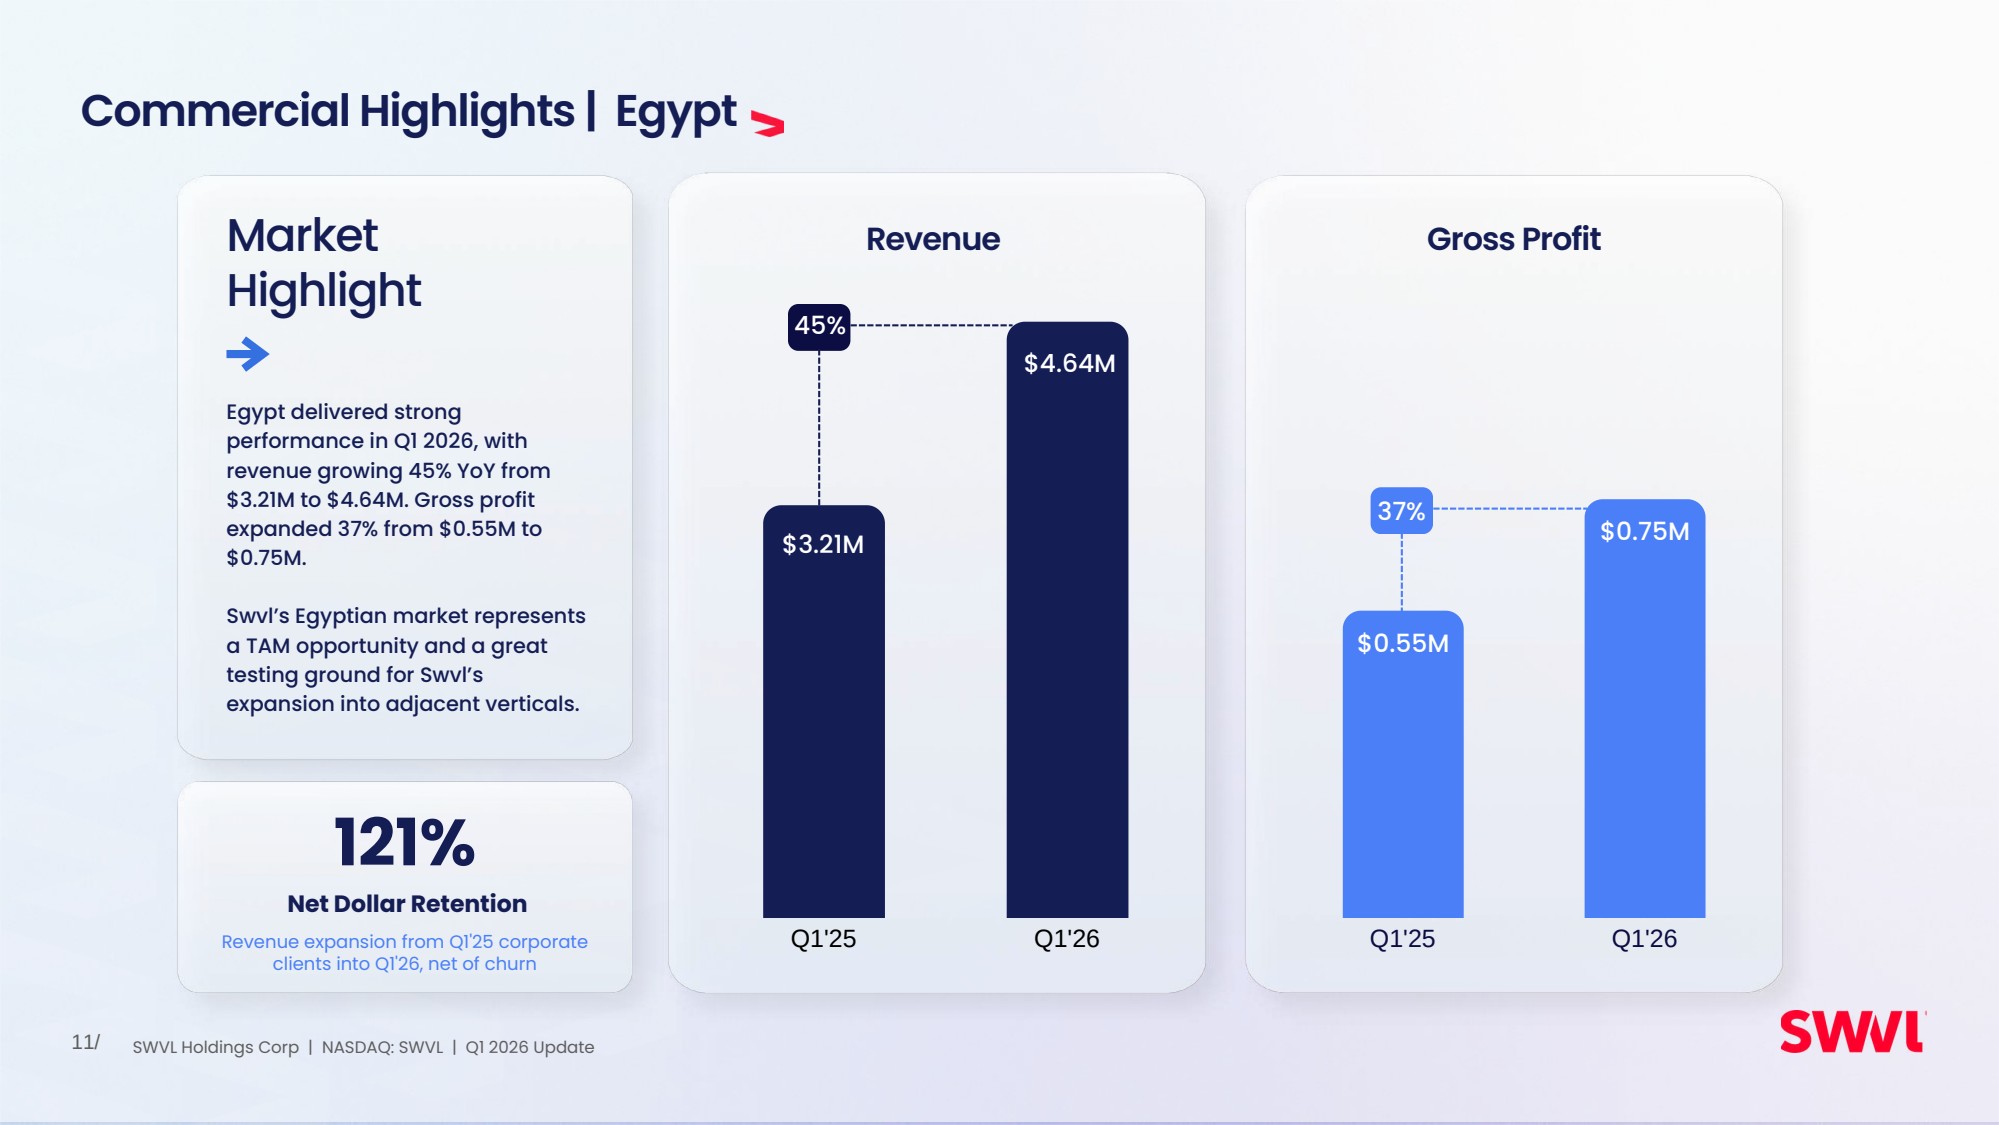
| Net Dollar Retention 121% Revenue expansion from Q1'25 corporate clients into Q1'26, net of churn 11/ Q1'25 Q1'26 Q1'25 Q1'26 Commercial Highlights | Egypt 37% Revenue Gross Profit 45% $3.21M $4.64M $0.75M $0.55M Egypt delivered strong performance in Q1 2026, with revenue growing 45% YoY from $3.21M to $4.64M. Gross profit expanded 37% from $0.55M to $0.75M. Swvl’s Egyptian market represents a TAM opportunity and a great testing ground for Swvl’s expansion into adjacent verticals. Market Highlight SWVL Holdings Corp | NASDAQ: SWVL | Q1 2026 Update |
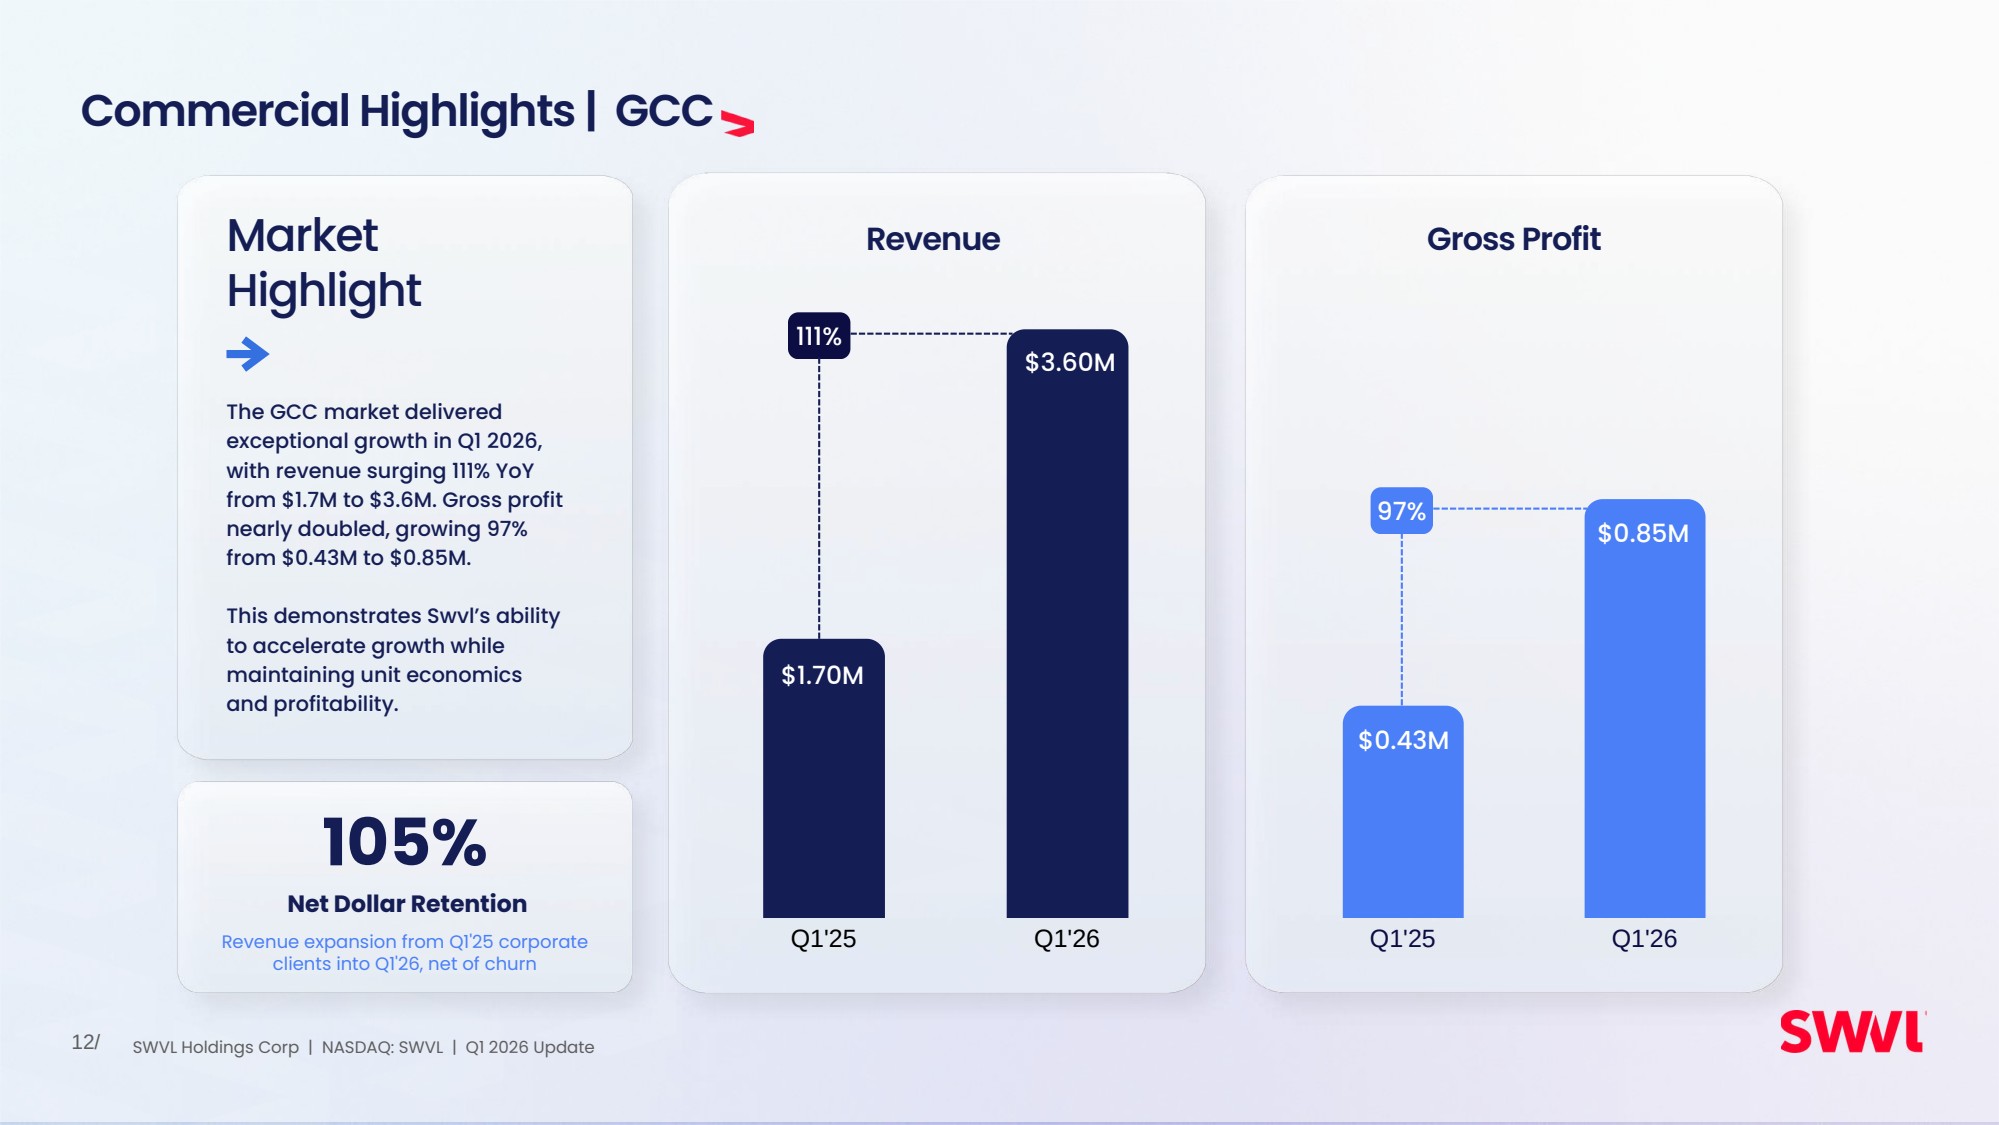
| 12/ Q1'25 Q1'26 The GCC market delivered exceptional growth in Q1 2026, with revenue surging 111% YoY from $1.7M to $3.6M. Gross profit nearly doubled, growing 97% from $0.43M to $0.85M. This demonstrates Swvl’s ability to accelerate growth while maintaining unit economics and profitability. Q1'25 Q1'26 Commercial Highlights | GCC Market Highlight 97% 111% Revenue Gross Profit $1.70M $3.60M $0.85M $0.43M Net Dollar Retention 105% Revenue expansion from Q1'25 corporate clients into Q1'26, net of churn SWVL Holdings Corp | NASDAQ: SWVL | Q1 2026 Update |
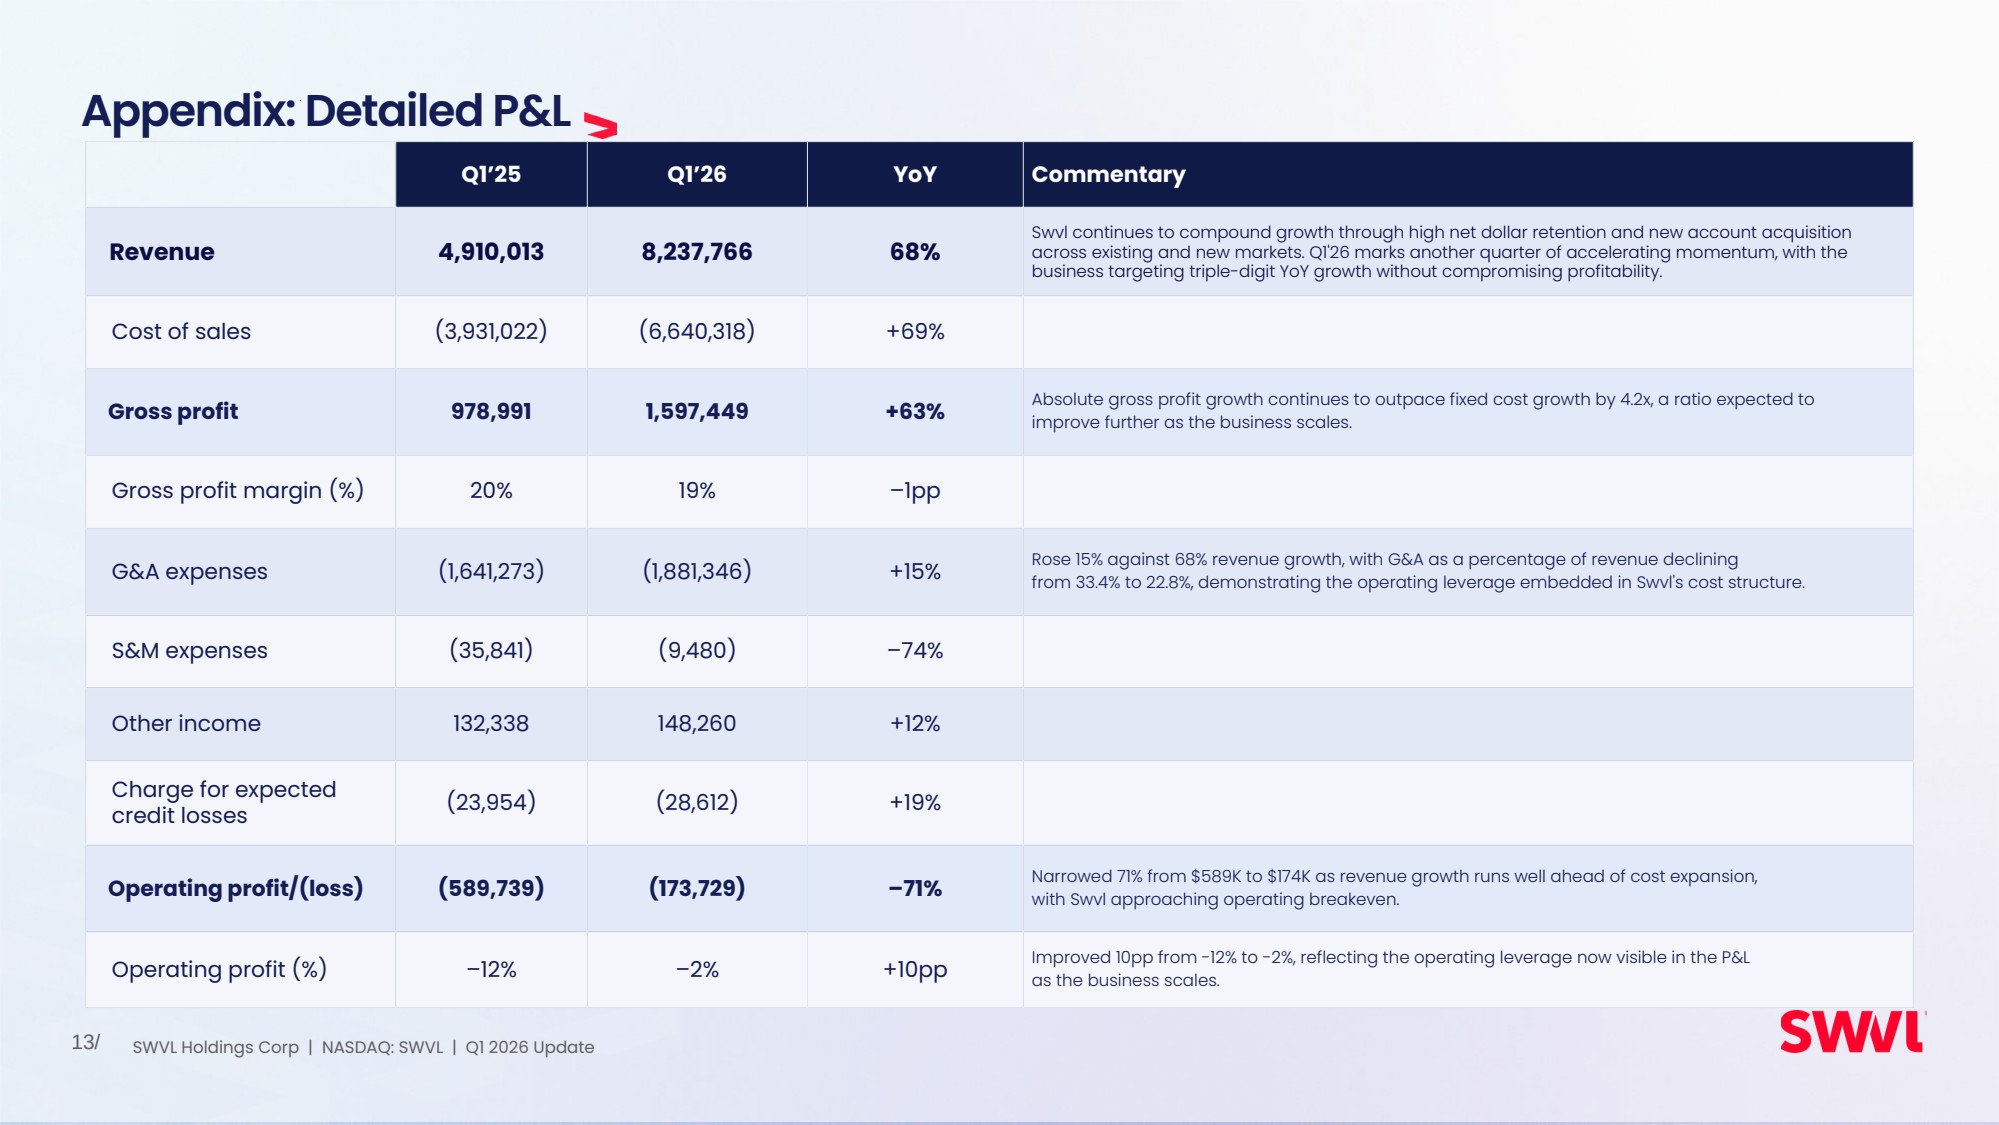
| 13/ Appendix: Detailed P&L Q1’25 Q1’26 YoY Commentary Revenue 4,910,013 8,237,766 68% Swvl continues to compound growth through high net dollar retention and new account acquisition across existing and new markets. Q1'26 marks another quarter of accelerating momentum, with the business targeting triple-digit YoY growth without compromising profitability. Cost of sales (3,931,022) (6,640,318) +69% Gross profit 978,991 1,597,449 +63% Absolute gross profit growth continues to outpace fixed cost growth by 4.2x, a ratio expected to improve further as the business scales. Gross profit margin (%) 20% 19% –1pp G&A expenses (1,641,273) (1,881,346) +15% Rose 15% against 68% revenue growth, with G&A as a percentage of revenue declining from 33.4% to 22.8%, demonstrating the operating leverage embedded in Swvl's cost structure. S&M expenses (35,841) (9,480) –74% Other income 132,338 148,260 +12% Charge for expected credit losses (23,954) (28,612) +19% Operating profit/(loss) (589,739) (173,729) –71% Narrowed 71% from $589K to $174K as revenue growth runs well ahead of cost expansion, with Swvl approaching operating breakeven. Operating profit (%) –12% –2% +10pp Improved 10pp from -12% to -2%, reflecting the operating leverage now visible in the P&L as the business scales. SWVL Holdings Corp | NASDAQ: SWVL | Q1 2026 Update |
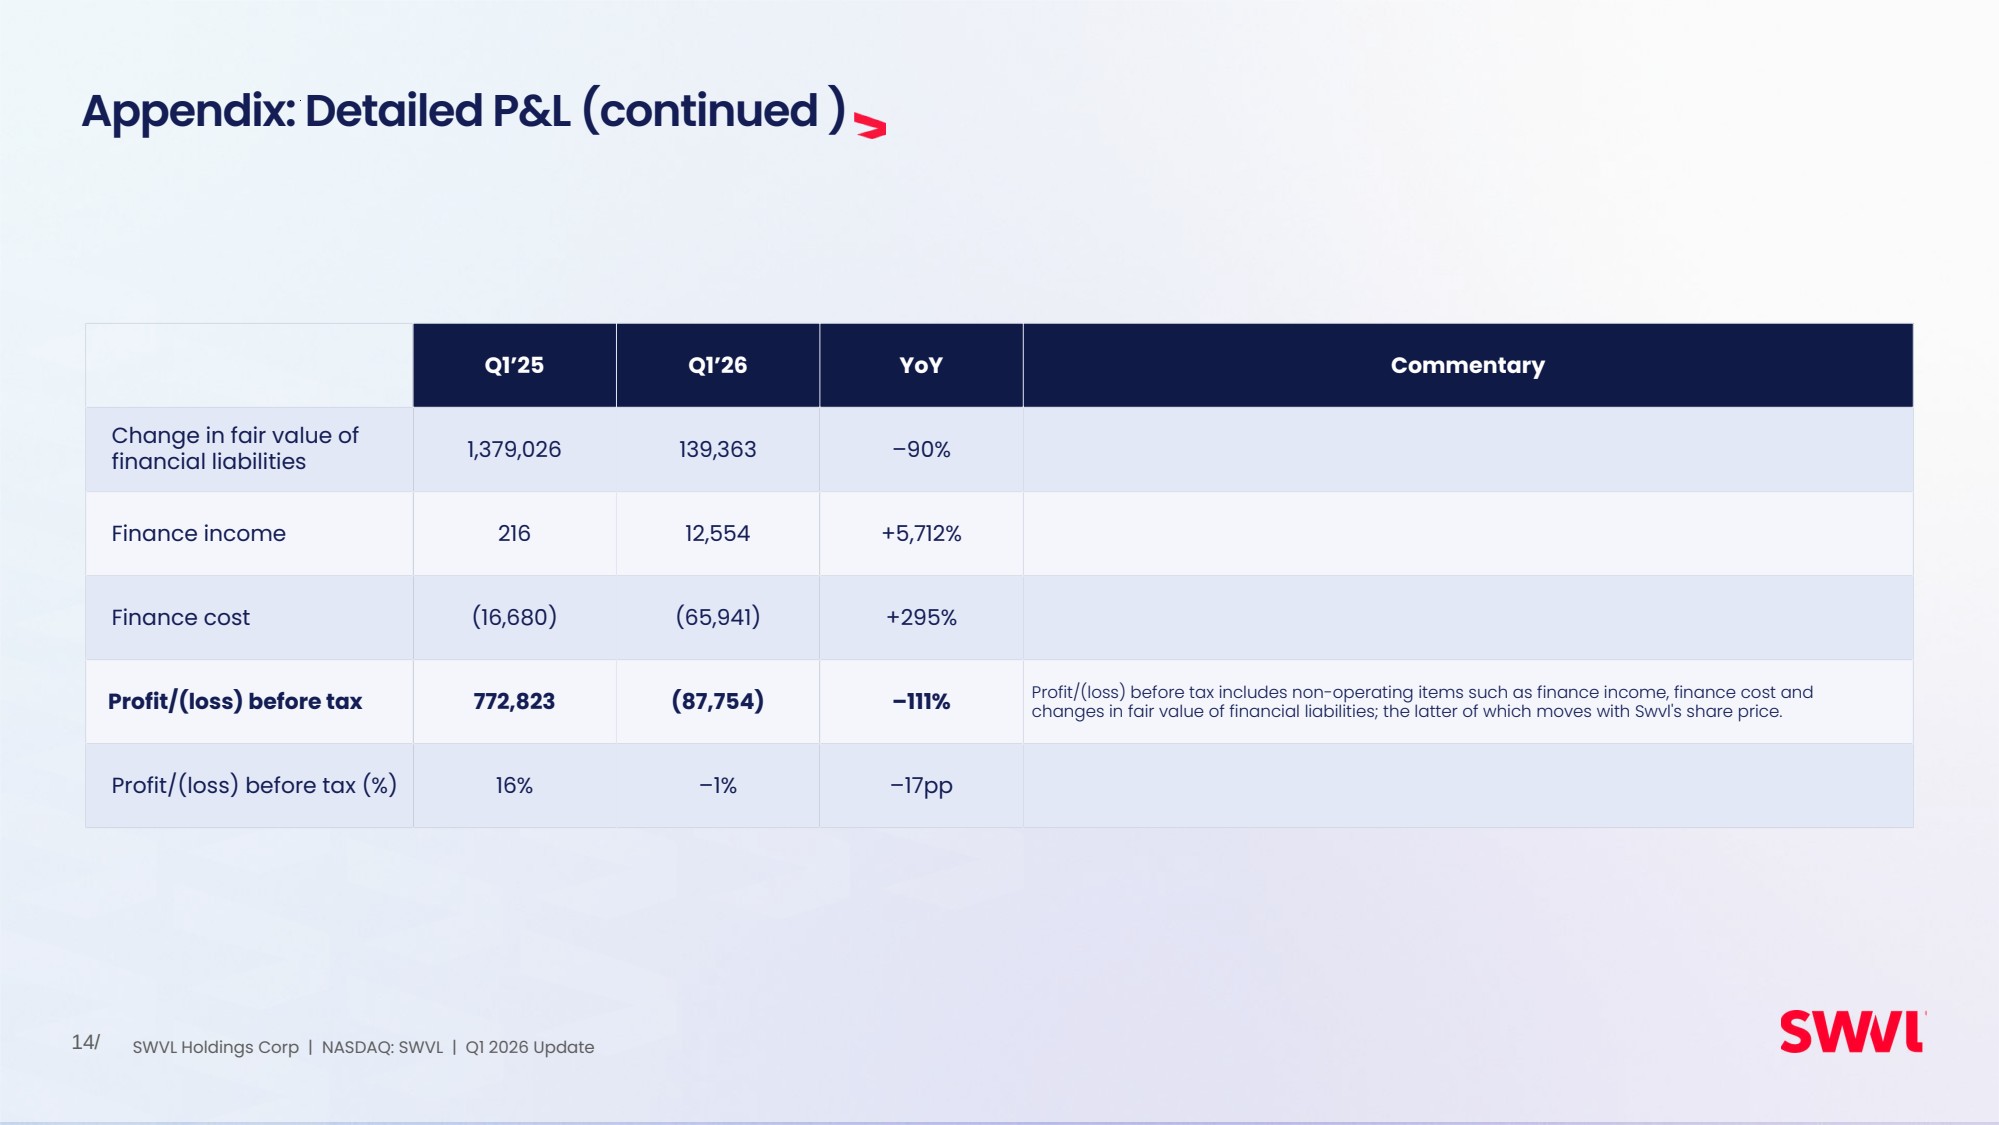
| 14/ Appendix: Detailed P&L (continued ) Q1’25 Q1’26 YoY Commentary Change in fair value of financial liabilities 1,379,026 139,363 –90% Finance income 216 12,554 +5,712% Finance cost (16,680) (65,941) +295% Profit/(loss) before tax 772,823 (87,754) –111% Profit/(loss) before tax includes non-operating items such as finance income, finance cost and changes in fair value of financial liabilities; the latter of which moves with Swvl's share price. Profit/(loss) before tax (%) 16% –1% –17pp SWVL Holdings Corp | NASDAQ: SWVL | Q1 2026 Update |
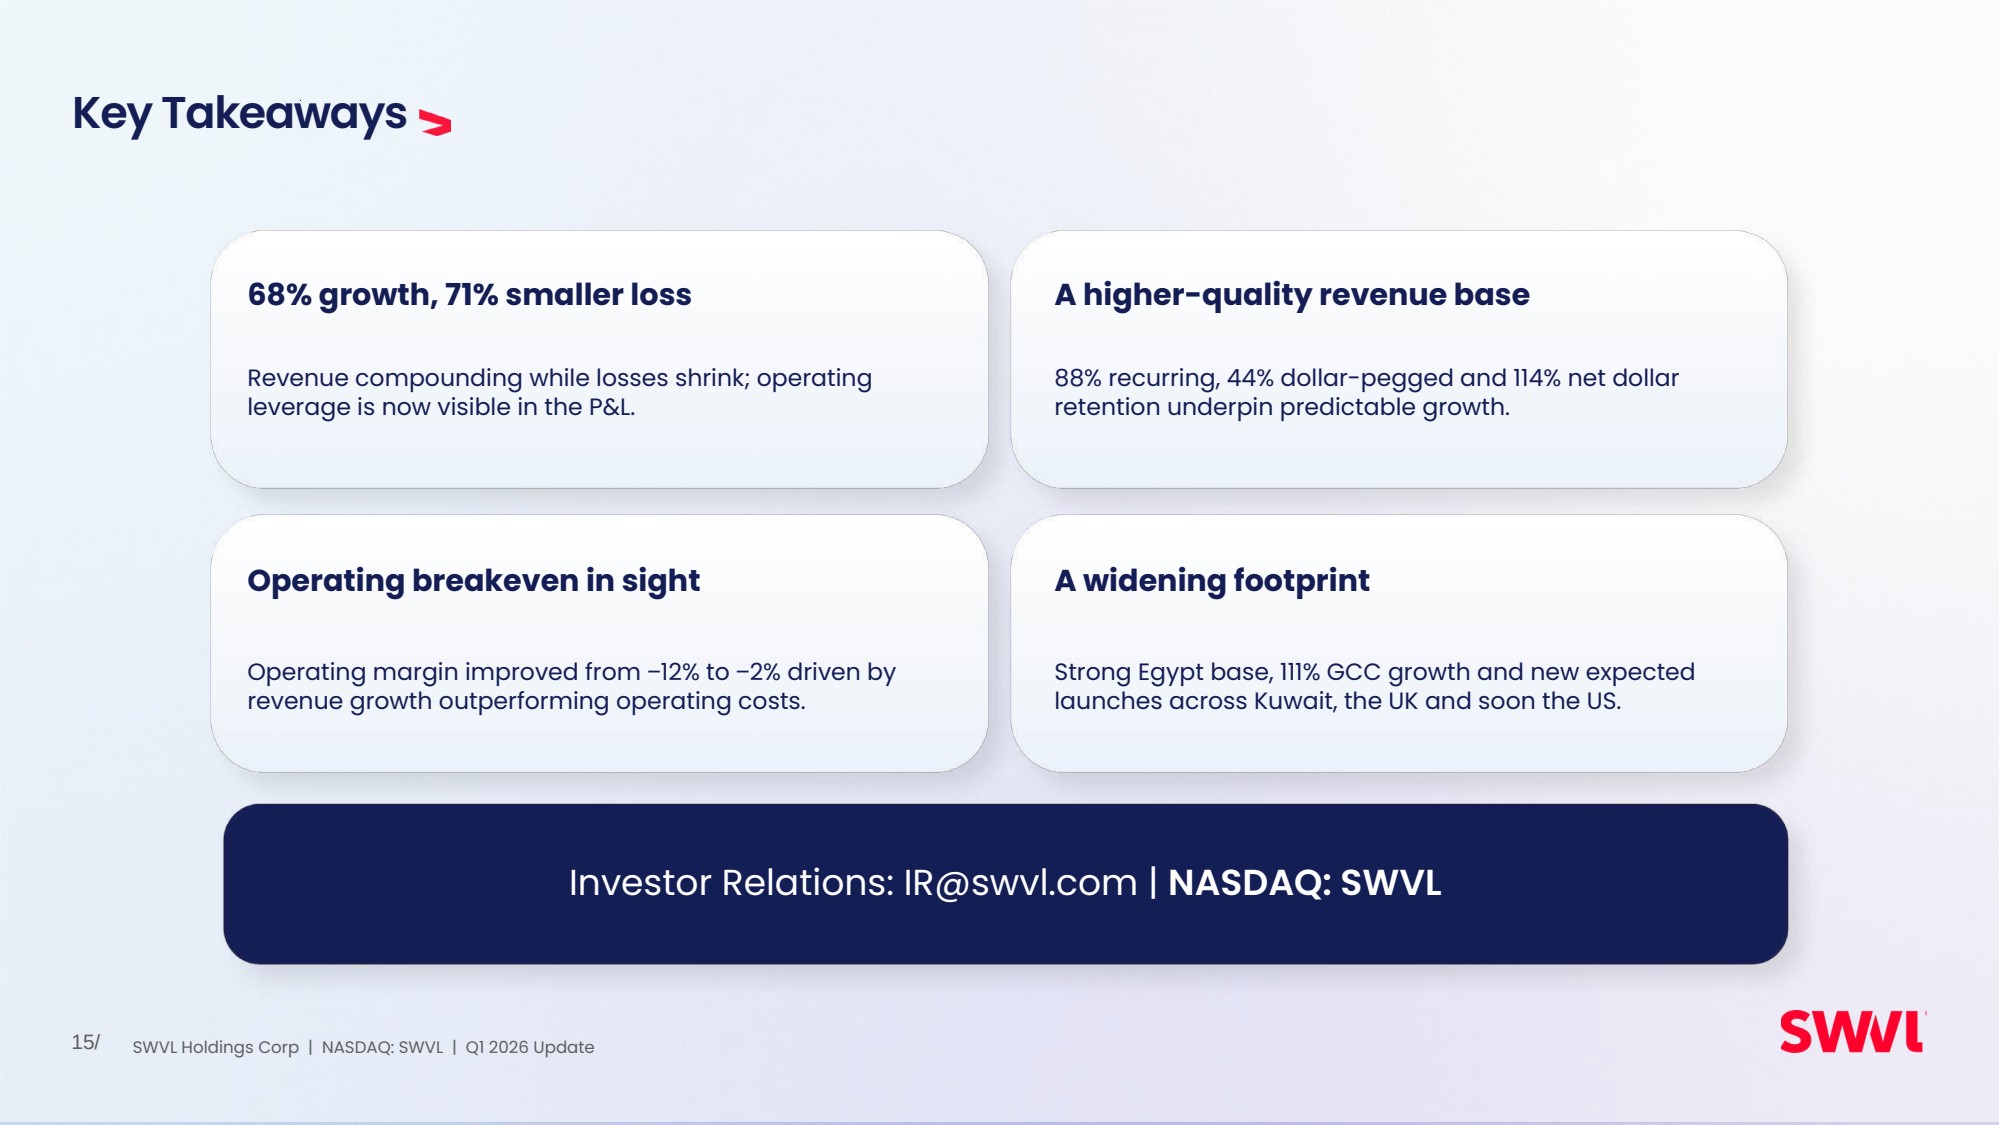
| 15/ Key Takeaways 68% growth, 71% smaller loss Revenue compounding while losses shrink; operating leverage is now visible in the P&L. A higher-quality revenue base 88% recurring, 44% dollar-pegged and 114% net dollar retention underpin predictable growth. Operating breakeven in sight Operating margin improved from ‒12% to ‒2% driven by revenue growth outperforming operating costs. A widening footprint Strong Egypt base, 111% GCC growth and new expected launches across Kuwait, the UK and soon the US. Investor Relations: IR@swvl.com | NASDAQ: SWVL SWVL Holdings Corp | NASDAQ: SWVL | Q1 2026 Update |
|