Pay vs Performance Disclosure - USD ($)
Mar. 28, 2026
Mar. 29, 2025
Mar. 30, 2024
Apr. 01, 2023
Apr. 02, 2022
Pay Versus Performance Table
Summary Compensation Table Total for PEO ($) (b)(1) | Compensation Actually Paid to PEO ($) (c)(2) | Average Summary Compensation Table Total for Non-PEO NEOs ($) (d)(1) | Average Compensation Actually Paid to Non-PEO NEOs ($) (e)(3) | Value of Initial Fixed $100 Investment Based On: | Net (Loss) Income ($) (h)(6) | Free Cash Flow ($) (i)(7) | ||||||||||||||||||||
| Year (a) | Total Shareholder Return ($) (f)(4) | Peer Group Total Shareholder Return ($) (g)(5) | ||||||||||||||||||||||||
| 2026 | 11,909,990 | 10,414,084 | 1,860,083 | 1,680,119 | 34.42 | 41.09 | 79,000,000 | 134,000,000 | ||||||||||||||||||
| 2025 | 9,058,699 | (3,108,694) | 3,367,051 | 490,172 | 40.50 | 39.40 | (1,182,000,000) | 153,000,000 | ||||||||||||||||||
| 2024 | 10,536,629 | 9,772,501 | 3,787,766 | 3,469,234 | 90.30 | 42.80 | (229,000,000) | 120,000,000 | ||||||||||||||||||
| 2023 | 14,331,813 | 10,961,037 | 2,537,098 | 2,219,512 | 93.70 | 51.60 | 616,000,000 | 715,000,000 | ||||||||||||||||||
| 2022 | 14,737,831 | 15,510,572 | 5,781,103 | 5,579,572 | 101.60 | 76.40 | 822,000,000 | 573,000,000 | ||||||||||||||||||
2026: Mr. Edwards (our former Chief Financial Officer and Chief Operating Officer who served for approximately three months in Fiscal
2026), Mr. Mehta, Ms. Hendricks and Ms. McDonough
2025: Mr. Edwards, Ms. Hendricks, Ms. McDonough and Mr. Wilmotte
2024: Mr. Edwards, Ms. Hendricks, Ms. McDonough and Mr. Wilmotte
2023: Mr. Edwards, Ms. Hendricks, Ms. McDonough and Daniel Purefoy, our former SVP, Global Operations and Head of Diversity and
Inclusion (who served for four months of Fiscal 2023)
2022: Mr. Edwards, Ms. Hendricks, Ms. McDonough, Mr. Purefoy and Joshua Schulman, our former Chief Executive Officer of Michael Kors (who served for approximately seven months of Fiscal 2022)
| 2026 ($) | |||||
| Summary Compensation Table Total for PEO | 11,909,990 | ||||
Minus Changes in Accumulated Benefits Under Defined Benefit and Actuarial Pension Plans(a) | — | ||||
Minus Grant Date Fair Value of Stock Options and Stock Awards Granted in a Fiscal Year(b) | 4,999,994 | ||||
Plus Fair Value at Fiscal Year-End of Outstanding Unvested Stock Options and Stock Awards Granted in Prior Fiscal Year(c) | 4,735,296 | ||||
Plus / (Minus) Change in Fair Value of Outstanding and Unvested Stock Options and Stock Awards Granted in Prior Fiscal Year(c) | (990,931) | ||||
Plus / (Minus) Change in Fair Value of Vesting Date of Stock Option and Stock Awards Granted in Years Prior for which Applicable Vesting Conditions Were Satisfied During Fiscal Year(c) | (240,277) | ||||
Minus Fair Value as of Prior Fiscal Year End of Stock Option and Stock Awards Granted in Prior Fiscal Years that Failed to Meet Applicable Vesting Conditions During Fiscal Year(c) | — | ||||
| Compensation Actually Paid to PEO | 10,414,084 | ||||
| 2026 ($) | |||||
| Average Summary Compensation Table Total for Non-PEO NEOs | 1,860,083 | ||||
Minus Changes in Accumulated Benefits Under Defined Benefit and Actuarial Pension Plans(a) | — | ||||
Minus Grant Date Fair Value of Stock Options and Stock Awards Granted in a Fiscal Year(b) | 781,251 | ||||
Plus Fair Value at Fiscal Year-End of Outstanding Unvested Stock Options and Stock Awards Granted in Prior Fiscal Year(c) | 775,414 | ||||
Plus / (Minus) Change in Fair Value of Outstanding and Unvested Stock Options and Stock Awards Granted in Prior Fiscal Year(c) | (108,897) | ||||
Plus / (Minus) Change in Fair Value of Vesting Date of Stock Option and Stock Awards Granted in Years Prior for which Applicable Vesting Conditions Were Satisfied During Fiscal Year(c) | (65,230) | ||||
Minus Fair Value as of Prior Fiscal Year End of Stock Option and Stock Awards Granted in Prior Fiscal Years that Failed to Meet Applicable Vesting Conditions During Fiscal Year(c) | — | ||||
| Average Compensation Actually Paid to Non-PEO NEOs | 1,680,119 | ||||
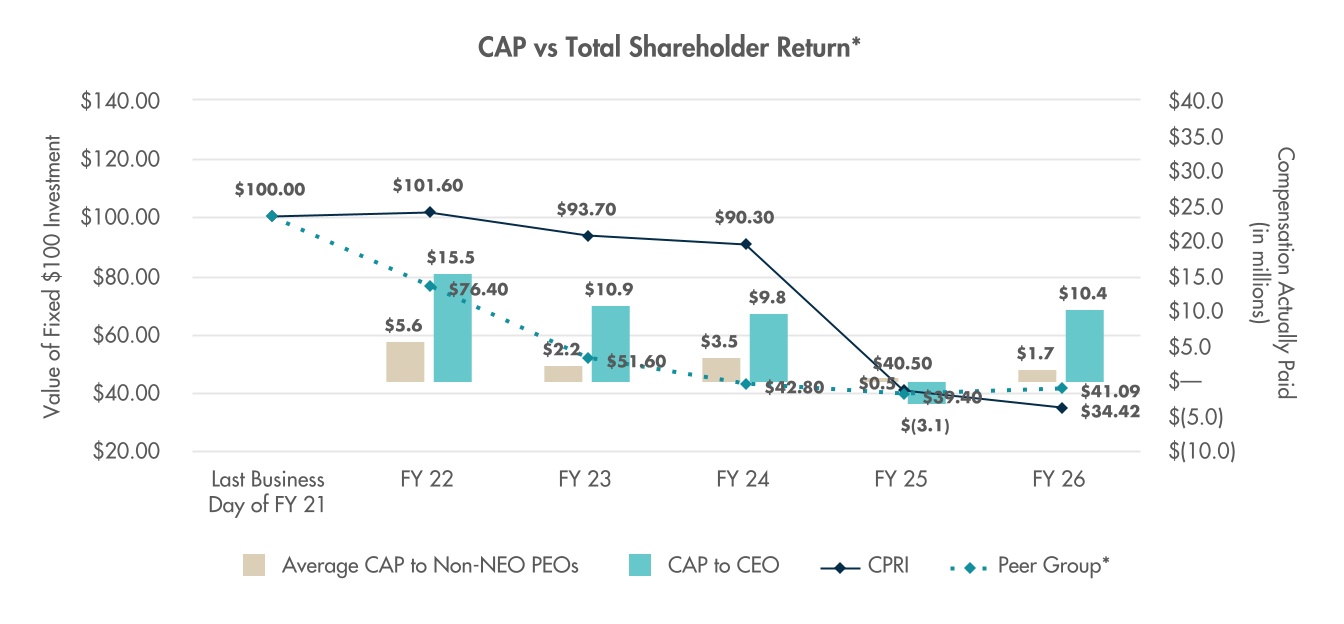
*TSR is calculated assuming that a $100 investment was made on the last business day prior to the first fiscal year reported in the graph and that all dividends are reinvested until the last day of each reported fiscal year. On the last business day of fiscal 2021, which was March 27, 2021, our share price was $50.18 compared to $17.27 on the last business day of Fiscal 2026. The peer group used is the S&P 500 Apparel, Accessories & Luxury Goods Index, as used in the Company’s Share Performance Graph in our Annual Report on Form 10-K for Fiscal 2026.
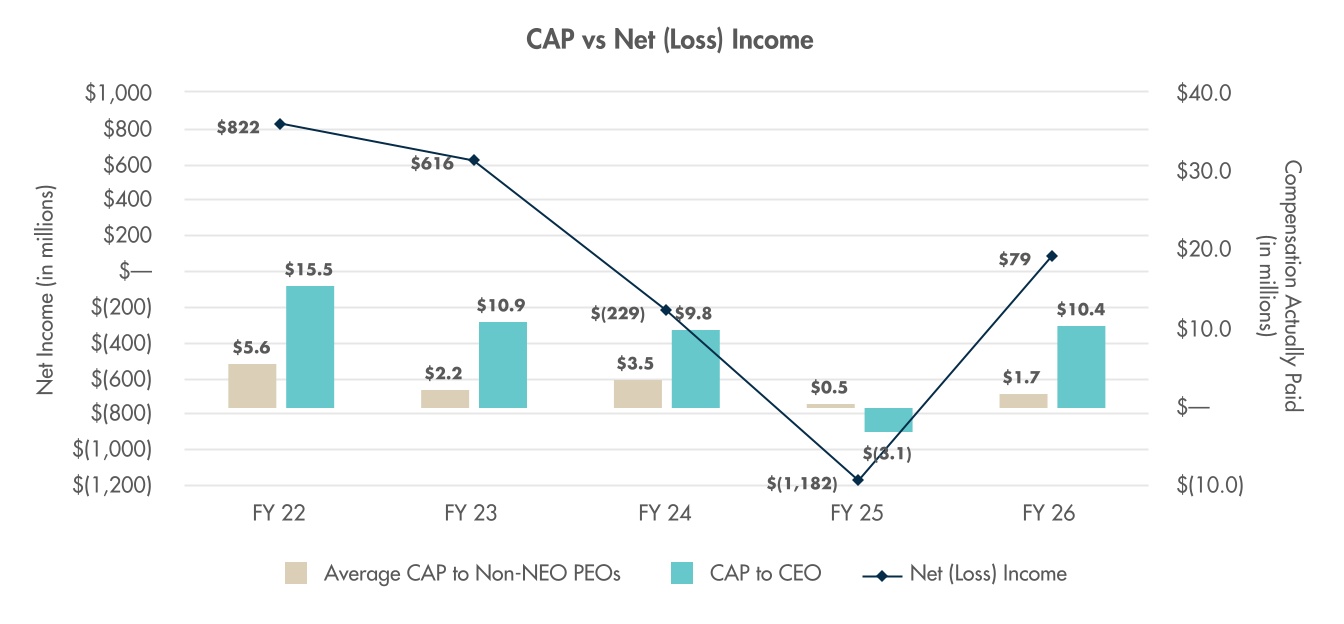
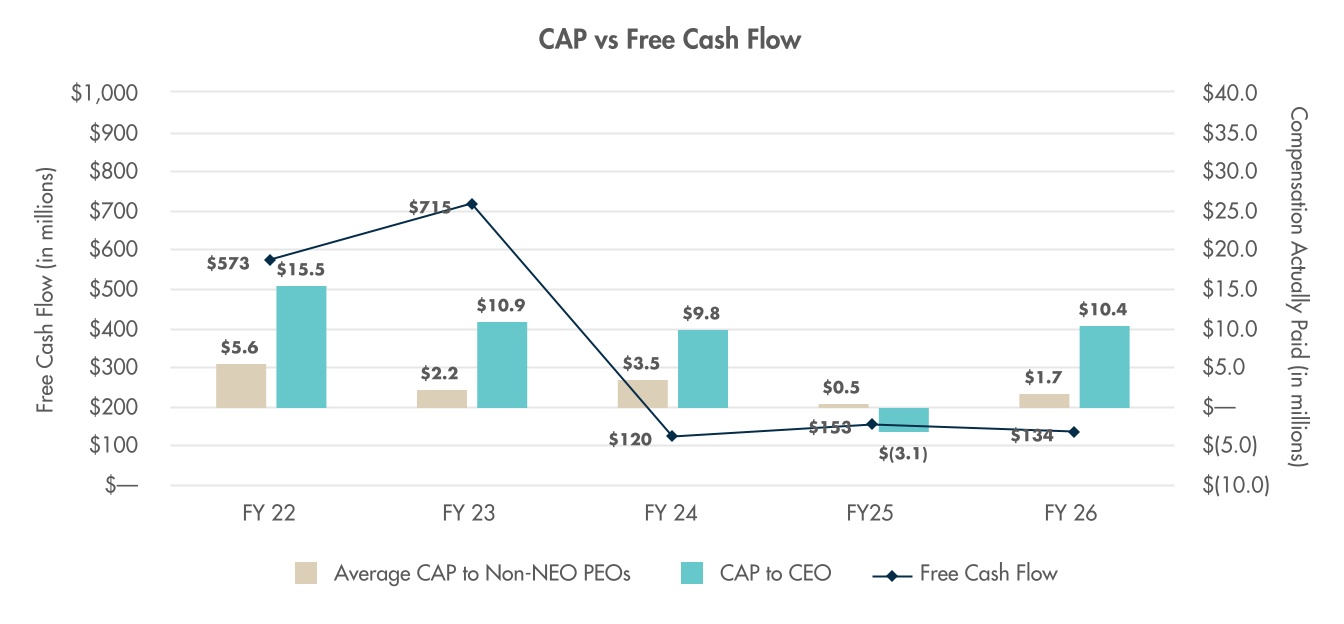
*TSR is calculated assuming that a $100 investment was made on the last business day prior to the first fiscal year reported in the graph and that all dividends are reinvested until the last day of each reported fiscal year. On the last business day of fiscal 2021, which was March 27, 2021, our share price was $50.18 compared to $17.27 on the last business day of Fiscal 2026. The peer group used is the S&P 500 Apparel, Accessories & Luxury Goods Index, as used in the Company’s Share Performance Graph in our Annual Report on Form 10-K for Fiscal 2026.
Free Cash Flow | ||||||||||||||
SG&A Expense | ||||||||||||||
We have not reported any amounts in our SCT with respect to “Change in Pension and Nonqualified Deferred Compensation.” Accordingly, the adjustments with respect to such items prescribed by the pay versus performance rules are not relevant to our analysis and no adjustments have been made.
The amounts reflect the aggregate grant date fair value reported in the “Share Awards” and “Option Awards” columns in the SCT for the applicable fiscal year.
In accordance with Item 402(v) requirements, the fair values of unvested and outstanding equity awards to our PEO were remeasured at the end of each fiscal year, and as of the vesting date, during the years displayed in the table above. We approached the determination of fair value in the same way as we historically have determined fair value and fair values as of each measurement date using valuation assumptions and methodologies (including expected term, volatility, dividend yield, and risk-free interest rates) that are generally consistent with those used to estimate fair value at grant under U.S. GAAP. See Note 18 (Share-Based Compensation) to our audited financial statements included in our Annual Report on Form 10-K for Fiscal 2026.
We have not reported any amounts in our SCT with respect to “Change in Pension and Nonqualified Deferred Compensation.” Accordingly, the adjustments with respect to such items prescribed by the pay versus performance rules are not relevant to our analysis and no adjustments have been made.
The amounts reflect the aggregate grant date fair value reported in the “Share Awards” and “Option Awards” columns in the SCT for the applicable fiscal year.
In accordance with Item 402(v) requirements, the fair values of unvested and outstanding equity awards to our Non-PEO NEOs were remeasured at the end of each fiscal year, and as of the vesting date, during the years displayed in the table above. We approached the determination of fair value in the same way as we historically have determined fair value and fair values as of each measurement date using valuation assumptions and methodologies (including expected term, volatility, dividend yield, and risk-free interest rates) that are generally consistent with those used to estimate fair value at grant under U.S. GAAP. See Note 18 (Share-Based Compensation) to our audited financial statements included in our Annual Report on Form 10-K for Fiscal 2026.
TSR is calculated assuming that a $100 investment was made on the day prior to the first fiscal year reported in the table above and that all dividends are reinvested until the last day of each reported fiscal year. On the last business day of fiscal 2021, which was March 27, 2021, our share price was $50.18 compared to $17.27 on the last business day of Fiscal 2026. The dollar amounts reported are the Company’s net (loss) income reflected in the Company’s audited financial statements for the applicable year.