Pay vs Performance Disclosure - USD ($)
Mar. 31, 2022
Mar. 31, 2026
Mar. 31, 2025
Mar. 31, 2024
Mar. 31, 2023
Dec. 31, 2021
Pay vs. Performance
In accordance with Item 402(v) of Regulation S-K, we are providing the following information about the relationship between the compensation actually paid (“CAP”) to our NEOs (calculated as provided in Item 402(v) of Regulation S-K) and company performance based on certain financial performance measures selected by the SEC and the Company. For further information concerning the CHC Committee’s compensation philosophy, including the pay for performance pillar of that philosophy and how the CHC Committee aligns executive compensation with the Company’s performance, see “Executive Compensation — Compensation Discussion and Analysis.”
Value of initial fixed $100 investment based on: | ||||||||||||||||||||||||||
Year(1) | Summary compensation table total for PEO ($) | Compensation actually paid to PEO ($)(2) | Average summary compensation table total for non-PEO named executive officers ($) | Average compensation actually paid to non-PEO named executive officers ($)(2)(4) | Total shareholder return ($)(3) | Peer group total shareholder return ($)(4) | Net Income ($ mil.)(5) | Adjusted EBITDA ($ mil.)(6) | ||||||||||||||||||
(a) | (b) | (c) | (d) | (e) | (f) | (g) | (h) | (i) | ||||||||||||||||||
2026 | 21,766,355 | (16,095,806) | 6,500,866 | (2,860,379) | 50 | 150 | 185 | 2,672 | ||||||||||||||||||
2025 | 15,803,726 | 45,831,860 | 5,798,170 | 15,831,031 | 119 | 102 | 252 | 2,559 | ||||||||||||||||||
2024 | 15,661,281 | 31,636,300 | 6,119,176 | 11,069,154 | 82 | 116 | (340) | 2,361 | ||||||||||||||||||
2023 | 13,655,346 | 19,183,372 | 5,348,618 | 6,928,885 | 56 | 87 | (1,374) | 2,202 | ||||||||||||||||||
Trans | 774,244 | (6,991,872) | 445,052 | (2,150,363) | 50 | 89 | (229) | 536 | ||||||||||||||||||
2021 | 26,377,162 | 23,074,107 | 10,881,003 | 8,995,352 | 69 | 96 | (2,304) | 2,049 | ||||||||||||||||||
(1) | In January 2022, the Company changed its fiscal year-end to March 31 from December 31. Fiscal 2024 and fiscal 2023 reflect the years ended March 31, 2024 and 2023; the transition period (“Trans”) reflects the three months from January 1, 2022 through March 31, 2022; and fiscal 2021 reflects the year ended December 31, 2021. |
(2) | To calculate the CAP to Martin Schroeter, our PEO, and the average CAP to our non-PEO NEOs during fiscal 2026 (Harsh Chugh, Elly Keinan, Maryjo Charbonnier, Mark Ringes, David Wyshner, Edward Sebold and Vineet Khurana), the following amounts were deducted from and added to Summary Compensation Table (“SCT”) total compensation: |
SCT Total ($)(a) | Deductions: Stock Award and Option Award ($)(b) | Additions: Value of Stock and Option Awards calculated in accordance with SEC methodology for determining CAP ($)(c) | CAP ($) | |||||||||||
PEO | 21,766,355 | 18,000,025 | (19,862,136) | (16,095,806) | ||||||||||
Non-PEO NEOs | 6,500,866 | 4,631,481 | (4,729,764) | (2,860,379) |
(a) | Reflects the total dollar amount reported in the SCT for the PEO and the average dollar amount reported in the SCT for the non-PEO NEOs. |
(b) | Pursuant to Item 402(v)(2)(iii)(C)(1), this deduction reflects the subtraction of the grant date fair values of equity awards granted in the fiscal year, as reported in the SCT. The following amounts reflect the total dollar amount reported in the “Stock Awards” column in the SCT for the PEO and the average dollar amount reported in the SCT for the non-PEO NEOs: |
Stock Awards ($) | Option Awards ($) | Total Deductions ($) | |||||||||
PEO | 18,000,025 | — | 18,000,025 | ||||||||
Non-PEO NEOs | 4,631,481 | — | 4,631,481 |
(c) | Pursuant to Item 402(v)(2)(iii)(C), the equity award adjustments include the addition (or subtraction, as applicable) of the following: (i) the fiscal 2026 year-end fair value of any equity awards granted during the fiscal year that are outstanding and unvested as of the end of the fiscal year; (ii) the amount of change as of the end of fiscal 2026 (from |
the end of the prior fiscal year) in fair value of any awards granted in prior fiscal years or periods that are outstanding and unvested as of the end of fiscal 2026; (iii) for awards that are granted and vest in same applicable fiscal year, if any, the fair value as of the vesting date; (iv) for awards granted in prior fiscal years or periods that vested during fiscal 2026, the amount equal to the change as of the vesting date (from the end of the prior fiscal year) in fair value; (v) for awards granted in prior fiscal years that are determined to fail to meet the applicable vesting conditions during fiscal 2026, if any, a deduction for the amount equal to the fair value at the end of the prior fiscal year; and (vi) the dollar value of any dividends or other earnings paid on stock or option awards in fiscal 2026 prior to the vesting date that are not otherwise reflected in the fair value of such award or included in any other component of total compensation for the applicable fiscal year or period. The valuation assumptions used to calculate fair values did not materially differ from those disclosed at the time of grant. The amounts deducted or added in calculating the equity award adjustments are as follows:
Fair Value of Current Year Equity Awards at Fiscal 2026 Year End ($) | Change in Value of Prior Years’ Awards Unvested at Fiscal 2026 Year End ($) | Vesting Date Fair Value of Current Year Equity Awards ($) | Change in Fair Value of Prior Years’ Awards that Vested during Fiscal 2026 ($) | Prior Year- End Fair Value of Prior Year Awards that Failed to Vest During Fiscal 2026 ($) | Dollar Value of Dividends Paid During Fiscal 2026 ($) | Equity Value Included in CAP ($) | |||||||||||||||||
(i) | (ii) | (iii) | (iv) | (v) | (vi) | Value = (i) + (ii) + (iii) + (iv) - (v) + (vi) | |||||||||||||||||
PEO | 4,285,752 | (27,663,997) | — | 3,516,109 | — | — | (19,862,136) | ||||||||||||||||
Non-PEO NEOs | 1,172,098 | (4,442,082) | — | 791,129 | (2,250,909) | — | (4,729,764) |
(3) | Cumulative TSR is calculated by dividing the sum of the cumulative amount of dividends (if any) for the measurement period, assuming dividend reinvestment, and the difference between the Company’s share price at the end and the beginning of the measurement period by the Company’s share price at the beginning of the measurement period. The beginning of the measurement period is November 4, 2021, the date our stock commenced regular-way trading on the NYSE. |
(4) | Represents the weighted peer group TSR, weighted according to the respective companies’ stock market capitalization at the beginning of each period for which a return is indicated. The peer group used for this purpose is the following published industry index: the S&P 400 IT Sector GICS Level 1 Index, which we also utilize in the stock performance graph required by Item 201(e) of Regulation S-K, included in our Fiscal 2026 Form 10-K. |
(5) | The dollar amounts reported represent the amount of net income (loss) reflected in the Company’s audited financial statements for the applicable fiscal year or period. |
(6) | Adjusted EBITDA is defined in “Executive Compensation — Compensation Discussion and Analysis — Elements of Compensation and Compensation Decisions — Annual Cash Bonus.” |
(2) | To calculate the CAP to Martin Schroeter, our PEO, and the average CAP to our non-PEO NEOs during fiscal 2026 (Harsh Chugh, Elly Keinan, Maryjo Charbonnier, Mark Ringes, David Wyshner, Edward Sebold and Vineet Khurana), the following amounts were deducted from and added to Summary Compensation Table (“SCT”) total compensation: |
(4) | Represents the weighted peer group TSR, weighted according to the respective companies’ stock market capitalization at the beginning of each period for which a return is indicated. The peer group used for this purpose is the following published industry index: the S&P 400 IT Sector GICS Level 1 Index, which we also utilize in the stock performance graph required by Item 201(e) of Regulation S-K, included in our Fiscal 2026 Form 10-K. |
(2) | To calculate the CAP to Martin Schroeter, our PEO, and the average CAP to our non-PEO NEOs during fiscal 2026 (Harsh Chugh, Elly Keinan, Maryjo Charbonnier, Mark Ringes, David Wyshner, Edward Sebold and Vineet Khurana), the following amounts were deducted from and added to Summary Compensation Table (“SCT”) total compensation: |
SCT Total ($)(a) | Deductions: Stock Award and Option Award ($)(b) | Additions: Value of Stock and Option Awards calculated in accordance with SEC methodology for determining CAP ($)(c) | CAP ($) | |||||||||||
PEO | 21,766,355 | 18,000,025 | (19,862,136) | (16,095,806) | ||||||||||
Non-PEO NEOs | 6,500,866 | 4,631,481 | (4,729,764) | (2,860,379) |
(a) | Reflects the total dollar amount reported in the SCT for the PEO and the average dollar amount reported in the SCT for the non-PEO NEOs. |
(b) | Pursuant to Item 402(v)(2)(iii)(C)(1), this deduction reflects the subtraction of the grant date fair values of equity awards granted in the fiscal year, as reported in the SCT. The following amounts reflect the total dollar amount reported in the “Stock Awards” column in the SCT for the PEO and the average dollar amount reported in the SCT for the non-PEO NEOs: |
Stock Awards ($) | Option Awards ($) | Total Deductions ($) | |||||||||
PEO | 18,000,025 | — | 18,000,025 | ||||||||
Non-PEO NEOs | 4,631,481 | — | 4,631,481 |
(c) | Pursuant to Item 402(v)(2)(iii)(C), the equity award adjustments include the addition (or subtraction, as applicable) of the following: (i) the fiscal 2026 year-end fair value of any equity awards granted during the fiscal year that are outstanding and unvested as of the end of the fiscal year; (ii) the amount of change as of the end of fiscal 2026 (from |
the end of the prior fiscal year) in fair value of any awards granted in prior fiscal years or periods that are outstanding and unvested as of the end of fiscal 2026; (iii) for awards that are granted and vest in same applicable fiscal year, if any, the fair value as of the vesting date; (iv) for awards granted in prior fiscal years or periods that vested during fiscal 2026, the amount equal to the change as of the vesting date (from the end of the prior fiscal year) in fair value; (v) for awards granted in prior fiscal years that are determined to fail to meet the applicable vesting conditions during fiscal 2026, if any, a deduction for the amount equal to the fair value at the end of the prior fiscal year; and (vi) the dollar value of any dividends or other earnings paid on stock or option awards in fiscal 2026 prior to the vesting date that are not otherwise reflected in the fair value of such award or included in any other component of total compensation for the applicable fiscal year or period. The valuation assumptions used to calculate fair values did not materially differ from those disclosed at the time of grant. The amounts deducted or added in calculating the equity award adjustments are as follows:
Fair Value of Current Year Equity Awards at Fiscal 2026 Year End ($) | Change in Value of Prior Years’ Awards Unvested at Fiscal 2026 Year End ($) | Vesting Date Fair Value of Current Year Equity Awards ($) | Change in Fair Value of Prior Years’ Awards that Vested during Fiscal 2026 ($) | Prior Year- End Fair Value of Prior Year Awards that Failed to Vest During Fiscal 2026 ($) | Dollar Value of Dividends Paid During Fiscal 2026 ($) | Equity Value Included in CAP ($) | |||||||||||||||||
(i) | (ii) | (iii) | (iv) | (v) | (vi) | Value = (i) + (ii) + (iii) + (iv) - (v) + (vi) | |||||||||||||||||
PEO | 4,285,752 | (27,663,997) | — | 3,516,109 | — | — | (19,862,136) | ||||||||||||||||
Non-PEO NEOs | 1,172,098 | (4,442,082) | — | 791,129 | (2,250,909) | — | (4,729,764) |
(2) | To calculate the CAP to Martin Schroeter, our PEO, and the average CAP to our non-PEO NEOs during fiscal 2026 (Harsh Chugh, Elly Keinan, Maryjo Charbonnier, Mark Ringes, David Wyshner, Edward Sebold and Vineet Khurana), the following amounts were deducted from and added to Summary Compensation Table (“SCT”) total compensation: |
SCT Total ($)(a) | Deductions: Stock Award and Option Award ($)(b) | Additions: Value of Stock and Option Awards calculated in accordance with SEC methodology for determining CAP ($)(c) | CAP ($) | |||||||||||
PEO | 21,766,355 | 18,000,025 | (19,862,136) | (16,095,806) | ||||||||||
Non-PEO NEOs | 6,500,866 | 4,631,481 | (4,729,764) | (2,860,379) |
(a) | Reflects the total dollar amount reported in the SCT for the PEO and the average dollar amount reported in the SCT for the non-PEO NEOs. |
(b) | Pursuant to Item 402(v)(2)(iii)(C)(1), this deduction reflects the subtraction of the grant date fair values of equity awards granted in the fiscal year, as reported in the SCT. The following amounts reflect the total dollar amount reported in the “Stock Awards” column in the SCT for the PEO and the average dollar amount reported in the SCT for the non-PEO NEOs: |
Stock Awards ($) | Option Awards ($) | Total Deductions ($) | |||||||||
PEO | 18,000,025 | — | 18,000,025 | ||||||||
Non-PEO NEOs | 4,631,481 | — | 4,631,481 |
(c) | Pursuant to Item 402(v)(2)(iii)(C), the equity award adjustments include the addition (or subtraction, as applicable) of the following: (i) the fiscal 2026 year-end fair value of any equity awards granted during the fiscal year that are outstanding and unvested as of the end of the fiscal year; (ii) the amount of change as of the end of fiscal 2026 (from |
the end of the prior fiscal year) in fair value of any awards granted in prior fiscal years or periods that are outstanding and unvested as of the end of fiscal 2026; (iii) for awards that are granted and vest in same applicable fiscal year, if any, the fair value as of the vesting date; (iv) for awards granted in prior fiscal years or periods that vested during fiscal 2026, the amount equal to the change as of the vesting date (from the end of the prior fiscal year) in fair value; (v) for awards granted in prior fiscal years that are determined to fail to meet the applicable vesting conditions during fiscal 2026, if any, a deduction for the amount equal to the fair value at the end of the prior fiscal year; and (vi) the dollar value of any dividends or other earnings paid on stock or option awards in fiscal 2026 prior to the vesting date that are not otherwise reflected in the fair value of such award or included in any other component of total compensation for the applicable fiscal year or period. The valuation assumptions used to calculate fair values did not materially differ from those disclosed at the time of grant. The amounts deducted or added in calculating the equity award adjustments are as follows:
Fair Value of Current Year Equity Awards at Fiscal 2026 Year End ($) | Change in Value of Prior Years’ Awards Unvested at Fiscal 2026 Year End ($) | Vesting Date Fair Value of Current Year Equity Awards ($) | Change in Fair Value of Prior Years’ Awards that Vested during Fiscal 2026 ($) | Prior Year- End Fair Value of Prior Year Awards that Failed to Vest During Fiscal 2026 ($) | Dollar Value of Dividends Paid During Fiscal 2026 ($) | Equity Value Included in CAP ($) | |||||||||||||||||
(i) | (ii) | (iii) | (iv) | (v) | (vi) | Value = (i) + (ii) + (iii) + (iv) - (v) + (vi) | |||||||||||||||||
PEO | 4,285,752 | (27,663,997) | — | 3,516,109 | — | — | (19,862,136) | ||||||||||||||||
Non-PEO NEOs | 1,172,098 | (4,442,082) | — | 791,129 | (2,250,909) | — | (4,729,764) |
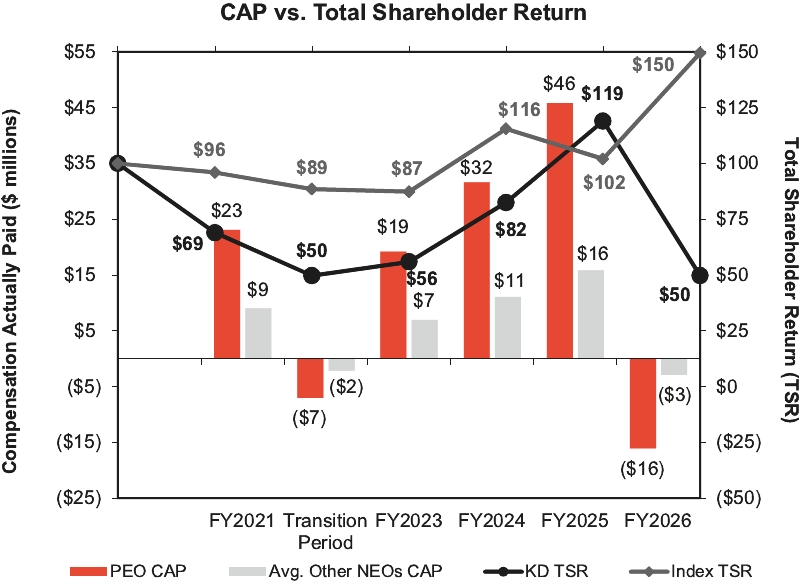
CAP and Cumulative TSR
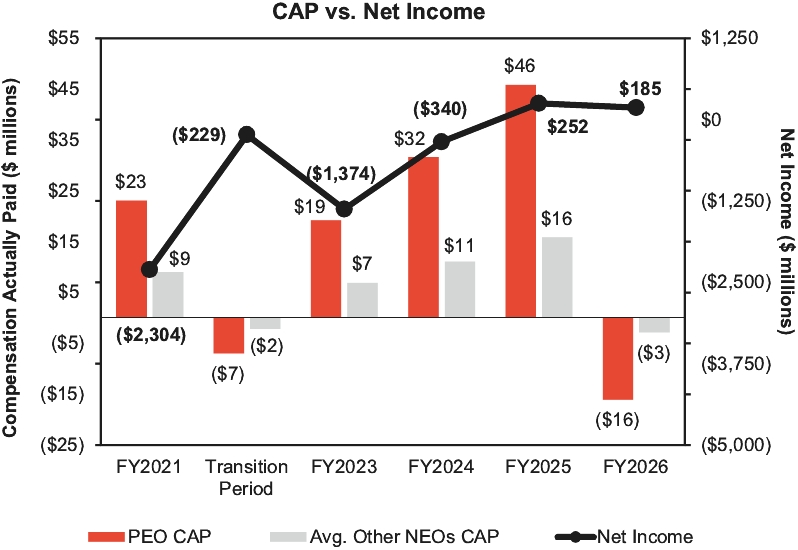
CAP and Net Income
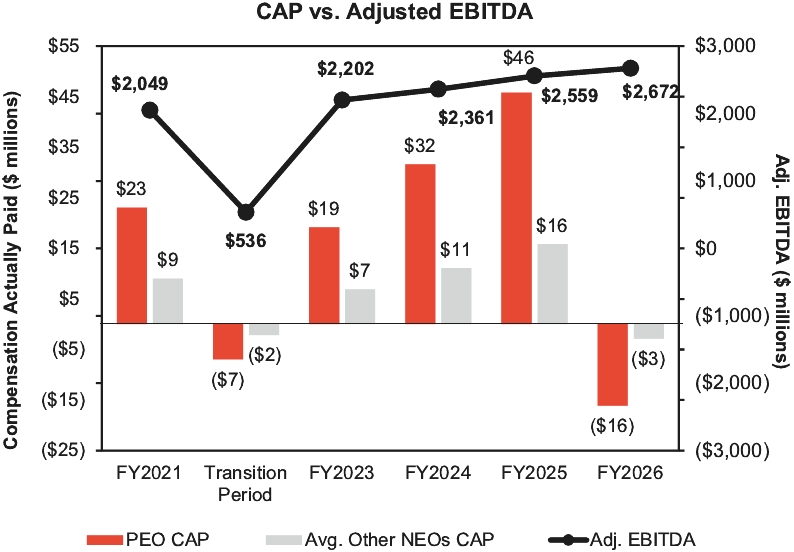
CAP and Adjusted EBITDA
CAP and Cumulative TSR
Financial Performance Measures
As described in greater detail in “Executive Compensation — Compensation Discussion and Analysis,” the Company’s executive compensation program is designed to be consistent with our compensation philosophy to pay for performance, align our executives’ interests with those of our stockholders and pay competitively. Most of the executive compensation opportunities for our NEOs are performance-based and are tied to the Company’s business results and individual performance. The metrics that the Company uses for both our long-term and short-term incentive awards are selected based on the goals of balancing risk while rewarding our NEOs for delivering financial, operating and strategic performance that aligns the Company’s business strategy and stockholder interests. The most important financial performance measures used by the Company to link CAP to the Company’s NEOs, for fiscal 2026, to the Company’s performance are as follows:
• | Adjusted EBITDA (as defined in “Executive Compensation — Compensation Discussion and Analysis — Elements of Compensation and Compensation Decisions — Annual Cash Bonus”) |
• | Revenue |
• | Adjusted Operating Cash Flow (as defined in “Executive Compensation — Compensation Discussion and Analysis — Elements of Compensation and Compensation Decisions — Long-Term Equity Incentives”) |
• | Total Signings (as defined in “Executive Compensation — Compensation Discussion and Analysis — Elements of Compensation and Compensation Decisions — Long-Term Equity Incentives”) |
• | Relative TSR (the Company’s TSR as compared to the companies in the S&P 400 Mid Cap Index, as described further in “Executive Compensation — Compensation Discussion and Analysis — Elements of Compensation and Compensation Decisions — Long-Term Equity Incentives”) |
Due to our change in fiscal year-end, the Pay vs. Performance Table and preceding charts include a three-month transition period from January 1, 2022 through March 31, 2022. CAP and Company performance during the transition period is not comparable to Fiscal 2021 or Fiscal 2023 through 2026 because it represents a shorter time period.
The change in PEO and non-PEO CAP in each period reflected in the preceding charts is directionally correlated to our TSR and stock price because a significant majority of NEO compensation is granted in the form of equity compensation.
(c) | Pursuant to Item 402(v)(2)(iii)(C), the equity award adjustments include the addition (or subtraction, as applicable) of the following: (i) the fiscal 2026 year-end fair value of any equity awards granted during the fiscal year that are outstanding and unvested as of the end of the fiscal year; (ii) the amount of change as of the end of fiscal 2026 (from |
the end of the prior fiscal year) in fair value of any awards granted in prior fiscal years or periods that are outstanding and unvested as of the end of fiscal 2026; (iii) for awards that are granted and vest in same applicable fiscal year, if any, the fair value as of the vesting date; (iv) for awards granted in prior fiscal years or periods that vested during fiscal 2026, the amount equal to the change as of the vesting date (from the end of the prior fiscal year) in fair value; (v) for awards granted in prior fiscal years that are determined to fail to meet the applicable vesting conditions during fiscal 2026, if any, a deduction for the amount equal to the fair value at the end of the prior fiscal year; and (vi) the dollar value of any dividends or other earnings paid on stock or option awards in fiscal 2026 prior to the vesting date that are not otherwise reflected in the fair value of such award or included in any other component of total compensation for the applicable fiscal year or period. The valuation assumptions used to calculate fair values did not materially differ from those disclosed at the time of grant. The amounts deducted or added in calculating the equity award adjustments are as follows:
Fair Value of Current Year Equity Awards at Fiscal 2026 Year End ($) | Change in Value of Prior Years’ Awards Unvested at Fiscal 2026 Year End ($) | Vesting Date Fair Value of Current Year Equity Awards ($) | Change in Fair Value of Prior Years’ Awards that Vested during Fiscal 2026 ($) | Prior Year- End Fair Value of Prior Year Awards that Failed to Vest During Fiscal 2026 ($) | Dollar Value of Dividends Paid During Fiscal 2026 ($) | Equity Value Included in CAP ($) | |||||||||||||||||
(i) | (ii) | (iii) | (iv) | (v) | (vi) | Value = (i) + (ii) + (iii) + (iv) - (v) + (vi) | |||||||||||||||||
PEO | 4,285,752 | (27,663,997) | — | 3,516,109 | — | — | (19,862,136) | ||||||||||||||||
Non-PEO NEOs | 1,172,098 | (4,442,082) | — | 791,129 | (2,250,909) | — | (4,729,764) |
(6) | Adjusted EBITDA is defined in “Executive Compensation — Compensation Discussion and Analysis — Elements of Compensation and Compensation Decisions — Annual Cash Bonus.” |